Article

Association between Air Pollutants and Cardiovascular Disease Mortality in Wuhan, China

1
School of Public Health, Wuhan University, Wuhan 430071, Hubei Province, China
2
Global Health Institute, Wuhan University, Wuhan 430071, Hubei Province, China
3
Hubei Provincial Center for Disease Control and Prevention, Wuhan 430079, Hubei Province, China
4
State Key Laboratory of Information Engineering in Surveying, Mapping and Remote Sensing, Wuhan University, Wuhan 430079, China
5
Environmental Health Laboratory, Department of Public Health Sciences, Univ Hawaii at Manoa, 1960 East West Rd., Biomed Bldg., D105, Honolulu, HI 96822, USA
6
School of Stomatology, Wuhan University, Wuhan 430071, Hubei Province, China
7
Department of Epidemiology and Biostatistics, Guangdong Key Lab of Molecular Epidemiology, School of Public Health, Guangdong Pharmaceutical University, Guangzhou 510310, China
*
Author to whom correspondence should be addressed.
These authors contributed equally to this work.
Int. J. Environ. Res. Public Health 2015, 12(4), 3506-3516; https://doi.org/10.3390/ijerph120403506
Submission received: 3 February 2015 / Revised: 11 March 2015 / Accepted: 18 March 2015 / Published: 25 March 2015

Abstract

:
We examined the associations of daily mean concentrations of ambient air pollutants (particulate matter (PM10), sulfur dioxide (SO2), nitric oxide (NO2)) and daily cardiovascular diseases (CVD) mortality in Wuhan, China using a case-crossover design to analyze four years of data (2006–2009) collected from the Hubei Provincial Center for Disease Control and Prevention and the Wuhan Environmental Protection Bureau. From 2006 to 2009, daily average concentrations of PM10, SO2 and NO2 were 115.60 µg/m3, 53.21 µg/m3 and 53.08 µg/m3, respectively. After adjusting for temperature and relative humidity, a 10 µg/m3 increase in SO2 and NO2 over a 24-h period was associated with CVD mortality relative risk (R.R.) of 1.010 (95% CI: 1.000, 1.020) for SO2 and 1.019 (95% CI: 1.005, 1.033) for NO2, but there was no significant association between increases in PM10 and mortality. Subgroup analysis on by gender showed a significant association of 1.026 (95% CI: 1.007, 1.045) between NO2 and CVD among males, while no significant statistical effect was shown among females. Subgroup analysis by age showed that for those older than 65 years, every 10 µg/m3 increase in NO2 was associated with a 1.6% (95% CI: 0.1%, 3.1%) increase in CVD mortality. Subgroup analysis on different types of CVD showed that every 10 µg/m3 increase in PM10 and SO2 were significantly associated with an approximately 1.012 (95% CI: 1.002, 1.022) and 1.021 (95% CI: 1.002, 1.040) increase, respectively, in ischemic heart disease (ICH) mortality. In conclusion, exposure to NO2 is significantly associated with CVD mortality. Larger, multi-center studies in Chinese cities are being currently conducted to validate these findings.

1. Introduction

In recent years, more and more evidence has shown that particulate matter (PM10), sulfur dioxide (SO2), nitric oxide (NO2), and other major air pollutants have acute adverse effects on the human circulatory system. Zeka et al. [1] analyzed data from 20 U.S. cities between 1989 and 2000 and found a statistically significant association between air particulate matter PM10 and heart disease mortality. Katsouyanni et al.’s study on 12 European cities [2] and Samoli et al.’s study on 30 European cities [3] showed that the elevated concentrations of SO2 and NO2 were associated with cardiovascular disease (CVD) mortality. Meanwhile, a study conducted by the Chinese scholars Yang and Pan [4] showed that, in addition to SO2 and NO2, PM10 is also associated with CVD mortality. However, different pollutant concentration levels and lifestyles in the various regions studied produce inconsistent findings. Qian and his co-workers [5] showed that daily concentrations of PM10 in Wuhan were associated with residents’ CVD mortality. However, since this study was conducted from 2001 to 2004, and because air pollutant levels have changed substantially in recent years, this data may no longer be representative of Wuhan’s present air pollution and related CVD conditions. In our study, a case-crossover design was used to determine the link between changes in air pollutant concentration and CVD mortality in Wuhan, China.

2. Materials and Methods

2.1. Data Source

Meteorological data was collected from the Wuhan Meteorological Station monitoring database. This data included the daily average temperature and relative humidity from 1 January 2006 to 31 December 2009.Atmospheric pollutant data for daily air pollutants were released by the Municipal Environmental Protection Bureau of Wuhan, including the average daily Air Quality Index (AQI) of air pollutants PM10, NO2, SO2 from 2006 to 2009, and the above information was converted into a daily average concentration of air pollutants based on the “Ambient Air Quality Standard” (GB3095-2012) [6]. According to the breakpoints of air pollutant and the AQI and air pollutant concentration conversion formula [7], we converted the AQI values to concentration levels using the standard formula [8].
Death data was collected from the Hubei Provincial Center for Disease Control and Prevention death registration system, which included information of decedents from 1 January 2006 to 31 December 2009. According to “the International Classification of Diseases, ICD-10”, a few common cardiovascular diseases, including ischemic heart disease (I20–I25), essential hypertension (I10) and stroke (I60–I69), were analyzed for any association with air pollution.

2.2. Methods

Ethics Statement

All subjects gave their informed consent for inclusion before they participated in the study. The study was conducted in accordance with the Declaration of Helsinki, and the protocol was approved by the Ethics Committee of Wuhan University (No.13003).
Case-crossover studies are used in epidemiology to study the effects of exposures or risk factors that are short-term or transient. Each research subject consists of two data components: the “case” period, the timeframe during which the subject is considered a case; and the “control” period, the timeframe during which the subject is considered as a control (i.e., not a case, prior to exposure). Within each individual, the effects of exposure during the case period are compared with those during the control period; therefore, the two components are “matched pairs”, and each subject serves is its own control.
After adjusting for daily average temperature and relative humidity, the present study analyzed the relative risk (RR.) value of association of air pollutant exposure (until death) during the case period and during the control period using the case-crossover design and conditional Logistic regression. For all analyses, the statistical software packages SAS (version 9.2) and C-CAT were used, the lag effect of the increase in air pollutant concentration was taken into consideration, and meteorological factors were introduced as covariates into the regression model for the association analysis.

3. Results

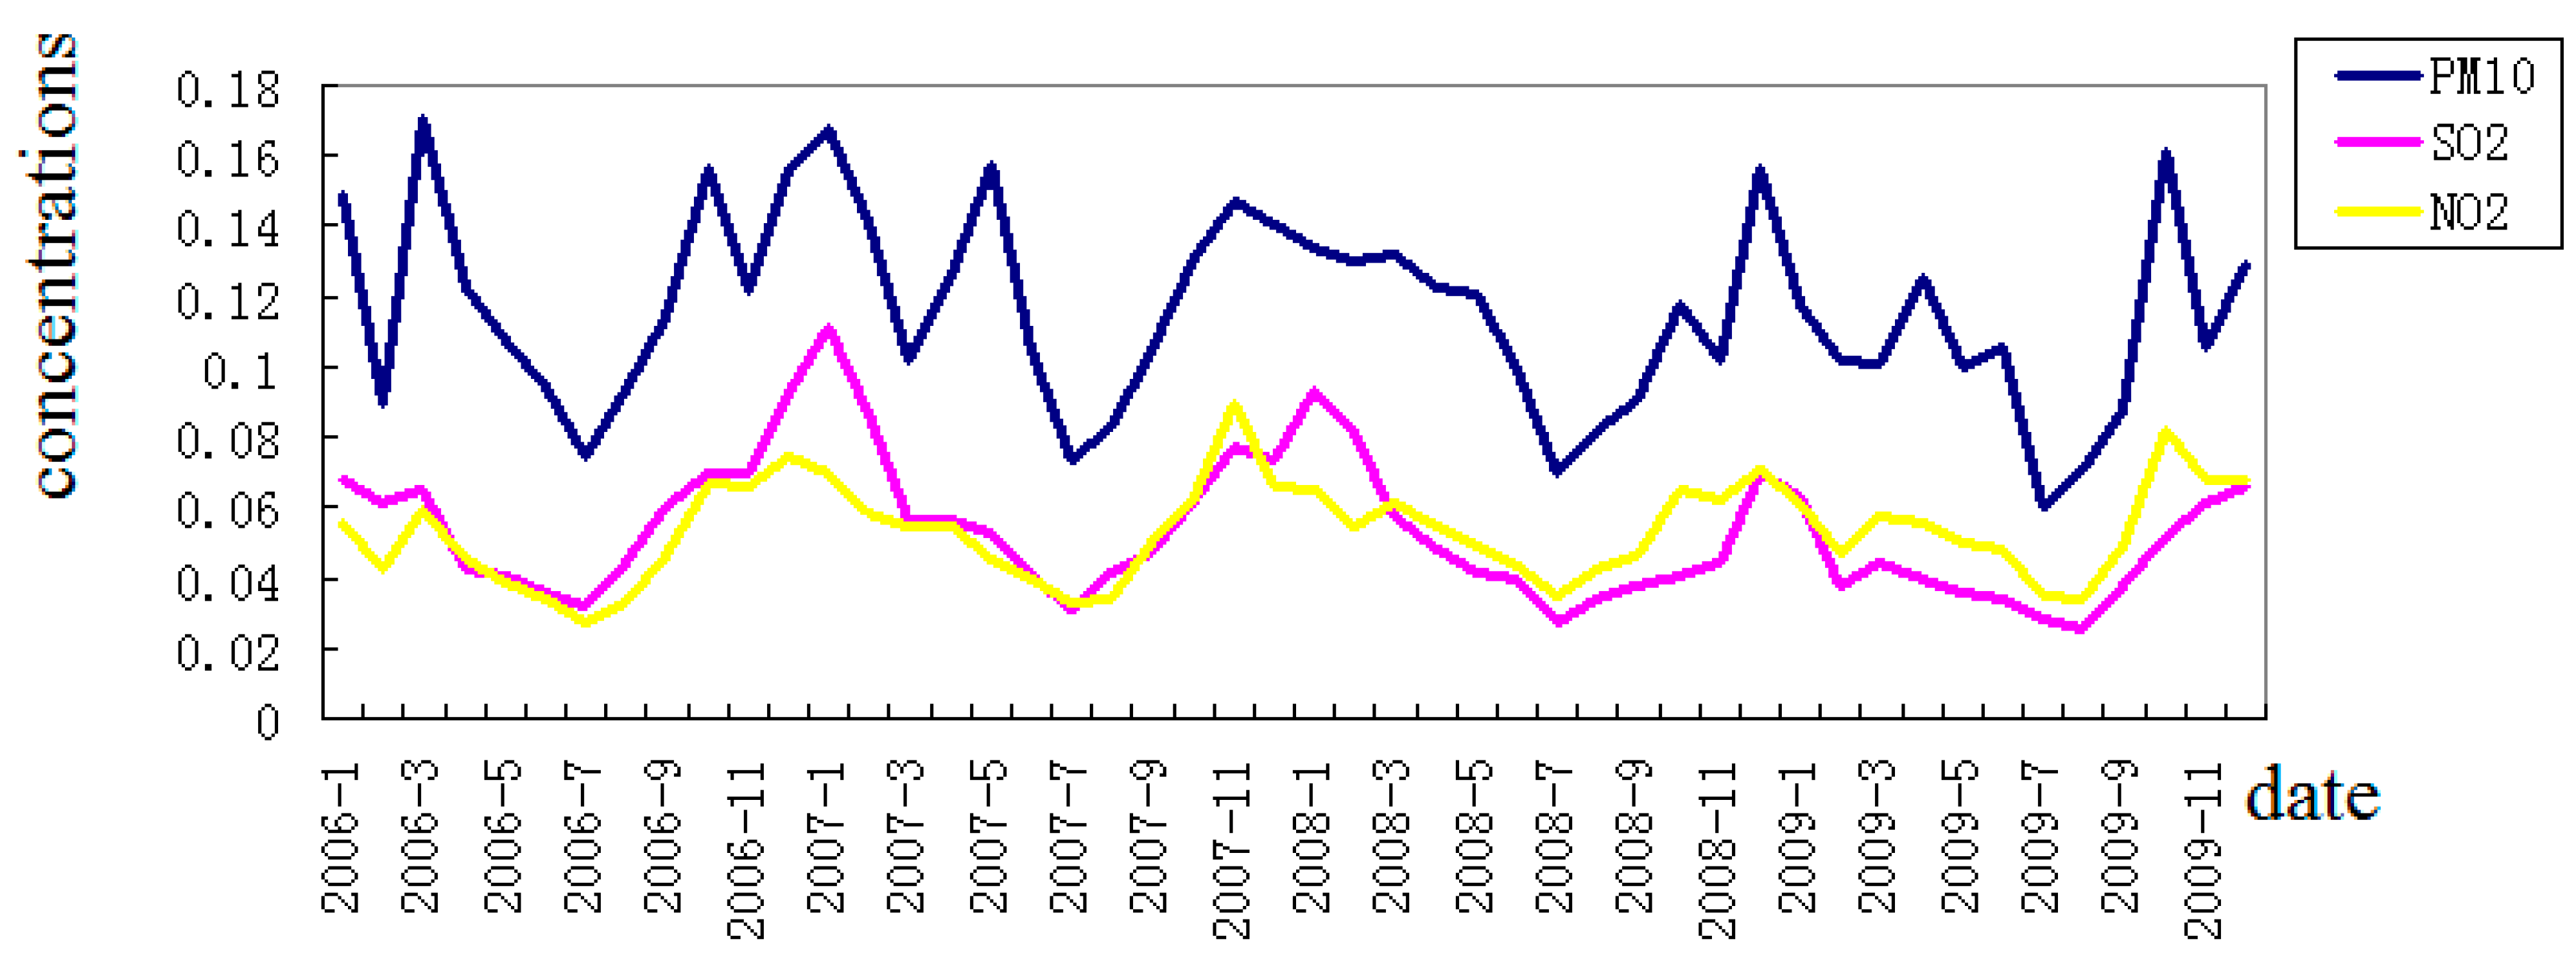
3.1. Information on Air Pollutants and Meteorological Factors

From 1 January 2006 to 31 December 2009, there were 22,489 deaths (excluding accidents and injuries) due to disease in Wuhan, 8,955 of which were related to CVD. Among all subjects, 53.6% were males while 46.4% were females, and subjects who were equal or older than 65 years old represented 80.1% (Table 1). During the same time period, the daily average concentrations of PM10, SO2 and NO2 were 115.60 μg/m3, 53.21 μg/m3 and 53.08 μg/m3, respectively (Table 2). Daily average concentrations of the three pollutants showed considerable seasonal variation in that they were higher during spring and winter than during summer and autumn (Figure 1).
Table 1. Description of characteristics of all subjects collected during 2006–2009.
Characteristics2006 (%)2007 (%)2008 (%)2009 (%)Total (%)
GenderMale399 (63.2)1153 (52.8)1306 (53.4)1944 (52.6)4802 (53.6)
Female232 (36.8)1031 (47.2)1138 (46.6)1752 (47.4)4153 (46.4)
Age Group<65207 (32.8)427 (19.6)472 (19.3)674 (18.2)1780 (19.9)
≥65424 (67.2)1757 (80.4)1972 (80.7)3022 (81.8)7175 (80.1)
Total6312184244436968955
Table 2. Descriptive analysis of air pollutants and meteorological factors in Wuhan, 2006–2009.
Air Pollutants and Meteorological FactorsDaily Avg.SDPercentileIR
0255075100
PM10 (µg/m3)115.6054.5918.0074.00108.00148.00567.0074.00
SO2 (µg/m3)53.2129.918.0031.0048.0068.00267.0037.00
NO2 (µg/m3)53.0821.5117.6036.8049.6065.60153.6028.80
Avg. Temperature (°C)18.149.49−2.709.4019.7026.2035.3016.80
Avg. humidity0.700.130.210.620.710.790.970.17
Figure 1. Monthly average concentrations (μg/m3) of air pollutants during 2006–2009.
Ijerph 12 03506 g001

3.2. Correlations between Air Pollutant Concentrations and Meteorological Factors

The daily average concentrations of the air pollutants PM10, SO2 and NO2 were shown to be significantly associated with each other, as shown by the rank correlation coefficients 0.6164 (p < 0.01), 0.7005 (p < 0.01), and 0.6962 (p < 0.01), respectively. All three air pollutant concentrations were negatively correlated with the meteorological factors temperature and humidity, with the correlations of PM10 to temperature and humidity being weaker in comparison with the correlations of SO2 and NO2 to the same meteorological factors (Table 3).
Table 3. Spearman rank correlation coefficient analysis of meteorological factors and daily concentrations of air pollutants in Wuhan, 2006–2009.
Air Pollutants and Meteorological FactorsPM10SO2NO2Avg. TemperatureAvg. Humidity
PM101
SO20.61641
NO20.70050.69621
Avg. temperature−0.1775−0.4060−0.33451
Avg. humidity−0.1803−0.1974−0.106−0.18341

3.3. Association of PM10, SO2 and NO2 with Daily CVD Mortality

After adjusting for average daily temperature and relative humidity, the results showed that the associations between the concentrations of NO2, SO2, and CVD mortality were most statistically significant on the same day, and also the next day, but the association was no longer statistically significant two days later. Every 10 μg/m3 increase in NO2 was associated with a 1.9% (95% CI: 0.5%, 3.3%) increase in daily CVD mortality after 24 h and a 1.7% (95% CI: 0.4%, 3.1%) increase after 48 hours. In addition, each 10 μg/m3 increase in SO2 daily concentration were both significantly associated with 1.0% (95% CI: 0.0%, 2.0%) increases in daily CVD mortality after 24 and 48 h, respectively. PM10 levels were shown to not have any significant association with daily CVD mortality; for every 10 μg/m3 increase in PM10 concentration, the RR value was 1.005 (95% CI: 1.000, 1.010) (Table 4).

3.4. Subgroup Analysis of Associations between PM10, SO2, NO2 and Daily CVD Mortality

The associations among female CVD mortality and PM10, SO2, and NO2 were not significant. As for males, while the associations among PM10, SO2 and male daily CVD mortality were not statistically significant, each 10 μg/m3 increase in NO2 was shown to be significantly associated with 2.6% (95% CI: 0.7%, 4.5%) and 2.5% (95% CI: 0.6%, 4.4%) increases in CVD mortality after 24 h and 48 h, respectively (Table 3). Upon age stratification, the associations among PM10, SO2 and daily CVD mortality of people over the age of 65 were not statistically significant; however, every 10 μg/m3 increase in NO2 was significantly associated with a 1.6% (95% CI: 0.1%, 3.1%) increase in CVD mortality for the people over the age of 65 (Table 4).
Analysis was also done on the association of essential hypertension (I10), ischemic heart disease (IHD; I20–I25), and stroke (I60–I69) with the same three air pollutant concentrations. Results showed that each 10μg/m3 increase of PM10 was significantly associated with a 1.2% (95% CI: 0.2%, 2.2%) increase in IHD mortality. Every 10μg/m3 increase in SO2, was significantly associated with a 2.1% (95% CI: 0.2%, 4.0%) increase in IHD mortality, and was most significant after 24 h. NO2, however, did not seem to be significantly associated with IHD mortality. None of the pollutants analyzed seemed to have any statistically significant associations with essential hypertension and stroke (Table 4).
Table 4. Associations between air pollutants and CVD mortality among urban residents in Wuhan.
Categories of DeathLAG daysPM10NO2SO2
H.R. (95% CI)p ValueH.R. (95% CI)p ValueH.R. (95% CI)p Value
Total death of CVD (8955)01.005 (1.000, 1.01)0.06731.019 (1.005, 1.033)0.00681.010 (1.000, 1.020)0.0472
11.004 (0.999, 1.009)0.08421.017 (1.004, 1.031)0.01301.010 (1.001, 1.020)0.0354
20.999 (0.994, 1.003)0.57750.994 (0.981, 1.008)0.40000.997 (0.988, 1.007)0.5506
Avg. 3 days1.002 (0.995, 1.008)0.63171.010 (0.992, 1.028)0.27801.007 (0.994, 1.020)0.3125
Male death of CVD (4802)01.006 (0.999, 1.013)0.09291.026 (1.007, 1.045)0.00661.008 (0.994, 1.022)0.2638
11.007 (1.000, 1.014)0.05731.025 (1.006, 1.044)0.00901.012 (0.999, 1.025)0.0798
20.996 (0.989, 1.002)0.21000.990 (0.972, 1.008)0.26400.989 (0.976, 1.002)0.1037
Avg. 3 days1.001 (0.992, 1.010)0.83681.014 (0.990, 1.039)0.25361.002 (0.985, 1.021)0.7883
≥65 death of CVD (7175)0
1
2
Avg. 3 days
1.003 (0.997, 1.009)
1.003 (0.998, 1.009)
0.998 (0.993, 1.003)
1.000 (0.992, 1.007)
0.3458
0.2694
0.5019
0.9429
1.016 (1.001, 1.031)
1.013 (0.998, 1.029)
0.992 (0.978, 1.007)
1.005 (0.985, 1.025)
0.0385
0.0945
0.3229
0.6478
1.009 (0.998, 1.020)
1.009 (0.998, 1.020)
0.997 (0.987, 1.008)
1.006 (0.991, 1.020)
0.1087
0.1023
0.5957
0.4378
Death of IHD (I20–I25) (2519)0
1
2
Avg. 3days
1.012 (1.002, 1.022)
1.007 (0.998, 1.017)
0.994 (0.985, 1.003)
1.006 (0.995, 1.018)
0.0147
0.1394
0.2019
0.2886
1.023 (0.997, 1.049)
1.012 (0.987, 1.038)
0.990 (0.965, 1.015)
1.012 (0.981, 1.045)
0.0781
0.3586
1.013 (0.995, 1.032
1.021 (1.002, 1.040)
0.1644
0.0261
0.4336
0.4389
1.001 (0.984, 1.020)
1.019 (0.996, 1.043)
0.8770
0.1136

4. Discussion and Conclusions

The results of this study showed that among the three air pollutants analyzed, the associations between NO2, SO2, and daily CVD mortality were statistically significant, but no association between PM10 and CVD mortality was found. For the subgroup analysis, no significant associations were found between air pollutants and CVD mortality among females, while significant associations were found for NO2 among men as well as among people of ages 65 and older; upon cause-specific analysis, significant associations were found between PM10, SO2, and ischemic heart disease mortality, while no significant associations were found for essential hypertension and stroke.
In the Ambient Air Quality of Key Environmental Protected cities in the First Half of 2012 report of the Ministry of Environmental Protection, Wuhan met secondary ambient air quality standards, and the average concentrations of PM10, SO2, NO2 decreased annually. Of the three major pollutants, PM10 was the most abundant in Wuhan, with the highest daily average concentration. The average concentration of SO2 was significantly lower than that in Urumqi (92.4 μg/m3) [9], which is likely due to the relatively lower amount of coal-burning done in Wuhan. NO2 in Wuhan was lower than in Beijing [10] and Guangzhou [11], likely due to less vehicle ownership among Wuhan residents compared to that in Beijing and Guangzhou, thus lowering the amount of automobile emission released into the atmosphere. The average concentration of PM10 was significantly lower in Wuhan compared to that in Xi’an [12], which is likely due to the fact that Xi’an is a very industrial city. Although, compared with Shanghai, which also reached secondary ambient air quality standards, air pollutants concentrations in Wuhan were all higher [13]. Thus, there is room for improvement of the air quality in Wuhan.
The results of this study demonstrated that increases in NO2 and SO2 are significantly associated with daily CVD mortality, while no statistically significant associations were found for PM10 (p > 0.05). These findings were consistent with results of Song et al.’s study [14] done in Shanghai as well as Venners et al.’s study [15] done in Chongqing. A study by Deng et al. [16] showed that each 10 μg/m3 increase in PM10, increased the risk associated with circulatory system diseases, cardiovascular disease, cerebrovascular disease mortality by 0.36% (95% CI: −0.07, 0.78), 0.63% (95% CI: −0.02, 1.28) and 0.33% (95% CI: −0.26, 0.92), respectively. Some studies were found to contrast the present study’s findings. For example, Qian et al. [5] found that PM10 concentration was associated with CVD mortality, each 10 μg/m3 increase in PM10 daily concentration at lag 0 day was significantly associated with an increase in cardiovascular 0.51% (95% CI: 0.28,0.75). Wang et al. [17] pointed out in their meta-analysis that the conclusions of associations between acute effects from short-term exposure to PM10 and population CVD mortality were invalid due to the following factors: (1) limitations of study subjects and sample size; (2) lack of adjustment of weather factors or other atmospheric confounding pollutants; and (3) incomplete adjustments of particulate matters’ acute effects on the cardiovascular system. Also, we speculate the following additional factors may explain the differences between the present study and others: (1) the variation in particulate matter components and toxicity across different areas; (2) the negligible risk of CVD mortality caused by PM10; and (3) considerable differences in sample size across these studies.
According to the gender-stratified analysis, no statistically significant associations were found between pollutants and CVD mortality in females, and among males, only NO2 was significantly associated with CVD mortality. In contrast, research conducted by Kan et al. [18] in Shanghai suggested that women were more susceptible to air pollution exposure, and that this exposure-mortality association was related to the level of education. Also, a study by Kunzl et al. [19] indicated that effects of air pollution on non-smokers were greater in comparison to the effects on smokers. Therefore, it is possible that different educational levels and smoking prevalence across various regions may contribute to differences among genders.
In the age-stratified analysis, NO2 was associated with daily CVD mortality in people over 65 years of age, which is consistent with the results of a study done by Yang et al. [20] Also, as McGrath [21] pointed out, more elderly people suffer from chronic diseases than any other age group, likely making them more susceptible to the adverse effects of air pollution exposure. Therefore, health conditions characteristic of elderly populations could explain the differences observed across age groups in this study.
As for the cause-specific analysis, only PM10 and SO2 were significantly associated with IHD. The association of PM10 and SO2 with IHD mortality obtained in this study was consistent with a study done by Milojevic et al. [22] In addition, studies done by Zeka et al. [1] and Wong et al. [23] also showed that PM10 and SO2 were associated with IHD mortality. Baskurt et al. [24] found that SO2 could generate denatured methemoglobin leading to reduced permeability of red blood cells, and thus a lack of blood supply to the organs. Meanwhile, PM10 could alter the generations of vascular tone, atherosclerosis, autonomic nervous effects, and systemic inflammatory response [25], which may further explain the observed increases in IHD mortality related to SO2 and PM10 concentrations. While no associations were found between the pollutants and primary hypertension and stroke in the present study, other studies found that PM10 and NO2 are actually associated significantly with stroke [5,26]. For instance, Qian found every 10 μg/m3 increase in PM10 daily concentration at lag 0 day was significantly associated with an increase in stroke by 0.44% (95% CI: 0.16,0.72). Yang et al. [27] pointed out that because cardiovascular diseases are caused by a combination of multiple gene and environmental risk factors, the epidemiological characteristics of CVD vary in different regions, period and populations. Thus, inconsistencies across different research studies is expected.
In this study, daily CVD mortality was generally associated with NO2, and this may be because the main source of atmospheric NO2 pollution was automobile emission. The average annual growth of vehicle holdings in Wuhan was 23%, and air pollutions caused by urban traffic was on the rise, further increasing the NO2-related CVD mortality, a cycle which has also been found in other regions abroad [28,29]. As the primary air pollutant in Wuhan, PM10 showed a downward trend of concentration levels in recent years; however, compared to trends of SO2, NO2 concentrations, it was relatively higher. PM10 continues to be the primary air pollutant in Wuhan, having effects on CVD mortality similar to the past. As for PM10, this study did not find any significant association with daily population CVD mortality, perhaps due to the adsorption composition and toxicity unique to Wuhan.
This study used a case-crossover design for statistical analysis. Compared to the widely used time-series study methodology, case-crossover studies rely on a rational design rather than statistical models for controlling many potential confounders. They also reduce the bias of selecting control groups and save sample size through self-contrast. Stratification with respect to gender, age, and cause was also conducted for the analyses. Thus, results reflect the adverse health effects of air pollutants on different groups of people.
There were some limitations in this study. This study only involved single pollutant models instead of multi-pollutant model analysis. From a statistical point of view, results obtained when using single pollutant models differ from those obtained when using multi-pollutant models. Air pollutants are a mixture of PM10, SO2, NO2, and a variety of other pollutants. Therefore, further research is needed to identify which type of model is more suitable to explain air pollution, and which gives results more representative of a population’s health status. In addition, considering air conditioner usage, personal lifestyles, and other factors, the actual exposure of air pollutants to the population and levels of air pollutant concentrations are relatively independent; thus, it is likely that exposure measurement errors are present in this study. It was also difficult to estimate the individual exposure. We suggest that individual and geographical differences should be considered in extrapolation of the presented conclusions. Some studies showed the synthetic actions of meteorological conditions and air pollutants [30], but this study did not collect data on factors that may have had an effect on results, such as atmospheric pressure, wind direction, wind speed, precipitation, etc. In addition, for case-crossover design, time-varying factors are possible confounders-e.g., day of week and long term trends, and results from the design are relative risks but not absolute risks. However, in summary this study shows that there is an association between exposure to air pollution and CVD mortality in Wuhan, China.

Acknowledgments

Thanks for the support by the by National Natural Science Foundation of China (Grant No. 81402743), Natural Science Foundation of Guangdong Province (Grant No. S2013040013590), Hubei Province Health and Family Planning Scientific Research Project (Grant No. WJ2015Q023) and Project of Innovation and Entrepreneurship Training for Undergraduates Wuhan University (Grant No. S2013714).

Author Contributions

Hao Xiang conceived and designed the experiments. Shuqiong Huang, Liqiao Tian, Yan Mei and Li Liu contributed materials/analysis tools. Yisi Liu and Meng Ren made data analysis. Yisi Liu and Xi Chen wrote the manuscript.

Conflicts of Interest

The authors declare no conflict of interest.

References

  1. Zeka, A.; Zanobetti, A.; Schwartz, J. Short term effects of particulate matter on cause specific mortality: Effects of lags and modification by city characteristics. J. Occup. Environ. Med. 2005, 62, 718–725. [Google Scholar] [CrossRef]
  2. Katsouyanni, K.; Touloumi, G.; Spix, C.; Schwartz, J.; Balducci, F.; Medina, S.; Rossi, G.; Wojtyniak, B.; Sunyer, J.; Bacharova, L. Short-term effects of ambient sulphur dioxide and particulate matter on mortality in 12 European cities: Results from time series data from the APHEA project. Air pollution and health: A European approach. BMJ 1997, 314, 1658–1663. [Google Scholar]
  3. Samoli, E.; Aga, E.; Touloumi, G.; Nisiotis, K.; Forsberg, B.; Lefranc, A.; Pekkanen, J.; Wojtyniak, B.; Schindler, C.; Niciu, E.; et al. Short-term effects of nitrogen dioxide on mortality: An analysis within the APHEA project. Eur. Respir. J. 2006, 27, 1129–1138. [Google Scholar]
  4. Yang, M.J.; Pan, X.C. Time series analysis of air pollutions and residents cardiovascular disease mortality in Beijing. Environ. Health 2008, 25, 294–297. [Google Scholar]
  5. Qian, Z.; He, Q.; Lin, H.; Kong, L.; Liao, D.; Dan, J.; Bentley, C.M.; Wang, B. The association of daily cause-specific mortality with ambient particle air pollutant in Wuhan, China. Environ. Res. 2007, 105, 380–389. [Google Scholar] [CrossRef] [PubMed]
  6. Ministry of Environmental Protection of the People’s Republic of China. Available online: http://kjs.mep.gov.cn/hjbhbz/bzwb/dqhjbh/dqhjzlbz/201203/t20120302_224165.htm (accessed on 19 March 2015).
  7. Xiang, H.; Mertz, K.J.; Arena, V.C.; Brink, L.L.; Xu, X.H.; Bi, Y.Y.; Talbott, E.O. Estimation of short-term effects of air pollution on stroke hospital admissions in Wuhan, China. PLoS One 2013, 8. [Google Scholar] [CrossRef] [PubMed] [Green Version]
  8. Levy, D.; Lumley, T.; Sheppard, L.; Kaufman, J.; Checkoway, H. Referent selection in case-crossover analyses of acute health effects of air pollution. Epidemiology 2001, 12, 186–192. [Google Scholar] [CrossRef] [PubMed]
  9. Xiao, K.; Yibu, L.Y.; Bao, Y.X.; Wu, W.H.; Liu, X.L. Time series analysis of atmospheric pollution and the number of daily hospitalized circulatory system disease in Urumqi. J. Hygiene Res. 2013, 42, 682–685. [Google Scholar]
  10. Zhang, F.; Li, L.; Krafft, T.; Lv, J.; Wang, W.; Pei, D. Study on the association between ambient air pollution and daily cardiovascular and respiratory mortality in an urban district of Beijing. Int. J. Environ. Res. Public Health 2011, 8, 2109–2123. [Google Scholar] [CrossRef] [PubMed]
  11. Yibulayin, X; Li, S.M.; Zeng, Z.H.; Chen, F.X.; Chen, R.J.; Zou, Y.W. Time-series studies of the relationship between atmospheric pollutants and daily emergency visits of cardiovascular disease for Guangzhou residents. Journal of Environmental and Health 2013, 30, 977–980. [Google Scholar]
  12. Wang, X.; Chen, R.J.; Chen, B.H.; Kan, H.D. Application of statistical distribution of PM10 concentration in air quality management in 5 representative cities of China. Biomed. Environ. Sci. 2013, 26, 638–646. [Google Scholar] [PubMed]
  13. Kan, H.D.; Chen, B. Air pollution and daily mortality in Shanghai: A time-series study. Arch. Environ. Health 2003, 58, 360–367. [Google Scholar] [PubMed]
  14. Song, G.X.; Jiang, L.L.; Chen, G.H.; Chen, B.H.; Zhang, Y.H.; Zhao, N.Q.; Jiang, S.H.; Kan, H.D. Hours daily mortality in Shanghai atmospheric gaseous pollutants and residents Sequences. Journal of Environmental and Health 2006, 23, 390–393. [Google Scholar]
  15. Venners, S.A.; Wang, B.; Xu, Z.; Schlatter, Y.; Wang, L.; Xu, X. Particulate matter, sulfur dioxide, and daily mortality in Chongqing, China. Environ. Health Perspect. 2003, 111, 562–567. [Google Scholar] [CrossRef] [PubMed]
  16. Dong, F.M.; Mo, Y.Z.; Li, G.X.; Xu, G.M.; Pan, X.C. Cases cross-over study of association between atmospheric particulate matter (PM10/PM2.5) and circulatory disease mortality in the population. Journal of Peking University. (Health Sciences) 2013, 45, 398–404. (In Chinese) [Google Scholar]
  17. Wang, J.Q.; Bai, J.L.; Chen, F. Meta-analysis of Inhalable particles acute effects on the cardiovascular system. Chinese Journal of Health Statistics. 2009, 26, 229–233. [Google Scholar]
  18. Kan, H.; London, S.J.; Chen, G.; Zhang, Y.; Song, G.; Zhao, N.; Jiang, L.; Chen, B. Season, sex, age, and education as modifiers of the effects of outdoor air pollution on daily mortality in Shanghai, China: The Public Health and Air Pollution in Asia (PAPA) study. Environ. Health Perspect. 2008, 116, 1183–1188. [Google Scholar] [CrossRef] [PubMed]
  19. Künzli, N.; Jerrett, M.; Mack, W.J.; Beckerman, B.; LaBree, L.; Gilliland, F.; Thomas, D.; Peters, J.; Hodis, H.N. Ambient air pollution and atherosclerosis in Los Angeles. Environ. Health Perspect. 2005, 113, 201–206. [Google Scholar] [CrossRef] [PubMed]
  20. Yang, Y.; Li, R.; Li, W.; Wang, M.; Cao, Y.; Wu, Z.; Xu, Q. The Association between ambient air pollution and daily mortality in Beijing after the 2008 Olympics: A time series study. PLoS One 2013, 8. [Google Scholar] [CrossRef] [PubMed]
  21. McGrath, J.J. Biological plausibility for carbon monoxide as a copollutant in PM epidemiologic studies. Inhal. Toxicol. 2000, 12, 91–107. [Google Scholar] [CrossRef] [PubMed]
  22. Milojevic, A.; Wilkinson, P.; Armstrong, B.; Bhaskaran, K.; Smeeth, L.; Hajat, S. Short-term effects of air pollution on a range of cardiovascular events in England and Wales: case-crossover analysis of the MINAP database, hospital admissions and mortality. Heart 2014, 100, 1093–1098. [Google Scholar]
  23. Wong, T.W.; Tam, W.S.; Yu, T.S.; Wong, A.H. Associations between daily mortalities from respiratory and cardiovascular diseases and air pollution in Hong Kong, China. Occup. Environ. Med. 2002, 59, 30–35. [Google Scholar] [CrossRef] [PubMed]
  24. Baskurt, O.K.; Levi, E.; Caglayan, S.; Dikmenoglu, N.; Kutman, M.N. Hematological and hemorheological effects of air pollution. Arch. Environ. Health 1990, 45, 224–239. [Google Scholar] [CrossRef] [PubMed]
  25. Rom, W.N.; Samel, J.M. Small particles with big effects. Am. J. Respir. Crit. Care Med. 2006, 173, 365–366. [Google Scholar] [CrossRef] [PubMed]
  26. Yang, W.S.; Wang, X.; Deng, Q.; Fan, W.Y.; Wang, W.Y. An evidence-based appraisal of global association between air pollution and risk of stroke. Int. J. Cardiol. 2014, 175, 307–313. [Google Scholar] [CrossRef] [PubMed]
  27. Yang, H.B.; Shen, J.; Jia, Q.F.; Zhang, J.; Hua, Y.J. Research progress of the impact of atmospheric pollutants and meteorological factors on cardiovascular disease. Chin. J. Dis. Control Prevent. 2010, 14, 266–268. (In Chinese) [Google Scholar]
  28. Murakami, Y.; Ono, M. Myocardial infarction deaths after high 1evel exposure to particulate matter. J. Epidemiol. Commun. Health 2006, 60, 262–266. [Google Scholar] [CrossRef]
  29. Wellenius, G.A.; Bateson, T.F.; Mittleman, M.A.; Schwartz, J. Particulate air pollution and the rate of hospitalization for congestive heart failure among medicare beneficiaries in Pittsburgh, Pennsylvania. Am. J. Epidemiol. 2005, 161, 1030–1036. [Google Scholar] [CrossRef] [PubMed]
  30. Zhu, Y.; Chen, X.D. Time series study of the effects of meteorological factors on daily mortality of cardiovascular diseases. Modern Preventive Medicine. 2008, 35, 1036–1040. [Google Scholar]

