
Classifying Natural Waters with the Forel-Ule Colour Index System: Results, Applications, Correlations and Crowdsourcing


Abstract
:
1. Introduction
2. Methods and Sampling
2.1. Derivation of FUI from Ocean Colour Remote Sensing Products
2.2. Handheld FUI Scale
2.3. CPAs and Water Clarity
2.4. Statistical Analysis
3. Results
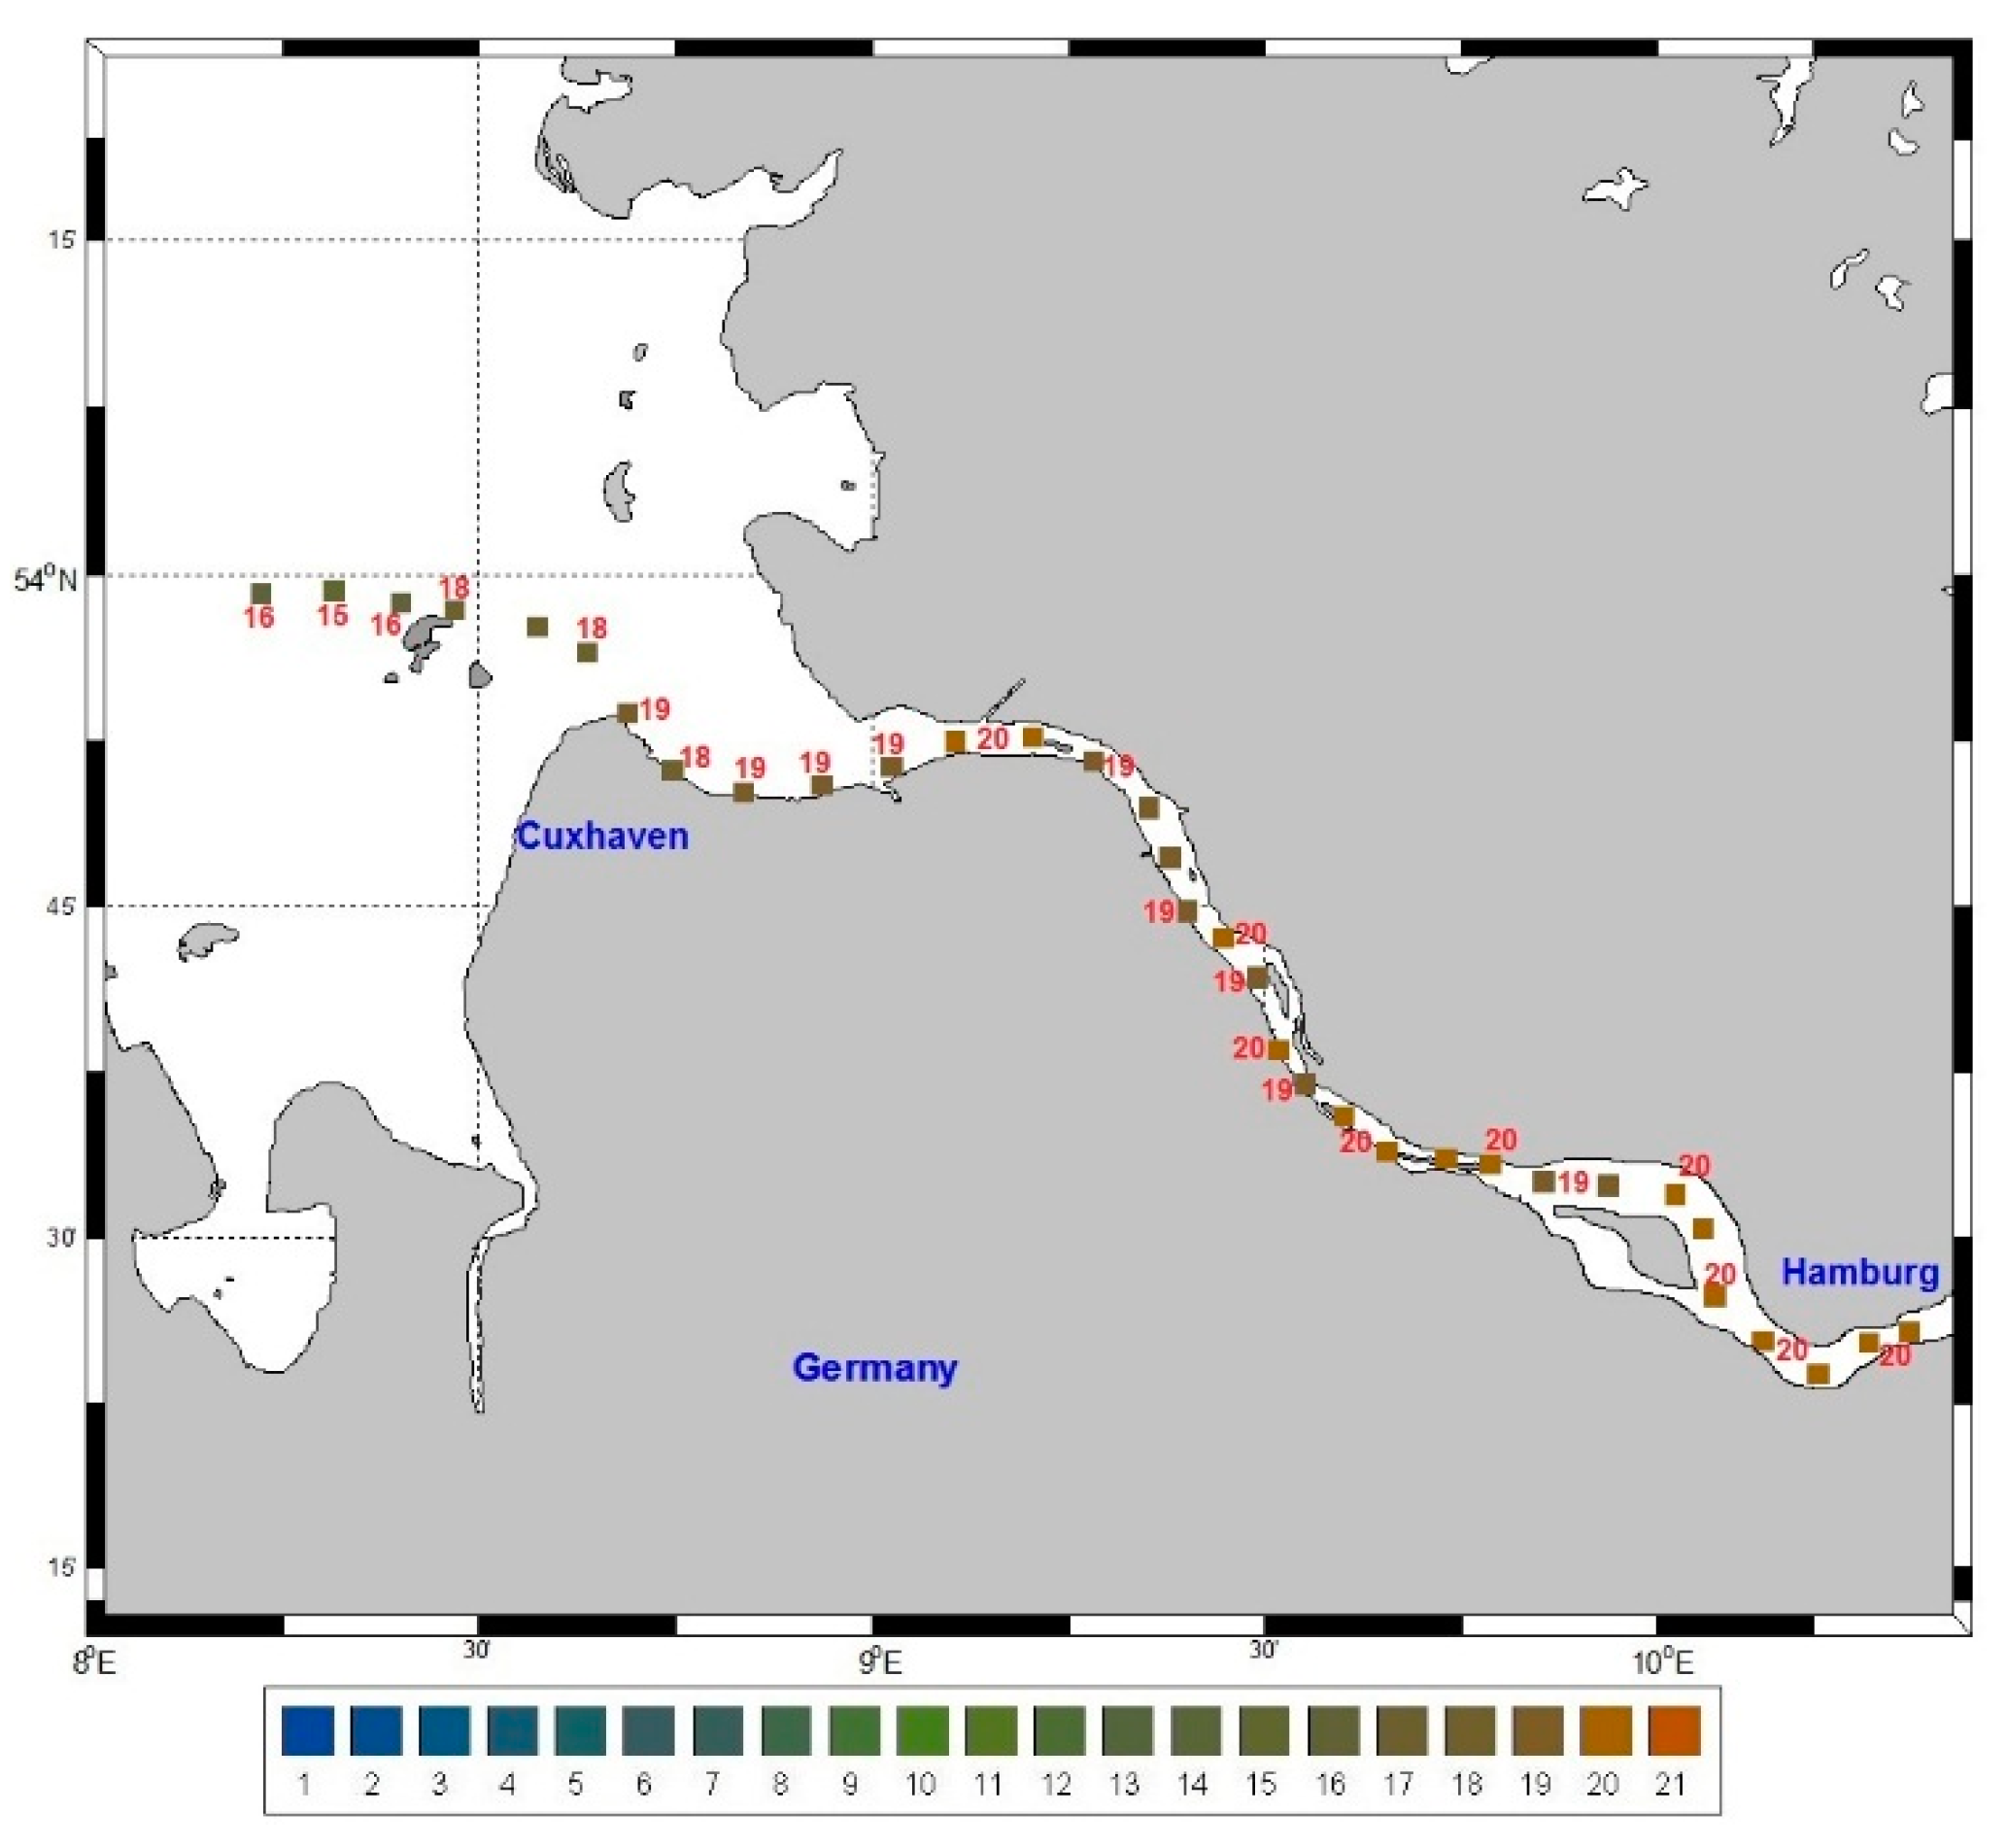
3.1. Mapping Apparent Colours of Water


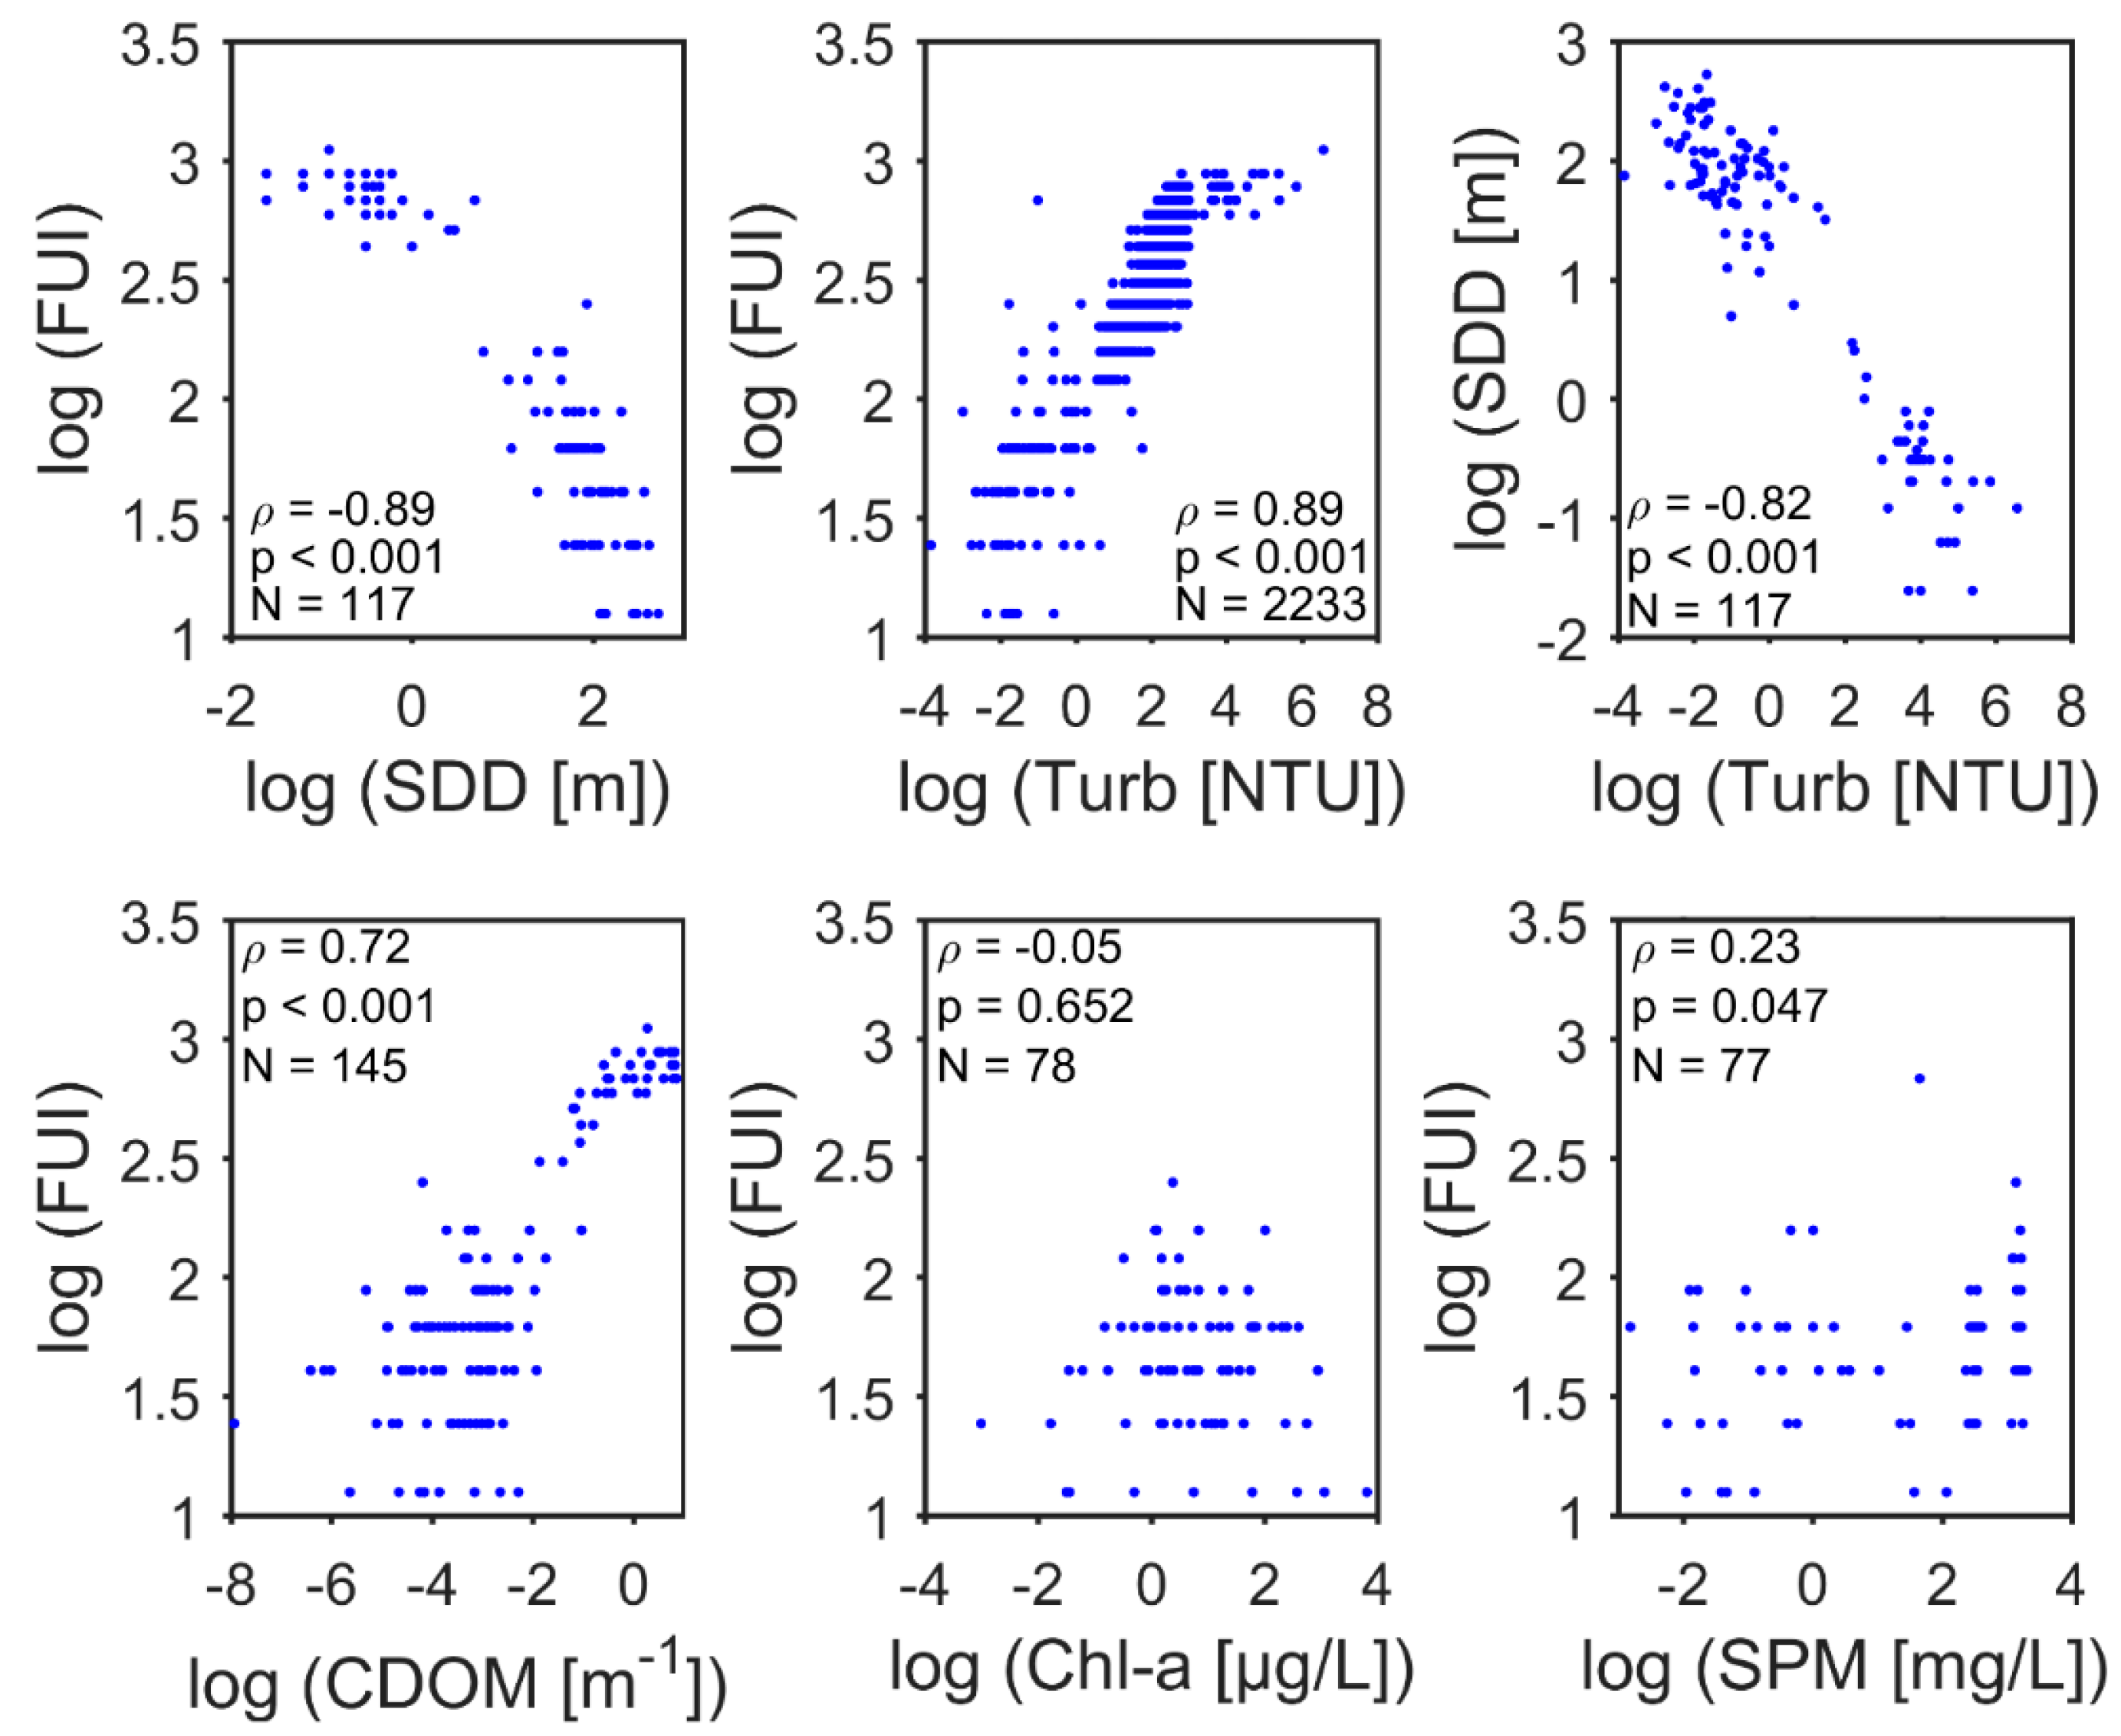
3.2. FUI as a Proxy for Water Clarity Parameters

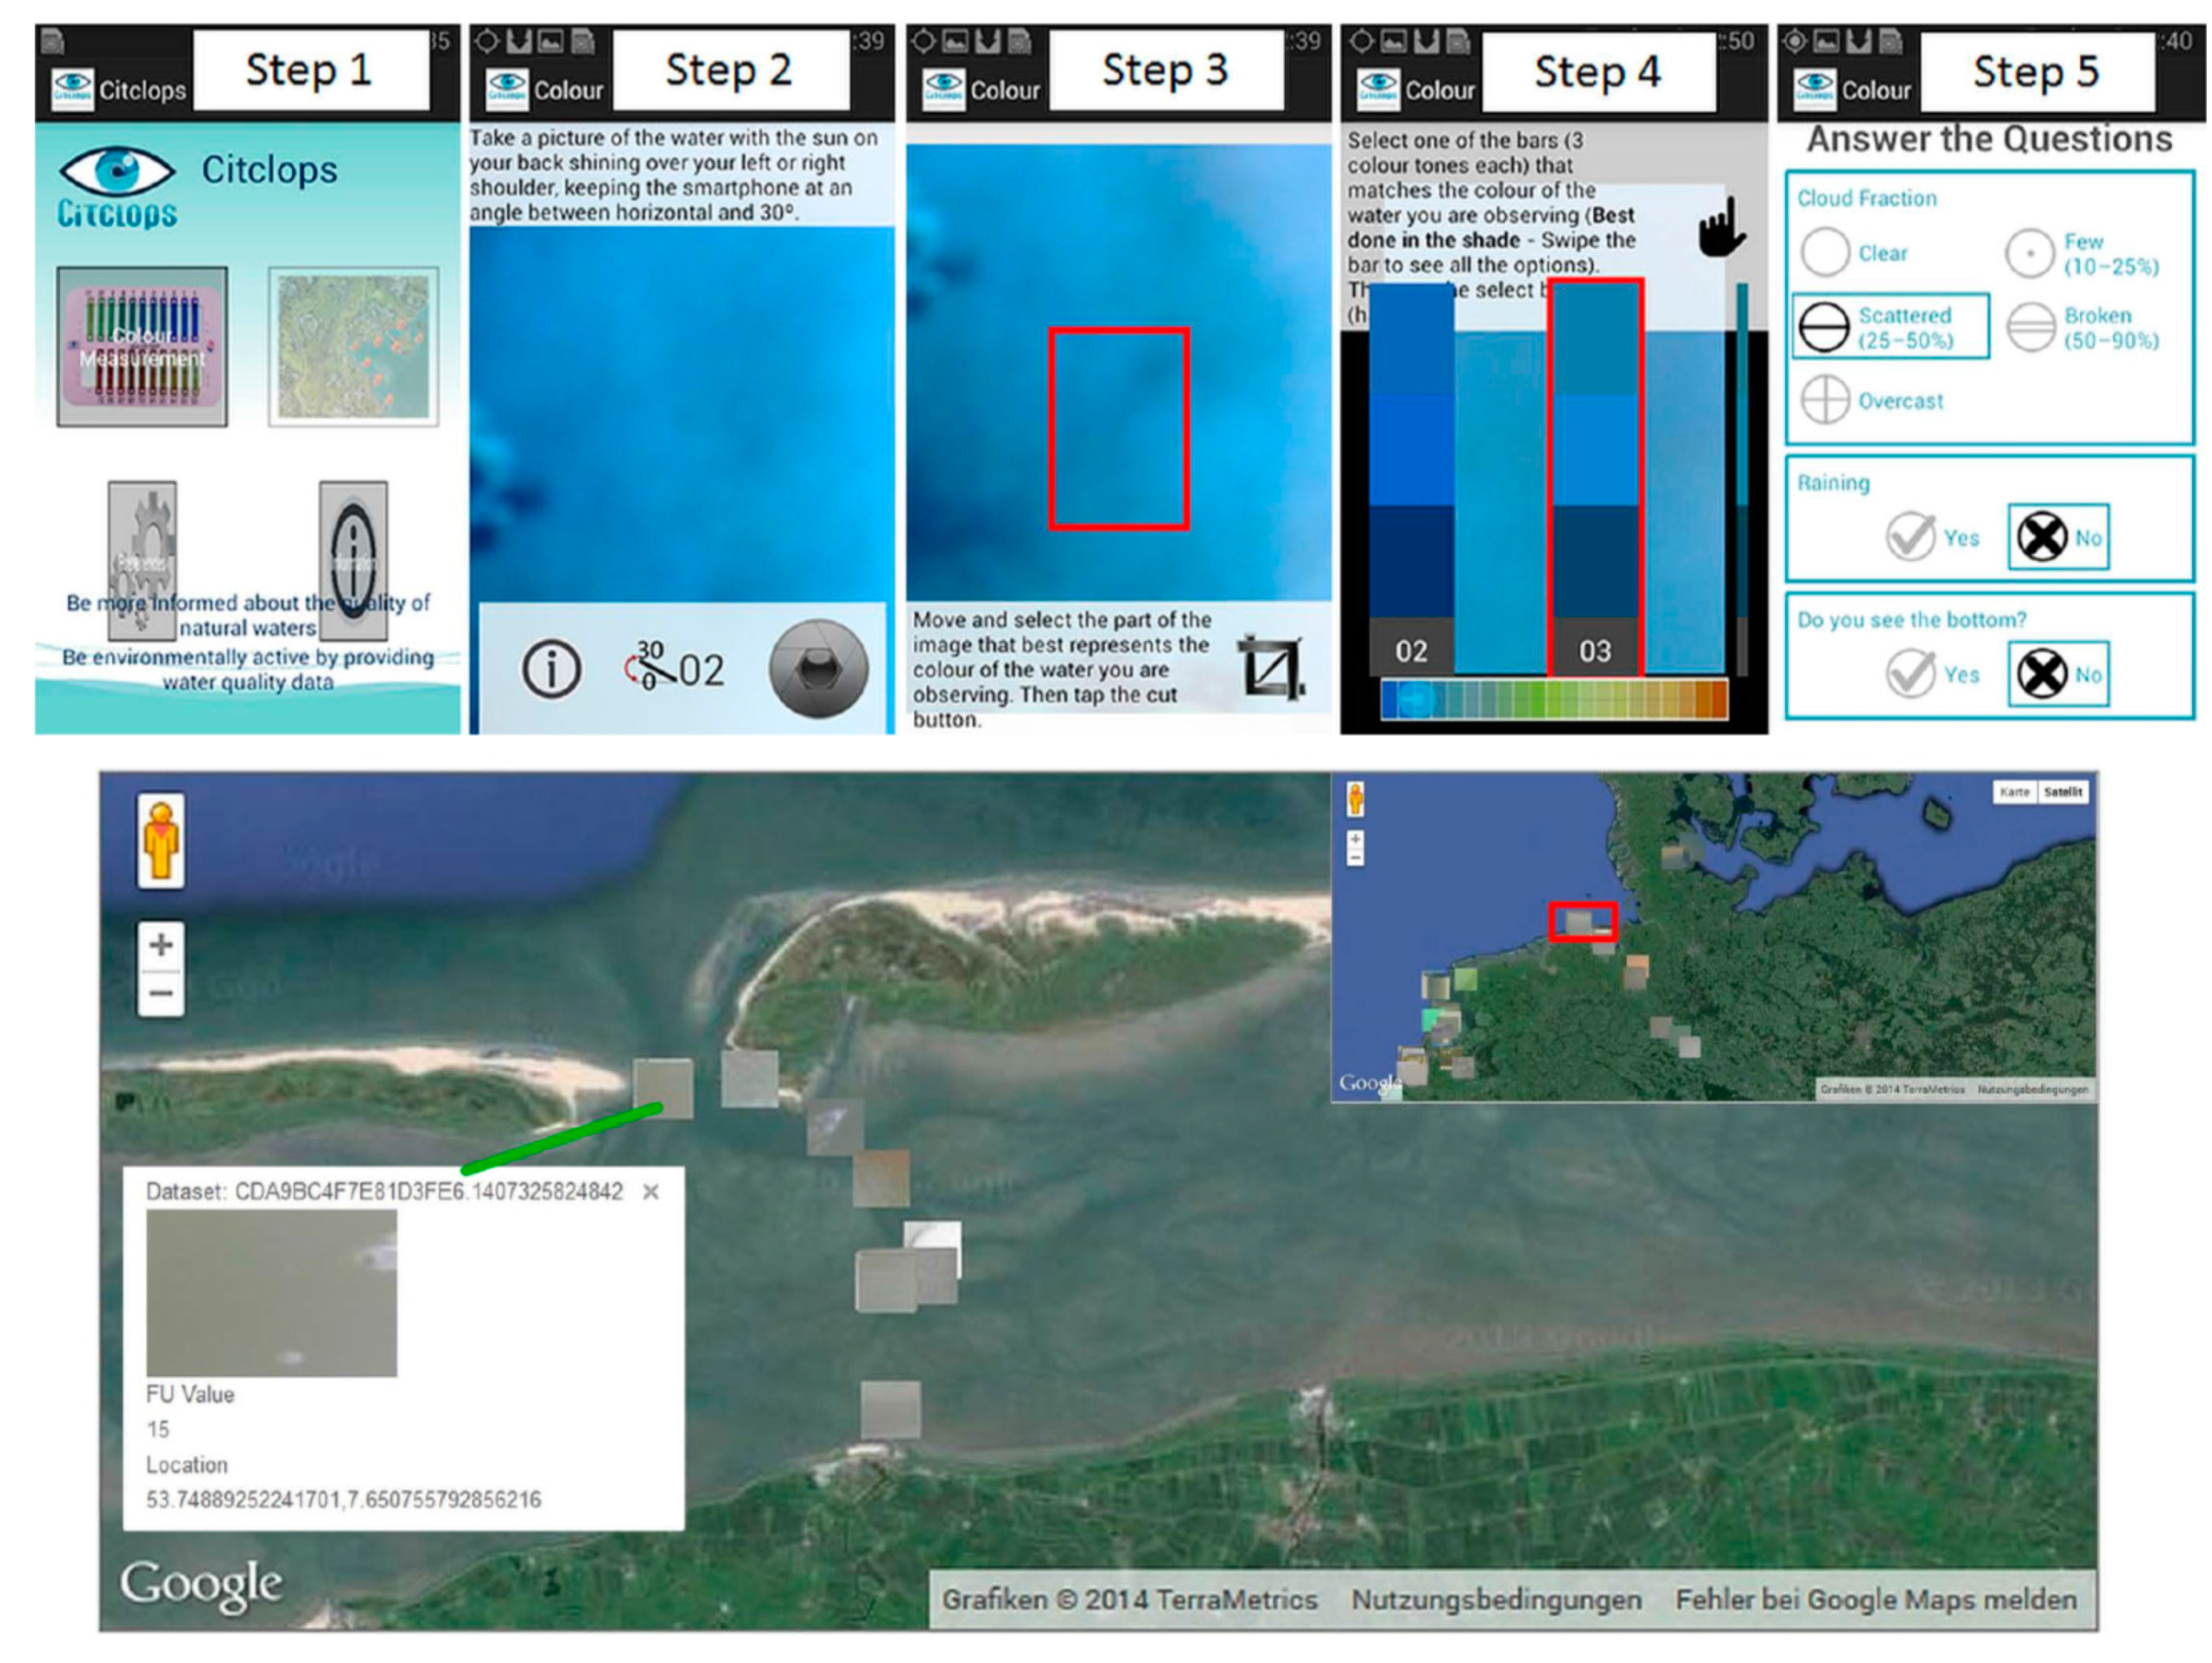
3.3. Inferring the FUI from CPAs

| Region | FUI = | N | R2 | ||
|---|---|---|---|---|---|
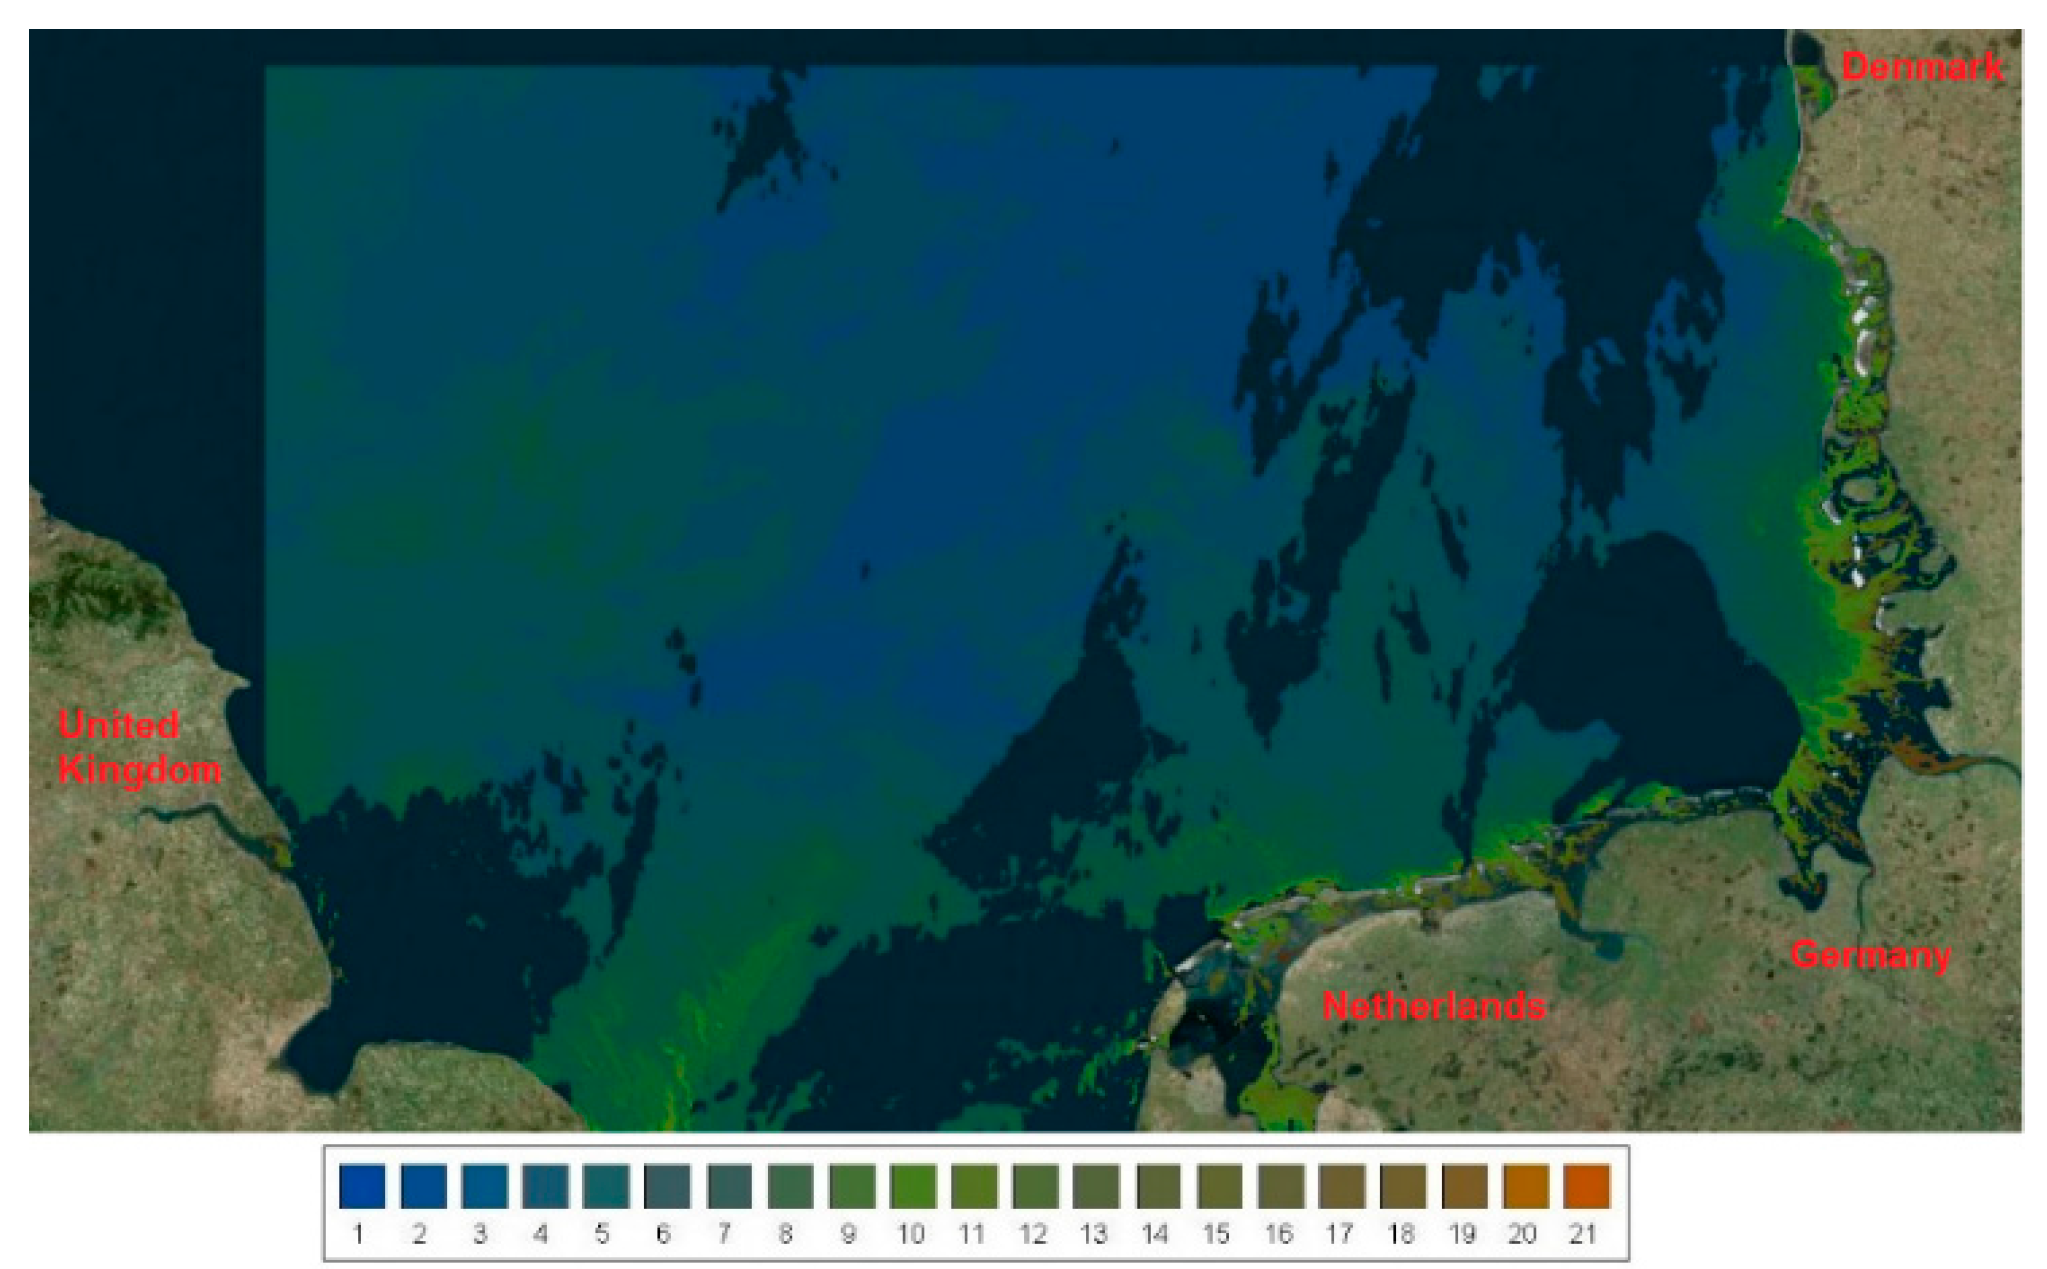
| North-western European Seas | 4.4 + 19.4 × CDOM − 0.1 × chl-a + 0.06 × SPM | 47 | 0.25 a | 21 ± 16 | 6 ± 26 |
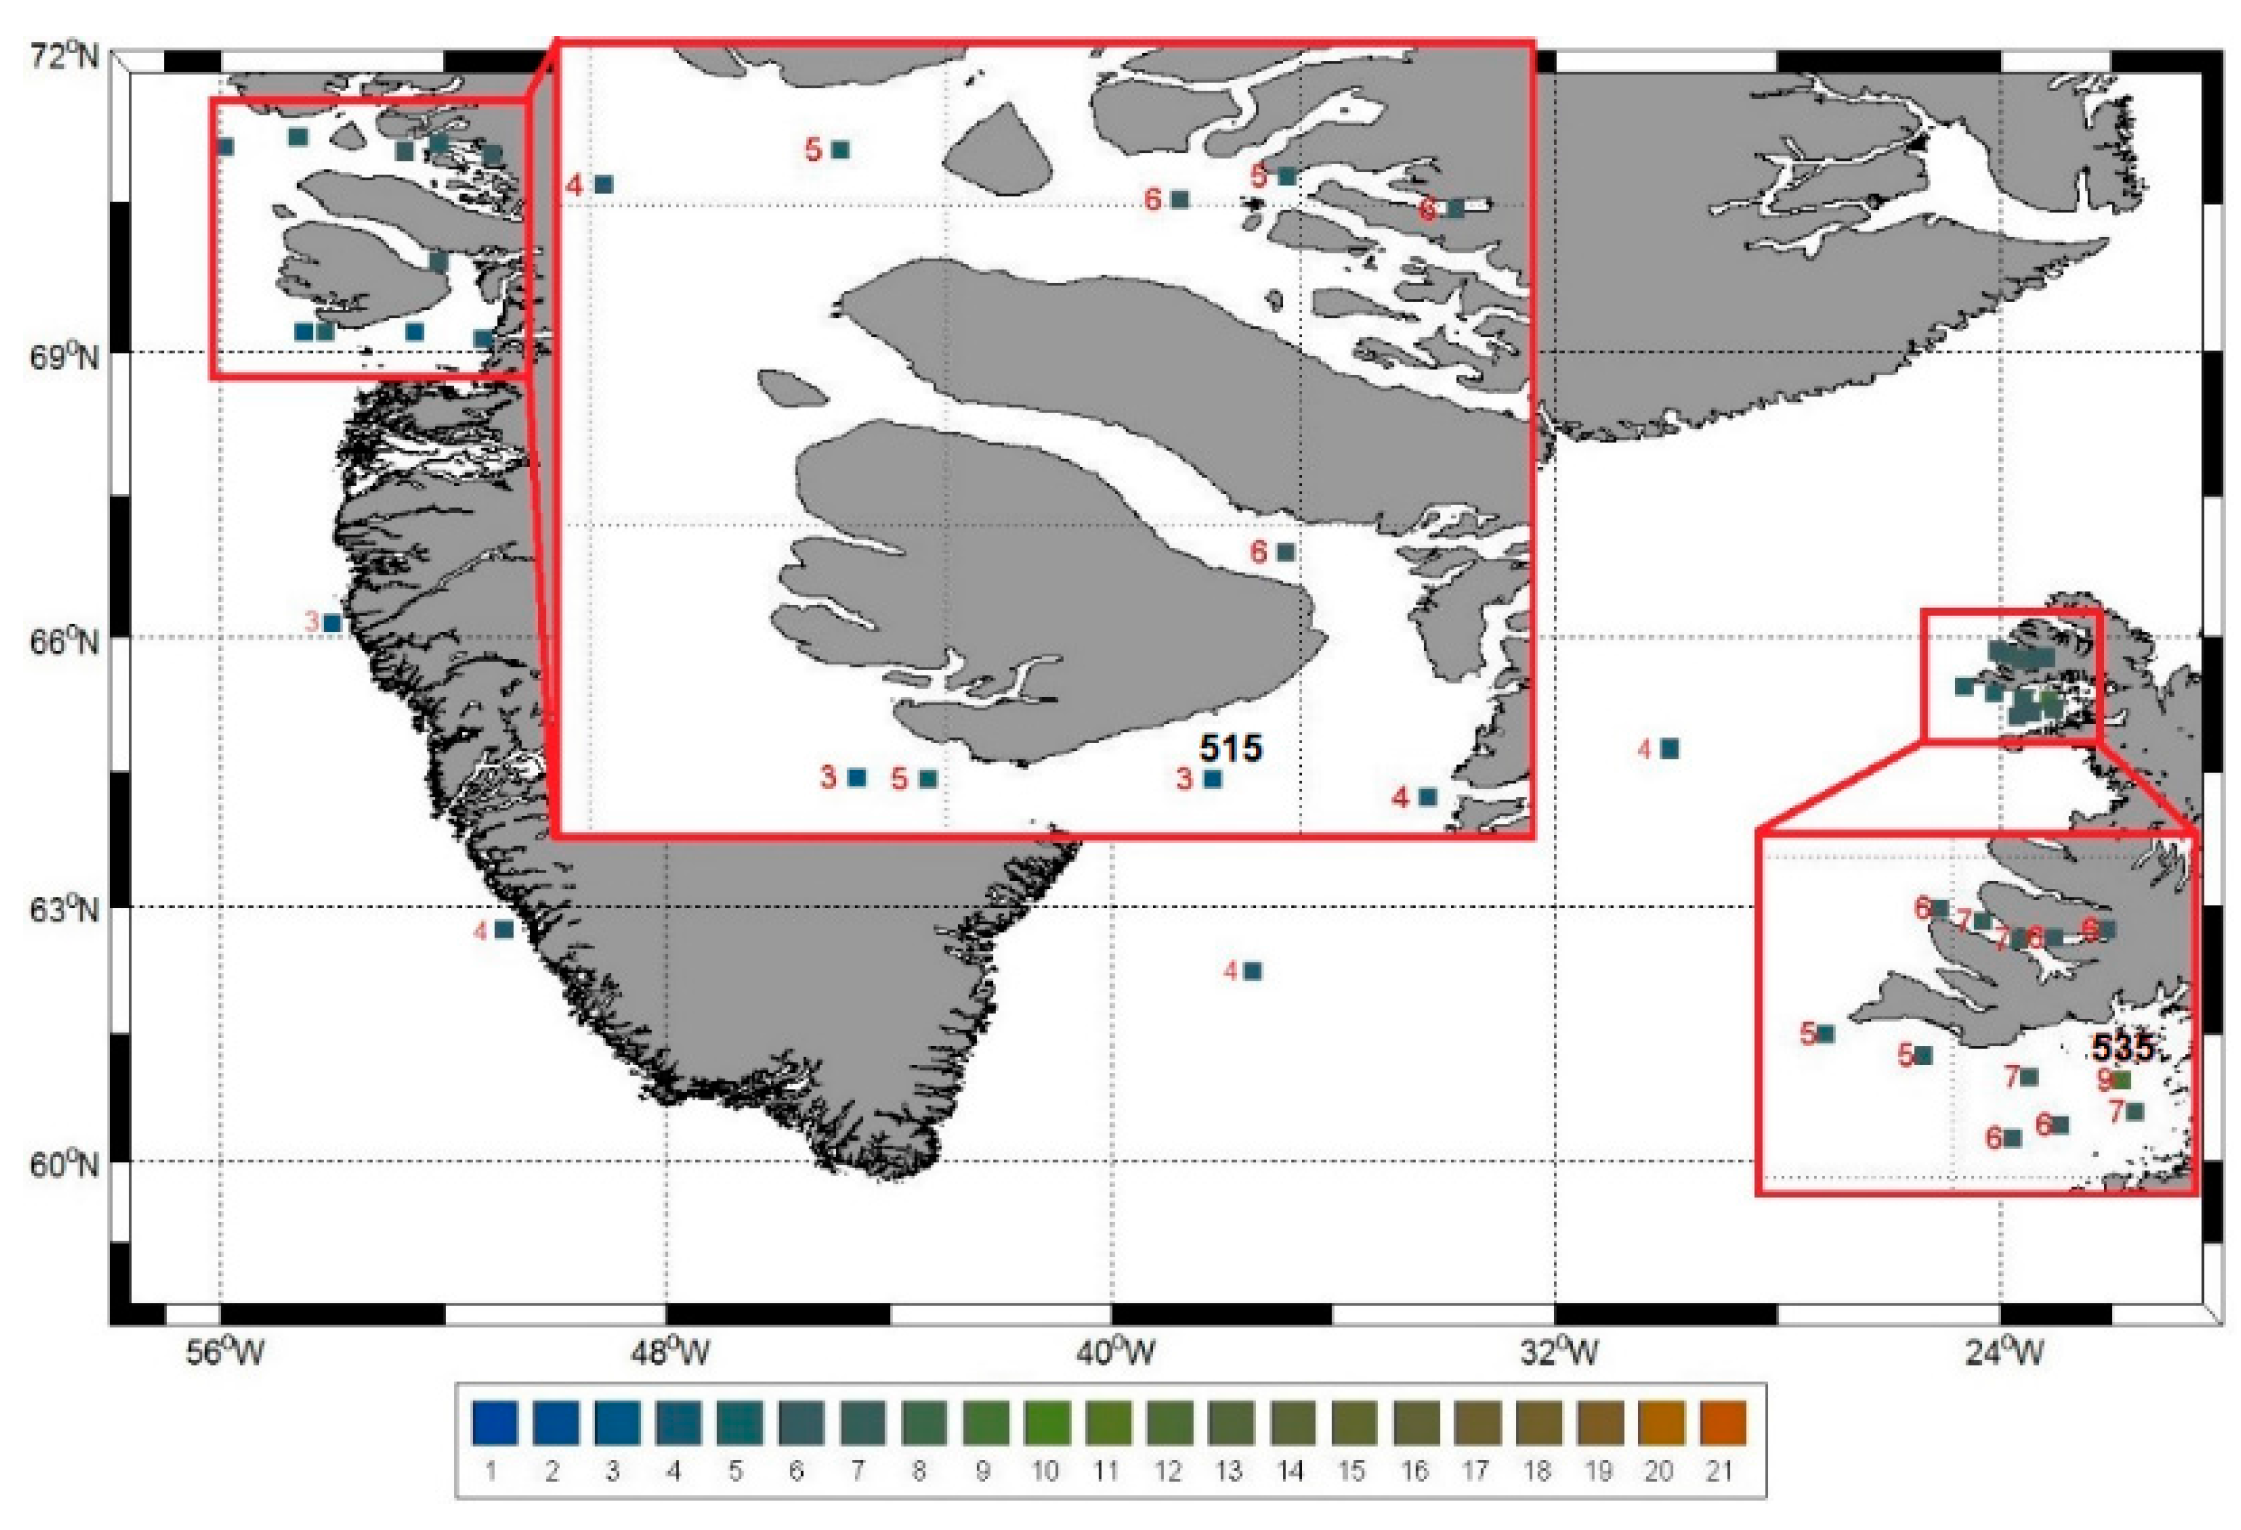
| West Greenland, Iceland | 4.6 + 9.5 × CDOM + 0.3 × chl-a − 0.05 × SPM | 24 | 0.32 b | 22 ± 16 | 6 ± 27 |
4. Discussion
4.1. Mapping Colour of Surface Waters
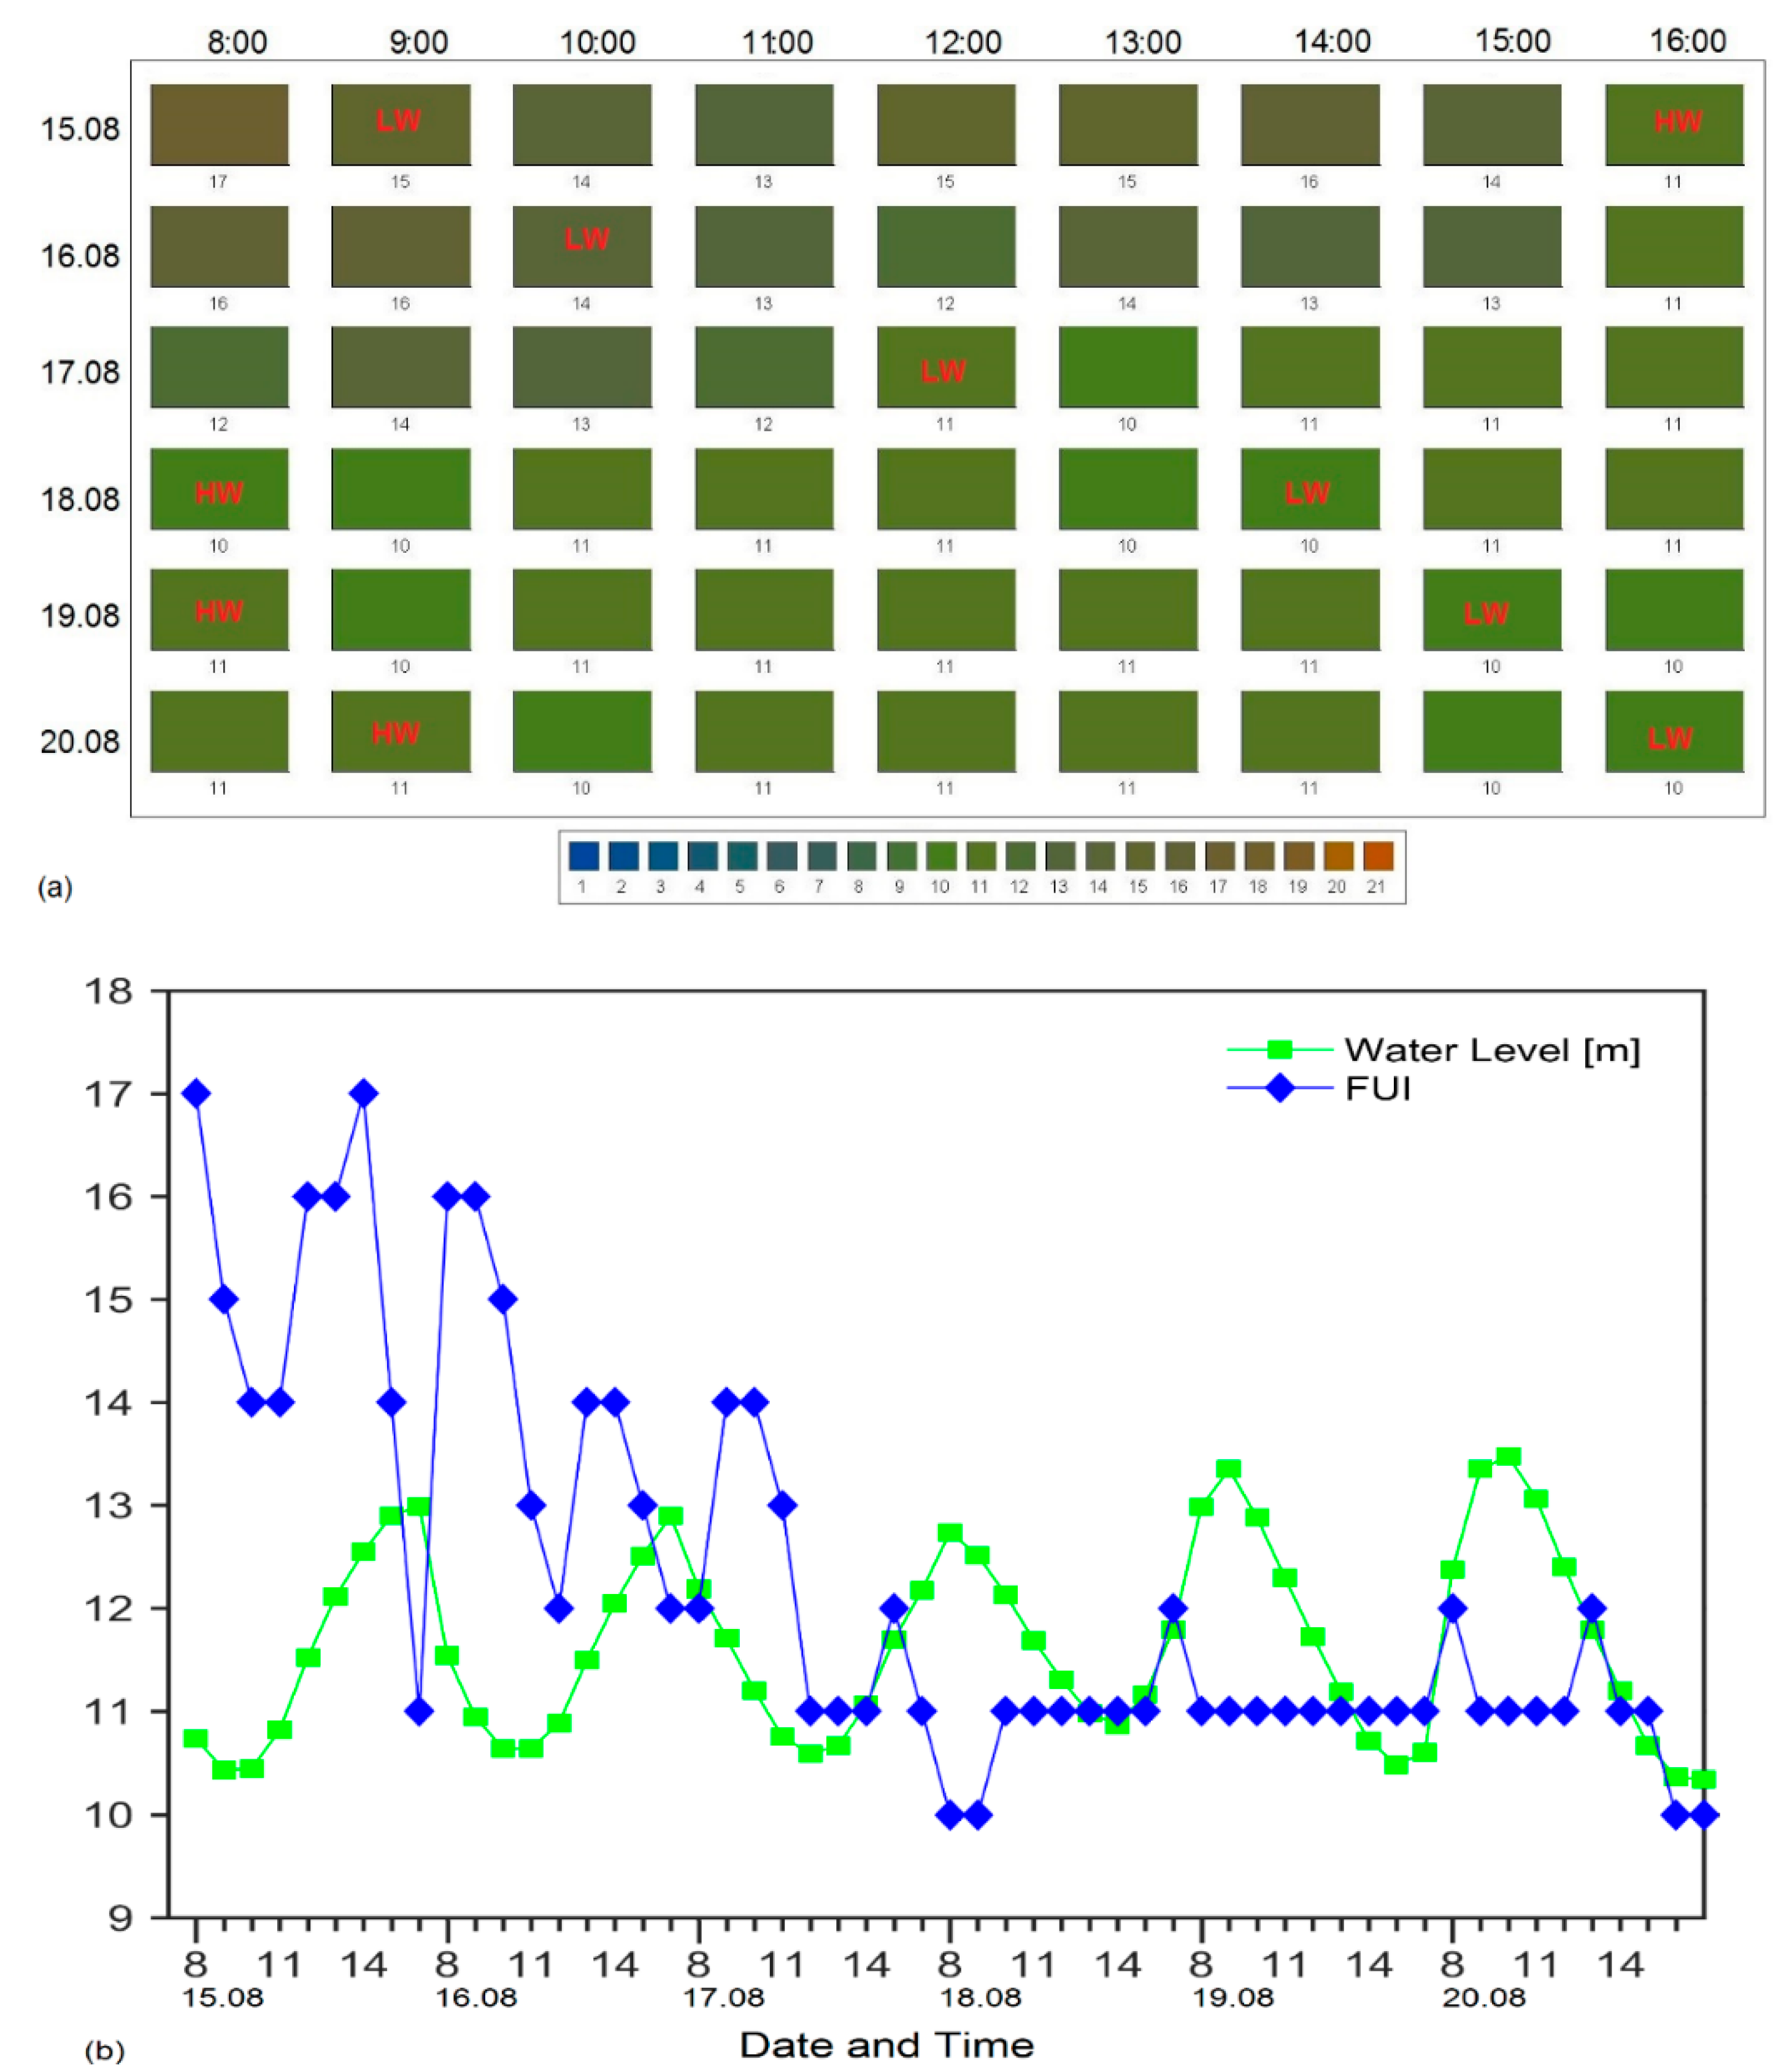
4.2. Monitoring Changes in Colour of Water
4.3. Correlations, Relevance and Limitations of FUI as A Proxy
5. Conclusions and Future Directions

Acknowledgments
Author Contributions
Conflicts of Interest
References
- Garaba, S.P.; Badewien, T.H.; Braun, A.; Schulz, A.-C.; Zielinski, O. Using ocean colour products to estimate turbidity at The Wadden Sea time series station Spiekeroog. J. Eur. Opt. Soc. Rapid Publ. 2014, 9. [Google Scholar] [CrossRef]
- Graham, J.J. Secchi disc observations and extinction coefficients in the central and eastern North Pacific Ocean. Limnol. Oceanogr. 1966, 11, 184–190. [Google Scholar] [CrossRef]
- Monahan, E.C.; Pybus, M.J. Colour, ultraviolet absorbance and salinity of the surface waters off the west coast of ireland. Nature 1978, 274, 782–784. [Google Scholar] [CrossRef]
- IOCCG. Why Ocean Colour? The Societal Benefits of Ocean-Colour Technology; Platt, T., Hoepffner, N., Stuart, V., Brown, C., Eds.; Reports of the International Ocean-Colour Coordinating Group: Dartmouth, NS, Canada, 2008; p. 147. [Google Scholar]
- Garaba, S.P.; Zielinski, O. An assessment of water quality monitoring tools in an estuarine system. Remote Sens. Appl. Soc. Environ. 2015, 2, 1–10. [Google Scholar] [CrossRef]
- Wernand, M.R. Poseidons paintbox: Historical archives of ocean colour in global-change perspective. Ph.D. Thesis, Utrecht University, Utrecht, The Netherlands, 2011. [Google Scholar]
- Tyler, J.E. Colour of the ocean. Nature 1964, 202, 1262–1264. [Google Scholar] [CrossRef]
- Garaba, S.P.; Voß, D.; Zielinski, O. Physical, bio-optical state and correlations in north-western European shelf seas. Remote Sens. 2014, 6, 5042–5066. [Google Scholar] [CrossRef]
- Garaba, S.P.; Zielinski, O. Comparison of remote sensing reflectance from above-water and in-water measurements west of Greenland, Labrador sea, Denmark strait, and west of Iceland. Opt. Express 2013, 21, 15938–15950. [Google Scholar] [CrossRef] [PubMed]
- GCOS. The Global Climate Observing System-Systematic Observation Requirements for Satellite-Based Data Products for Climate: 2011 Update GCOS-154; World Meteorological Organization: Geneva, Switzerland, 2011; p. 138. [Google Scholar]
- Novoa, S.; Wernand, M.R.; van der Woerd, H.J. The modern Forel-Ule scale: A “do-it-yourself” colour comparator for water monitoring. J. Eur. Opt. Soc. Rapid Publ. 2014, 9. [Google Scholar] [CrossRef]
- Prieur, L.; Sathyendranath, S. An optical classification of coastal and oceanic waters based on the specific spectral absorption curves of phytoplankton pigments, dissolved organic matter, and other particulate materials. Limnol. Oceanogr. 1981, 26, 671–689. [Google Scholar] [CrossRef]
- Garaba, S.P.; Zielinski, O. Bio-optical and physical state of high latitude surface waters around south Greenland. In Ocean Optics Conference XXII 2014; The Oceanography Society: Portland, ME, USA, 2014; p. 12. [Google Scholar]
- Koenings, J.P.; Edmundson, J.A. Secchi disk and photometer estimates of light regimes in Alaskan lakes: Effects of yellow color and turbidity. Limnol. Oceanogr. 1991, 36, 91–105. [Google Scholar] [CrossRef]
- Visser, M.P. Secchi disch and sea colour observations in the North Atlantic Ocean during the navado III cruise, 1964–1965, Aboard H. Neth. M.S. “Snellius” (royal Netherlands navy). Neth. J. Sea Res. 1967, 3, 553–563. [Google Scholar] [CrossRef]
- Sakuno, Y. Relationship between water color and transparency in the closed water area based on the chromaticity theory. J. Jpn. Soc. Civ. Eng. 2012, 68. (In Japanese) [Google Scholar] [CrossRef]
- Wernand, M.R.; van der Woerd, H.J.; Gieskes, W.W.C. Trends in ocean colour and chlorophyll concentration from 1889 to 2000, worldwide. PLoS ONE 2013, 8. [Google Scholar] [CrossRef]
- Kirk, J.T.O. Effects of suspensoids (turbidity) on penetration of solar radiation in aquatic ecosystems. Hydrobiologia 1985, 125, 195–208. [Google Scholar] [CrossRef]
- Andersen, C.W. Turbidity (Version 2.1, 9/2005). Available online: http://pubs.water.usgs.gov/twri9A6/ (accessed on 9 December 2015).
- Tyler, J.E. The secchi disc. Limnol. Oceanogr. 1968, 13, 1–6. [Google Scholar] [CrossRef]
- Megard, R.O.; Settles, J.C.; Boyer, H.A.; Combs, W.S. Light, secchi disks, and trophic states. Limnol. Oceanogr. 1980, 25, 373–377. [Google Scholar] [CrossRef]
- Carlson, R.E. A trophic state index for lakes. Limnol. Oceanogr. 1977, 22, 361–369. [Google Scholar] [CrossRef]
- Voß, D.; Garaba, S.; Henkel, R.; Krock, B.; Zielinski, O. Coloured Dissolved Organic Material (CDOM) Absorption Measurements from Samples Collected during The North Sea Coast Harmful Algal Bloom (NORCOHAB II) RV HEINCKE Cruise HE302. PANGAEA—Data Publisher for Earth & Environmental Science, 2010. Available online: http://doi.pangaea.de/10.1594/PANGAEA.754378 (accessed on 11 December 2015).
- Garaba, S.; Henkel, R.; Krock, B.; Voß, D.; Zielinski, O. Forel-Ule Indices from Optical Measurements Collected during The North Sea Coast Harmful Algal Bloom (NORCOHAB II) RV HEINCKE cruise HE302. PANGAEA—Data Publisher for Earth & Environmental Science, 2011. Available online: http://doi.pangaea.de/10.1594/PANGAEA.757080 (accessed on 11 December 2015).
- Zielinski, O.; Voß, D.; Meier, D.; Henkel, R.; Holinde, L.; Garaba, S.P.; Cembella, A. Colored Dissolved Organic Matter during Maria S Merian Cruise MSM21/3 (ARCHEMHAB). PANGAEA—Data Publisher for Earth & Environmental Science, 2013. Available online: http://doi.pangaea.de/10.1594/PANGAEA.810861 (accessed on 11 December 2015).
- Zielinski, O.; Voß, D.; Meier, D.; Henkel, R.; Holinde, L.; Garaba, S.P.; Cembella, A. Water Transparency Measurements with Secchi Disk during Maria S. Merian Cruise MSM21/3 (ARCHEMHAB). PANGAEA—Data Publisher for Earth & Environmental Science, 2013. Available online: http://doi.pangaea.de/10.1594/PANGAEA.810648 (accessed on 11 December 2015).
- Zielinski, O.; Voß, D.; Meier, D.; Henkel, R.; Holinde, L.; Garaba, S.P.; Cembella, A. Physical oceanography during Maria S. Merian cruise MSM21/3 (ARCHEMHAB). PANGAEA—Data Publisher for Earth & Environmental Science, 2013. Available online: http://doi.pangaea.de/10.1594/PANGAEA.819731 (accessed on 11 December 2015).
- Zielinski, O.; Voß, D.; Meier, D.; Henkel, R.; Holinde, L.; Garaba, S.P.; Cembella, A. Forel-Ule Indices Observed during Maria S. Merian Cruise MSM21/3 (ARCHEMHAB). PANGAEA—Data Publisher for Earth & Environmental Science, 2013. Available online: http://doi.pangaea.de/10.1594/PANGAEA.810707 (accessed on 11 December 2015).
- Zielinski, O.; Voß, D.; Meier, D.; Henkel, R.; Holinde, L.; Garaba, S.P.; Cembella, A. Chlorophyll A during Maria S. Merian Cruise MSM21/3 (ARCHEMHAB) PANGAEA—Data Publisher for Earth & Environmental Science, 2013. Available online: http://doi.pangaea.de/10.1594/PANGAEA.810648 (accessed on 11 December 2015).
- Zielinski, O.; Voß, D.; Meier, D.; Henkel, R.; Holinde, L.; Garaba, S.P.; Cembella, A. Total Suspended Matter, Particulate Organic Matter, and Particulate Inorganic Matter during Maria S. Merian Cruise MSM21/3 (ARCHEMHAB). PANGAEA—Data Publisher for Earth & Environmental Science, 2013. Available online: http://doi.pangaea.de/10.1594/PANGAEA.810708 (accessed on 11 December 2015).
- Garaba, S.P.; Zielinski, O. Methods in reducing surface reflected glint for shipborne above-water remote sensing. J. Eur. Opt. Soc. Rapid Publ. 2013, 8. [Google Scholar] [CrossRef]
- Wernand, M.R.; van der Woerd, H.J. Spectral analysis of the Forel-Ule ocean colour comparator scale. J. Eur. Opt. Soc. Rapid Publ. 2010, 5. [Google Scholar] [CrossRef]
- Novoa, S.; Wernand, M.; van der Woerd, H.J.W. A generic algorithm to derive the intrinsic color of natural waters from digital images. Limnol. Oceanogr. Methods 2015. [Google Scholar] [CrossRef]
- Arar, E.J.; Collins, G.B. Method 445.0: In Vitro Determination of Chlorophyll A and Pheophytin A in Marine and Freshwater Algae by Fluorescence; U.S. Environmental Protection Agency: Cincinnati, OH, USA, 1997. [Google Scholar]
- Wernand, M.R.; Hommersom, A.; van der Woerd, H.J. Meris-based ocean colour classification with the discrete Forel–Ule scale. Ocean Sci. 2013, 9, 477–487. [Google Scholar] [CrossRef]
- CITCLOPS. Citizens’ Observatory for Coast and Ocean Optical Monitoring. European Commission (Grant Agreement Number fp7–env-2012-308469). Available online: http://www.citclops.eu/ (accessed on 9 December 2015).
- Boyce, D.G.; Lewis, M.; Worm, B. Integrating global chlorophyll data from 1890 to 2010. Limnol. Oceanogr. Methods 2012, 10, 840–852. [Google Scholar] [CrossRef]
- Morel, A. Bio-optical models. In Encyclopedia of Ocean Sciences; John, H.S., Ed.; Academic Press: Oxford, UK, 2001; pp. 317–326. [Google Scholar]
- Zielinski, O.; Busch, J.A.; Cembella, A.D.; Daly, K.L.; Engelbrektsson, J.; Hannides, A.K.; Schmidt, H. Detecting marine hazardous substances and organisms: Sensors for pollutants, toxins, and pathogens. Ocean Sci. 2009, 5, 329–349. [Google Scholar] [CrossRef]
- Van der Woerd, H.; Wernand, M. True colour classification of natural waters with medium-spectral resolution satellites: SeaWiFS, MODIS, MERIS and OLCI. Sensors 2015, 15. [Google Scholar] [CrossRef]
- Megard, R.O.; Berman, T. Effects of algae on the secchi transparency of the Southeastern Mediterranean Sea. Limnol. Oceanogr. 1989, 34, 1640–1655. [Google Scholar] [CrossRef]
- Lewis, M.R.; Kuring, N.; Yentsch, C. Global patterns of ocean transparency: Implications for the new production of the open ocean. J. Geophys. Res. Oceans 1988, 93, 6847–6856. [Google Scholar] [CrossRef]
- Falkowski, P.G.; Wilson, C. Phytoplankton productivity in the North Pacific Ocean since 1900 and implications for absorption of anthropogenic CO2. Nature 1992, 358, 741–743. [Google Scholar] [CrossRef]
- Preisendorfer, R.W. Secchi disk science: Visual optics of natural waters. Limnol. Oceanogr. 1986, 31, 909–926. [Google Scholar] [CrossRef]
- Novoa, S.; Wernand, M.R.; van der Woerd, H.J. The Forel-Ule scale revisited spectrally: Preparation protocol, transmission measurements and chromaticity. J. Eur. Opt. Soc. Rapid Publ. 2013, 8. [Google Scholar] [CrossRef]
- Carling, B. A new way of measuring phytoplankton. Mar. Sci. 2013, 43, 14–17. [Google Scholar]
© 2015 by the authors; licensee MDPI, Basel, Switzerland. This article is an open access article distributed under the terms and conditions of the Creative Commons by Attribution (CC-BY) license (http://creativecommons.org/licenses/by/4.0/).
Share and Cite
Garaba, S.P.; Friedrichs, A.; Voß, D.; Zielinski, O. Classifying Natural Waters with the Forel-Ule Colour Index System: Results, Applications, Correlations and Crowdsourcing. Int. J. Environ. Res. Public Health 2015, 12, 16096-16109. https://doi.org/10.3390/ijerph121215044
Garaba SP, Friedrichs A, Voß D, Zielinski O. Classifying Natural Waters with the Forel-Ule Colour Index System: Results, Applications, Correlations and Crowdsourcing. International Journal of Environmental Research and Public Health. 2015; 12(12):16096-16109. https://doi.org/10.3390/ijerph121215044
Chicago/Turabian StyleGaraba, Shungudzemwoyo P., Anna Friedrichs, Daniela Voß, and Oliver Zielinski. 2015. "Classifying Natural Waters with the Forel-Ule Colour Index System: Results, Applications, Correlations and Crowdsourcing" International Journal of Environmental Research and Public Health 12, no. 12: 16096-16109. https://doi.org/10.3390/ijerph121215044