Article

Comparison of Highly Resolved Model-Based Exposure Metrics for Traffic-Related Air Pollutants to Support Environmental Health Studies

1
Institute for the Environment, University of North Carolina at Chapel Hill, 100 Europa Drive, Suite 490, Chapel Hill, NC 27517, USA
2
Department of Environmental Sciences and Engineering, University of North Carolina at Chapel Hill, Chapel Hill, NC 27599, USA
3
National Exposure Research Laboratory, U.S. Environmental Protection Agency, 109 T.W. Alexander Drive, Research Triangle Park, NC 27711, USA
*
Author to whom correspondence should be addressed.
Int. J. Environ. Res. Public Health 2015, 12(12), 15605-15625; https://doi.org/10.3390/ijerph121215007
Submission received: 23 October 2015 / Revised: 26 November 2015 / Accepted: 1 December 2015 / Published: 8 December 2015

Abstract

:
Human exposure to air pollution in many studies is represented by ambient concentrations from space-time kriging of observed values. Space-time kriging techniques based on a limited number of ambient monitors may fail to capture the concentration from local sources. Further, because people spend more time indoors, using ambient concentration to represent exposure may cause error. To quantify the associated exposure error, we computed a series of six different hourly-based exposure metrics at 16,095 Census blocks of three Counties in North Carolina for CO, NOx, PM2.5, and elemental carbon (EC) during 2012. These metrics include ambient background concentration from space-time ordinary kriging (STOK), ambient on-road concentration from the Research LINE source dispersion model (R-LINE), a hybrid concentration combining STOK and R-LINE, and their associated indoor concentrations from an indoor infiltration mass balance model. Using a hybrid-based indoor concentration as the standard, the comparison showed that outdoor STOK metrics yielded large error at both population (67% to 93%) and individual level (average bias between −10% to 95%). For pollutants with significant contribution from on-road emission (EC and NOx), the on-road based indoor metric performs the best at the population level (error less than 52%). At the individual level, however, the STOK-based indoor concentration performs the best (average bias below 30%). For PM2.5, due to the relatively low contribution from on-road emission (7%), STOK-based indoor metric performs the best at both population (error below 40%) and individual level (error below 25%). The results of the study will help future epidemiology studies to select appropriate exposure metric and reduce potential bias in exposure characterization.

1. Introduction

Accurate exposure estimation for air pollutants is essential for environmental health studies. In these studies, exposure to air pollutants are often estimated based on ambient concentration level [1,2,3,4]. Ambient concentration collected from fixed-site monitors, for example, provides regional concentration and can be used to determine inter-city difference [5]. Fixed-site monitors, however, are often spatially limited and thus are more suitable for pollutants that are distributed homogenously across space. For pollutants with local sources such as on-road vehicular emission, the data from fixed-site monitors can fail to capture the intra-urban variation [6] resulting in exposure misclassification [7].
A more accurate method for estimating personal exposure is with direct measurement using personal sampling devices [8,9]. For example, Delfino et al. [10] compared the association between the reduction in forced expiratory volume in the first second (FEV1) of asthmatic children and four particulate matter (PM) exposure metrics: personal sampling device, indoor concentration at home, outdoor concentration at home, and data from central monitor. The results showed that the reduction in FEV1 is more strongly associated with personal PM exposure or concentration collected indoor at home than concentration collected at a central monitoring site or outdoor concentration at home. Although personal sampling devices can best represent total exposure, they are costly and introduce participant burden for individuals in health studies. For example, a health study conducted in North Carolina, called the Coronary Artery Disease and Environmental Exposure (CADEE), investigated the relationship between personal exposure to multiple air pollutants and adverse health effects. In CADEE, instead of a personal sampling device, the participants wore a personal global positioning system (GPS) device to track their geographical location. To estimate individual exposure with their geographical information, an accurate concentration field is required.
One approach that could be used in the CADEE study is the use of model-based exposure metrics that are less costly and that can cover a wider spatial domain. These exposure metrics can be obtained from various approaches such as space-time kriging, air quality modeling, and land use regression. These approaches, when compared to fixed-site monitors, can increase the potential in predicting intra-urban spatial variability. Space-time kriging technique interpolates observational data to provide spatiotemporally refined concentrations [11,12]. These estimated concentrations can then be used to relate to adverse health effects [13,14,15]. Nevertheless, studies have found that the accuracy of space-time kriging is affected by the location of the available monitors. When estimated locations are far away from the monitors, the resultant concentration estimate is less accurate [16]. Further, space-time kriging may fail to locate the concentration hotspot without adequate monitors for pollutants with local sources, such as on-road vehicular emission that decays to background level within a few hundred meters from roadways [17]. To capture these pollutants, other approaches such as land use regression [18,19] or air quality models [20,21] at a fine spatial resolution are needed.
Although ambient concentration is widely used in health studies as an exposure metric, certain studies have found that indoor concentrations would be a better exposure metric due to time spent indoors [8,9,10]. The Windsor, Ontario Exposure Assessment study has shown that children spend on average more than 67% of their time indoors and receive more than 50% of their PM2.5 exposure while indoors [22]. Also, previous studies have pointed out that the variation of air exchange rate (the rate that indoor air is exchanged with outdoor air) can further explain the difference in ozone mortality coefficient across cities [23] and acute air pollution-related morbidity [24] than using outdoor air pollutant concentration from central monitoring sites alone. The approaches for modeling indoor concentration have been developed and evaluated [25,26,27] primarily for subject-specific health study [28]. To our knowledge, these approaches have not been used to provide spatial and temporally refined estimates for predicting personal exposure because house-by-house information required for predicting air exchange rate (AER) is difficult to obtain in a large domain without house-by-house survey.
This paper develops model-based exposure metrics during the CADEE study period so they can be applied for the epidemiologic analysis in the future, taking advantages of the GPS data. Exposure metrics calculated using the “traditional way” were compared with an alternative method. We used public accessible data to gather information required to compute hourly AER at Census block level. These highly resolved AER are than combined with regional background estimates, on-road emissions, and indoor infiltration to create highly resolved indoor concentration field. Our modeling approach complements population-level exposure models (e.g., Stochastic Human Exposure and Dose Simulation (SHEDS) [29], Air Pollutants Exposure Model (APEX) [30,31]), which predict distributions reflecting exposure variability for demographic groups (e.g., school-age children) rather than for specific individuals by using population-level inputs from other studies [29]. We compare these exposure metrics to determine the advantage of providing more details in exposure characterization and quantify the potential exposure error if using a lower tier of exposure metric.

2. Experimental Section

2.1. Study Design

This analysis focused on three Counties (Durham, Orange, and Wake) in NC that contain two major cities (Durham and Raleigh) and some rural areas (Figure S1), which matched the spatial domain of the CADEE health study. To avoid the exposure misclassification associated with coarse modeling resolution [32,33], hourly concentration were modeled at Census block centroids, resulting in a total of 16,095 concentration receptors. Outdoor and indoor concentrations during the year of 2012 were modeled for PM2.5, elemental carbon (EC), CO, and NOx on an hourly or daily basis. We computed six exposure metrics including: (1) outdoor STOK: outdoor background concentration from space-time ordinary kriging (STOK); (2) indoor STOK: STOK-based indoor concentration; (3) outdoor on-road: outdoor on-road concentration using Research LINE source dispersion model (R-LINE); (4) indoor on-road: on-road-based indoor concentration; (5) outdoor hybrid: outdoor hybrid concentration combing outdoor background and on-road concentration; and (6) indoor hybrid: hybrid-based indoor concentration. The metrics and description is summarized in Table 1. The details for each metric are described in the sections below. We compared the spatial and temporal variability between the six exposure metrics and quantified the potential exposure error at both the population and individual level using the sixth metric as the standard.
Table 1. Exposure metrics included in this study.
MetricDescription
Outdoor metrics
 Outdoor STOKBackground concentration obtained from STOK.
 Outdoor on-roadConcentration from on-road vehicular emission modeled with R-LINE.
 Outdoor hybridSummation of outdoor STOK and outdoor on-road
Indoor metrics
 Indoor STOKIndoor concentration obtained from Equation (1) using outdoor STOK as input
 Indoor on-roadSame as above using outdoor on-road as input
 Indoor hybridSame as above using outdoor hybrid as input

2.2. Outdoor Background Concentration

We used space-time ordinary kriging (STOK) to estimate background concentration. STOK uses available monitoring data from U.S. Environmental Protection Agency’s (EPA) Air Quality System (AQS) to interpolate observational data at Census-block centroids. This technique assumes that the concentration value at each estimation point is a linear combination of nearby “hard data” (i.e., the observational data). The linear combination, also known as kriging weight, is determined by minimizing the estimation variance while satisfying the unbiased constraint. The STOK technique is implemented with BMElib (Bayesian Maximization Entropy library) [34]. A detailed description of the STOK algorithm, which was developed and applied for the Near-road Exposures to Urban Air Pollutants Study (NEXUS) [28] in Detroit, Michigan to obtain regional background concentrations can be found in Arunachalam et al. [12].
STOK estimates the concentration based on the spatial and temporal covariance between concentrations obtained from different monitoring sites [35]. To obtain a meaningful covariance, the distance between each monitor needs to cover a wide spatial range (from near to far). Due to the limited amount of available monitors in the three-county region in NC, we included monitors in surrounding counties and States for STOK estimation. As a result, for CO, NOx, PM2.5, and EC, there were 48, 33, 103 and 27 available monitors. For EC, since only daily concentration is available, the background concentration is also estimated for a corresponding daily period. For CO, NOx, and PM2.5, the estimation is hourly.

2.3. Outdoor on-Road Concentration

We predicted concentration from on-road vehicles using R-LINE [36]. R-LINE is a line source dispersion model that treats roadways as line sources and deploys new formulations for horizontal and vertical plume spread to address the under-prediction in maximum concentration under meteorologically neutral and stable condition [37]. R-LINE requires various inputs including emission, receptor location, and meteorological data.
For developing emission inputs for R-LINE, we adopted a “bottom-up” approach [21] to develop the emission from roadways. The roadway information was collected from Federal Highway Administration’s (FHWA) Freight Analysis Framework version 3 (FAF3) [38], which contains primary and secondary roadways including data on vehicle speed, vehicle type, and annual average daily traffic (AADT) for all vehicles (including passenger and commercial vehicles). Because FAF3 does not provide temporally resolved traffic activity data, temporal allocation factors from EPA’s National Emission Inventory (NEI) were used to allocate AADT to hourly level. This hourly resolved traffic volume was then combined with MOtor Vehicle Emission Simulator (MOVES 2010b) emission factor tables by matching vehicle speed, vehicle type, and road type to calculate emissions. Detailed description about the datasets used to develop emissions inputs for R-LINE can be found in another recent study by the authors [39].
The meteorological data were collected from four nearby National Weather Service (NWS) stations: Raleigh Durham International airport, Rocky Mount-Wilson airport, Chapel Hill Horace Williams airport, and Burlington-Alamance airport. We used AERMINUTE to process 1-min wind speed data from these stations, followed by American Meteorological Society/Environmental Protection Agency Regulatory Model (AERMOD) meteorological processor AERMET (version 14134) to provide necessary meteorological inputs for the dispersion calculations. The receptors were set at Census block centroids within the modeling domain. Each centroid was mapped to the four NWS stations and the site that yielded the shortest distance was chosen to provide meteorological information. Therefore, there are a total of four receptor groups. For each receptor group, all primary and secondary roadways within 50 km were included as emission source.

2.4. Outdoor Hybrid Concentration

We combined the outdoor background concentration (from STOK) and outdoor on-road concentration (from R-LINE) to calculate a spatially and temporally refined concentration field in the three-County region. The background concentration in this study was defined as the regional concentration that would be measured if local sources were zeroed out. Therefore, it is not influenced by local sources but represents a large-scale overall pattern. A similar approach was used in U.S. EPA’s National Air Toxics Assessments (NATA) [40] where observations from AQS sites were used to provide background, and wherein, the quality of the collected ambient monitoring data was used to determine background concentration in three slightly different ways. The method to obtain hybrid concentrations is similar to another study by the same authors [39]. The local source we considered in this study was on-road mobile sources, which have great variation in emissions and is influenced by the meteorology at a local scale. The sum of outdoor background concentration and outdoor on-road concentration were computed hourly at Census block centroids. Note that, because EC only has daily background concentration, the hourly resolution feature is from on-road concentration alone.

2.5 Indoor Concentration and Air Exchange Rate

We used a mass balance differential equation [27] to describe the change in indoor concentration:
d C i n d t = P × A E R × C o u t ( A E R + k d ) × C i n
where Cout and Cin are the outdoor concentration and indoor concentration in μg/m3, t is time in hour (h), P is the dimensionless penetration factor, kd is the deposition rate in h−1. The first term of the equation (P × AER × Cout) represents the penetration process from outdoor to indoor and the second term ((AER + kd) × Cin) represents the removal of indoor concentration by AER and indoor deposition. The penetration factor and deposition rate for each pollutant were set to reported literature values shown in Table 2. For the three outdoor concentrations (background, on-road, and hybrid), we used Equation (1) to calculate their corresponding indoor concentration. Because on-road concentration varies substantially across time, we used the dynamic mass balance model (Equation (1)) rather than assuming steady state conditions [41].
We used MATLAB’s (version R2013a, MathWorks Inc., Natick, MA, USA) differential equation solver, ode15s, to solve Equation (1) to obtain indoor concentration. The solver was set to report the indoor concentration for each hour. For each hour, the indoor concentration from the previous hour was used as the initial value. The initial indoor concentration for the first hour was assumed to be zero. This causes only a modest impact on the analysis because the model is stabilized within the first two to three hours. There were three types of outdoor concentration for Equation (1): STOK, on-road, and hybrid. For each type of outdoor concentration, Equation (1) was used to obtain the corresponding indoor concentration.
Table 2. Penetration factor P and deposition rate kd.
PollutantPenetration FactorDeposition Rate (h−1)Source
CO10Dionisio et al. [42]
NOx10.5Weschler et al. [43]
PM2.50.840.21Breen et al. [44]
EC0.980.29Meng et al. [45]
We calculated hourly AER for 10 randomly sampled houses within each Census block, and then averaged them to represent that Census block. The AER was computed using the mechanistic Lawrence Berkeley Laboratory (LBL) AER model [46]. The LBL model assumes the building to be a single and well-mixed compartment [47]. The LBL model calculates the airflow rate as:
Q i n f = A i n f k s | T i n T o u t | + k w U 2
where Qinf is the airflow rate in L/h, Ainf is the effective air leakage area (in cm2), ks is the stack coefficient in ( L s ) 2 ( c m 4 K ) , kw is the wind coefficient ( L s ) 2 ( c m 4 ( m s ) 2 ) , Tin and Tout are the indoor and outdoor temperatures in °C, and U is the wind speed in m/s. The AER is calculated as:
A E R = Q i n f V
where V is the house volume in L.
We followed Breen et al. [46] to determine the input parameters of Equation (2). Breen et al. [46] compared AER predictions to data from 642 daily AER measurements across 31 detached homes during each of four seasons in central North Carolina. For individual model-predicted and measured AER, the median absolute difference was 43% (0.17 h−1) [44]. ks and kw were set to reported literature values based on house-specific information including house height and local sheltering (Tables S1 and S2). Tout and U were obtained from the NWS sites as described in the outdoor on-road concentration section. Tin was set at 23.6 °C, which is the average indoor temperature measured in this region from Breen et al. (2010) [46].
To determine Ainf, we used a leakage area model, which was previously evaluated in another study [48] and was found to perform well with fewer input parameters, because information on air leakage through floors is not available. Ainf is calculated as:
A i n f = N L N F
where NL is the normalized leakage and NF is the normalization factor (cm−2). The NL is dimensionless and was calculated based on a regression model with construction year and floor area as predicting variable. The NL is calculated as:
N L = exp ( β 0 + β 1 Y b u i l t + β 2 A f l o o r )
where Ybuilt is construction year and Afloor is the floor area in m2. β0, β1 and β2 are the regression parameters, which were set at literature reported values for low-income homes (β0 = 11.1, β1 = −5.37 × 10⁻³, and β2 = −4.18 × 10⁻³ m−2) and conventional homes (β0 = 20.7, β1 = −1.07 × 10⁻², and β2 = −2.20 × 10⁻³ m−2). As previously reported, the NL model was fit to a national database of leakage areas for 70,000 homes across 30 states in the Midwest (most-sampled region), West, South, and Northeast (least-sampled region), which included residences with household incomes below 125% of the poverty guideline [48]. The parameters were estimated by Chan et al. [48] from homes built between 1895 and 2000, which is similar to the homes in this study that were built between 1700 and 2015. The NF is calculated as:
N F = 1000 A f l o o r ( H 2.5 ) 0.3
where H is the building height in meters.
Equations (2)–(6) require inputs including H, Afloor, and Ybuilt. Further, the required parameters (ks, kw, β0, β1, and β2) need to be determined by additional information including household income, shelter class, and number of stories. To obtain Afloor and Ybuilt, we relied on the three Counties’ real estate property data. Because the real estate property data also include apartments, for which the LBL doesn’t apply, we remove buildings with floor area greater than 7000 square feet (possible multiunit apartments), resulting in approximately 370,000 houses in the modeling domain. H was calculated based on number of stories, where each story was assumed to be 2.5 m and adding an additional 0.5 m for roof space. The number of stories is reported in the real estate property data of Wake County but not for Durham and Orange Counties. For these two Counties, we followed Chan et al. [48] to set houses with floor area less than 1000 m2 at one story and those greater at two stories. This uncertainty does not constitute a large source of error in estimating NL, because NL only varies in proportion to H0.3 [48]. The household income distribution was obtained from the U.S. Census Bureau’s American Community Survey (ACS) 2013 [49]. Because this dataset only contains household income distribution at Census block group level, we calculated the fraction of houses below 125% of poverty line within each Census block group then randomly sample from this fraction to determine the household income status for a sampled house. The shelter class for each sampled house was determined based on the house density of each Census block. The house density for each Census block was calculated and the cutoff values for each shelter class were determined from aerial and street-level images in Google map’s satellite view. The cutoff density is summarized in Table S3.

2.6. Data Analysis

For each exposure metric, we computed the normalized difference and normalized absolute difference to represent individual exposure difference using hybrid-based indoor concentration as standard. The normalized difference was defined as:
N D = C x C s C s × 100 %
where ND is normalized difference, CX is the lower tiered exposure metrics, and Cs is the standard exposure metric (hybrid-based indoor concentration). Normalized absolute difference (NAD) was defined as:
N A D = | C x C s | C s × 100 %
We calculated both ND and NAD since ND indicates the direction of bias (i.e., overestimation or underestimation), whereas NAD indicates the magnitude of deviation. To compare the temporal and spatial variability of different exposure metrics across pollutants, we computed the coefficient of variation (CV), which was defined as:
C V = σ μ
where σ is the standard deviation of concentration and μ is the mean concentration [7]. CV is a dimensionless indicator that normalized the variation from the effect of concentration magnitude for different pollutant. The higher the CV, the higher the degree of variability is in concentration. The temporal CV was defined as the CV calculated across hours, with one temporal CV for each Census block (n = 16,095) for each pollutant and each metric. The spatial CV was defined as the CV calculated across Census blocks, with one spatial CV for each hour (n = 8784) for each pollutant and each metric.

3. Results

To assess the impact from the additional parameters (on-road component and indoor infiltration) on STOK, we present our data considering one parameter at a time in each of the first three sub-sections below. In Section 3.2 and Section 3.3, we summarize the potential exposure error at population and individual level. Given the multiple models and pollutants discussed below, we have underscored the phrases: outdoor STOK, outdoor on-road, outdoor hybrid, indoor STOK, indoor on-road and indoor hybrid, and italicized the statistical indicators (spatial CV, temporal CV, ND, and NAD) and the pollutant names (CO, NOx, PM2.5 and EC) throughout this section, for ease of readability.

3.1. The Effect of on-Road Component
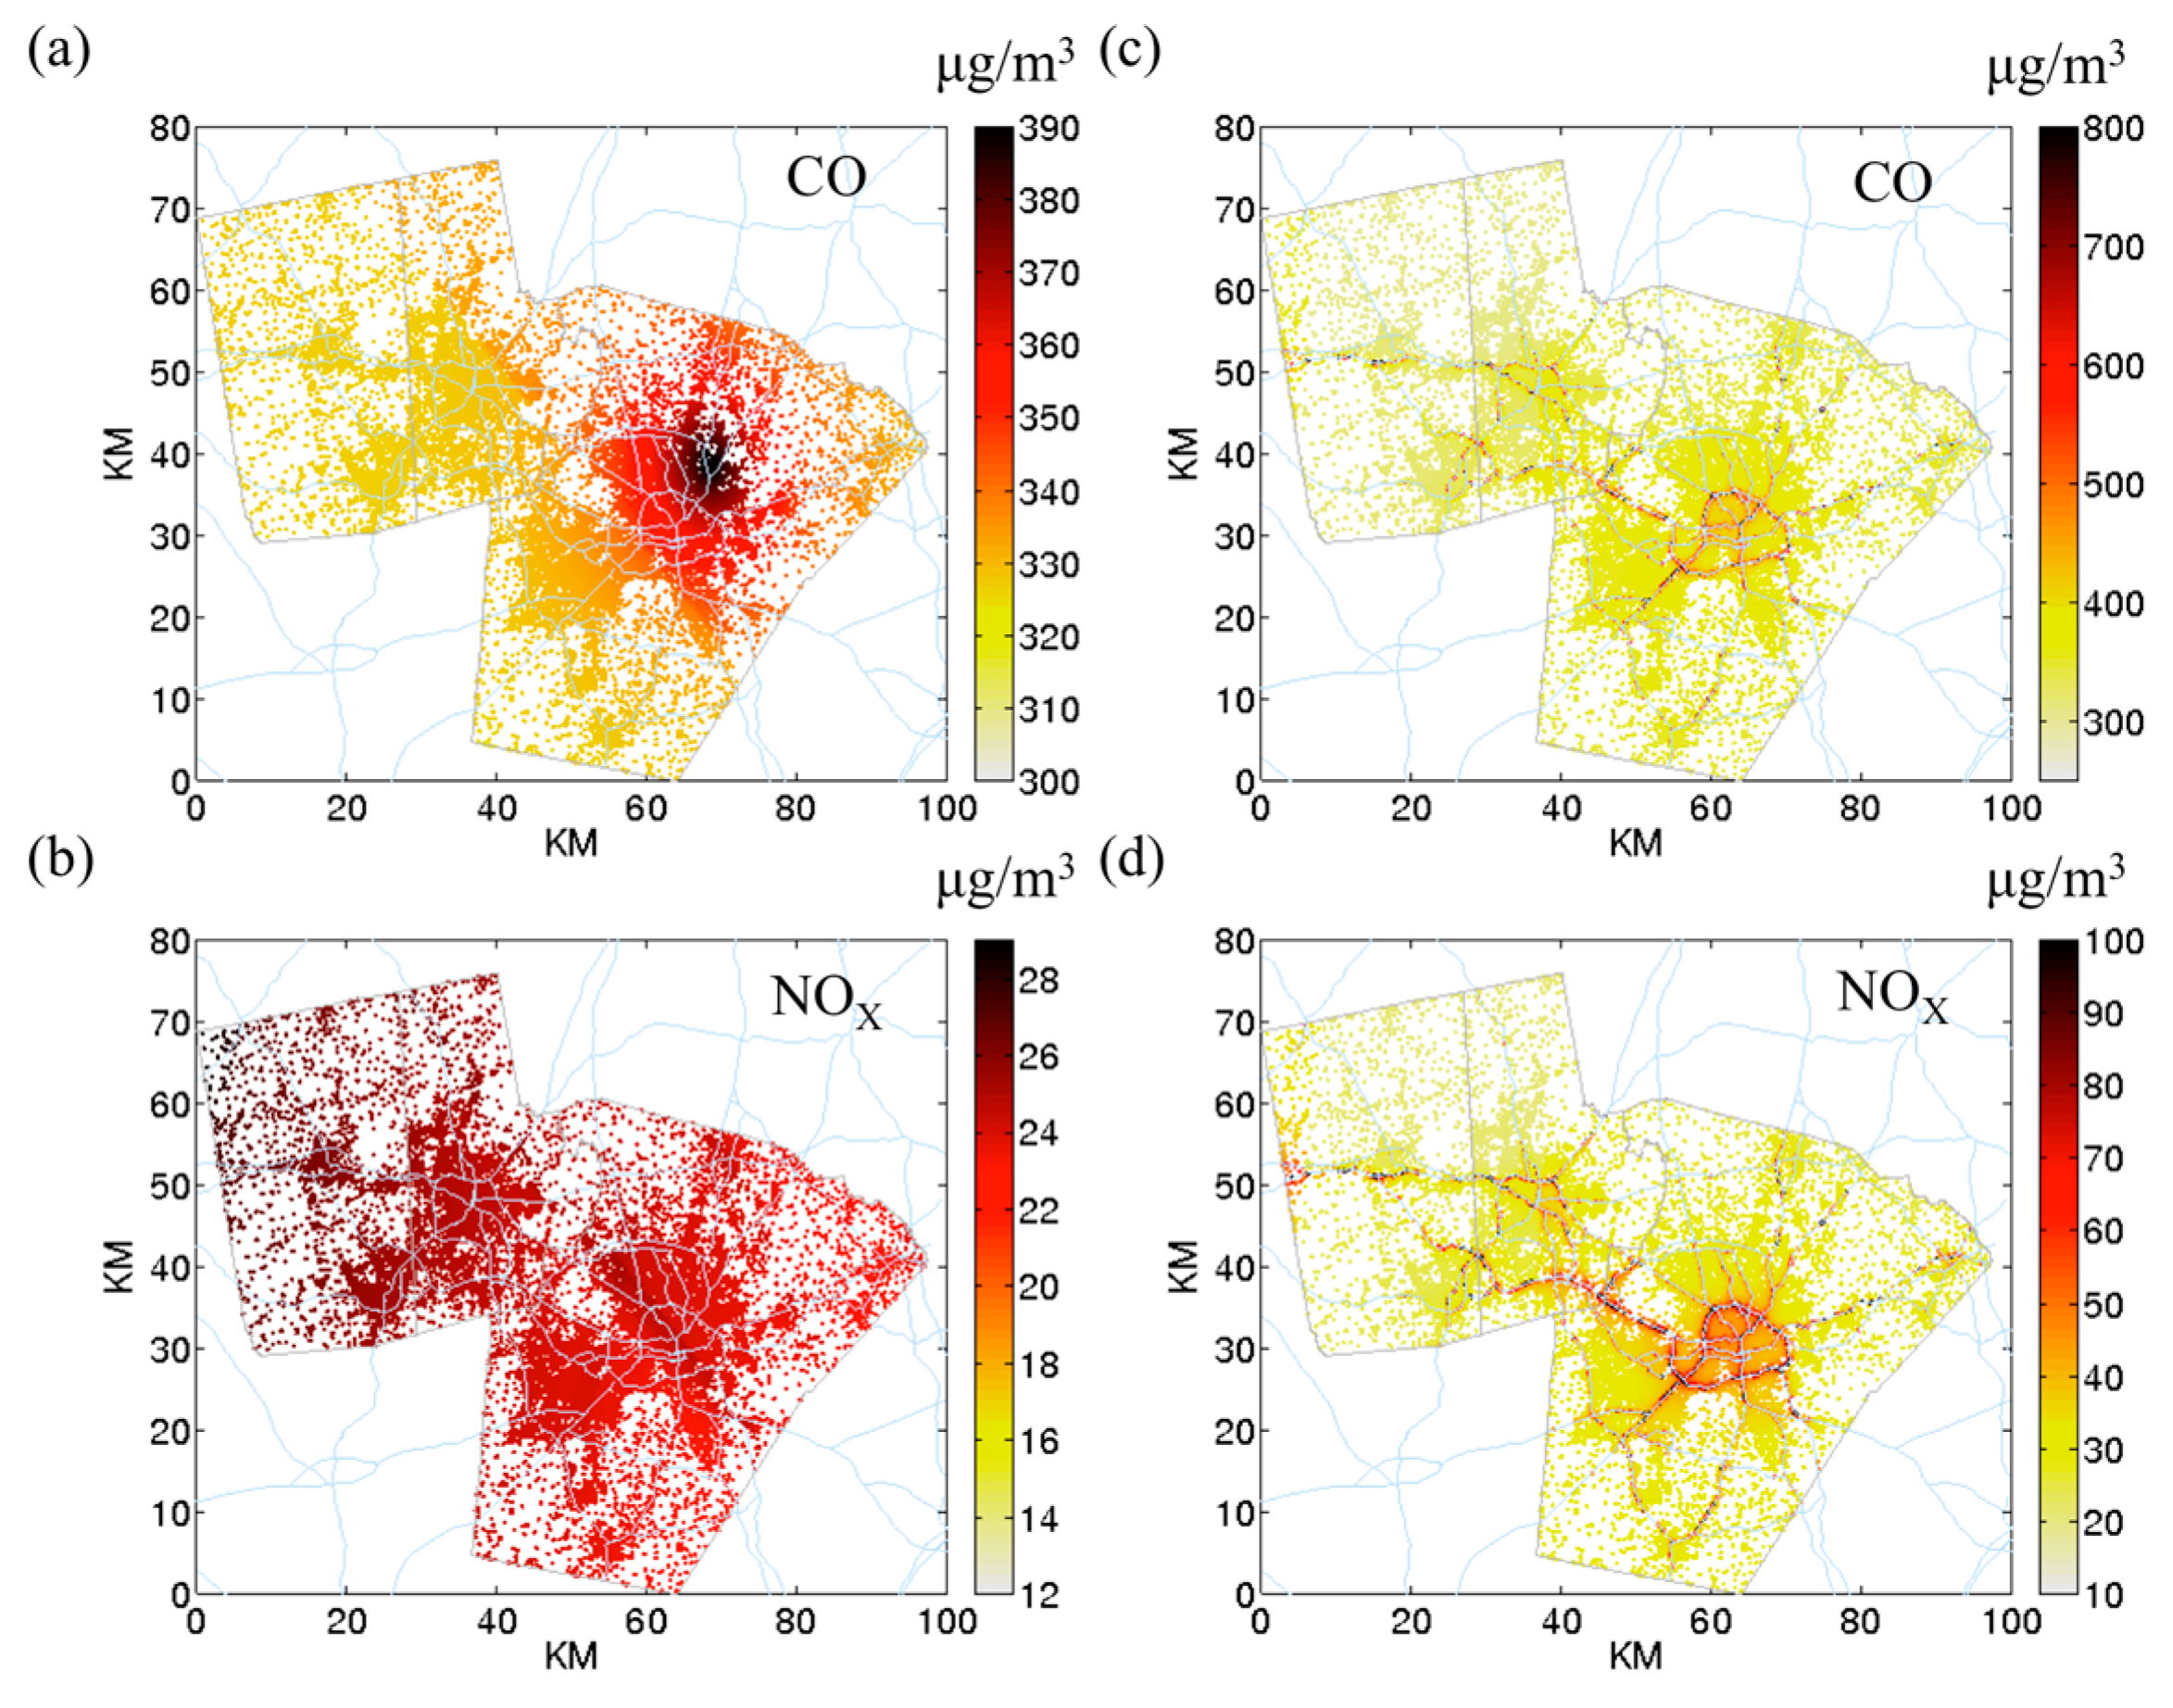
Figure 1 shows the outdoor STOK and outdoor hybrid concentration maps for CO (Figure 1a,c) and NOx (Figure 1b,d) at Census block centroids for four different metrics. We presented morning traffic peak hour (07:00) because the on-road contribution is the greatest. At 07:00, concentration from roadways is clearly seen with outdoor hybrid (Figure 1c,d) but not outdoor STOK (Figure 1a,b). Note the color scale is different among the four figures to properly display the data. STOK cannot capture the near road concentrations because there is a limited amount of available monitors in this region. Further, the location of monitors is crucial for STOK to estimate the concentration. CO has a “kriging island” (i.e., a concentration hotspot surrounding a monitor, Figure 1a) but not for NOx (Figure 1b).
Figure 1. Outdoor concentration of CO and NOx at Census block centroids at 07:00. (a) CO outdoor space-time ordinary kriging (STOK); (b) NOx outdoor STOK; (c) CO outdoor hybrid; (d) NOx outdoor hybrid. The color bar represents concentration in μg/m3. (Note that the color scale is different for the four figures to emphasize the concentration ranges that vary by pollutant).
Ijerph 12 15007 g001
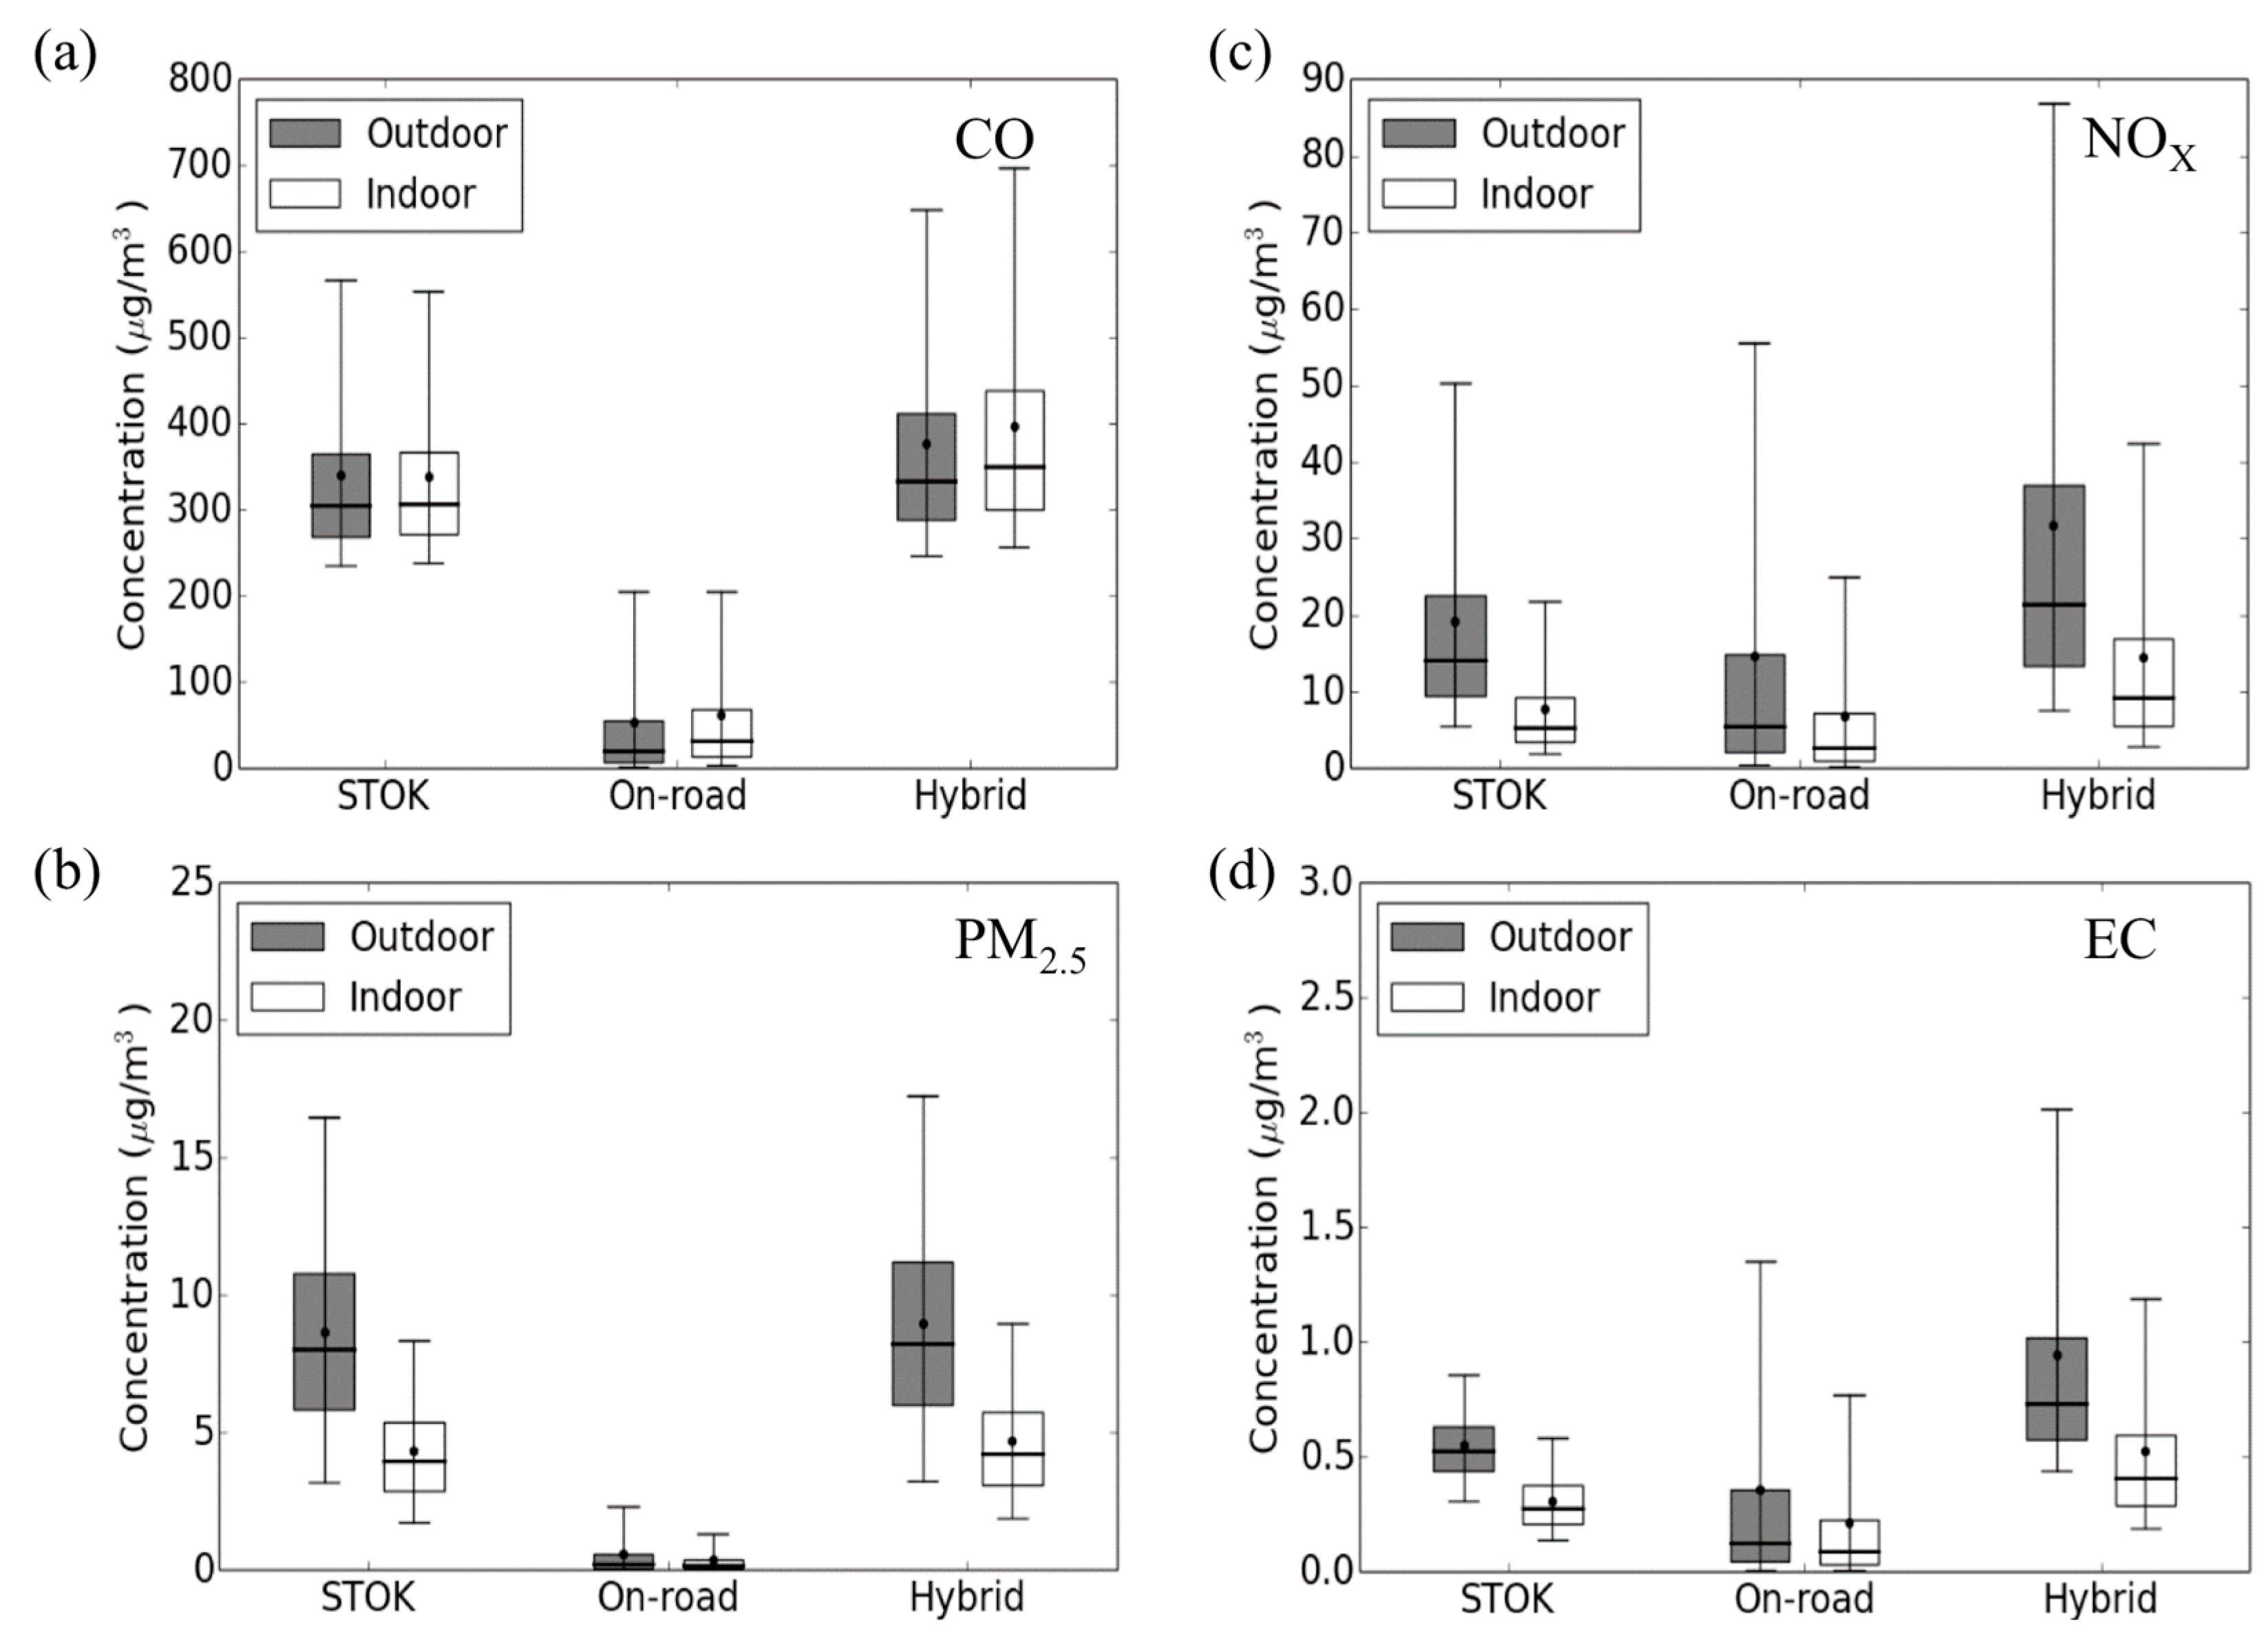
Figure 2 shows the hourly concentration boxplot for the four pollutants under different exposure metrics. For outdoor CO and PM2.5, the major contributor to the outdoor hybrid is the outdoor STOK. For CO (Figure 2a), the average outdoor STOK (340.45 μg/m3) is 6.23 times higher than the average outdoor on-road (54.67 μg/m3). For PM2.5 (Figure 2b), the average outdoor STOK (8.69 μg/m3) is 14.02 times higher than the average outdoor on-road (0.62 μg/m3). For these two pollutants, because the outdoor STOK dominates the hybrid concentration, the outdoor hybrid is less different from the outdoor STOK concentration.
For NOx and EC, both outdoor STOK and outdoor on-road contribute significantly to the outdoor hybrid. For NOx (Figure 2c), although the average outdoor STOK (19.24 μg/m3) is 32% higher than the outdoor on-road (14.63 μg/m3), the upper 95% bound of outdoor on-road (55.6 μg/m3) is 10% higher than the outdoor STOK (50.33 μg/m3). For EC (Figure 2d), the average outdoor STOK (0.55 μg/m3) is 52% higher than the outdoor on-road (0.36 μg/m3) but the upper 95% bound of outdoor on-road (1.35 μg/m3) is 57% higher than the outdoor STOK (0.86 μg/m3). As a result, for these two pollutants, the average outdoor hybrid is 65% and 72% higher than the average outdoor STOK for NOx and EC.
As shown in Figure 1 and the wider range for the outdoor hybrid compared to outdoor STOK in Figure 2 (dark boxes), adding the outdoor on-road introduces different spatial variability for different pollutants. 
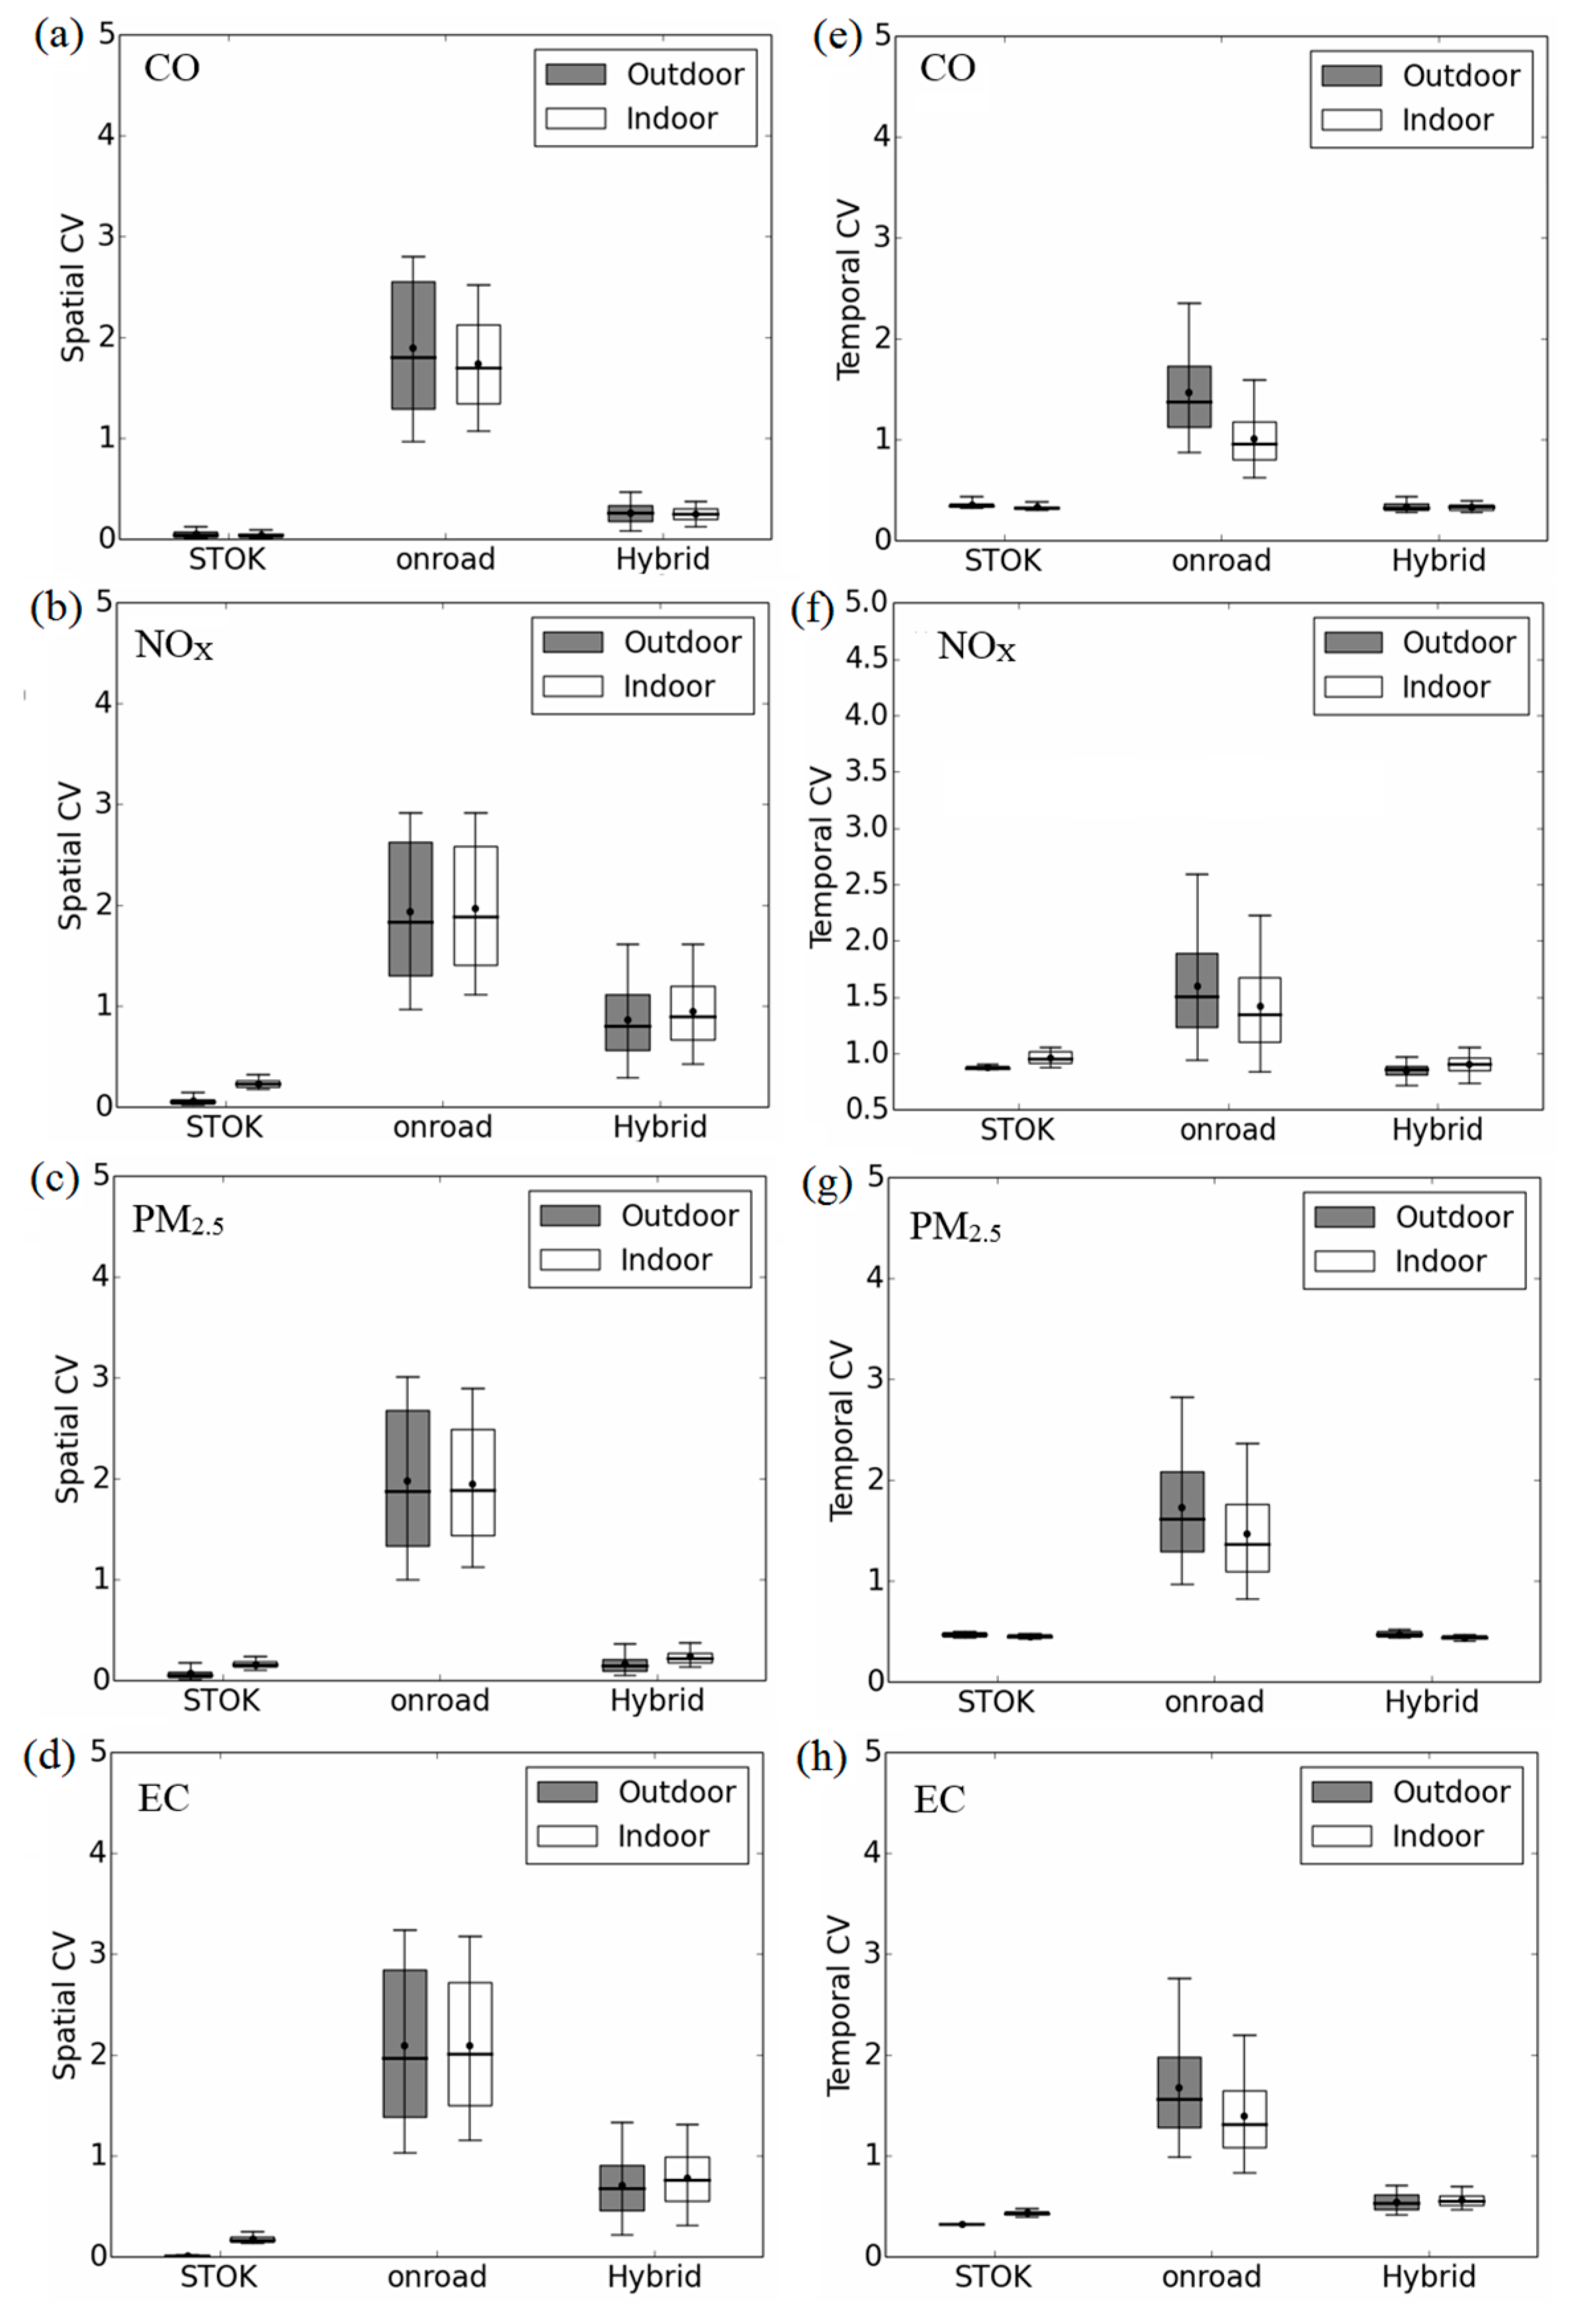
Figure 3 left panel quantifies the spatial component of this variability using spatial CV. For all pollutants, the outdoor on-road shows a great spatial variability (average spatial CV ~2). As a result, for the pollutants that have large contribution from outdoor on-road concentration (38% for NOx and 46% for EC), the outdoor hybrid would yield much higher spatial variation (average spatial CV = 0.87 for NOx and 0.71 for EC) than outdoor STOK (average spatial CV = 0.065 for NOx (Figure 3b) and 0.014 for EC (Figure 3d)). It is worth noticing that although CO and PM2.5 in this region is dominated by background concentration, adding outdoor on-road can still increase the spatial variability (average spatial CV from 0.06 for outdoor STOK to 0.26 for outdoor hybrid for CO and 0.07 for outdoor STOK to 0.17 for outdoor hybrid for PM2.5), indicating the importance of the on-road emission for the near-road environment even when the contribution is relatively small (14% for CO and 7% for PM2.5). Corroborating illustrations are shown in the authors’ peer-reviewed paper [39] where the hybrid contribution for PM2.5 drops by 20% within 150 meters from roadways.
Temporal CV is summarized in Figure 3 right panel. The outdoor on-road shows a great temporal variation (average temporal CV ~1.5, (Figure 3, dark boxes for outdoor on-road)). This high temporal variation is from the bottom up approach used in the R-LINE modeling where the temporal pattern of on-road emission is captured. For CO and PM2.5 (Figure 3e,g), the outdoor hybrid yields similar average temporal CV to outdoor STOK because for these two pollutants, outdoor STOK dominates the total concentration. Therefore, although outdoor on-road shows large temporal variation, the variation is lost after outdoor on-road and outdoor STOK are combined for CO and PM2.5. For NOx (Figure 3f), although 38% of the outdoor hybrid is from the outdoor on-road, because the outdoor on-road only affects Census blocks within a few hundred meters from roadways, the overall temporal CV for outdoor hybrid is less different from the outdoor STOK. For EC, because the outdoor on-road contributes 46% to the outdoor hybrid, the average temporal CV increases by 72% from 0.33 for outdoor STOK to 0.57 for outdoor hybrid (Figure 3h).
For the temporal CV, only the Census blocks near roadways would be affected by outdoor on-road. Examples for NOx are shown in Figure 4 with a Census block that is 14.1 m from a roadway (left panel) and a Census block that is 9.6 km from a roadway (right panel) and comparing concentrations at each of the two locations for a day At the near-road Census block (Figure 4a), outdoor on-road contributes, on average, 89% to outdoor hybrid. The contribution from outdoor on-road is the greatest (over 90%) during morning (07:00 to 09:00) and afternoon (17:00 to 19:00) traffic peak hours and the temporal CV increases by 40% (from 0.42 for outdoor STOK to 0.59 for outdoor hybrid). On the other hand, at a remote Census block (Figure 4b), the outdoor on-road for NOx contributes, on average, only 18% to the outdoor hybrid. As a result, the temporal CV only increases slightly by 7% from 0.44 for outdoor STOK to 0.47 for outdoor hybrid. All the other pollutants show a similar pattern as NOx (Figure S2).
Figure 2. Hourly pollutant concentration for each Census block in Durham, Orange, and Wake Counties, North Carolina (NC) in 2012. (a) CO; (b) PM2.5; (c) NOx; and (d) EC. Bottom and top of box represents 25th and 75th percentiles, the line in the middle of the box is the median, the ends of the whisker are the 5th and 95th percentiles, and the dot on the whisker is the mean.
Ijerph 12 15007 g002
Figure 3. Spatial CV for each hour (left panel); and Temporal CV for each Census block (right panel) for CO (a,e); NOx (b,f); PM2.5 (c,g); and EC (d,h). Bottom and top of box represents 25th and 75th percentiles, the line in the middle of the box is the median, the ends of the whisker are the 5th and 95th percentiles, and the dot on the whisker is the mean.
Ijerph 12 15007 g003
Figure 4. Time series plot on January 3rd for NOx at (a) a near-road Census block (14.1 m from roadway); and (b) a remote Census block (9.6 km from roadway).
Ijerph 12 15007 g004
The effect of on-road component on indoor metrics shows similar pattern to that of outdoor metrics (White-colored boxes from Figure 3e,h). We present the difference between outdoor and indoor metrics in the next section.

3.2. The Effect of Indoor Infiltration

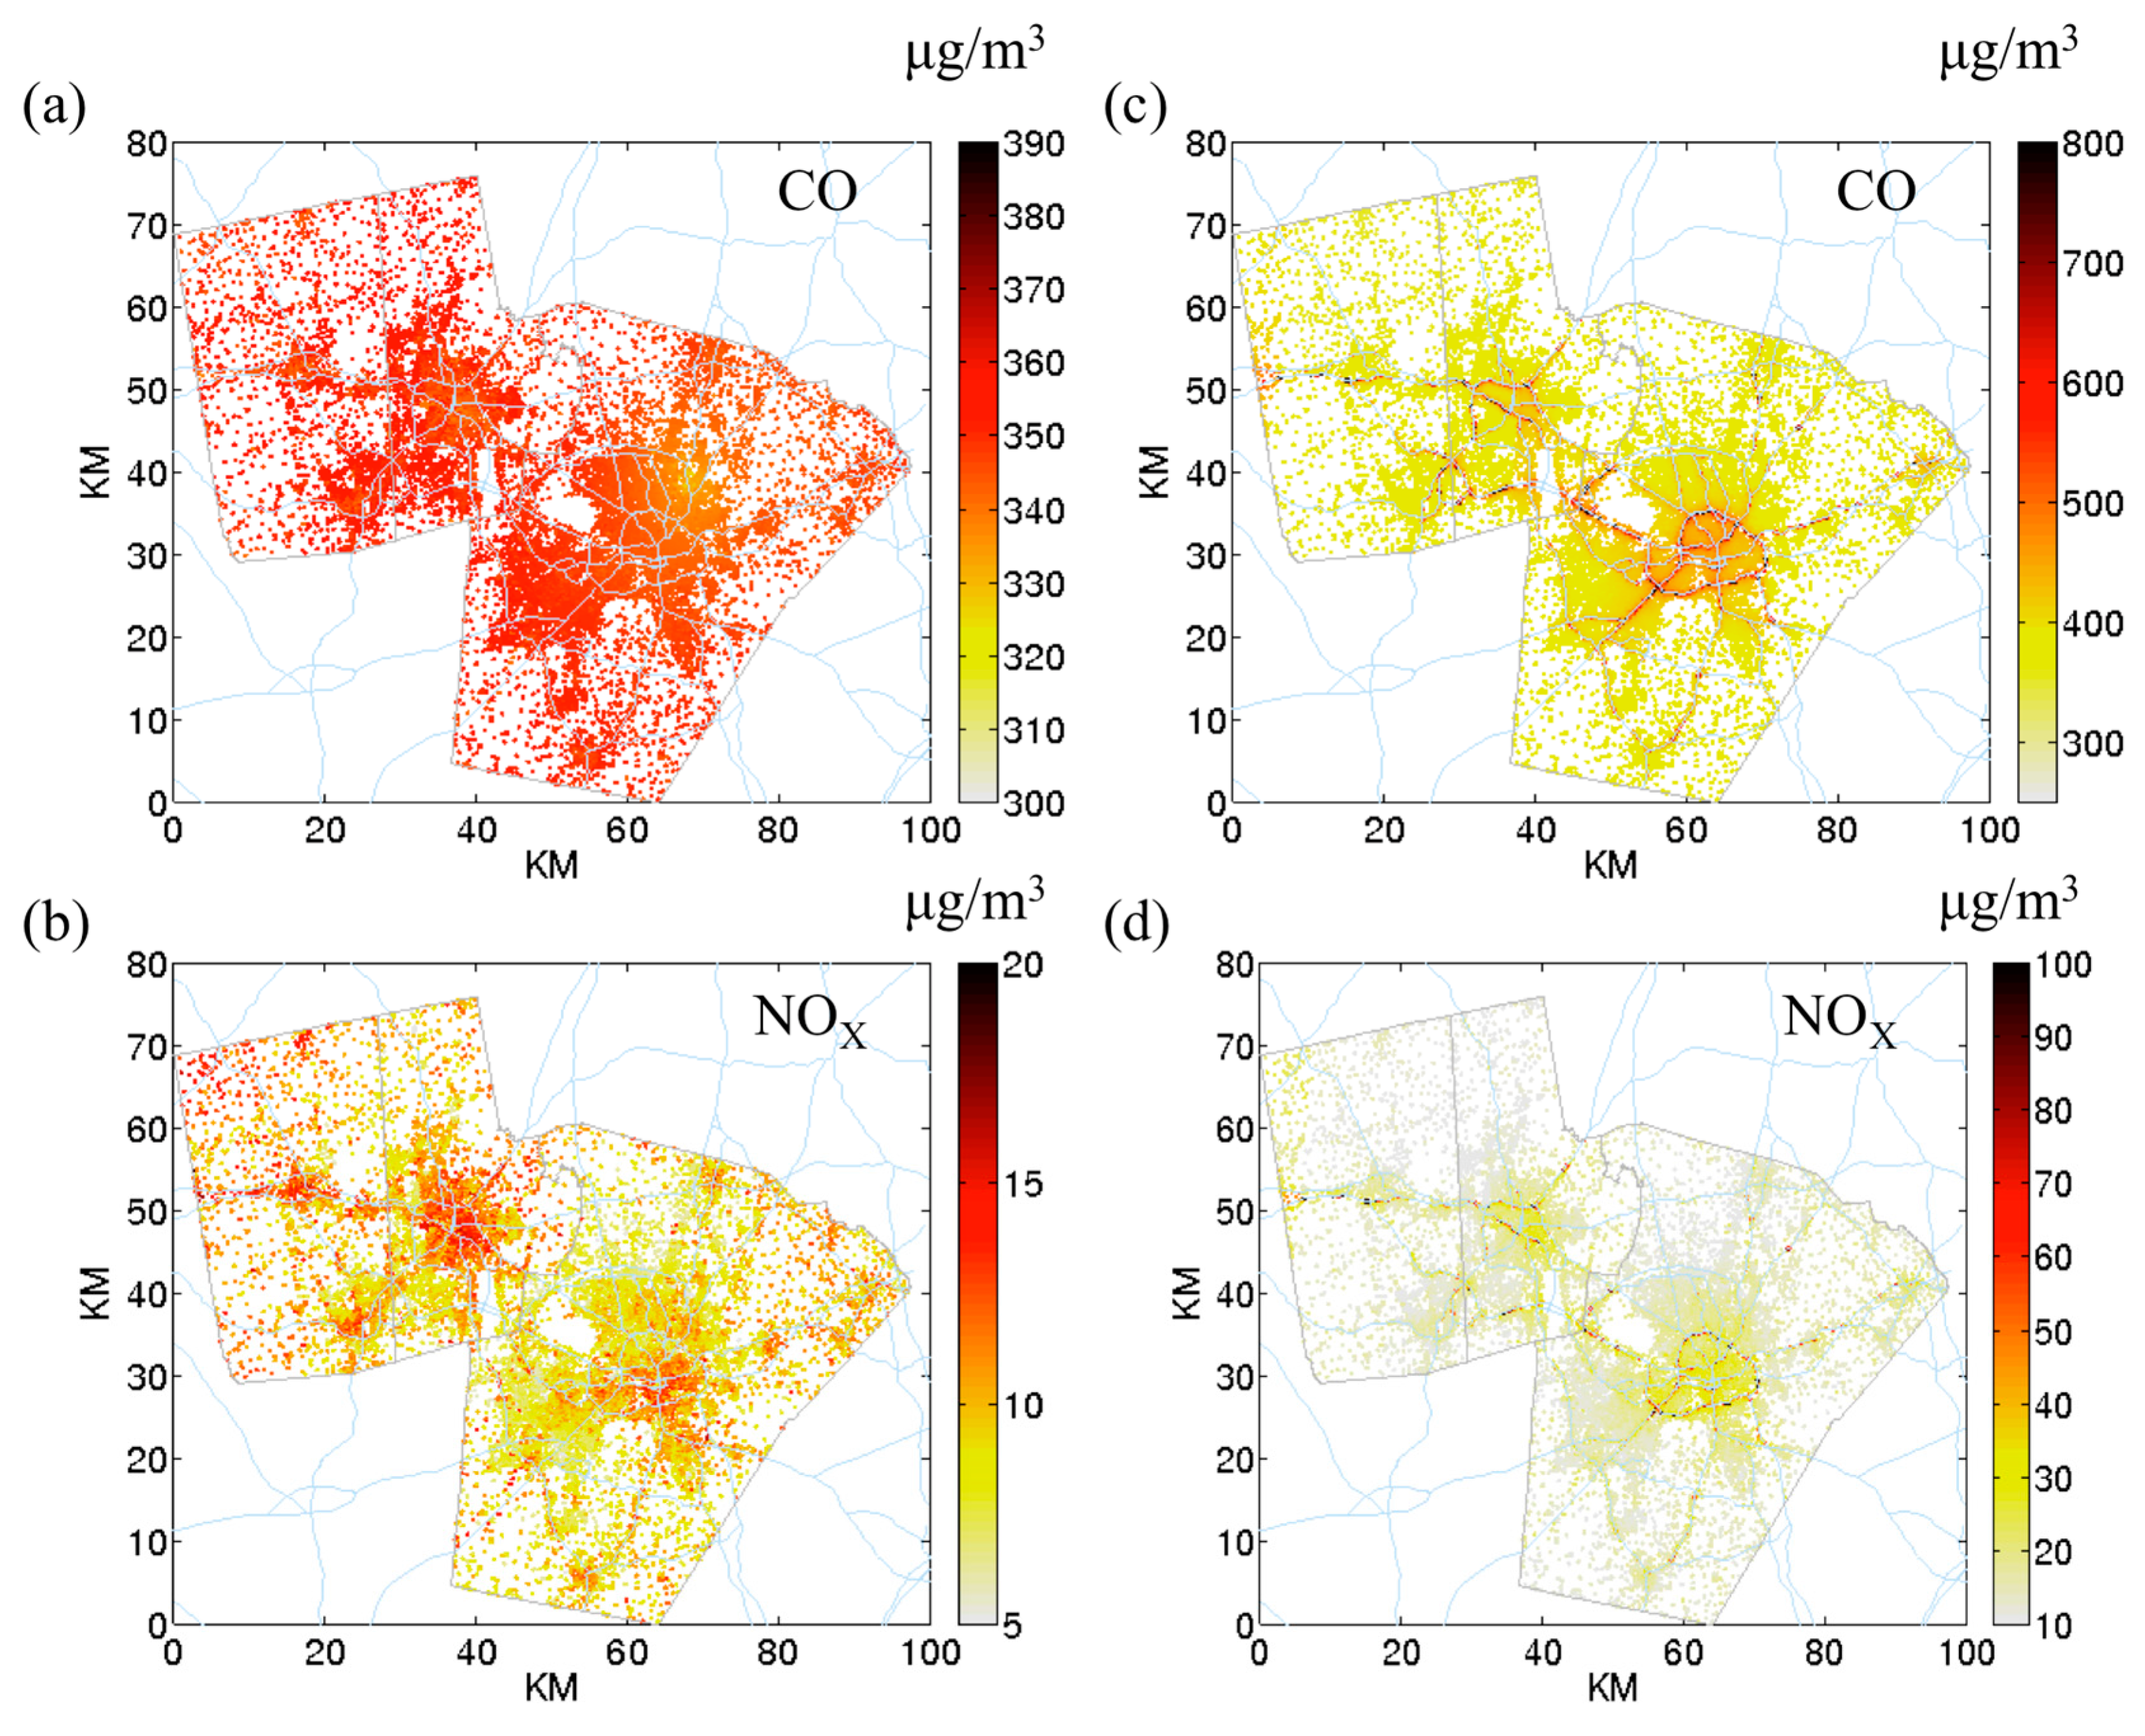
Figure 5 shows the indoor concentration for CO and NOx. At 07:00, the spatial pattern for indoor metrics is similar to the outdoor metrics (Figure 1) except for indoor STOK NOx (Figure 5c). The extra spatial variation for indoor STOK NOx shows a similar spatial pattern to AER (Figure S3). However, this pattern is not seen for CO (Figure 5a). On average, compared to the outdoor concentration, the indoor concentration is 66% lower for NOx, 46% lower for PM2.5, and 43% lower for EC (Figure 2b–d). CO on the other hand, shows a slightly higher (5.9%) indoor concentration than outdoor concentration (Figure 2a). This is because of the relatively high penetration factor (1) and low indoor deposition rate (0 h−1) for CO, resulting in the accumulation for indoor concentration. However, in general, CO is not affected by the indoor infiltration. 
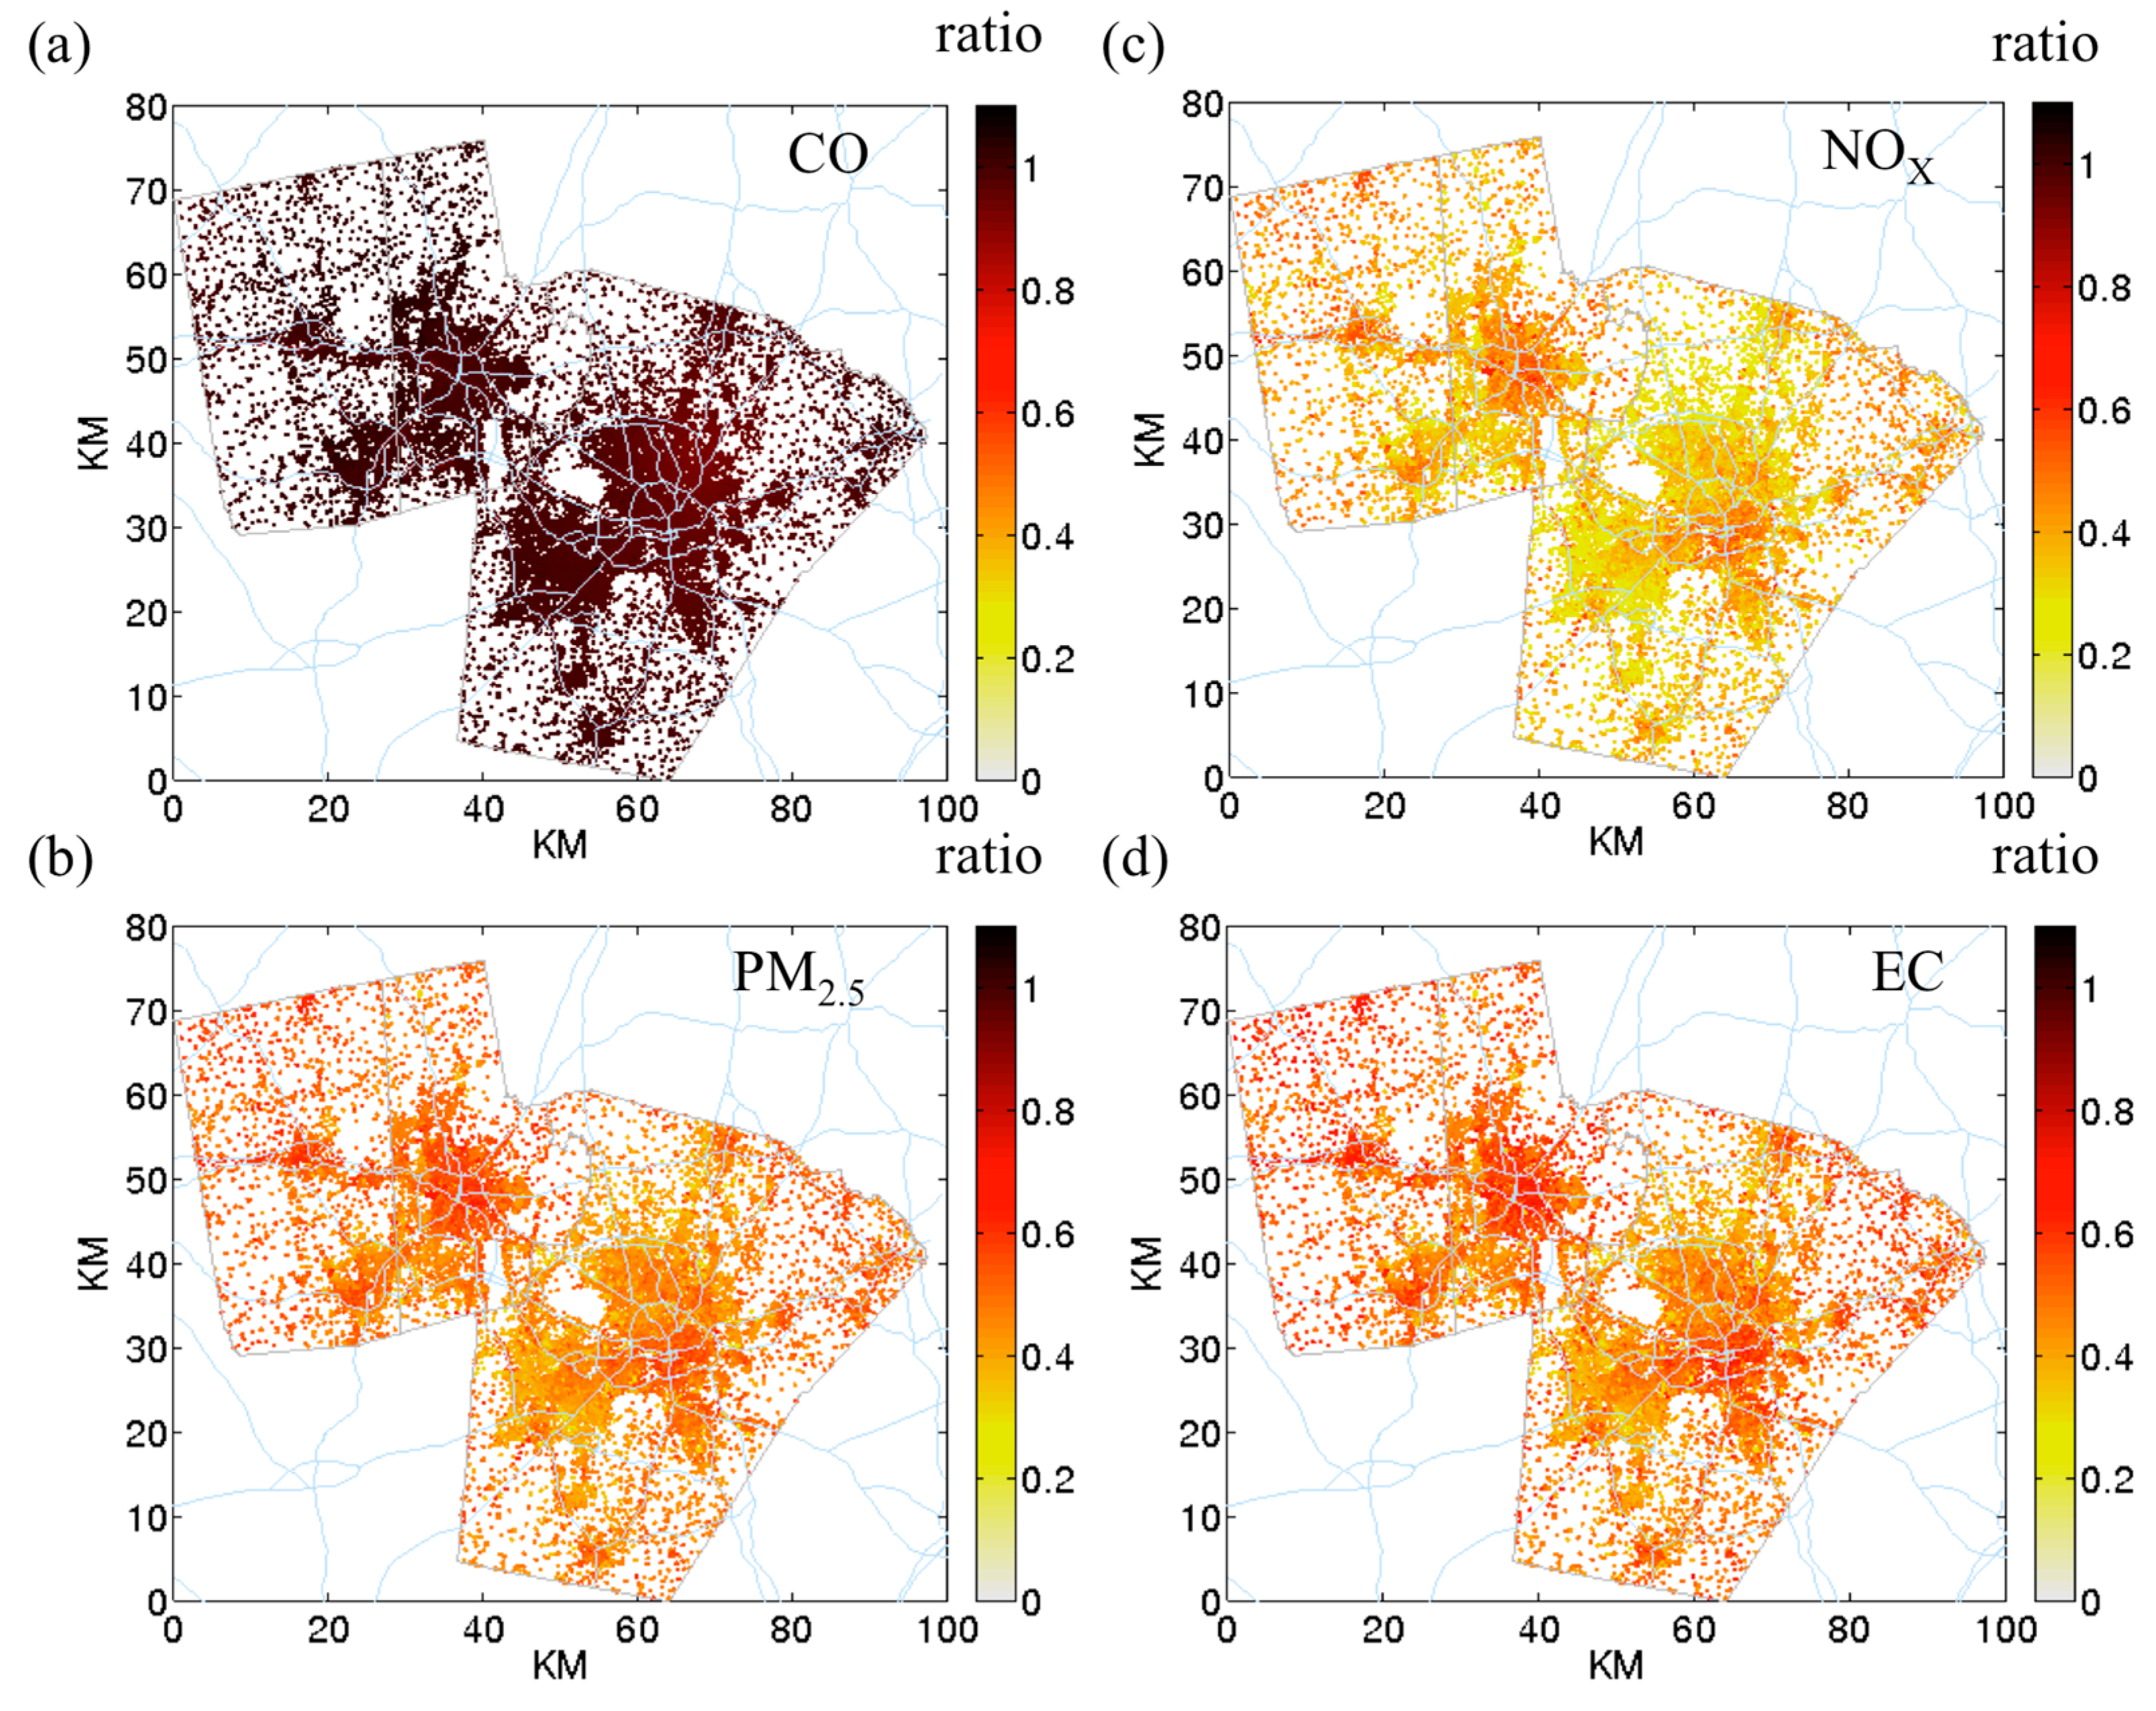
Figure 6 shows the concentration ratio at 07:00 between indoor and outdoor hybrid concentration.
Figure 5. Indoor concentration of CO and NOx at 07:00 with (a) CO indoor STOK; (b) NOx indoor STOK; (c) CO indoor hybrid; (d) NOx indoor hybrid. The color bar represents concentration in μg/m3 (Note that the color scale is different for the four figures to emphasize the concentration ranges that vary by pollutant).
Ijerph 12 15007 g005
For PM2.5 and EC (Figure 6b,d), the ratio is ~0.7 and for NOx (Figure 6c), the ratio is ~0.5. The difference is because of the higher indoor deposition for NOx (0.5 h−1) compared to PM2.5 (0.21 h−1) and EC (0.29 h−1). The high ratio area overlaps with the area with high AER. High AER is seen mostly in urban area. As these areas usually have higher density of roadways, the residents have the potential to be exposed to higher air pollutant concentrations in the indoor environment.
Figure 6. Indoor-outdoor concentration ratio using mean hybrid concentration at 07:00. (a) CO; (b) PM2.5; (c) NOx; and (d) EC.
Ijerph 12 15007 g006
The spatial CV for indoor STOK is higher than outdoor STOK (Figure 3 left panel). Because outdoor STOK is homogenously distributed across space, pollutants with higher indoor deposition rate (i.e., NOx, PM2.5, and EC) have a higher average spatial CV in indoor STOK than in outdoor STOK. Compared to the outdoor STOK, the average spatial CV of the indoor STOK is 3.6 fold higher for NOx, 2.2 fold higher for PM2.5, and 12.9 fold higher for EC. As shown in Figure 5b with the example for NOx, this increase in spatial variability is from the spatial variation of AER. Indoor on-road’s spatial CV is not much different from outdoor on-road. For NOx, PM2.5, and EC, compared with the mean spatial CV of the outdoor on-road, the average spatial CV of indoor on-road changes less than 2%. Because the spatial variation for outdoor on-road is large (spatial CV ~2), the extra spatial variation from AER is “covered” and the indoor on-road demonstrated similar spatial CV to outdoor on-road. For the outdoor hybrid, the effect of infiltration on spatial CV depends on the spatial variability of outdoor hybrid. For NOx and EC, because the major contributor for outdoor hybrid is outdoor on-road, the spatial CV of outdoor hybrid is high (~0.8). Therefore, the indoor hybrid shows only a slightly higher (10%) spatial CV than the outdoor hybrid for NOx and EC. For PM2.5, because outdoor STOK dominates the outdoor hybrid, the spatial CV of outdoor hybrid is low (~0.17) the indoor infiltration produces the indoor hybrid that has higher spatial CV (40%) than the outdoor hybrid.
Temporal CV in general, does not change much for STOK and hybrid between outdoor and indoor metrics (Figure 3 right panel). For the on-road, due to the accumulation effect mentioned previously, the temporal variation is smoothed out, resulting in a lower temporal variation in indoor metrics than outdoor metrics.

3.3. The Overall Effect on Exposure Error

Because people spend more time indoors and STOK cannot capture the impact from a local source, we used the indoor hybrid as a standard to compare to other metrics. To quantify the potential population exposure error using the other metrics, we created contingency tables [33] for each pollutant that compares quintiles of the population exposure for the annual average concentration (Table 3, Table 4, Table 5 and Table 6). These tables’ diagonal values represent the percentage of Census blocks of a metric that agrees with the indoor hybrid. With a perfect agreement with indoor hybrid, the diagonal values would be 100% and the non-diagonal values would be 0. For example, Table 3 shows the contingency table for CO. Assuming the indoor hybrid is closer to the actual exposure, the top left entry represents that of the population in the lowest quintile (~3200 Census blocks exposed to 347.4 to 362.1 μg/m3 of CO), the outdoor hybrid metric correctly classified 91%. For CO with the outdoor hybrid, 9% of the Census blocks were grouped to the second lowest group. The high diagonal values for CO for the outdoor hybrid metric (>81%) indicate a good agreement between it and the indoor hybrid. It is worth noting that the outdoor STOK metric does not agree well with the indoor hybrid (8% to 34% agreement).
Table 3. Contingency table for CO showing agreement between exposure quintiles. The values represent percentage of Census blocks in each quintile. Concentration ranges are shown in parentheses. Boxed percentages along diagonals would be 100% for a perfect match.
PercentileConcentration (μg/m3)Indoor Hybrid
0–2020–4040–6060–8080–100
(347.4, 362.1)(362.1, 372.0)(372.0, 385.4)(385.4, 411.6)(411.6, 2242.2)
Outdoor hybrid0%–20%(330.2, 345.9)9110000
20%–40%(345.9, 353.9)9811100
40%–60%(353.9, 365.7)098560
60%–80%(365.7, 388.0)004923
80%–100%(388.0, 2024.4)000297
Indoor on-road0%–20%(6.7, 25.2)7921000
20%–40%(25.2, 35.4)15642100
40%–60%(35.4, 49.2)61370110
60%–80%(49.2, 76.6)029836
80%–100%(76.6, 1903.4)000694
Outdoor on-road0%–20%(5.8, 21.3)7823000
20%–40%(21.3, 30.0)16612400
40%–60%(30.0, 42.2)61466130
60%–80%(42.2, 66.5)0210826
80%–100%(66.5, 1694.4)000594
Indoor STOK0%–20%(317.2, 336.1)2516122225
20%–40%(336.1, 339.3)1018182330
40%–60%(339.3, 341.3)1227301714
60%–80%(341.3, 343.7)616262923
80%–100%(343.7, 347.7)47221498
Outdoor STOK0%–20%(322.3, 337.6)2416122227
20%–40%(337.6, 340.7)1218182428
40%–60%(340.7, 342.2)827341715
60%–80%(342.2, 343.7)817232922
80%–100%(343.7, 347.7)48231388
For NOx and EC (Table 4 and Table 6), the outdoor hybrid does not perform well (the agreement is between 33% and 49% for the lower four groups) except for the highest quintile (73% for NOx and 76% for EC). All the other outdoor metrics for NOx and EC perform poorly (Table 4, Table 5 and Table 6). The best agreement for NOx and EC is with the indoor on-road (agreement between 45% and 90%). At the lowest quintile, indoor STOK performs well (68% for NOx and 69 for EC).
For PM2.5 (Table 5), indoor STOK performs the best (agreement between 59% and 90%). All other metrics perform poorly. For all pollutants in general, all outdoor metrics perform relatively poorer than indoor metrics. Outdoor STOK, in specific, performs very poorly (agreement ranges from 8% to 34% considering all pollutants). Since space-time kriging is often used in environmental health studies to quantify air pollutant exposures [13,14,15], this part of analysis shows that there is a great potential for this metric to misclassify exposures for all four pollutants studied.
Table 4. Contingency table for NOx showing agreement between exposure quintiles. The values represent percentage of Census blocks in each quintile. Concentration ranges are shown in parentheses. Boxed percentages along diagonals would be 100% for a perfect match.
PercentileConcentration (μg/m3)Indoor Hybrid
0–2020–4040–6060–8080–100
(3.4, 9.3)(9.3, 11.1)(11.1, 13.5)(13.5, 17.7)(17.7, 307.9)
Outdoor hybrid0%–20%(18.4, 23.3)49311730
20%–40%(23.3, 25.4)323425100
40%–60%(25.4, 28.6)132633261
60%–80%(28.6, 35.1)48204126
80%–100%(35.1, 594.7)1142073
Indoor on-road0%–20%(0.5, 2.6)6926500
20%–40%(2.6, 3.7)28492220
40%–60%(3.7, 5.3)32455180
60%–80%(5.3, 8.9)01187010
80%–100%(8.9, 299.0)0001090
Outdoor on-road0%–20%(1.7, 6.1)49321730
20%–40%(6.1, 8.3)33332690
40%–60%(8.3, 11.4)132633261
60%–80%(11.4, 18.0)48204225
80%–100%(18.0, 577.4)1142073
Indoor STOK0%–20%(2.4, 6.5)6818644
20%–40%(6.5, 7.3)224020118
40%–60%(7.3, 8.2)926312113
60%–80%(8.2, 9.3)213303124
80%–100%(9.3, 14.4)02133352
Outdoor STOK0%–20%(18.9, 19.0)2223241814
20%–40%(19.0, 19.3)1316192230
40%–60%(19.3, 19.3)1615162031
60%–80%(19.3, 19.4)1821212614
80%–100%(19.4, 20.2)3125211410
Table 5. Contingency table for PM2.5 showing agreement between exposure quintiles. The values represent percentage of Census blocks in each quintile. Concentration ranges are shown in parentheses. Boxed percentages along diagonals would be 100% for a perfect match.
PercentileConcentration (μg/m3)Indoor Hybrid
0–2020–4040–6060–8080–100
(1.72, 4.03)(4.03, 4.45)(4.45, 4.83)(4.83, 5.28)(5.28, 21.21)
Outdoor hybrid0%–20%(7.91, 8.43)272422198
20%–40%(8.43, 8.79)2721201913
40%–60%(8.79, 8.90)2627231510
60%–80%(8.90, 9.17)1519222420
80%–100%(9.17, 34.29)68132350
Indoor on-road0%–20%(0.03, 0.15)422620102
20%–40%(0.15, 0.21)343019135
40%–60%(0.21, 0.29)162728228
60%–80%(0.29, 0.47)713243126
80%–100%(0.47, 16.33)24112360
Outdoor on-road0%–20%(0.07, 0.26)282624176
20%–40%(0.26, 0.34)332720156
40%–60%(0.34, 0.47)222523209
60%–80%(0.47, 0.74)1214202529
80%–100%(0.74, 26.00)58132351
Indoor STOK0%–20%(1.67, 3.85)908111
20%–40%(3.85, 4.21)11731132
40%–60%(4.21, 4.53)01962145
60%–80%(4.53, 4.89)00255916
80%–100%(4.89, 6.55)0002476
Outdoor STOK0%–20%(8.46, 8.61)1516182327
20%–40%(8.61, 8.69)322722127
40%–60%(8.69, 8.72)1515172231
60%–80%(8.72, 8.76)1819202320
80%–100%(8.76, 9.14)2023232014
Table 6. Contingency table for EC showing agreement between exposure quintiles. The values represent percentage of Census blocks in each quintile. Concentration ranges are shown in parentheses. Boxed percentages along diagonals would be 100% for a perfect match.
PercentileConcentration (μg/m3)Indoor Hybrid
0–2020–4040–6060–8080–100
(0.15, 0.37)(0.37, 0.43)(0.43, 0.50)(0.50, 0.62)(0.62, 12.74)
Outdoor hybrid0%–20%(0.65, 0.74)49321720
20%–40%(0.74, 0.79)32352770
40%–60%(0.79, 0.86)142534261
60%–80%(0.86, 1.01)47194623
80%–100%(1.01, 19.61)1131876
Indoor on-road0%–20%(0.02, 0.09)6528700
20%–40%(0.09, 0.12)30452320
40%–60%(0.12, 0.17)52552180
60%–80%(0.17, 0.28)02186911
80%–100%(0.28, 12.38)0001189
Outdoor on-road0%–20%(0.04, 0.15)48321820
20%–40%(0.15, 0.20)33342680
40%–60%(0.20, 0.28)142533261
60%–80%(0.28, 0.43)57194523
80%–100%(0.43, 19.00)1131876
Indoor STOK0%–20%(0.11, 0.27)6917644
20%–40%(0.27, 0.30)224118119
40%–60%(0.30, 0.33)826302015
60%–80%(0.33, 0.36)113312925
80%–100%(0.36, 0.49)02153647
Outdoor STOK0%–20%(0.55, 0.55)1320222223
20%–40%(0.55, 0.55)1015172236
40%–60%(0.55, 0.55)312624136
60%–80%(0.55, 0.56)1416202623
80%–100%(0.56, 0.56)3123181612
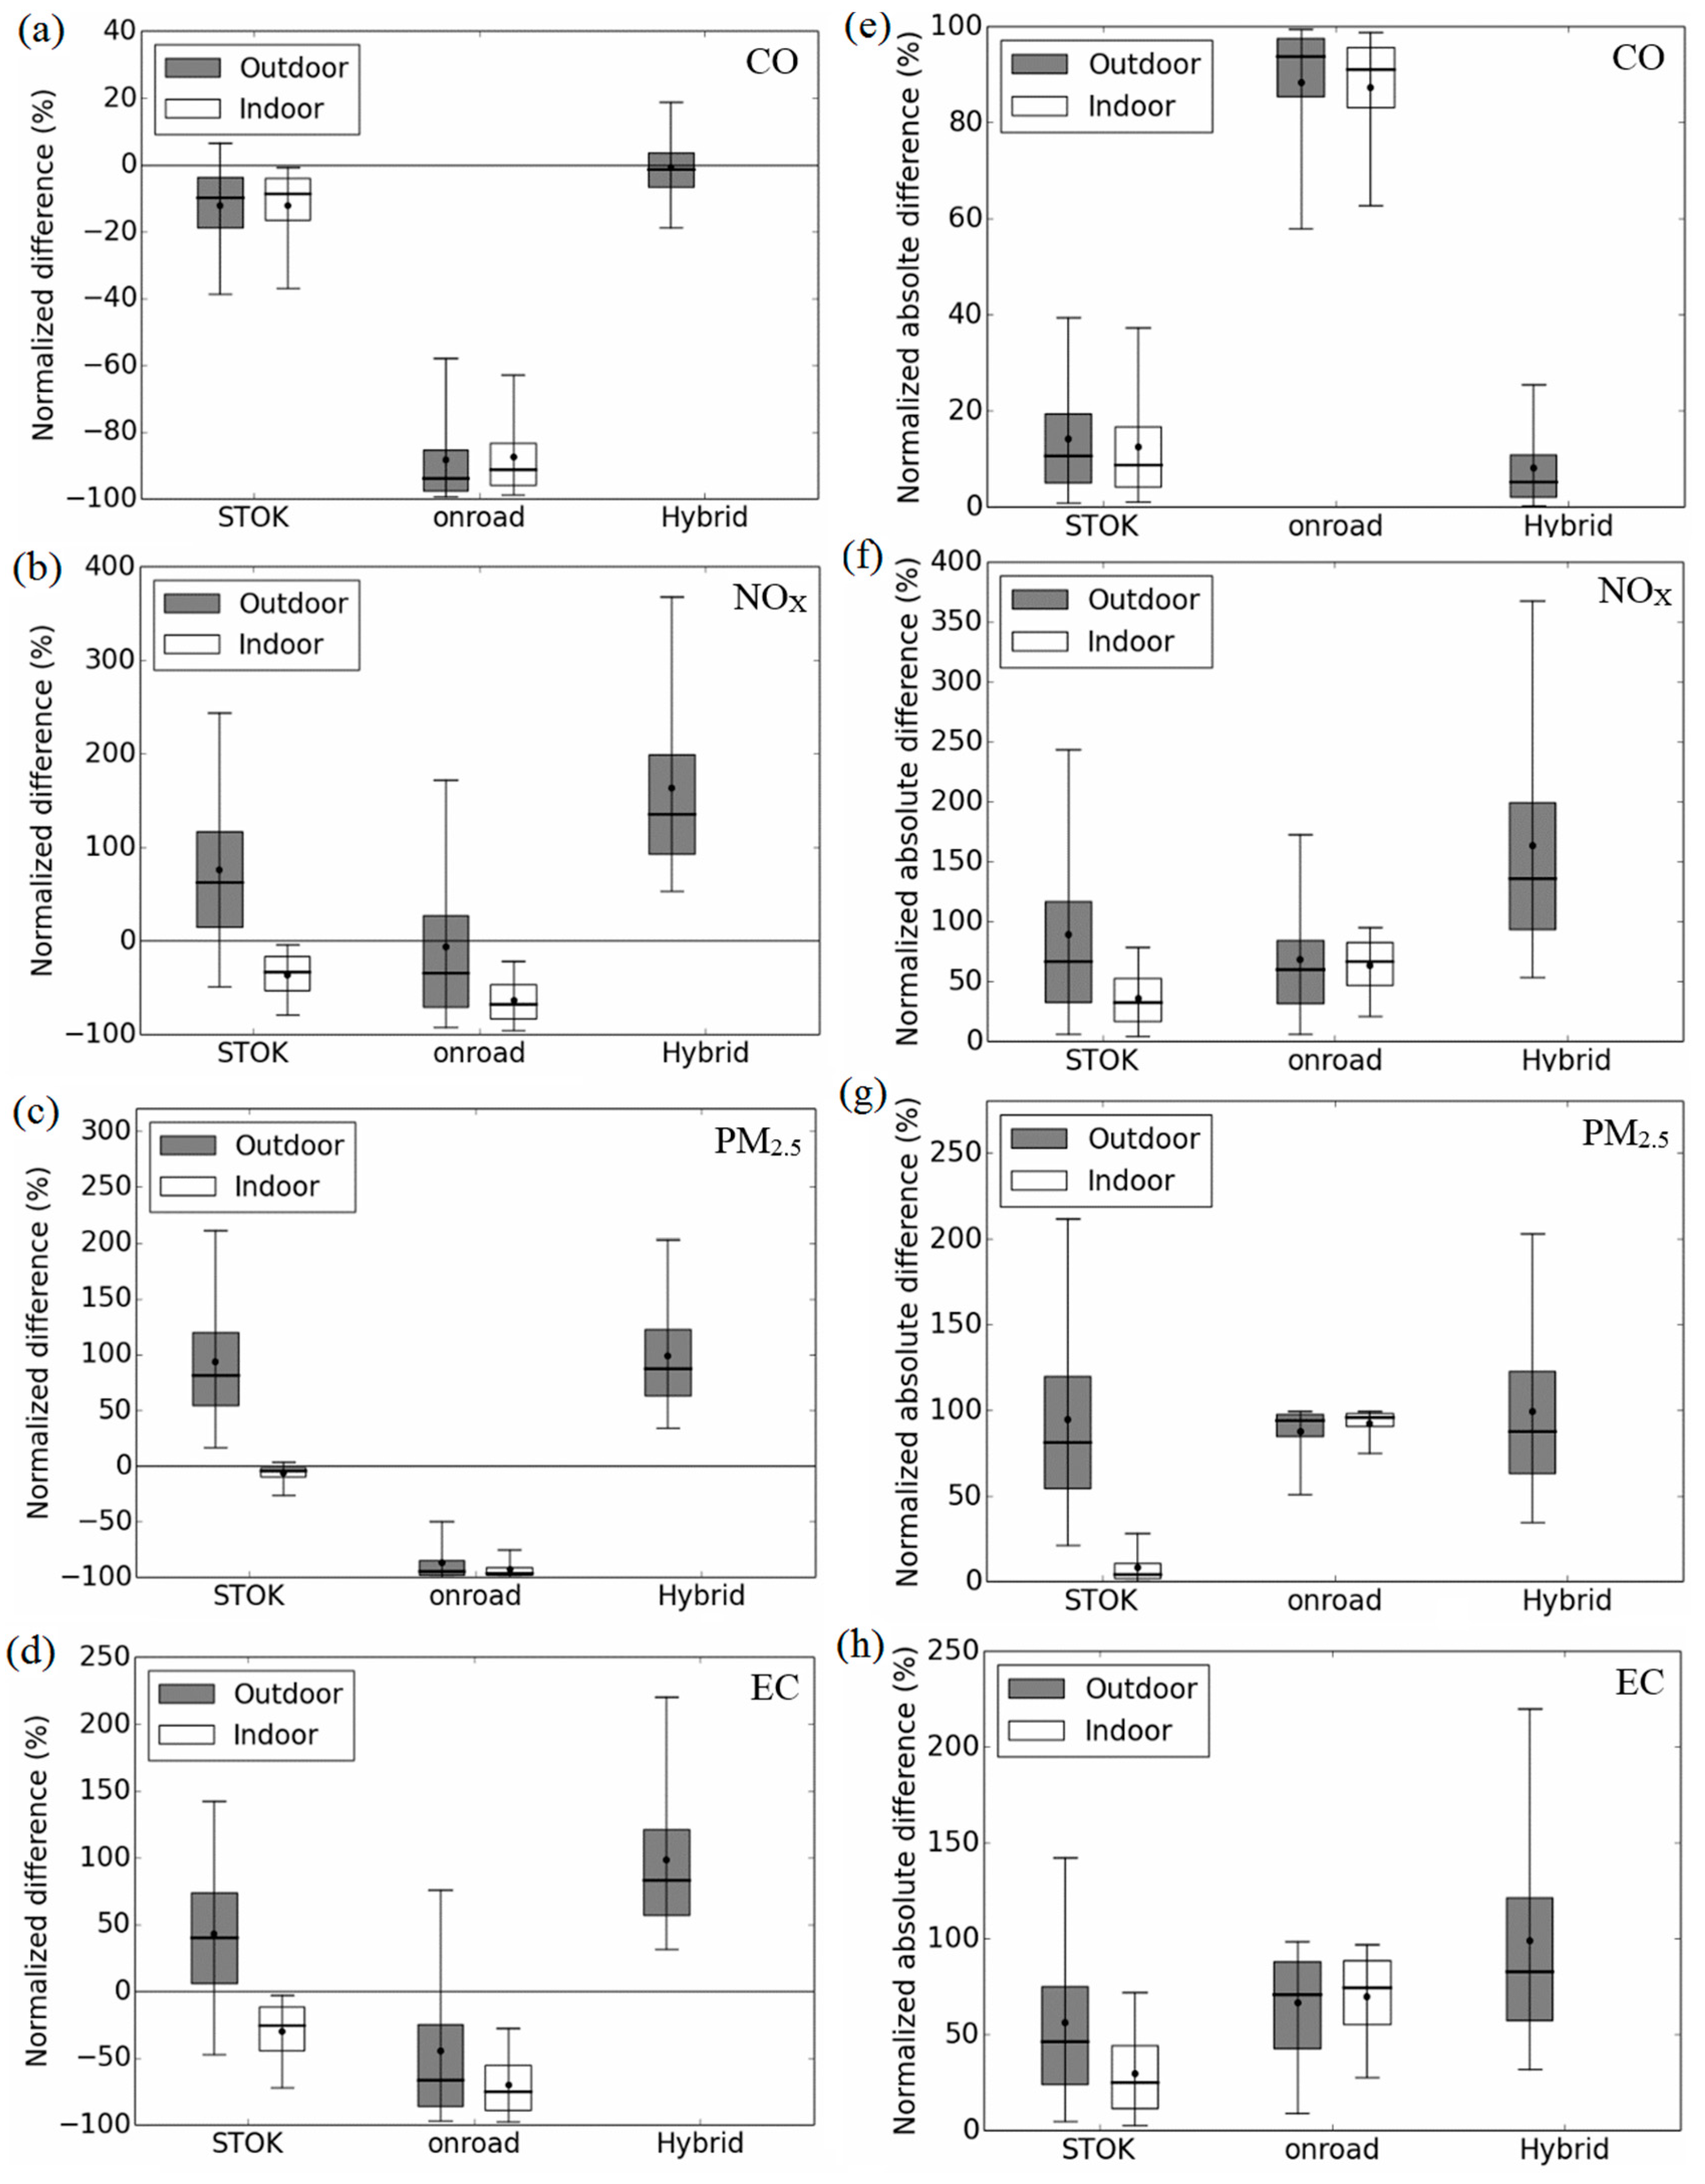
Besides the population exposure error, it is also important to quantify the exposure error at an individual level. We quantify this with ND (Figure 7 left panel) and NAD (Figure 7 right panel). For all pollutants except for CO, all outdoor metrics (dark boxes) perform poorly. For example, the average ND and NAD is 175% with the outdoor hybrid for NOx. Further, all outdoor metrics have shown wider 90% range (Figure 7 whiskers); so for some Census block, ND and NAD can be up to 375% for NOx. From the population exposure error in the previous paragraph, one would expect that the indoor on-road would perform better for NOx and EC. However, for these two pollutants, ND and NAD indicate that indoor STOK yields lower error (average ND ~−25% and NAD ~25%) compared to indoor on-road (average ND ~−75% and NAD ~75%). The disagreement between population and individual exposure error is because although the indoor on-road can capture the locations of the hotspot, the concentration is still too low to represent the true exposure. For CO, the best performance is with outdoor hybrid metric (average ND ~0% and NAD ~10%). Because the penetration factor for CO is 1 and the indoor deposition rate is 0, the indoor and outdoor concentration differ less from each other, although NAD can still be up to 30% (Figure 7). For PM2.5, agreeing with the population exposure, the indoor STOK concentration gives the lowest error (average ND ~0% and NAD ~5%). This is because of the relatively lower contribution from the on-road source for PM2.5. However, it is worth noting that the error can sometimes be large (up to 25%), indicating on-road source still plays an important role for the near-road population exposure.
Figure 7. Hourly normalized difference (ND, left panels) and hourly normalized absolute difference (NAD, right panels) for each Census block for CO (a,e); NOx (b,f); PM2.5 (c,g); and EC (d,h). Bottom and top of box represents 25th and 75th percentiles, the line in the middle of the box is the median, the ends of the whisker are the 5th and 95th percentiles, and the dot on the whisker is the mean.
Ijerph 12 15007 g007

4. Discussion and Limitations

To prevent bias due to spatial variation [50], many health studies characterized exposure using space-time kriging [13,14,15]. Space-time kriging technique, when lacking adequate number of monitors, may fail to capture a concentration hotspot in microenvironments such as locations found near roadways. Further, using ambient concentrations to represent exposure can introduce exposure error because people spend more time indoors [8,9,10]. These findings motivated this study to quantify the associated potential exposure error to reduce the possible bias in future epidemiological analysis for the CADEE study.
From our analysis, the suitability of an exposure metric to represent a pollutant depends on the pollutant’s three major characteristics: (1) Penetration factor; (2) Deposition rate; and (3) Key source contributor. CO, selected as a “control group” because of its high penetration factor and low deposition rate, is less affected by the indoor infiltration mechanism and thus AER. AER affects all other pollutants’ block-to-block variability although may not be significant when the input outdoor metric’s spatial variability is large. Nevertheless, this small change in spatial variation (~10%) can cause error in population exposure. This is evident in the first “experiment group” where for pollutants with slightly lower penetration factor and higher deposition rate (such as NOx and EC), the outdoor hybrid, as an input for computing indoor hybrid, produces 20% and 15% more error (Table 4 and Table 6) than indoor on-road. For the second “experiment group” where pollutant is dominated by background (i.e., PM2.5), the indoor STOK (Table 5) yields less error for population exposure. It is worth noting that all outdoor metrics cause high exposure error at the population level. This highlights the importance of AER for pollutants with lower penetration factor and higher deposition rate.
At an individual level, CO and PM2.5 agree with the results in population exposure error and can be best described by outdoor hybrid and indoor STOK, respectively. For CO, because the infiltration causes little effect on concentration, the concentration has to be characterized by both background and on-road component. For PM2.5, although indoor STOK causes little error, that error can still be up to 25%, indicating the importance of on-road emission. This was not seen in another study where concentration was modeled at zip code [7], indicating the necessity to model the concentration at fine spatial resolution. For NOx and EC, although STOK-based indoor metric gives relatively less error than other metrics, the error is still high (up to 75%) because on-road emission contributes a large portion (38% and 46%) to the total concentration. In terms of individual exposure error, both background and on-road component should be considered.
There are several limitations in this work. First, this study does not consider window opening since data were unavailable. A previous study evaluated the LBL model and another model (LBLX), which extends the LBL model to include natural ventilation from window opening. Based on AER measurements from homes in central North Carolina across four seasons, the LBL and LBLX models had similar uncertainties for days with open windows. Therefore, we do not expect a substantial effect from not including window opening in our study [41]. Secondly, this work does not consider indoor pollutant sources, which could lead to under-prediction for total exposure. Thirdly, since the local source considered in this study focused only on on-road emission, future research should also include other sources such as power plants and other industrial sources in the study area.

5. Conclusions

We have provided a comprehensive comparison of multiple tiered exposure metrics and quantified potential exposure error at both population and individual level at 16,095 Census blocks of three Counties in North Carolina for CO, NOx, PM2.5, and elemental carbon (EC) during 2012. These metrics include ambient background concentration from space-time ordinary kriging (STOK), ambient on-road concentration from the Research LINE source dispersion model (R-LINE), hybrid concentration combining STOK and R-LINE, and their associated indoor concentrations from an indoor infiltration mass balance model. We achieved this comprehensive comparison—the main novelty of this study—by combining the different models to obtain spatiotemporally refined outdoor and indoor concentrations. With the examples for the four pollutants, we identified the key factors that can cause the exposure error. Using hybrid-based indoor concentration as the standard, the comparison showed that outdoor STOK metrics yielded large error at both population (67% to 93%) and individual level (average bias between −10% to 95%). For pollutants with significant contribution from on-road emission (EC and NOx), the on-road based indoor metric performs the best at the population level (error less than 52%). At the individual level, however, the STOK-based indoor concentration performs the best (average bias below 30%). For PM2.5, due to the relatively low contribution from on-road emission (7%), STOK-based indoor metric performs the best at both population (error below 40%) and individual level (error below 25%). Finally, the AER calculation in this study, to our knowledge, is the first one using actual house information instead of on-site survey, and at such a refined spatial resolution. This unique approach, along with the comprehensive results from this study provides an opportunity for future researchers to conduct large-scale health studies by selecting appropriate exposure metrics and reduce potential bias in exposure characterization.

Supplementary Files

Supplementary File 1

Acknowledgments

We gratefully acknowledge Charles Weschler of Rutgers University for his helpful discussion while selecting indoor infiltration parameters. We also thank Kevin Talgo, Michelle Snyder and Brian Naess of the Institute for the Environment at the University of North Carolina at Chapel Hill for their valuable contributions to this work.
The U.S. Environmental Protection Agency, through its Office of Research and Development, partially funded and collaborated in the research described here under Contract No. EP-D-12-044 to the University of North Carolina at Chapel Hill. This paper has been subjected to Agency review and approved for publication. Approval does not signify that the contents reflect the views of the Agency nor does mention of trade names or commercial products constitute endorsement or recommendation for use.

Author Contributions

Shih Ying Chang implemented the modeling, performed the analysis, produced drafts and coordinated revisions of the paper. William Vizuete contributed to the design of the paper structure. Michael Breen provided input parameters for the indoor infiltration algorithm as well as the LBL AER model. Vlad Isakov contributed to the design of model-based exposure metrics and the paper structure. Saravanan Arunachalam conceptualized the overall approach, coordinated contributions from the team, and coordinated revisions of the paper. All authors contributed to the analyses, and read and approved the final manuscript.

Conflicts of Interest

The authors declare no conflict of interest.

References

  1. McConnell, R.; Islam, T.; Shankardass, K.; Jerrett, M.; Lurmann, F.; Gilliland, F.; Gauderman, J.; Avol, E.; Künzli, N.; Yao, L.; et al. Childhood incident asthma and traffic-related air pollution at home and school. Environ. Health Perspect. 2010, 118, 1021–1026. [Google Scholar] [CrossRef] [PubMed] [Green Version]
  2. Anderson, H.R.; Favarato, G.; Atkinson, R. Long-term exposure to air pollution and the incidence of asthma: Meta-analysis of cohort studies. Air Qual. Atmos. Health 2013, 6, 47–56. [Google Scholar] [CrossRef]
  3. Lindgren, A.; Björk, J.; Stroh, E.; Jakobsson, K. Adult asthma and traffic exposure at residential address, workplace address, and self-reported daily time outdoor in traffic: A two-stage case-control study. BMC Public Health 2010, 10, 716–728. [Google Scholar] [CrossRef] [PubMed]
  4. Anderson, H.R.; Favarato, G.; Atkinson, R. Long-term exposure to outdoor air pollution and the prevalence of asthma: Meta-analysis of multi-community prevalence studies. Air Qual. Atmos. Health 2013, 6, 57–68. [Google Scholar] [CrossRef]
  5. Dockery, D.; Pope, C.I.; Xu, X.; Spengler, J.D.; Ware, J.; Fay, M.; Ferris, B.; Speizer, F. An association between air pollution and mortality in six U.S. cities. N. Engl. J. Med. 1993, 329, 1753–1759. [Google Scholar] [CrossRef] [PubMed]
  6. Jerrett, M.; Arain, A.; Kanaroglou, P.; Beckerman, B.; Potoglou, D.; Sahsuvaroglu, T.; Morrison, J.; Giovis, C. A review and evaluation of intraurban air pollution exposure models. J. Expo. Anal. Environ. Epidemiol. 2005, 15, 185–204. [Google Scholar] [CrossRef] [PubMed]
  7. Dionisio, K.L.; Isakov, V.; Baxter, L.K.; Sarnat, J.A.; Sarnat, S.E.; Burke, J.; Rosenbaum, A.; Graham, S.E.; Cook, R.; Mulholland, J.; et al. Development and evaluation of alternative approaches for exposure assessment of multiple air pollutants in Atlanta, Georgia. J. Expo. Sci. Environ. Epidemiol. 2013, 23, 581–592. [Google Scholar] [CrossRef] [PubMed]
  8. Van Roosbroeck, S.; Wichmann, J.; Janssen, N.A.H.; Hoek, G.; van Wijnen, J.H.; Lebret, E.; Brunekreef, B. Long-term personal exposure to traffic-related air pollution among school children, a validation study. Sci. Total Environ. 2006, 368, 565–573. [Google Scholar] [CrossRef] [PubMed]
  9. Michikawa, T.; Nakai, S.; Nitta, H.; Tamura, K. Validity of using annual mean particulate matter concentrations as measured at fixed site in assessing personal exposure: An exposure assessment study in Japan. Sci. Total Environ. 2014, 466–467, 1–8. [Google Scholar] [CrossRef] [PubMed]
  10. Delfino, R.J.; Quintana, P.J.E.; Floro, J.; Gastañaga, V.M.; Samimi, B.S.; Kleinman, M.T.; Liu, L.J.S.; Bufalino, C.; Wu, C.F.; McLaren, C.E. Association of FEV1 in asthmatic children with personal and microenvironmental exposure to airborne particulate matter. Environ. Health Perspect. 2004, 112, 932–941. [Google Scholar] [CrossRef] [PubMed]
  11. De Nazelle, A.; Arunachalam, S.; Serre, M.L. Bayesian maximum entropy integration of ozone observations and model predictions: An application for attainment demonstration in North Carolina. Environ. Sci. Technol. 2010, 44, 5707–5713. [Google Scholar] [CrossRef] [PubMed]
  12. Arunachalam, S.; Valencia, A.; Akita, Y.; Serre, M.L.; Omary, M.; Garcia, V.; Isakov, V. A method for estimating urban background concentrations in support of hybrid air pollution modeling for environmental health studies. Int. J. Environ. Res. Public Health 2014, 11, 10518–10536. [Google Scholar] [CrossRef] [PubMed]
  13. Lee, P.C.; Roberts, J.M.; Catov, J.M.; Talbott, E.O.; Ritz, B. First trimester exposure to ambient air pollution, pregnancy complications and adverse birth outcomes in Allegheny County, PA. Matern. Child Health J. 2013, 17, 545–555. [Google Scholar] [CrossRef] [PubMed]
  14. Lee, P.C.; Talbott, E.O.; Roberts, J.M.; Catov, J.M.; Sharma, R.K.; Ritz, B. Particulate air pollution exposure and C-reactive protein during early pregnancy. Epidemiology 2011, 22, 524–531. [Google Scholar] [CrossRef] [PubMed]
  15. Coogan, P.F.; White, L.F.; Jerrett, M.; Brook, R.D.; Su, J.G.; Seto, E.; Burnett, R.; Palmer, J.R.; Rosenberg, L. Air pollution and incidence of hypertension and diabetes mellitus in black women living in Los Angeles. Circulation 2012, 125, 767–772. [Google Scholar] [CrossRef] [PubMed]
  16. Lee, S.; Serre, M.L.; van Donkelaar, A.; Martin, R.V; Burnett, R.T.; Jerrett, M. Comparison of geostatistical interpolation and remote sensing thechniques for estimating long-term exposure to ambient PM2.5 concentrations across the continental United States. Environ. Health Perspect. 2012, 120, 1727–1732. [Google Scholar] [PubMed]
  17. Karner, A.A.; Eisinger, D.S.; Niemeier, D.A. Near-roadway air quality: Synthesizing the findings from real-world data. Environ. Sci. Technol. 2010, 44, 5334–5344. [Google Scholar] [CrossRef] [PubMed]
  18. Clougherty, J.E.; Kheirbek, I.; Eisl, H.M.; Ross, Z.; Pezeshki, G.; Gorczynski, J.E.; Johnson, S.; Markowitz, S.; Kass, D.; Matte, T. Intra-urban spatial variability in wintertime street-level concentrations of multiple combustion-related air pollutants: The New York City Community Air Survey (NYCCAS). J. Expo. Sci. Environ. Epidemiol. 2013, 23, 232–240. [Google Scholar] [CrossRef] [PubMed]
  19. Lindström, J.; Szpiro, A.A.; Sampson, P.D.; Oron, A.P.; Richards, M.; Larson, T.V.; Sheppard, L. A flexible spatio-temporal model for air pollution with spatial and spatio-temporal covariates. Environ. Ecol. Stat. 2013, 1–23. [Google Scholar] [CrossRef] [PubMed]
  20. Isakov, V.; Arunachalam, S.; Batterman, S.; Bereznicki, S.; Burke, J.; Dionisio, K.; Garcia, V.; Heist, D.; Perry, S.; Snyder, M.; et al. Air quality modeling in support of the near-road exposures and effects of urban air pollutants study (NEXUS). Int. J. Environ. Res. Public Health 2014, 11, 8777–8793. [Google Scholar] [CrossRef] [PubMed]
  21. Snyder, M.; Arunachalam, S.; Isakov, V.; Talgo, K.; Naess, B.; Valencia, A.; Omary, M.; Davis, N.; Cook, R.; Hanna, A. Creating locally-resolved mobile-source emissions inputs for air quality modeling in support of an exposure study in Detroit, Michigan, USA. Int. J. Environ. Res. Public Health 2014, 11, 12739–12763. [Google Scholar] [CrossRef] [PubMed]
  22. Van Ryswyk, K.; Wheeler, A.J.; Wallace, L.; Kearney, J.; You, H.; Kulka, R.; Xu, X. Impact of microenvironments and personal activities on personal PM2.5 exposures among asthmatic children. J. Expo. Sci. Environ. Epidemiol. 2014, 24, 260–268. [Google Scholar] [CrossRef] [PubMed]
  23. Chen, C.; Zhao, B.; Weschler, C. Assessing the Influence of Indoor Exposure to “Outdoor Ozone” on the Relationship between Ozone and Short-term Mortality in U.S. Communities. Environ. Health Perspect. 2012, 120, 235–240. [Google Scholar] [CrossRef] [PubMed]
  24. Sarnat, J.A.; Sarnat, S.E.; Flanders, W.D.; Chang, H.H.; Mulholland, J.; Baxter, L.; Isakov, V.; Özkaynak, H. Spatiotemporally resolved air exchange rate as a modifier of acute air pollution-related morbidity in Atlanta. J. Expo. Sci. Environ. Epidemiol. 2013, 23, 606–615. [Google Scholar] [CrossRef] [PubMed]
  25. Hodas, N.; Meng, Q.; Lunden, M.M.; Turpin, B.J. Toward refined estimates of ambient PM2.5 exposure: Evaluation of a physical outdoor-to-indoor transport model. Atmos. Environ. 2014, 83, 229–236. [Google Scholar] [CrossRef] [PubMed]
  26. Zauli Sajani, S.; Ricciardelli, I.; Trentini, A.; Bacco, D.; Maccone, C.; Castellazzi, S.; Lauriola, P.; Poluzzi, V.; Harrison, R.M. Spatial and indoor/outdoor gradients in urban concentrations of ultrafine particles and PM2.5 mass and chemical components. Atmos. Environ. 2015, 103, 307–320. [Google Scholar] [CrossRef]
  27. Hering, S.V.; Lunden, M.M.; Thatcher, T.L.; Kirchstetter, T.W.; Brown, N.J. Using Regional Data and Building Leakage to Assess Indoor Concentrations of Particles of Outdoor Origin. Aerosol Sci. Technol. 2007, 41, 639–654. [Google Scholar] [CrossRef]
  28. Vette, A.; Burke, J.; Norris, G.; Landis, M.; Batterman, S.; Breen, M.; Isakov, V.; Lewis, T.; Gilmour, M.I.; Kamal, A.; et al. The Near-Road Exposures and Effects of Urban Air Pollutants Study (NEXUS): Study design and methods. Sci. Total Environ. 2013, 448, 38–47. [Google Scholar] [CrossRef] [PubMed]
  29. Burke, J.M.; Zufall, M.J.; Ozkaynak, H. A population exposure model for particulate matter: Case study results for PM2.5 in Philadelphia, PA. J. Expo. Anal. Environ. Epidemiol. 2001, 11, 470–489. [Google Scholar] [CrossRef] [PubMed]
  30. Office of Air Quality Planning and Standards, U.S. Environmental Protection Agency. Total Risk Integrated Methodology (TRIM)—Air Pollutants Exposure Model Documentation (TRIM.Expo/APEX, Version 4.4); Volume I: User’s Guide, EPA-452/B-12-001a; Research Triangle Park: Durham, NC, USA, 2012.
  31. Office of Air Quality Planning and Standards, U.S. Environmental Protection Agency. Total Risk Integrated Methodology (TRIM)—Air Pollutants Exposure Model Documentation (TRIM.Expo/APEX, Version 4.4); Volume II: Technical Support, EPA-452/B-12-001b Document; Research Triangle Park: Durham, NC, USA, 2012.
  32. Wu, J.; Houston, D.; Lurmann, F.; Ong, P.; Winer, A. Exposure of PM2.5 and EC from diesel and gasoline vehicles in communities near the Ports of Los Angeles and Long Beach, California. Atmos. Environ. 2009, 43, 1962–1971. [Google Scholar] [CrossRef]
  33. Batterman, S.; Chambliss, S.; Isakov, V. Spatial resolution requirements for traffic-related air pollutant exposure evaluations. Atmos. Environ. 2014, 94, 518–528. [Google Scholar] [CrossRef] [PubMed]
  34. Serre, M.L. Environmental Spatiotemporal Mapping and Ground Water Flow Modeling Using the BME and ST Methods; University of North Carolina: Chapel Hill, NC, USA, 1999. [Google Scholar]
  35. Serre, M.L.; Christakos, G. Modern geostatistics: Computational BME analysis in the light of uncertain physical knowledge—The Equus Beds study. Stoch. Environ. Res. Risk Assess. 1999, 13, 1–26. [Google Scholar] [CrossRef]
  36. Snyder, M.G.; Venkatram, A.; Heist, D.K.; Perry, S.G.; Petersen, W.B.; Isakov, V. RLINE: A line source dispersion model for near-surface releases. Atmos. Environ. 2013, 77, 748–756. [Google Scholar] [CrossRef]
  37. Venkatram, A.; Snyder, M.G.; Heist, D.K.; Perry, S.G.; Petersen, W.B.; Isakov, V. Re-formulation of plume spread for near-surface dispersion. Atmos. Environ. 2013, 77, 846–855. [Google Scholar] [CrossRef]
  38. Federal Highway Administration Freight Analysis Framework 3 User Guide. Available online: http://www.ncbi.nlm.nih.gov/pubmed/24558170 (accessed on 6 May 2014).
  39. Chang, S.Y.; Vizuete, W.; Valencia, A.; Naess, B.; Isakov, V.; Palma, T.; Breen, M.; Arunachalam, S. A modeling framework for characterizing near-road air pollutant concentration at community scales. Sci. Total Environ. 2015, 538, 905–921. [Google Scholar] [CrossRef] [PubMed]
  40. U.S. Environmental Protection Agency. An Overview of Methods for EPA’s National-Scale Air Toxics Assessment. Available online: http://www.epa.gov/ttn/atw/nata2005/05pdf/nata_tmd.pdf (accessed on 20 November 2015).
  41. Breen, M.S.; Burke, J.M.; Batterman, S.A.; Vette, A.F.; Godwin, C.; Croghan, C.W.; Schultz, B.D.; Long, T.C. Modeling spatial and temporal variability of residential air exchange rates for the Near-Road Exposures and Effects of Urban Air Pollutants Study (NEXUS). Int. J. Environ. Res. Public Health 2014, 11, 11481–11504. [Google Scholar] [CrossRef] [PubMed]
  42. Dionisio, K.L.; Baxter, L.K.; Chang, H.H. An empirical assessment of exposure measurement error and effect attenuation in bipollutant epidemiologic models. Environ. Health Perspect. 2014, 122, 1216–1224. [Google Scholar] [CrossRef] [PubMed]
  43. Weschler, C.J.; Shields, H.C.; Nalk, D.V. Indoor chemistry involving O3, NO, and NO2 as evidenced by 14 months of measurements at a site in Southern California. Environ. Sci. Technol. 1994, 28, 2120–2132. [Google Scholar] [CrossRef] [PubMed]
  44. Breen, M.S.; Long, T.C.; Schultz, B.D.; Williams, R.W.; Richmond-Bryant, J.; Breen, M.; Langstaff, J.E.; Devlin, R.B.; Schneider, A.; Burke, J.M.; et al. Air Pollution Exposure Model for Individuals (EMI) in health studies: Evaluation for ambient PM2.5 in Central North Carolina. Environ. Sci. Technol. 2015, 11. [Google Scholar] [CrossRef]
  45. Meng, Q.Y.; Turpin, B.J.; Polidori, A.; Lee, J.H.; Weisel, C.; Morandi, M.; Colome, S.; Stock, T.; Winer, A.; Zhang, J. PM2.5 of ambient origin: Estimates and exposure errors relevant to PM epidemiology. Environ. Sci. Technol. 2005, 39, 5105–5112. [Google Scholar] [CrossRef] [PubMed]
  46. Breen, M.S.; Breen, M.; Williams, R.W.; Schultz, B.D. Predicting residential air exchange rates from questionnaires and meteorology: Model evaluation in central North Carolina. Environ. Sci. Technol. 2010, 44, 9349–9356. [Google Scholar] [CrossRef] [PubMed]
  47. Sherman, M.; Grimsrud, D.T. Infiltration-pressurization correlation: Simplified physical modeling. ASHRAE Trans. 1980, 86, 778–807. [Google Scholar]
  48. Chan, W.R.; Nazaroff, W.W.; Price, P.N.; Sohn, M.D.; Gadgil, A.J. Analyzing a database of residential air leakage in the United States. Atmos. Environ. 2005, 39, 3445–3455. [Google Scholar] [CrossRef]
  49. U.S. Census Bureau, American Community Survey (ACS). Available online: http://www.census.gov/programs-surveys/acs/data/summary-file.html (accessed on 3 December 2015).
  50. Goldman, G.T.; Mulholland, J.A.; Russell, A.G.; Srivastava, A.; Strickland, M.J.; Klein, M.; Waller, L.A.; Tolbert, P.E.; Edgerton, E.S. Ambient air pollutant measurement error: Characterization and impacts in a time-series epidemiologic study in atlanta. Environ. Sci. Technol. 2010, 44, 7692–7698. [Google Scholar] [CrossRef] [PubMed]

