
Associations Between Excessive Sodium Intake and Smoking and Alcohol Intake Among Korean Men: KNHANES V


Abstract
:1. Introduction
2. Materials and Methods
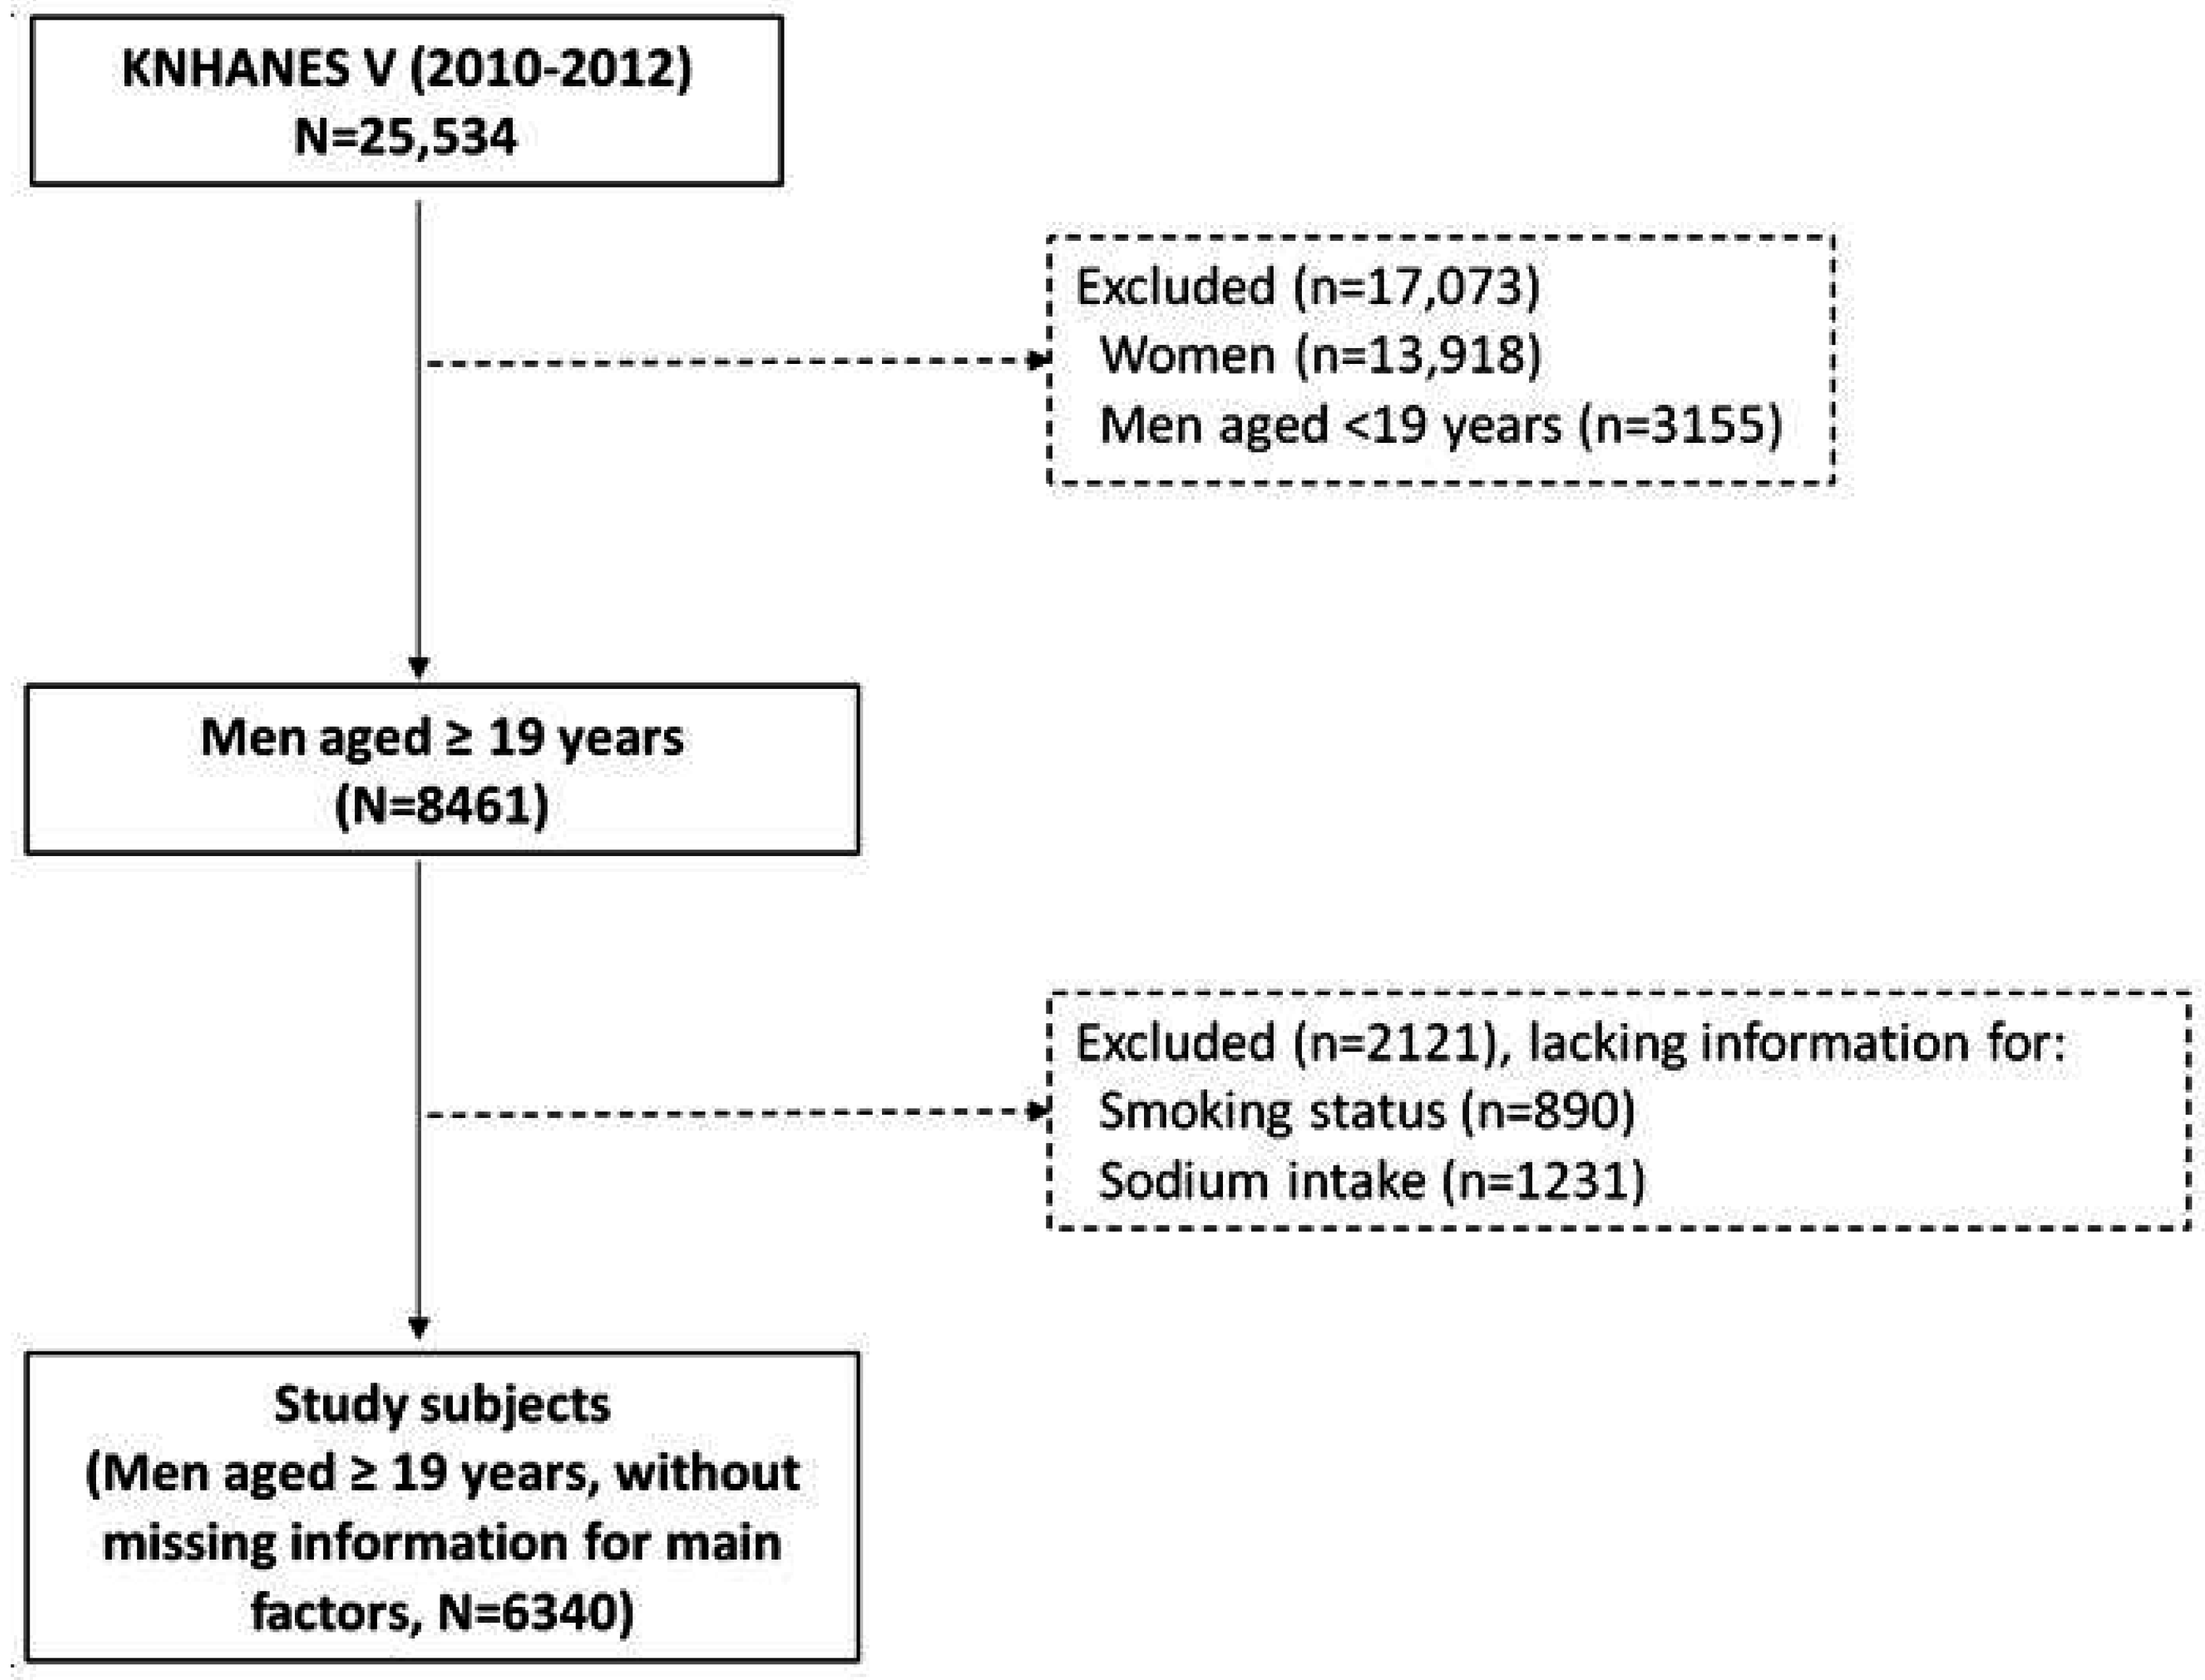
2.1. Study Subjects

2.2. Smoking-Related Factors
2.3. Sodium Intake
2.4. Urinary Creatinine Level
2.5. Confounding Factors
2.6. Statistical Analysis
3. Results
3.1. Distribution of Smoking-Related Factors

| All | Current Smoker | Urinary Cotinine Level (μg/mL) | Pack-Years of Smoking | ||
|---|---|---|---|---|---|
| N | N | % w (SE) | GM a (95% CI) | Median (min–max) | |
| All | 6340 | 2450 | 44.1 (0.8) | 0.05 (0.04, 0.07) | 13.2 (0–180) |
| Age group (years) | |||||
| 19–34 | 1071 | 507 | 47.9 (1.6) | 0.06 (0.04, 0.08) | 2.4 (0–33) |
| 35–64 | 3545 | 1528 | 46.6 (1.0) | 0.06 (0.04, 0.07) | 15.8 (0–156) |
| ≥65 | 1724 | 415 | 25.1 (1.2) | 0.02 (0.01, 0.03) | 20.0 (0–180) |
| p-value | <0.0001 | 0.0003 | <0.0001 | ||
| Household income | |||||
| Low | 1202 | 439 | 42.7 (2.1) | 0.1 (0.06, 0.16) | 20.0 (0–156) |
| Lower middle | 1631 | 659 | 46.8 (1.7) | 0.07 (0.04, 0.10) | 13.5 (0–180) |
| Upper middle | 1744 | 681 | 44.9 (1.4) | 0.05 (0.03, 0.07) | 10.5 (0–129) |
| High | 1705 | 647 | 41.3 (1.6) | 0.04 (0.03, 0.06) | 10.3 (0–180) |
| Unknown | 58 | 58 | 47.8 (9.0) | 0.07 (0.00, 2.96) | 16.4 (0–85.5) |
| p-value | 0.01 | 0.03 | <0.0001 | ||
| Marital status | |||||
| Married | 5109 | 1868 | 42.1 (0.9) | 0.04 (0.03, 0.06) | 15.1 (0–180) |
| Separated, widowed, or divorced | 314 | 147 | 54.2 (3.6) | 0.21 (0.08, 0.53) | 23.9 (0–180) |
| Not married | 912 | 432 | 47.8 (1.8) | 0.07 (0.05, 0.10) | 2.0 (0–74) |
| Unknown | 5 | 3 | 58.3 (25.6) | - | 40.0 (12.9–86) |
| p-value | <0.0001 | 0.001 | <0.0001 | ||
| Frequency of alcohol intake (/month) | |||||
| None | 1098 | 244 | 24.1 (1.7) | 0.02 (0.01, 0.03) | 15.7 (0–147) |
| 0–1 | 1215 | 405 | 37.8 (1.8) | 0.03 (0.02, 0.05) | 8.3 (0–180) |
| 2–4 | 1666 | 675 | 45.1 (1.5) | 0.05 (0.03, 0.07) | 8.9 (0–150) |
| ≥5 | 2333 | 1116 | 54.2 (1.3) | 0.11 (0.08, 0.15) | 18.5 (0–180) |
| Unknown | 28 | 10 | 46.6 (8.8) | 0.02 (0.00, 0.19) | 7.5 (0–87.5) |
| p-value | <0.0001 | <0.0001 | <0.0001 | ||
| Body mass index (kg/m2) | |||||
| <18.5 | 192 | 92 | 51.4 (4.8) | 0.04 (0.01, 0.32) | 17.0 (0–156) |
| 18.5 to <25 | 3940 | 1538 | 43.8 (1.0) | 0.05 (0.04, 0.07) | 12.8 (0–180) |
| ≥25 | 2182 | 807 | 44.1 (1.3) | 0.06 (0.04, 0.08) | 14.0 (0–180) |
| Unknown | 26 | 13 | 44.7 (11.5) | 0.01 (0, 6203.2) | 10.5 (0–45) |
| p-value | 0.14 | 0.93 | 0.006 | ||
| Frequency of eating out | |||||
| <1/month | 646 | 214 | 35.4 (2.5) | 0.04 (0.01, 0.11) | 24.8 (0–156) |
| 1–8/month | 2131 | 712 | 39.4 (1.5) | 0.06 (0.04, 0.08) | 17.5 (0–180) |
| 3–6/week | 1615 | 633 | 45.4 (1.5) | 0.05 (0.03, 0.07) | 10.0 (0–180) |
| ≥1/day | 1946 | 890 | 48.5 (1.4) | 0.06 (0.04, 0.08) | 10.0 (0–140) |
| Unknown | 2 | 1 | 42.6 (35.0) | - | 8.5 (0.5–16.5) |
| p-value | <0.0001 | 0.70 | <0.0001 | ||
| Correlation coefficient with urinary cotinine level (p-value) | 0.63 (<0.001) | - | 0.27 (<0.001) | ||
3.2. Distribution of Sodium Intake
| All | Sodium Intake (mg/day) | |
|---|---|---|
| N | GM a (95% CI) | |
| All | 6340 | 5133.2 (5034.5, 5233.9) |
| Age group (years) | ||
| 19–34 | 1071 | 5170.7 (4967.5, 5382.2) |
| 35–64 | 3545 | 5432.3 (5310.6, 5556.8) |
| ≥65 | 1724 | 3955.6 (3802.2, 4115.1) |
| p-value | <0.0001 | |
| Household income | ||
| Low | 1202 | 4253.6 (4047.6, 4470.1) |
| Lower middle | 1631 | 5050.2 (4868.3, 5238.8) |
| Upper middle | 1744 | 5409.6 (5242.9, 5581.7) |
| High | 1705 | 5442.4 (5232.8, 5660.4) |
| Unknown | 58 | 4707.9 (4111.7, 5390.4) |
| p-value | <0.0001 | |
| Marital status | ||
| Married | 5109 | 5239.5 (5132.6, 5348.6) |
| Separated, widowed, or divorced | 314 | 4743.3 (4346.6, 5176.3) |
| Not married | 912 | 4920.9 (4712.2, 5138.9) |
| Unknown | 5 | - |
| p-value | 0.01 | |
| Frequency of alcohol intake (/month) | ||
| None | 1098 | 4547.9 (4324.1, 4783.4) |
| 0–1 | 1215 | 4900.7 (4699.0, 5111.1) |
| 2–4 | 1666 | 5195.0 (5013.7, 5382.7) |
| ≥5 | 2333 | 5450.9 (5297.4, 5609.0) |
| Unknown | 28 | 5797.3 (4817.5, 6976.4) |
| p-value | <0.0001 | |
| Body mass index (kg/m2) | ||
| <18.5 | 192 | 4540.5 (4119.9, 5004.0) |
| 18.5 to <25 | 3940 | 4952.6 (4835.7, 5072.2) |
| ≥25 | 2182 | 5510.2 (5342.6, 5683.1) |
| Unknown | 26 | 4834.9 (3718.6, 6286.3) |
| p-value | <0.0001 | |
| Frequency of eating out | ||
| <1/month | 646 | 3906.3 (3622.5, 4212.3) |
| 1–8 month | 2131 | 4636.1 (4474.7, 4803.2) |
| 3–6/week | 1615 | 5397.2 (5213.6, 5587.1) |
| ≥1/day | 1946 | 5637.5 (5463.5, 5817.1) |
| Unknown | 2 | 6665.4 (29.7, 1,498,256.3) |
| p-value | <0.0001 |
3.3. Odds of Excessive Sodium Intake According to Smoking-Related Factors
| Smoking-Related Factors | Excessive Sodium Intake (>7392.52 mg/day) a | |||
|---|---|---|---|---|
| Crude Model | Adjusted Model b | |||
| N | Cases | OR (95% CI) | OR (95% CI) | |
| Smoking status | ||||
| Non-smoker | 1176 | 264 | 1.00 (ref) | 1.00 (ref) |
| Ex-smoker | 2714 | 666 | 1.21 (1.00, 1.47) | 1.16 (0.94, 1.43) |
| Current smoker | 2450 | 655 | 1.33 (1.10, 1.61) | 1.17 (0.95, 1.43) |
| p-trend | 0.01 | 0.22 | ||
| Urinary cotinine level (μg/mL) | ||||
| Q1 (0.009, 3.07) | 387 | 112 | 1.00 (ref) | 1.00 (ref) c |
| Q2 (3.07, 14.5) | 387 | 104 | 0.82 (0.56, 1.21) | 0.77 (0.52, 1.14) |
| Q3 (14.5, 1133.38) | 388 | 110 | 0.99 (0.70, 1.41) | 0.96 (0.66, 1.40) |
| Q4 (1133.38, 5800.17) | 387 | 137 | 1.31 (0.93, 1.84) | 1.29 (0.89, 1.86) |
| p-trend | 0.05 | 0.08 | ||
| Urinary cotinine level corrected by creatinine level (μg/g Cr) | ||||
| Q1 (0.00002, 0.02) | 387 | 106 | 1.00 (ref) | 1.00 (ref) |
| Q2 (0.02, 0.11) | 387 | 108 | 0.85 (0.57, 1.27) | 0.83 (0.55, 1.26) |
| Q3 (0.11, 6.63) | 388 | 112 | 1.10 (0.76, 1.57) | 1.07 (0.73, 1.56) |
| Q4 (6.63, 63.78) | 387 | 137 | 1.34 (0.94, 1.90) | 1.26 (0.87, 1.83) |
| p-trend | 0.04 | 0.11 | ||
| Pack-years of smoking | ||||
| Q1 (0, 1.3) | 1531 | 350 | 1.00 (ref) | 1.00 (ref) |
| Q2 (1.3, 13) | 1517 | 400 | 1.28 (1.05, 1.56) | 1.15 (0.94, 1.41) |
| Q3 (13, 28) | 1539 | 423 | 1.29 (1.06, 1.58) | 1.10 (0.88, 1.38) |
| Q4 (28, 180) | 1511 | 342 | 1.09 (0.89, 1.32) | 1.08 (0.86, 1.36) |
| p-trend | 0.27 | 0.53 | ||
3.4. Excessive Sodium Intake According to Alcohol Intake
| Excessive Sodium Intake (>7392.52 mg/day a) | ||||
|---|---|---|---|---|
| N | Cases | Crude model | Adjusted model b | |
| OR (95% CI) | OR (95% CI) | |||
| Frequency of alcohol intake (/month) | ||||
| None | 1098 | 190 | 1.00 (ref) | 1.00 (ref) |
| 0–1 | 1215 | 287 | 1.43 (1.08, 1.90) | 1.25 (0.93, 1.67) |
| 2–4 | 1666 | 425 | 1.43 (1.11, 1.85) | 1.17 (0.90, 1.52) |
| ≥5 | 2333 | 675 | 1.85 (1.43, 2.38) | 1.49 (1.14, 1.95) |
| p-trend | <0.0001 | 0.003 | ||
3.5. Excessive Sodium Intake According to Combined Smoking and Alcohol Intake
| Risk Group of Excessive Sodium Intake (>7392.52 mg/day) a | |||||
|---|---|---|---|---|---|
| N | Case | Crude Model | Adjusted Model b | ||
| OR (95% CI) | OR (95% CI) | ||||
| Smoking experience c | Current alcohol intake | ||||
| No | No | 279 | 46 | 1.00 (ref) | 1.00 (ref) |
| No | Yes | 893 | 217 | 1.39 (0.88, 2.18) | 1.27 (0.80, 2.02) |
| Yes | No | 819 | 144 | 1.08 (0.67, 1.72) | 1.15 (0.71, 1.86) |
| Yes | Yes | 4321 | 1170 | 1.76 (1.16, 2.67) | 1.54 (1.00, 2.37) |
| p-interaction | 0.0005 | 0.02 | |||
| Smoking experience c | Frequency of alcohol intake (≥5/month) | ||||
| No | No | 912 | 190 | 1.00 (ref) | 1.00 (ref) |
| No | Yes | 260 | 73 | 1.45 (0.98, 2.15) | 1.40 (0.94, 2.08) |
| Yes | No | 3067 | 712 | 1.23 (0.99, 1.52) | 1.22 (0.97, 1.53) |
| Yes | Yes | 2073 | 602 | 1.64 (1.33, 2.02) | 1.55 (1.23, 1.94) |
| p-interaction | 0.11 | 0.22 | |||
| Current smoker | Current alcohol intake | ||||
| No | No | 854 | 145 | 1.00 (ref) | 1.00 (ref) |
| No | Yes | 3018 | 777 | 1.53 (1.16, 2.02) | 1.30 (0.98, 1.74) |
| Yes | No | 244 | 45 | 1.07 (0.66, 1.74) | 1.00 (0.61, 1.63) |
| Yes | Yes | 2196 | 610 | 1.75 (1.31, 2.33) | 1.44 (1.07, 1.95) |
| p-interaction | 0.48 | 0.50 | |||
| Current smoker | Frequency of alcohol intake (≥5/month) | ||||
| No | No | 2655 | 567 | 1.00 (ref) | 1.00 (ref) |
| No | Yes | 1217 | 355 | 1.54 (1.26, 1.87) | 1.46 (1.20, 1.79) |
| Yes | No | 1324 | 335 | 1.26 (1.04, 1.53) | 1.19 (0.98, 1.46) |
| Yes | Yes | 1116 | 320 | 1.5 (1.23, 1.83) | 1.37 (1.11, 1.68) |
| p-interaction | 0.02 | 0.05 | |||
4. Discussion
5. Conclusions
Author Contributions
Conflicts of Interest
References
- Korea Centers for Disease Control and Prevention. Statistics of Health Behavior and Chronic Disease; Ministry of Health & Welfare: Cheongju, Chungbuk, Korea, 2013. [Google Scholar]
- OECD. Stat. Tobacco Consumption, % of Males Aged 15+ Who Are Daily Smokers. 2014. Available online: http://www.oecd-ilibrary.org/social-issues-migration-health/data/oecd-health-statistics/oecd-health-data-non-medical-determinants-of-health_data-00546-en;jsessionid=3eg7tl219a60a.x-oecd-live-02?isPartOf=/content/datacollection/health-data-en (accessed on 30 August 2015).
- Korea Centers for Disease Control and Prevention. Statistics of the Tenth Korea Youth Risk Behavior Web-Based Survey; Korea Centers for Disease Control and Prevention: Cheongju, Chungbuk, Korea, 2014. [Google Scholar]
- Chu, J.E.; Lee, H.; Yoon, C.H.; Cho, H.-I.; Hwang, J.-Y.; Park, Y.J. Relationships between depressed mood and life style patterns in Koreans aged 40 years. J. Korean Soc. Food Sci. Nutr. 2014, 43, 772–783. [Google Scholar] [CrossRef]
- Tamimi, A.; Serdarevic, D.; Hanania, N.A. The effects of cigarette smoke on airway inflammation in asthma and COPD: Therapeutic implications. Respir. Med. 2012, 106, 319–328. [Google Scholar] [CrossRef] [PubMed]
- Kushi, L.H.; Doyle, C.; McCullough, M.; Rock, C.L.; Demark-Wahnefried, W.; Bandera, E.V.; Gapstur, S.; Patel, A.V.; Andrews, K.; Gansler, T. American cancer society guidelines on nutrition and physical activity for cancer prevention: Reducing the risk of cancer with healthy food choices and physical activity. CA Cancer J. Clin. 2012, 62, 30–67. [Google Scholar] [CrossRef] [PubMed]
- Muezzinler, A.; Mons, U.; Gellert, C.; Schottker, B.; Jansen, E.; Kee, F.; O’Doherty, M.G.; Kuulasmaa, K.; Freedman, N.D.; Abnet, C.C.; et al. Smoking and all-cause mortality in older adults: Results from the chances consortium. Am. J. Prev. Med. 2015, 49, e53–e63. [Google Scholar] [CrossRef] [PubMed]
- Sato, K.; Endo, S.; Tomita, H. Sensitivity of three loci on the tongue and soft palate to four basic tastes in smokers and non-smokers. Acta Otolaryngol. Suppl. 2002, 122, 74–82. [Google Scholar] [CrossRef]
- Vennemann, M.M.; Hummel, T.; Berger, K. The association between smoking and smell and taste impairment in the general population. J. Neurol. 2008, 255, 1121–1126. [Google Scholar] [CrossRef] [PubMed]
- Jacob, N.; Golmard, J.-L.; Berlin, I. Differential perception of caffeine bitter taste depending on smoking status. Chemosens. Percept. 2014, 7, 47–55. [Google Scholar] [CrossRef]
- Fischer, M.E.; Cruickshanks, K.J.; Schubert, C.R.; Pinto, A.; Klein, B.E.; Klein, R.; Nieto, F.J.; Pankow, J.S.; Huang, G.H.; Snyder, D.J. Taste intensity in the beaver dam offspring study. Laryngoscope 2013, 123, 1399–1404. [Google Scholar] [CrossRef] [PubMed]
- Lampure, A.; Schlich, P.; Deglaire, A.; Castetbon, K.; Peneau, S.; Hercberg, S.; Mejean, C. Sociodemographic, psychological, and lifestyle characteristics are associated with a liking for salty and sweet tastes in french adults. J. Nutr. 2015, 145, 587–594. [Google Scholar] [CrossRef] [PubMed]
- John, U.; Meyer, C.; Rumpf, H.J.; Schumann, A.; Thyrian, J.R.; Hapke, U. Strength of the relationship between tobacco smoking, nicotine dependence and the severity of alcohol dependence syndrome criteria in a population-based sample. Alcohol Alcohol. 2003, 38, 606–612. [Google Scholar] [CrossRef] [PubMed]
- Joe, K.H.; Kim, D.J. The comorbidity of alcohol dependence and nicotine dependence. Korean J. Psychopharmacol. 2008, 19, 85–93. [Google Scholar]
- Chun, I.; Park, J.; Han, M.-A.; Choi, S.; Ryu, S.-Y. The association between smoking, alcohol intake, and low-salt diet: Results from the 2008 community health survey. J. Korean Diet. Assoc. 2013, 19, 223–235. [Google Scholar] [CrossRef]
- Kim, M.-G.; Kim, K.-Y.; Nam, H.-M.; Hong, N.-S.; Lee, Y.-M. The relationship between lifestyle and sodium intake in Korean middle-aged workers. J. Korea Academ. Ind. Coop. Soc. 2014, 15, 2923–2929. [Google Scholar] [CrossRef]
- Ministry of Health and Welfare. Guide Book of Korean Nutrient Intake Standard 2010; Ministry of Health and Welfare: Seoul, Korea, 2013.
- Freedman, D.A.; Petitti, D.B. Salt and blood pressure. Conventional wisdom reconsidered. Eval. Rev. 2001, 25, 267–287. [Google Scholar] [CrossRef] [PubMed]
- He, F.J.; Li, J.; Macgregor, G.A. Effect of longer-term modest salt reduction on blood pressure. Cochrane Database Syst. Rev. 2013, 4. [Google Scholar] [CrossRef]
- Park, D.I.; Choi-Kwon, S.; Han, K. Health behaviors of Korean female nursing students in relation to obesity and osteoporosis. Nurs. Outlook 2015, 63, 504–511. [Google Scholar] [CrossRef] [PubMed]
- Korea Centers For Disease Control and Prevention. Guide for Survey of Korean National Health & Nutrition Examination Survey, 2010–2012; Korea Centers for Disease Control and Prevention: Cheongju, Chungbuk, Korea, 2014. [Google Scholar]
- Jung-Choi, K.H.; Khang, Y.H.; Cho, H.J. Hidden female smokers in Asia: A comparison of self-reported with cotinine-verified smoking prevalence rates in representative national data from an Asian population. Tob. Control 2012, 21, 536–542. [Google Scholar] [CrossRef] [PubMed]
- National Rural Living Science Institute. The 7th Food Composition Table in Korea in 1996, 2001, 2006; National Rural Living Science Institute: Suwon, Korea, 2006. [Google Scholar]
- Ministry of Health and Welfare. Development of Recipe Database for Korea Health and Nutrition Examination; Korea Health Industry Development Institute: Cheongju, Korea, 1998.
- SAS proprietary software 9.4; SAS Institute: Cary, NC, USA, 2015.
- Rostron, B.L.; Chang, C.M.; Pechacek, T.F. Estimation of cigarette smoking-attributable morbidity in the United States. JAMA Intern. Med. 2014, 174, 1922–1928. [Google Scholar] [CrossRef] [PubMed]
- Cho, S.; Shin, A.; Park, S.K.; Shin, H.R.; Chang, S.H.; Yoo, K.Y. Alcohol drinking, cigarette smoking and risk of colorectal cancer in the Korean multi-center cancer cohort. J. Cancer Prev. 2015, 20, 147–152. [Google Scholar] [CrossRef] [PubMed]
- Yeon, J.-Y.; Kim, E.-Y.; Lee, E.-J.; Bae, Y.-J. Relationship among pack-years of smoking, metabolic biomarkers, and diet quality in male adults: From the Korean national health and nutrition examination surveys, 2007–2009. J. East Asian Soc. Diet. Life 2012, 22, 175–189. [Google Scholar]
- Jang, J.-Y.; Kim, M.-J.; Han, J.-S. A study on food frequency, dietary habits and nutrition knowledge of the elderly who intake high sodium. J. Korean Soc. Food Sci. Nutr. 2009, 38, 1362–1372. [Google Scholar] [CrossRef]
- Lampure, A.; Deglaire, A.; Schlich, P.; Castetbon, K.; Peneau, S.; Hercberg, S.; Mejean, C. Liking for fat is associated with sociodemographic, psychological, lifestyle and health characteristics. Br. J. Nutr. 2014, 112, 1353–1363. [Google Scholar] [CrossRef] [PubMed]
- Mejean, C.; Macouillard, P.; Castetbon, K.; Kesse-Guyot, E.; Hercberg, S. Socio-economic, demographic, lifestyle and health characteristics associated with consumption of fatty-sweetened and fatty-salted foods in middle-aged French adults. Br. J. Nutr. 2011, 105, 776–786. [Google Scholar] [CrossRef] [PubMed]
- Lee, S.H.; Kim, W.Y. Relationship of habitual alcohol consumption to the nutritional status in middle aged men. Korean J. Nutr. 1991, 24, 58–65. [Google Scholar]
- Talamini, R.; Bosetti, C.; La Vecchia, C.; Dal Maso, L.; Levi, F.; Bidoli, E.; Negri, E.; Pasche, C.; Vaccarella, S.; Barzan, L.; et al. Combined effect of tobacco and alcohol on laryngeal cancer risk: A case-control study. Cancer Causes Control 2002, 13, 957–964. [Google Scholar] [CrossRef] [PubMed]
- Katulanda, P.; Ranasinghe, C.; Rathnapala, A.; Karunaratne, N.; Sheriff, R.; Matthews, D. Prevalence, patterns and correlates of alcohol consumption and its’ association with tobacco smoking among sri lankan adults: A cross-sectional study. BMC Public Health 2014, 14. [Google Scholar] [CrossRef] [PubMed]
- Dierker, L.; Lloyd-Richardson, E.; Stolar, M.; Flay, B.; Tiffany, S.; Collins, L.; Bailey, S.; Nichter, M.; Nichter, M.; Clayton, R. The proximal association between smoking and alcohol use among first year college students. Drug Alcohol Depend. 2006, 81, 1–9. [Google Scholar] [CrossRef] [PubMed]
- Jeong, J.R.; Kim, S.; Jo, S.R.; Joh, J.Y.; Kim, Y.P. Health behaviors of breast cancer survivors with hypertension: A propensity analysis of KNHANES III-V (2005–2012). PLoS One 2015, 10. [Google Scholar] [CrossRef] [PubMed]
- Kim, D.W.; Oh, S.Y.; Kwon, S.O.; Kim, J. Comparison of validity of food group intake by food frequency questionnaire between pre- and post-adjustment estimates derived from 2-day 24-hour recalls in combination with the probability of consumption. Asian Pac. J. Cancer Prev. 2012, 13, 2655–2661. [Google Scholar] [CrossRef] [PubMed]
© 2015 by the authors; licensee MDPI, Basel, Switzerland. This article is an open access article distributed under the terms and conditions of the Creative Commons by Attribution (CC-BY) license (http://creativecommons.org/licenses/by/4.0/).
Share and Cite
Choi, K.-H.; Park, M.-S.; Kim, J.A.; Lim, J.-A. Associations Between Excessive Sodium Intake and Smoking and Alcohol Intake Among Korean Men: KNHANES V. Int. J. Environ. Res. Public Health 2015, 12, 15540-15549. https://doi.org/10.3390/ijerph121215001
Choi K-H, Park M-S, Kim JA, Lim J-A. Associations Between Excessive Sodium Intake and Smoking and Alcohol Intake Among Korean Men: KNHANES V. International Journal of Environmental Research and Public Health. 2015; 12(12):15540-15549. https://doi.org/10.3390/ijerph121215001
Chicago/Turabian StyleChoi, Kyung-Hwa, Myung-Sook Park, Jung Ae Kim, and Ji-Ae Lim. 2015. "Associations Between Excessive Sodium Intake and Smoking and Alcohol Intake Among Korean Men: KNHANES V" International Journal of Environmental Research and Public Health 12, no. 12: 15540-15549. https://doi.org/10.3390/ijerph121215001