
Differential Effects of Temperature Extremes on Hospital Admission Rates for Respiratory Disease between Indigenous and Non-Indigenous Australians in the Northern Territory

 ,
, 
Abstract
:1. Introduction
2. Background
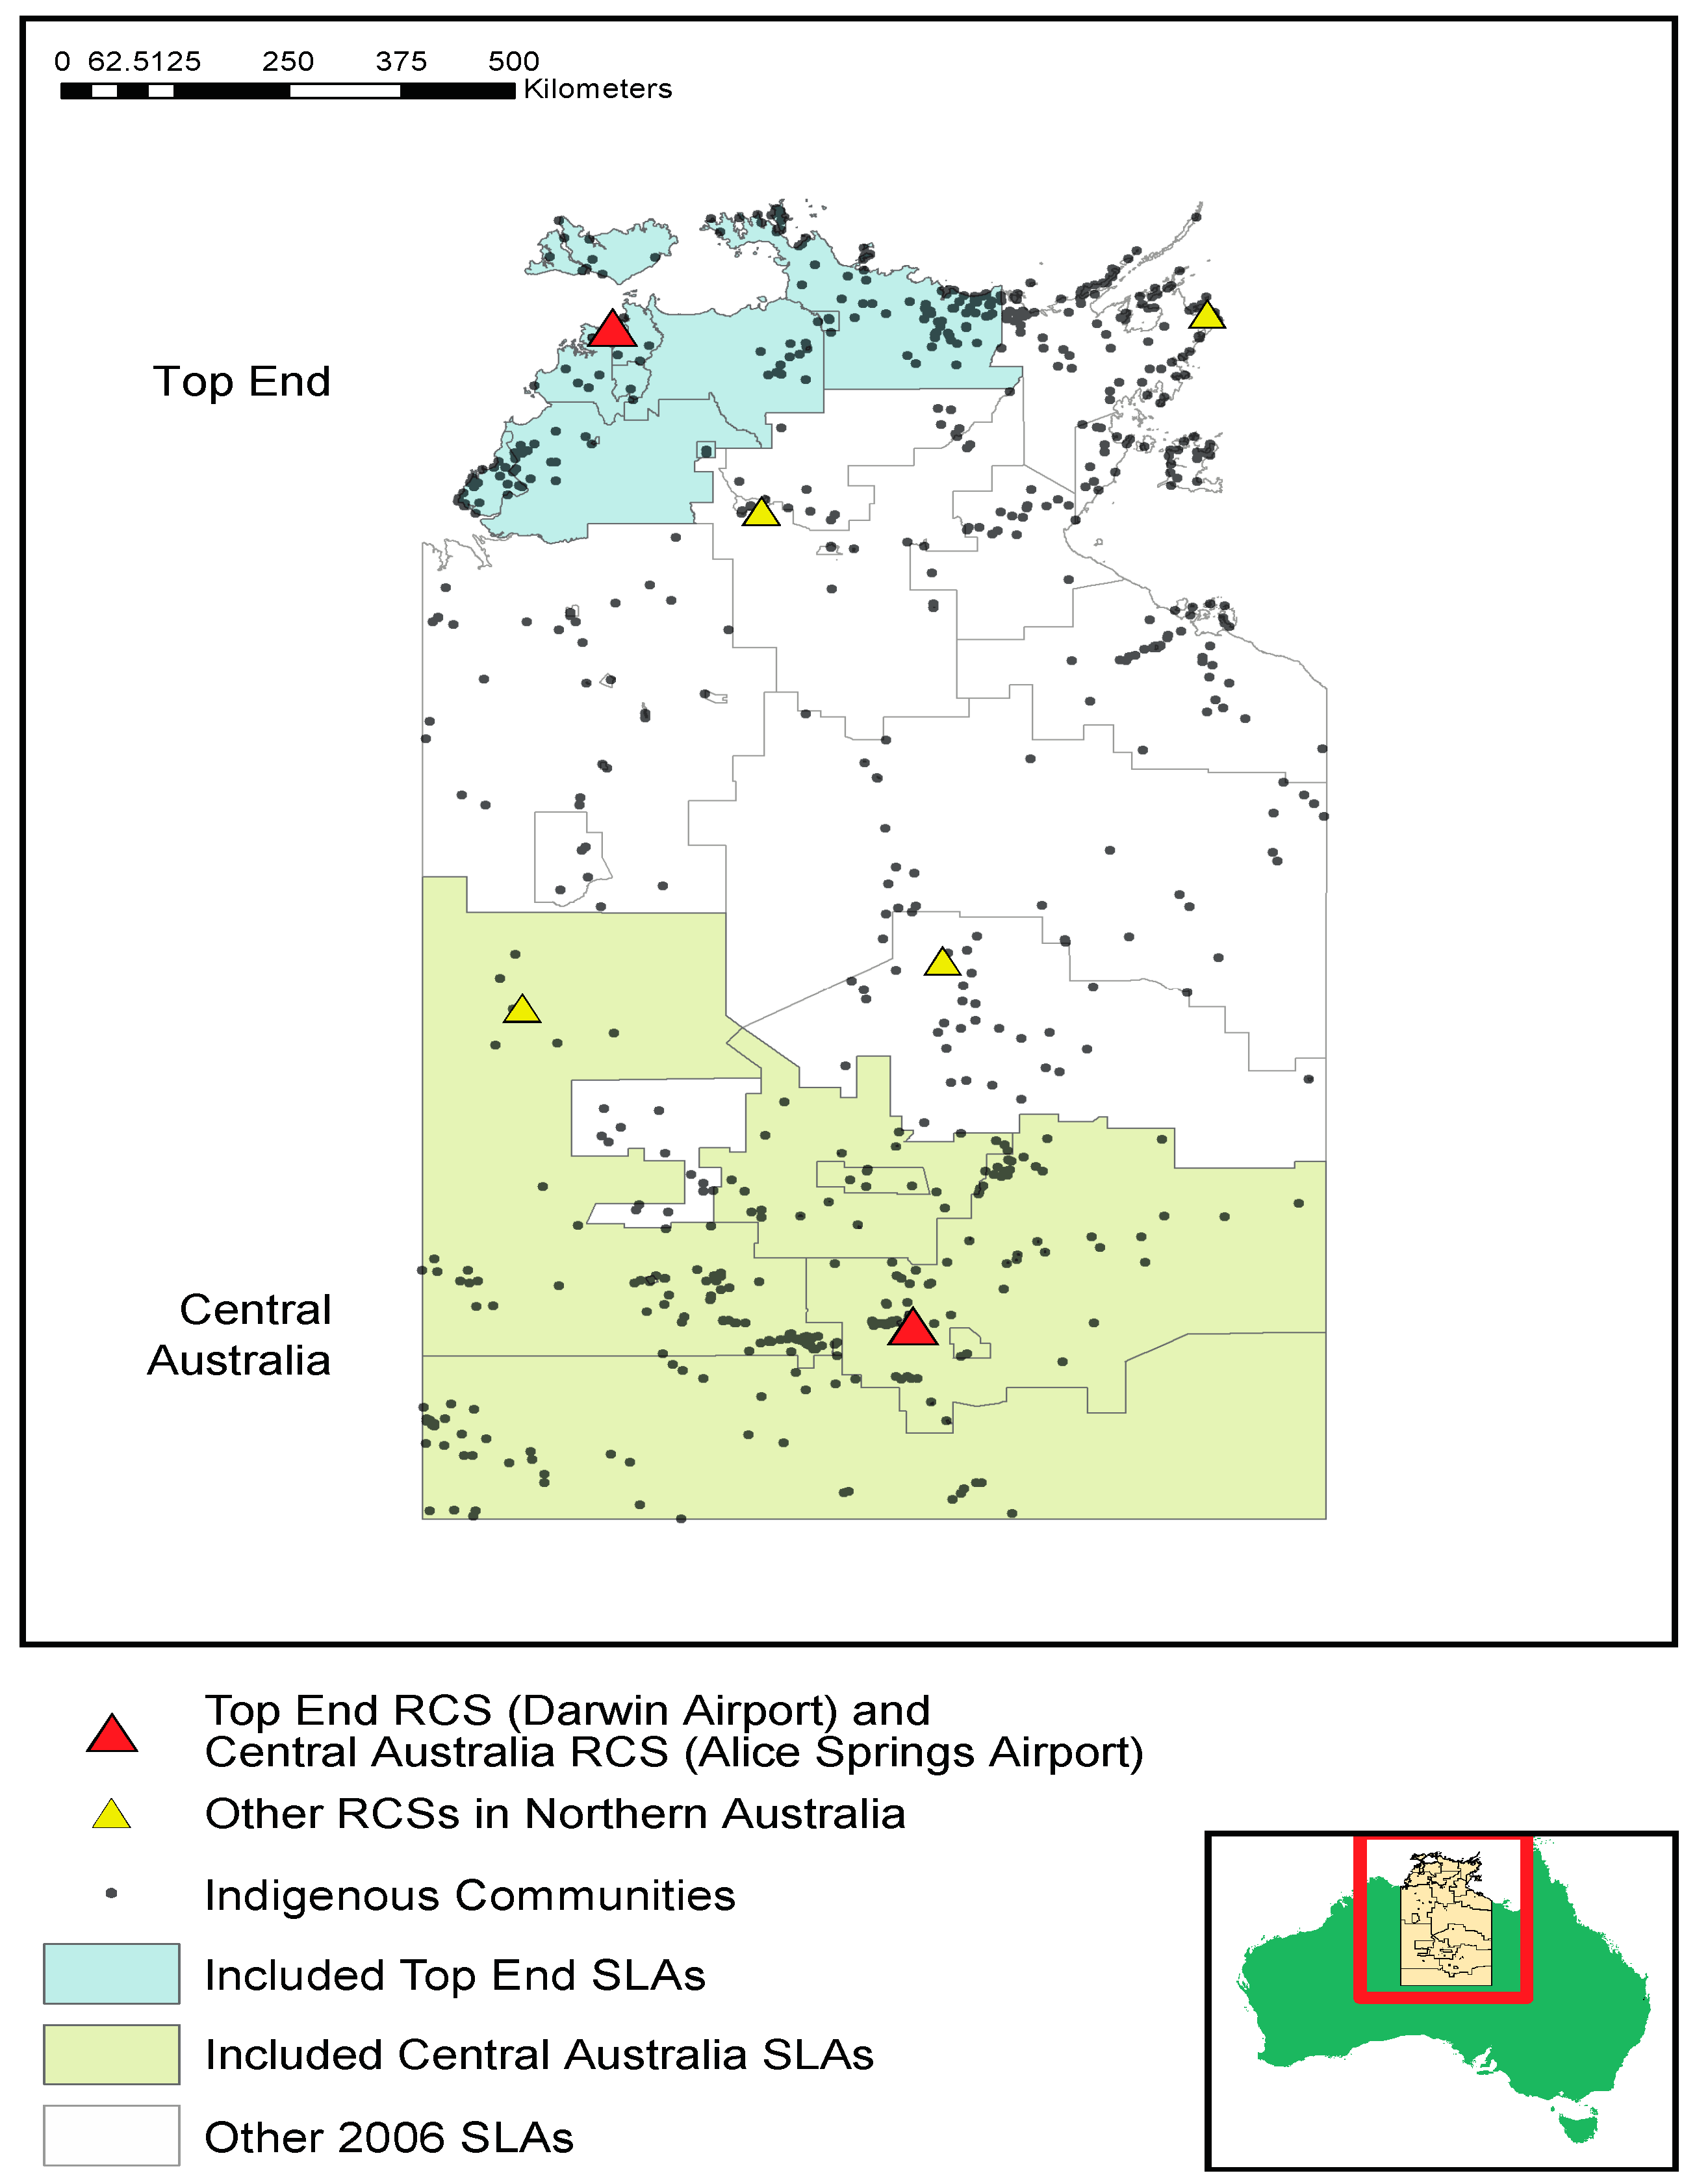
3. Methods
3.1. Hospital Admission Data
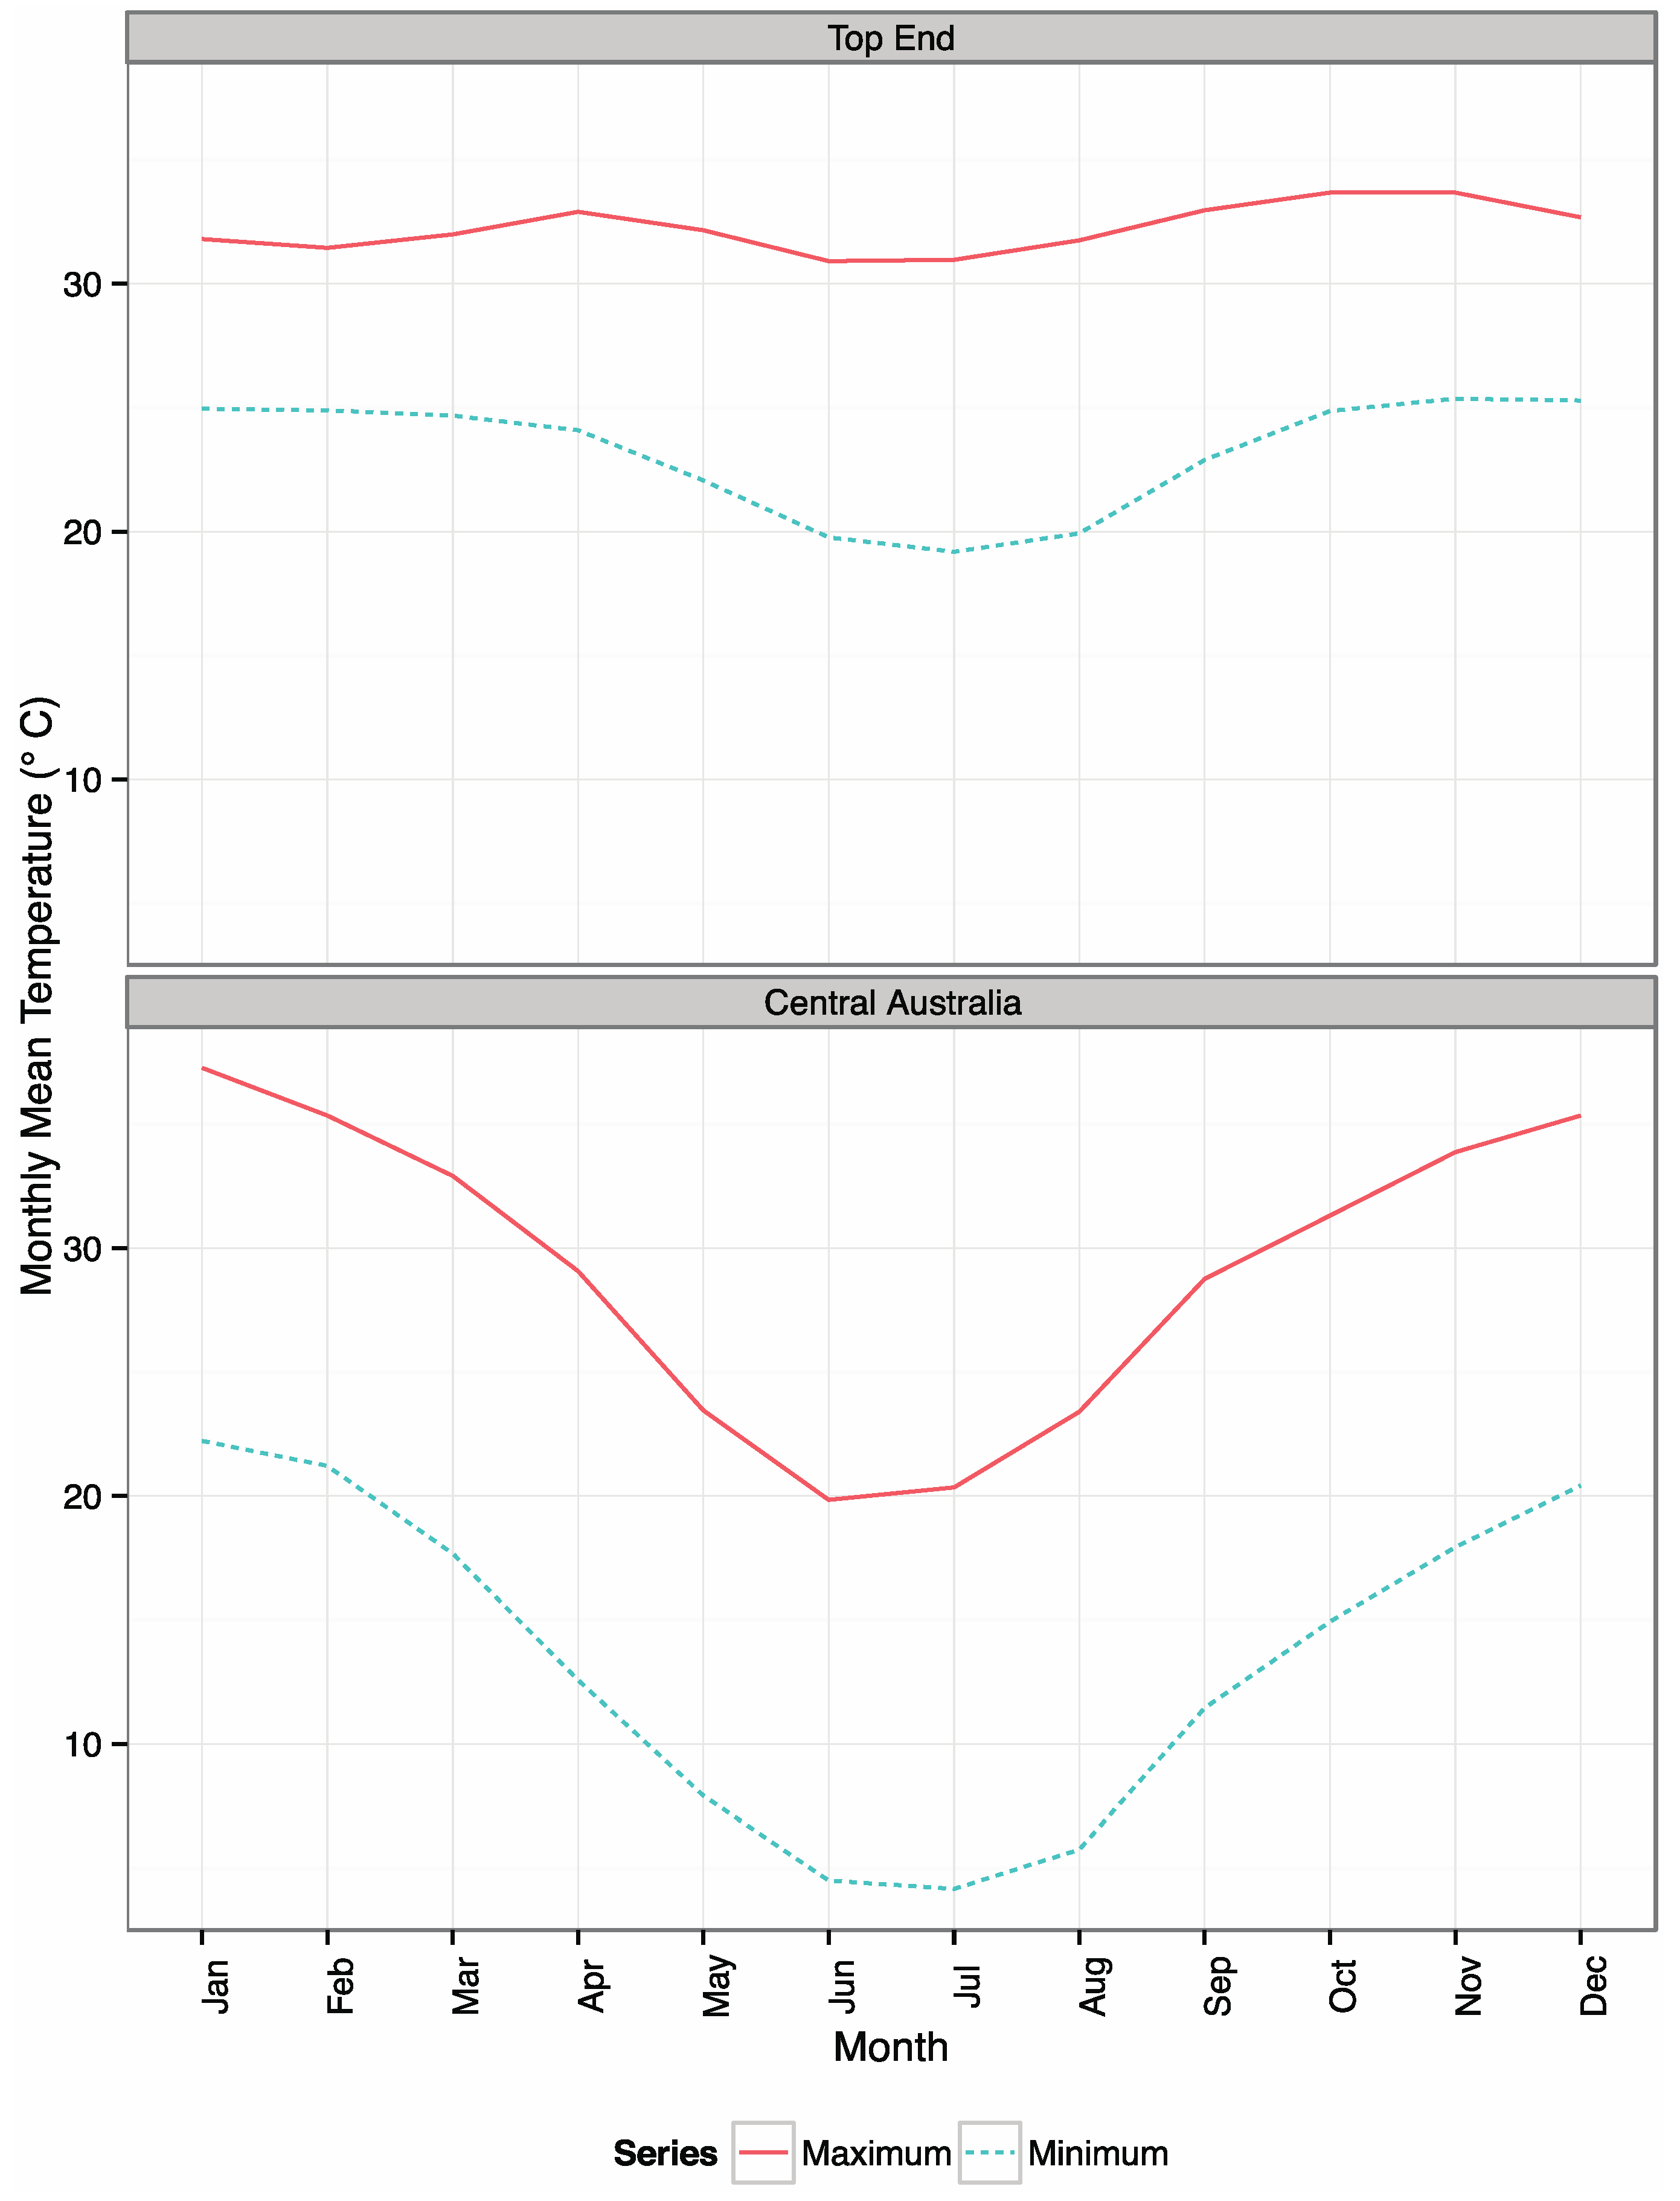
3.2. Climate Data
4. Results
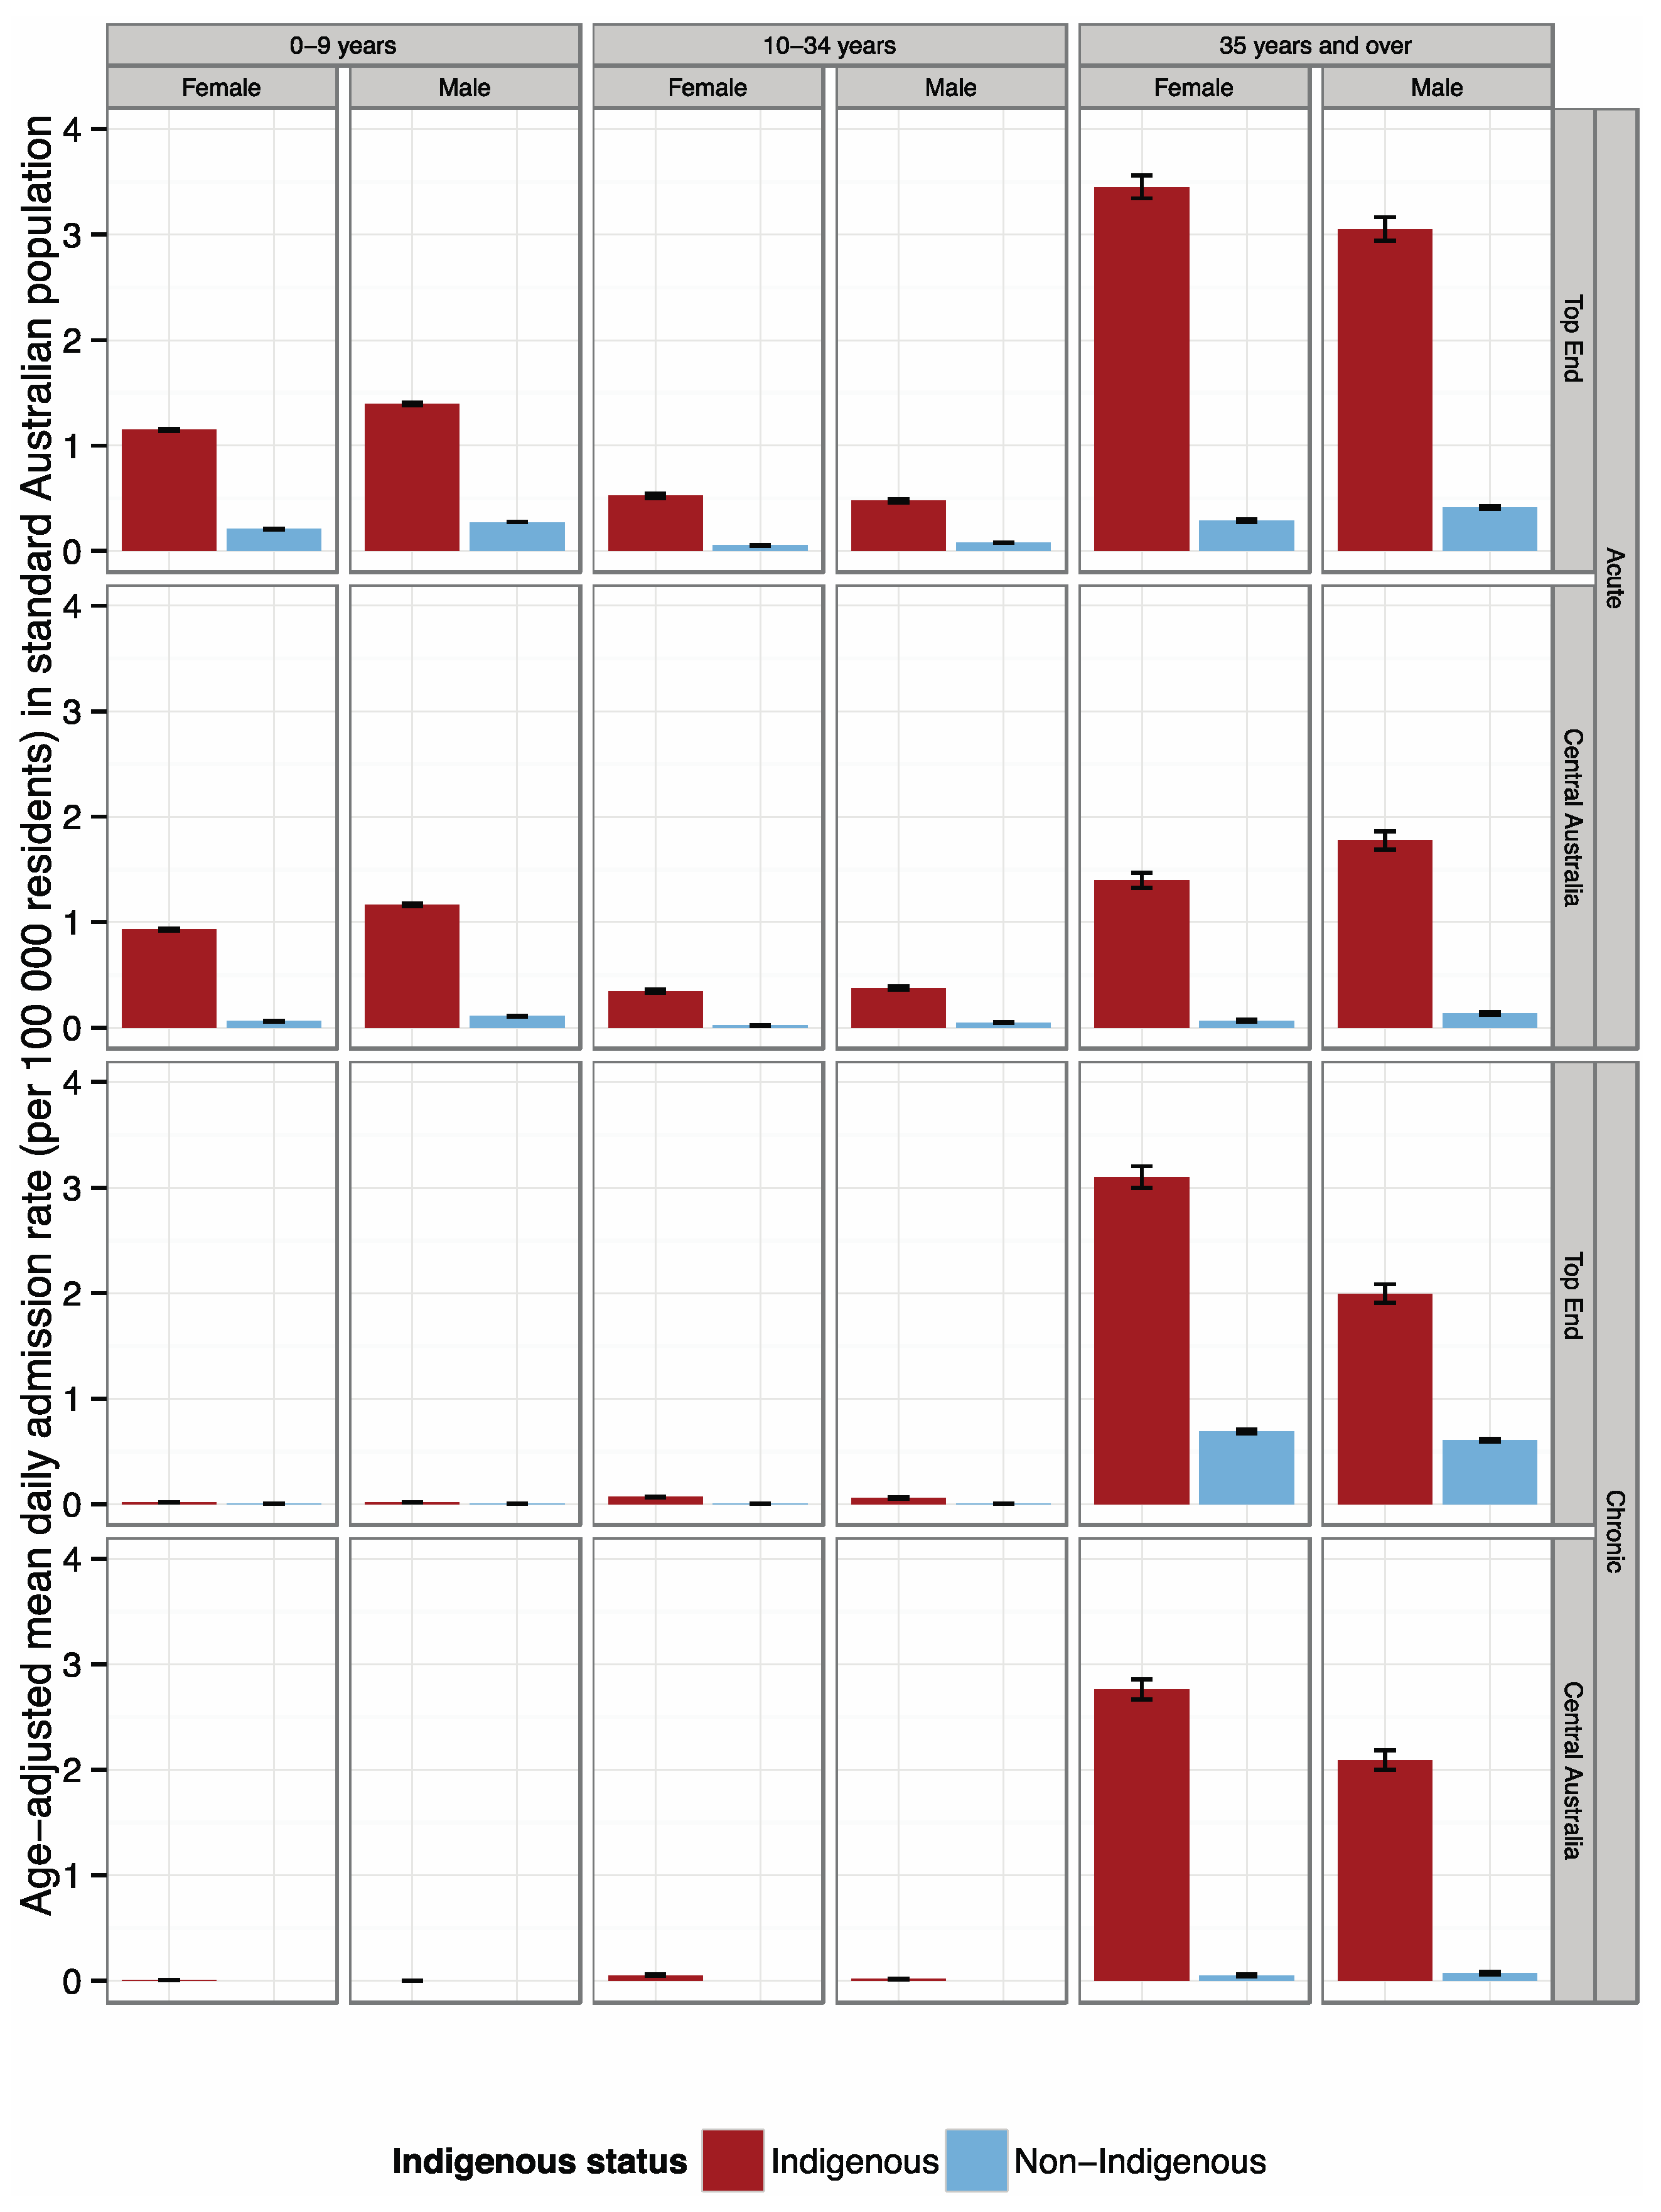
4.1. Admission Rates by Indigenous Status

4.2. Sensitivity of Respiratory Disease Admission Rate to Temperature
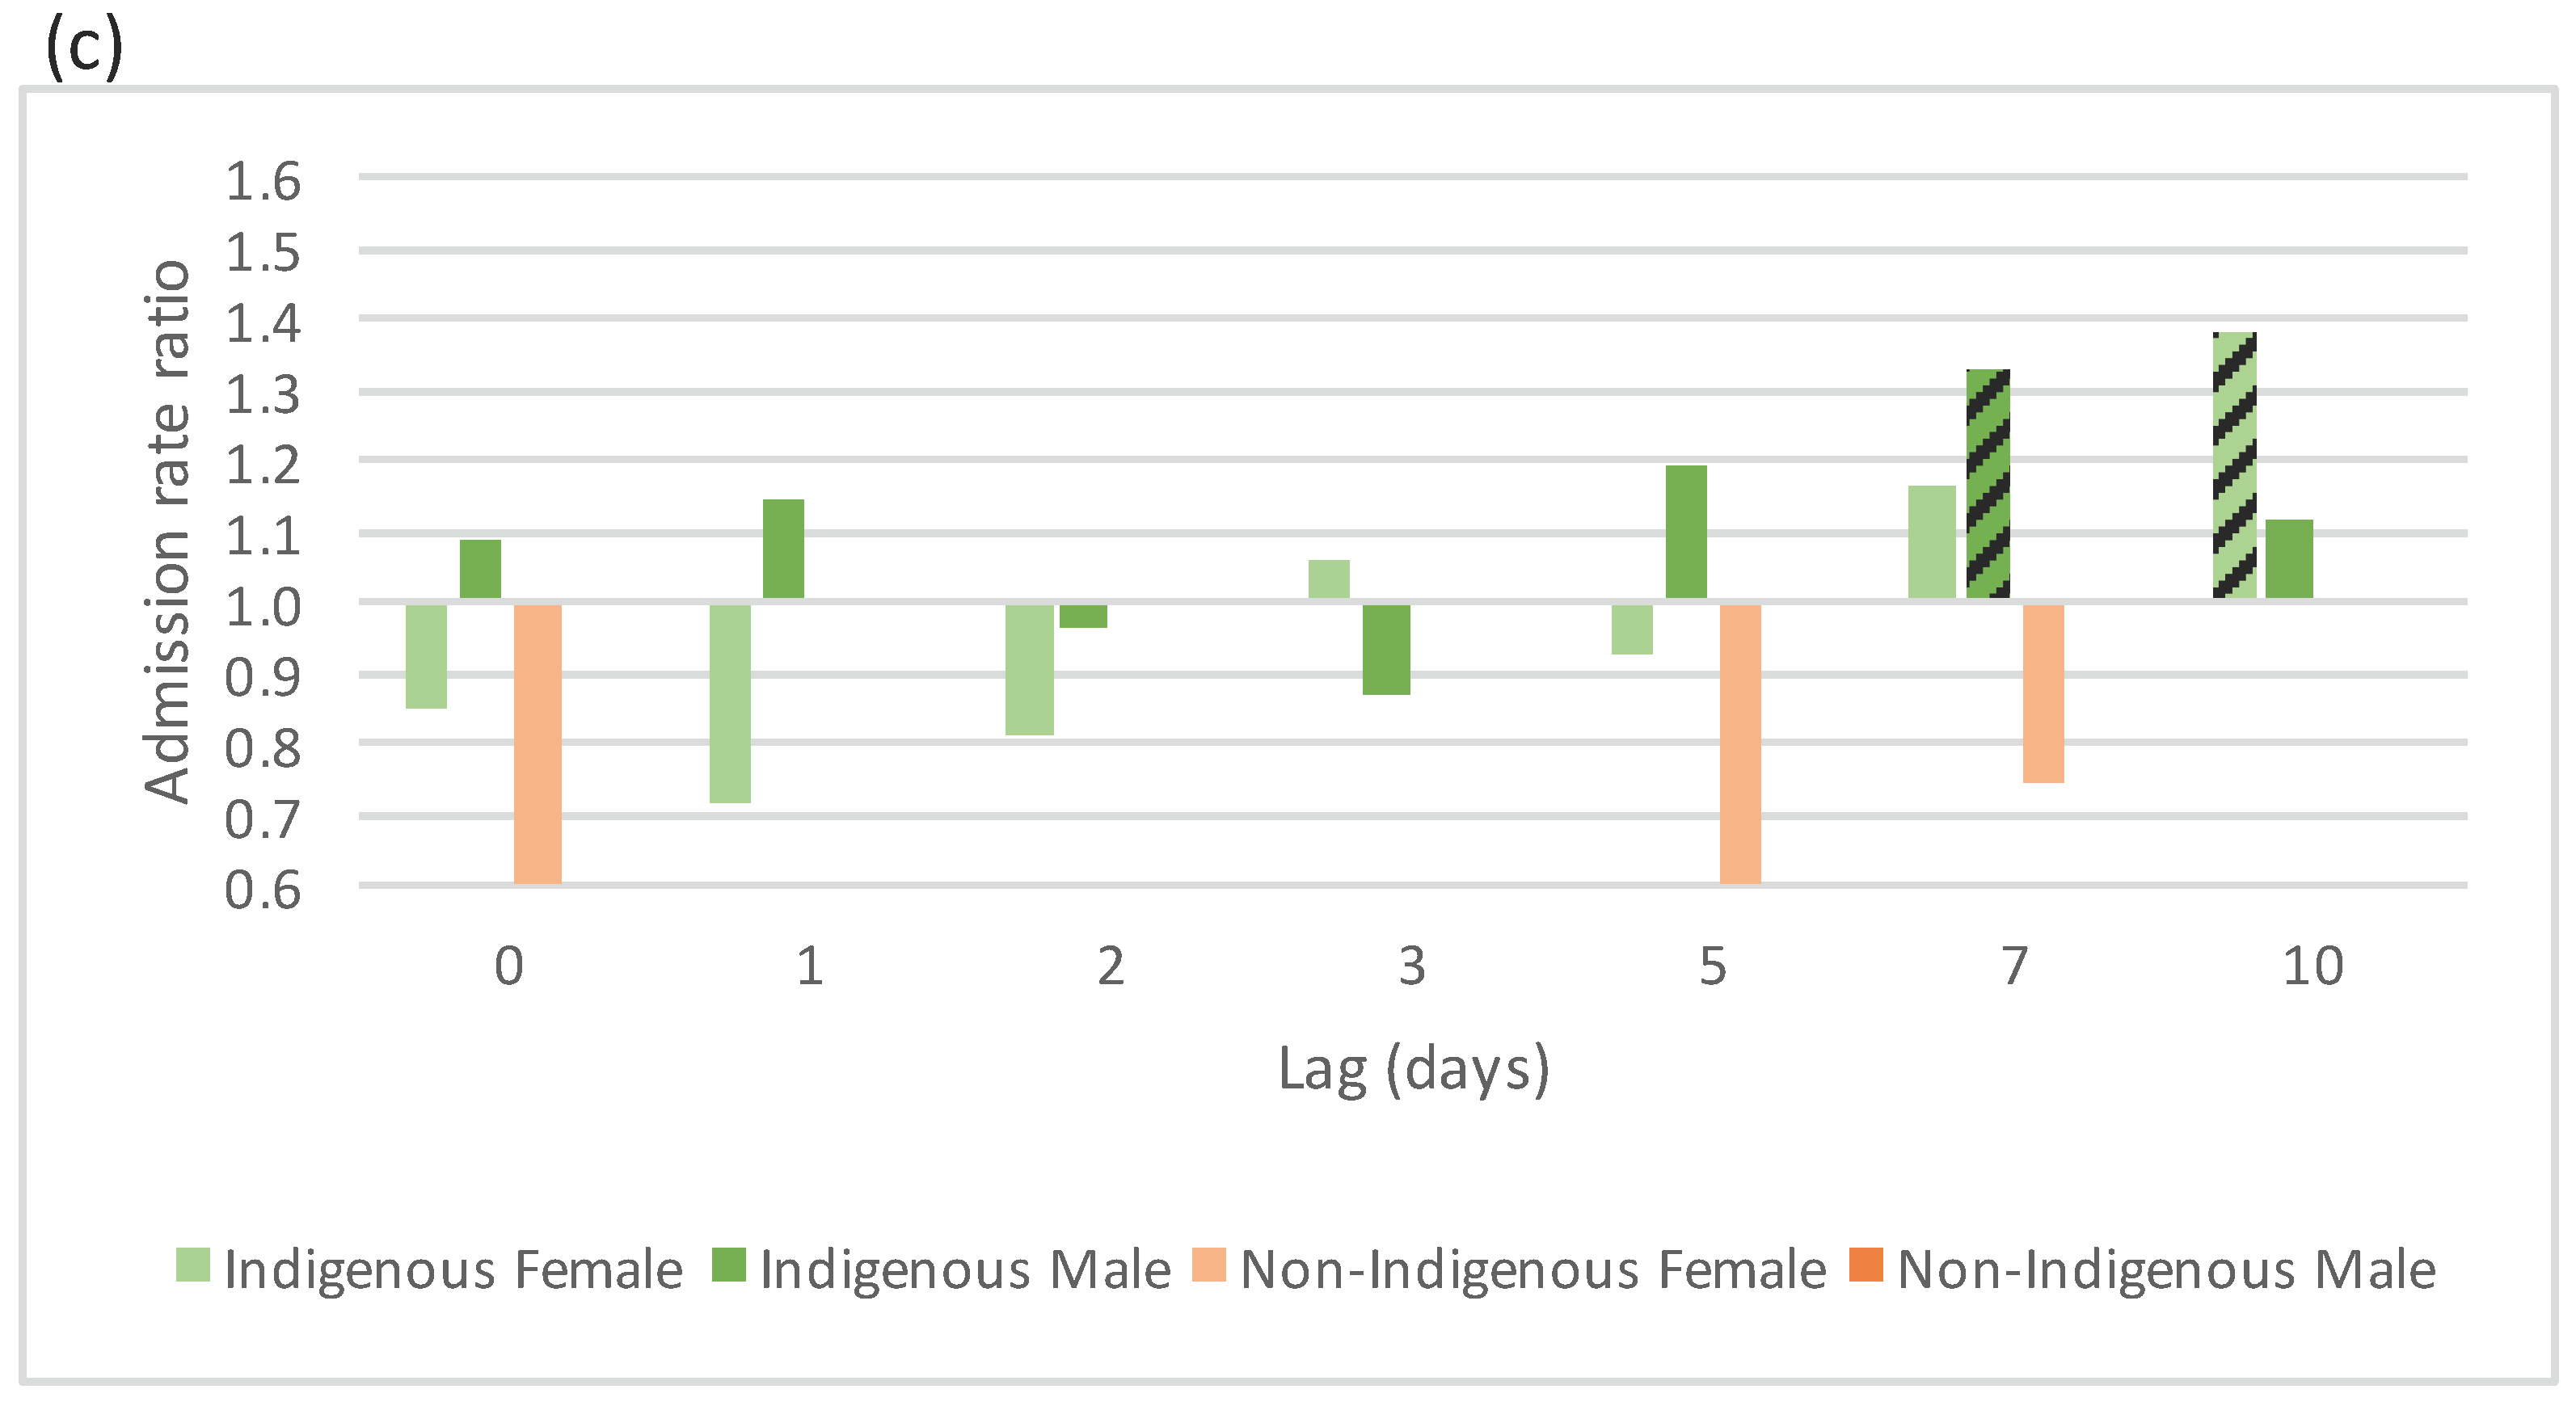
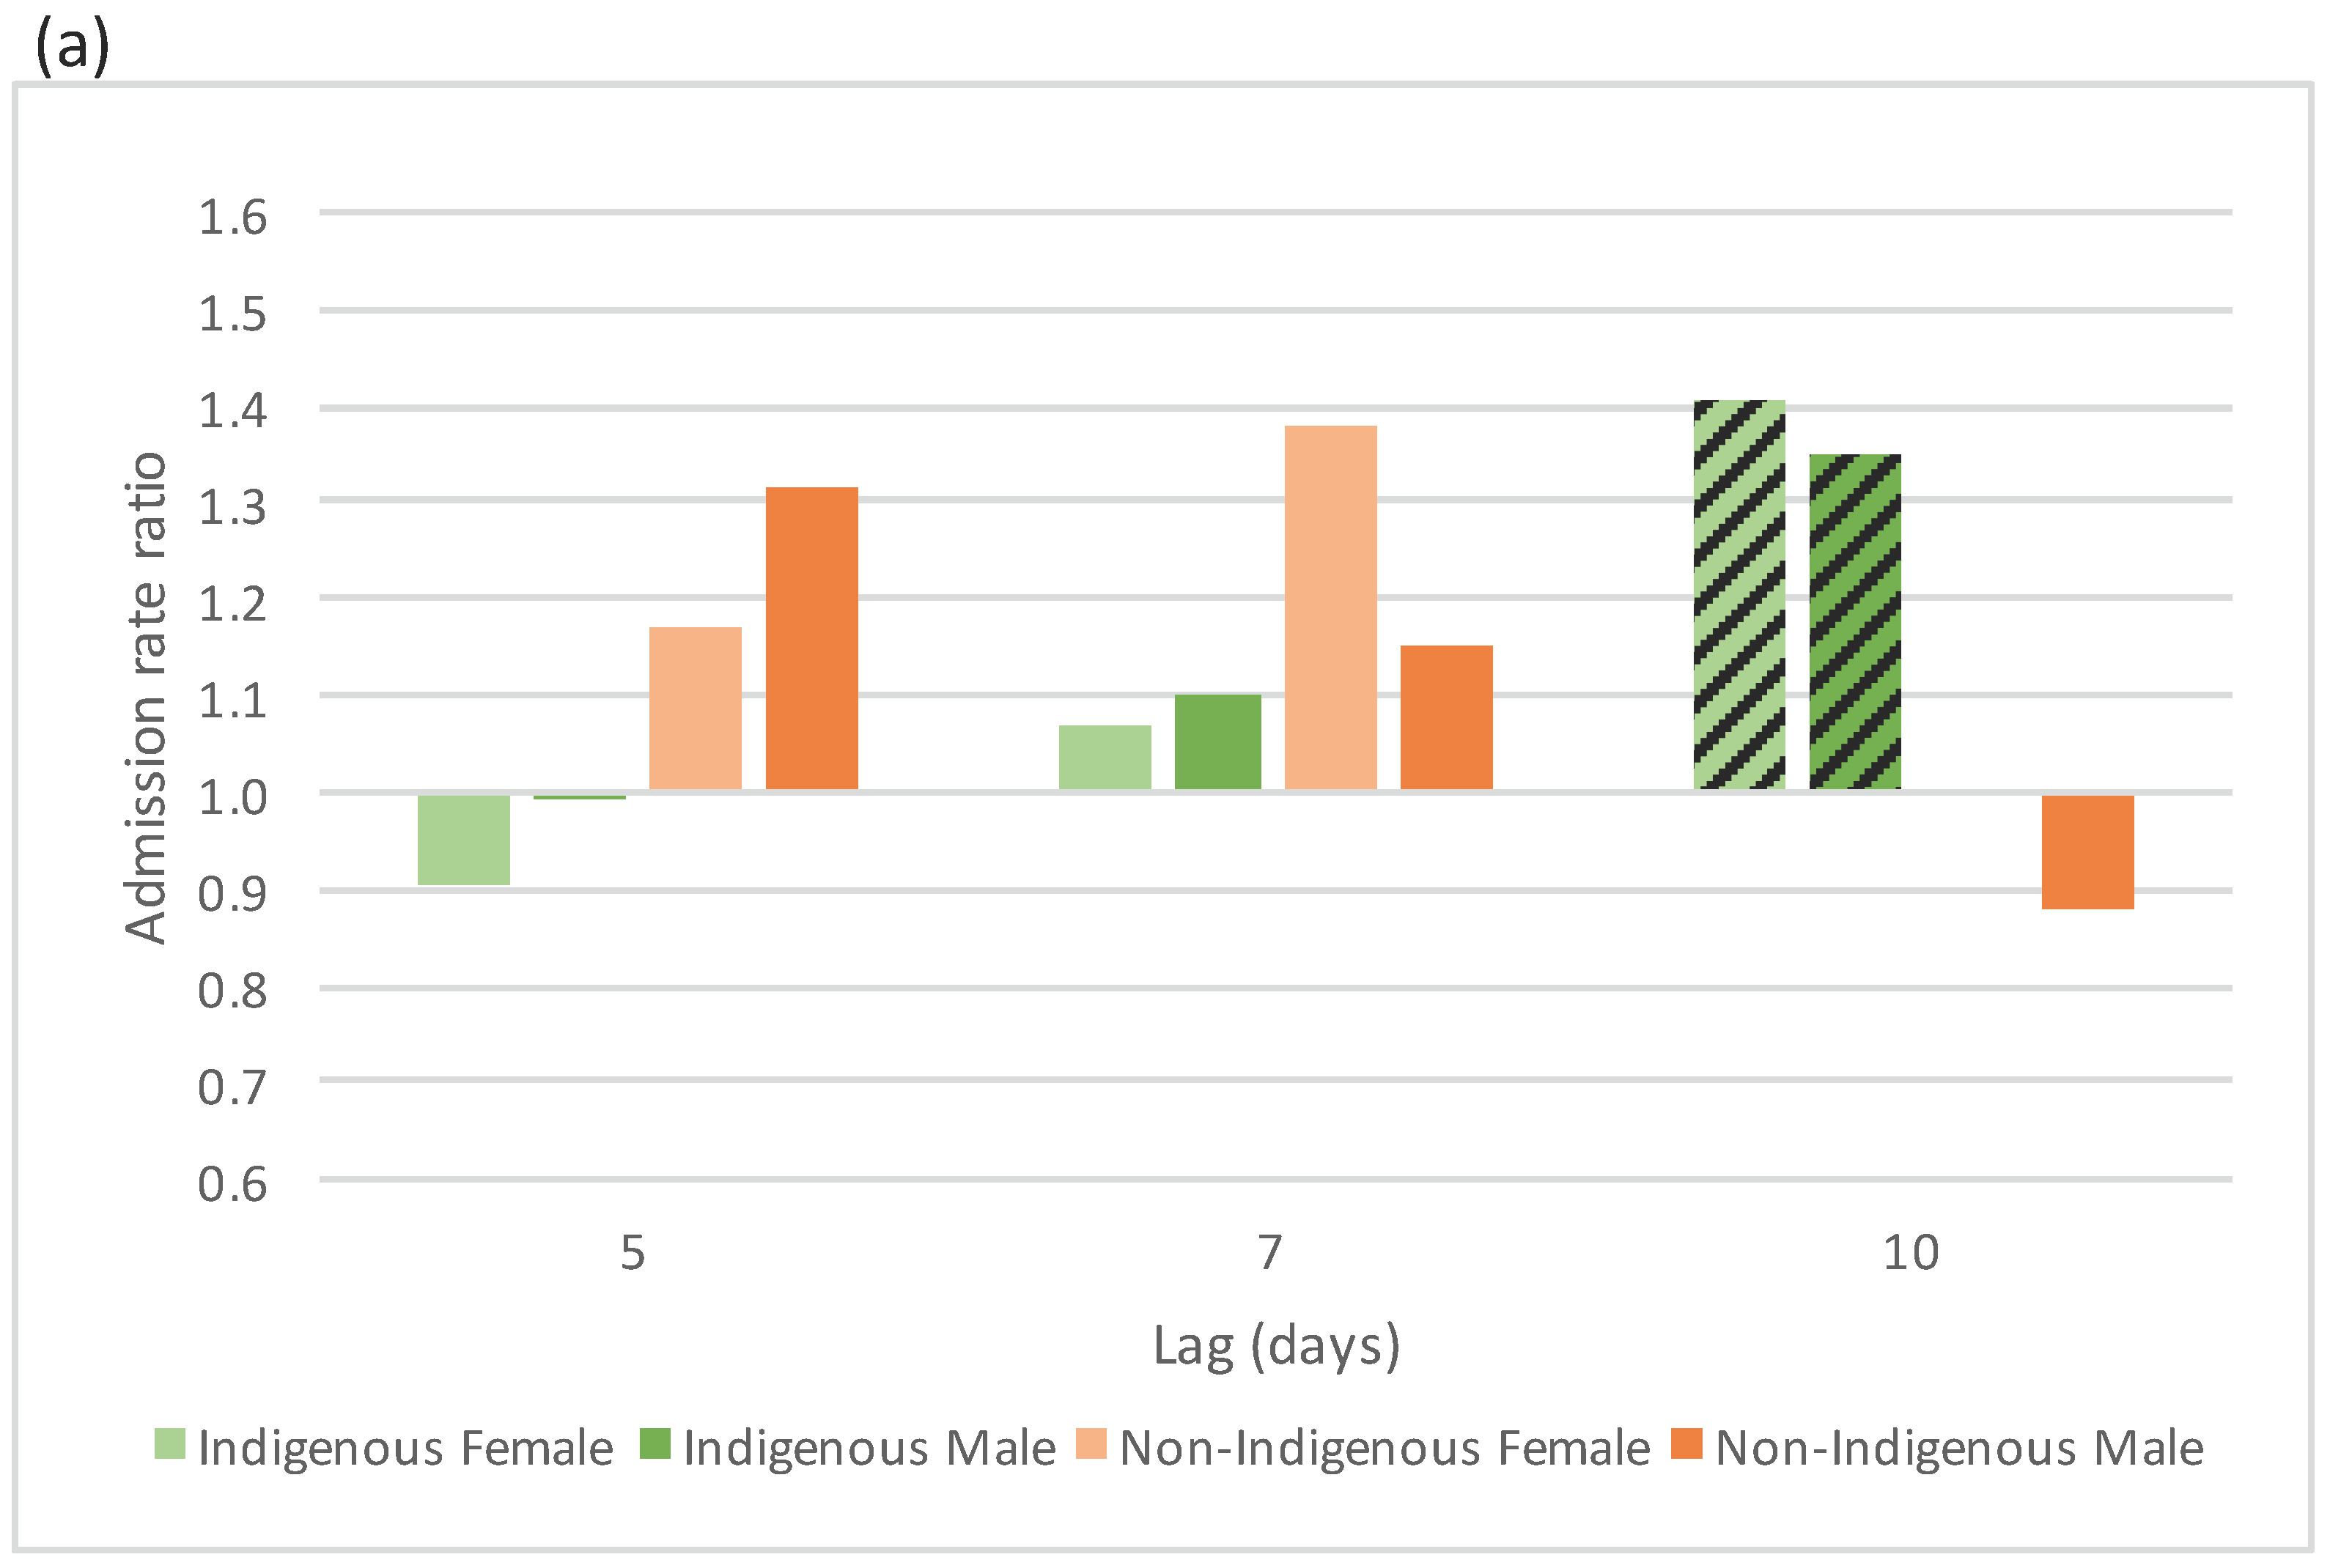
4.2.1. Acute Respiratory Conditions
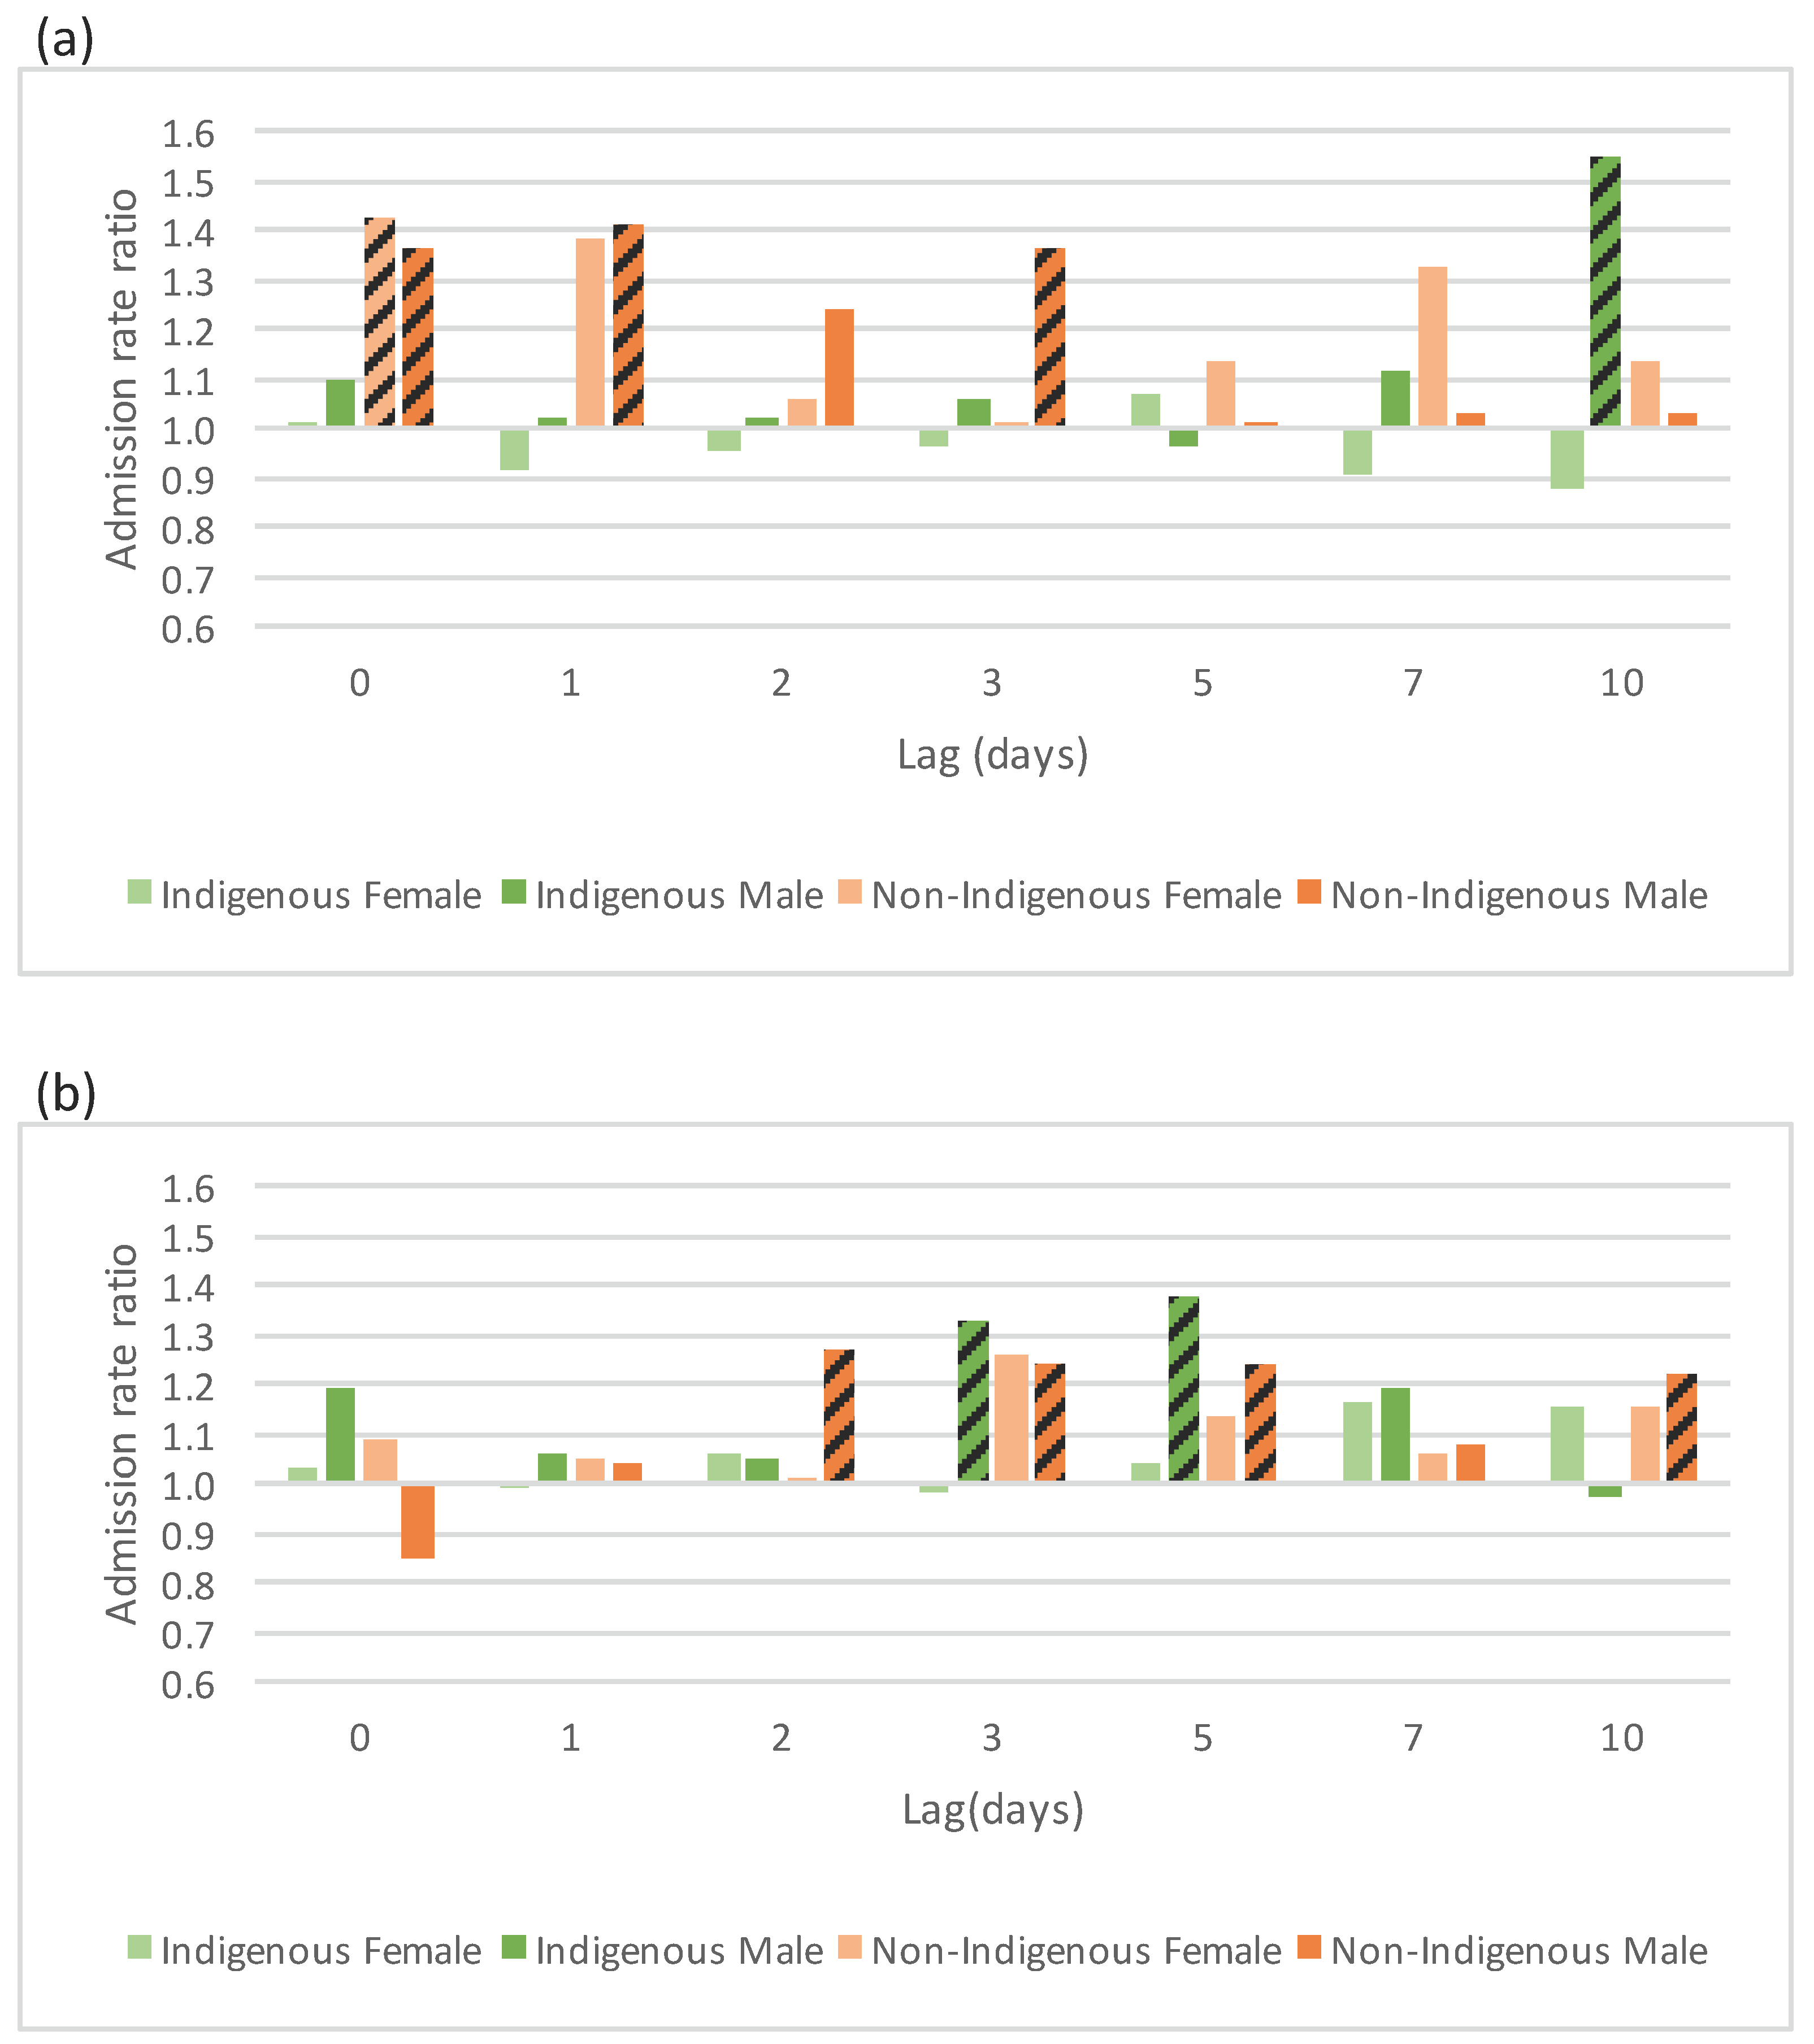
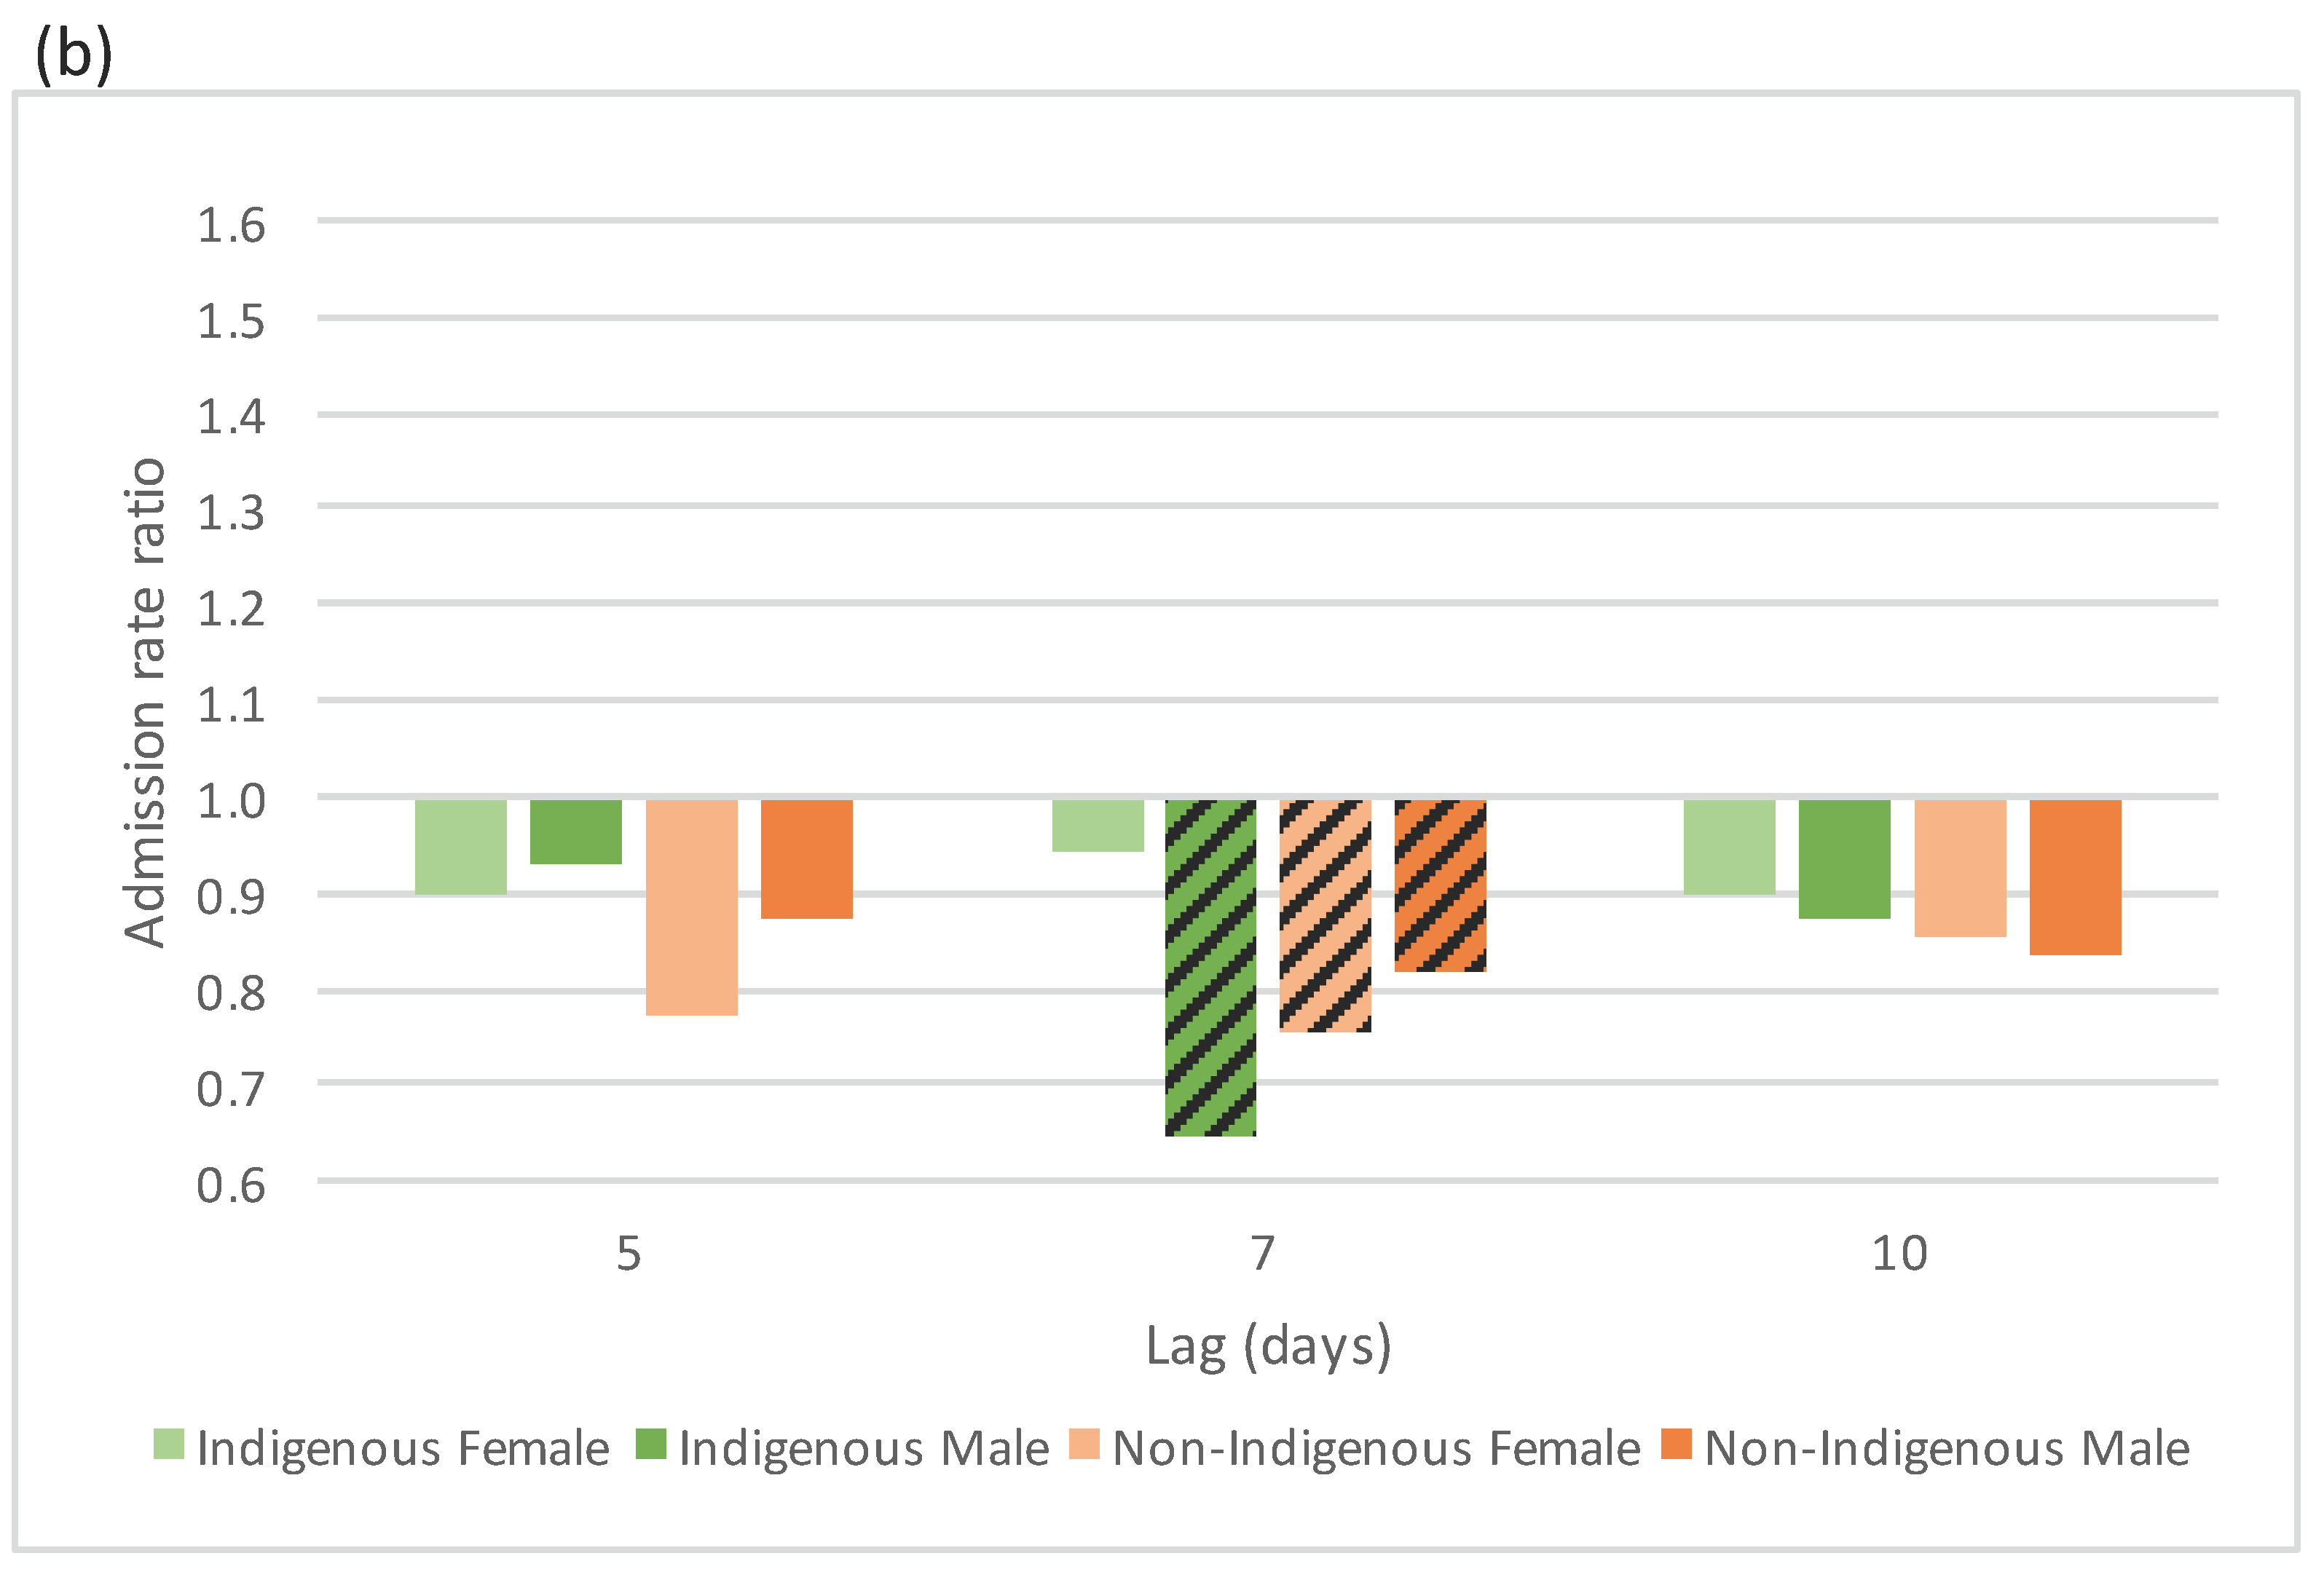
4.2.2. Chronic Respiratory Conditions
5. Discussion
5.1. Indigenous and Non-Indigenous Admission Rates
5.2. Sensitivity of Acute Respiratory Admission Rate to Temperature Extremes
5.2.1. Responses to Cold
5.2.2. Responses to Heat
5.3. Sensitivity of Chronic Respiratory Admission Rate to Temperature Extremes
6. Limitations
7. Conclusions
Acknowledgments
Author Contributions
Conflicts of Interest
References
- Burgi, P.; Caillet, M.; Haefeli, S. Field temperature measurements at Erta’Ale Lava Lake, Ethiopia. Bull. Volcanol. 2002, 64, 472–485. [Google Scholar] [CrossRef]
- Huh, Y.; Panteleyev, G.; Babich, D.; Zaitsev, A.; Edmond, J. The fluvial geochemistry of the rivers of Eastern Siberia: II. Tributaries of the Lena, Omoloy, Yana, Indigirka, Kolyma, and Anadyr draining the collisional/accretionary zone of the Verkhoyansk and Cherskiy ranges. Geochim. Cosmochim. Acta 1998, 62, 2053–2075. [Google Scholar] [CrossRef]
- Patz, J.; Campbell-Lendrum, D.; Holloway, T.; Foley, J. Impact of regional climate change on human health. Nature 2005, 438, 310–317. [Google Scholar] [CrossRef] [PubMed]
- Haines, A.; Kovats, S.; Campbell-Lendrum, D.; Corvalan, C. Climate change and human health: Impacts, vulnerability, and mitigation. Lancet 2006, 367, 2101–2109. [Google Scholar] [CrossRef]
- Trenberth, K.; Fasullo, T. Climate extremes and climate change: The Russian heat wave and other climate extremes of 2010. J. Geophys. Res. 2012, 117. [Google Scholar] [CrossRef]
- Hanna, E.; Tait, P. Limitations to thermoregulation and acclimatisation challenges human adaptation to global warming. Int. J. Environ. Res. Public Health 2015, 12, 8034–8074. [Google Scholar] [CrossRef] [PubMed]
- Katsouyanni, K.; Pantazopoulou, A.; Touloumi, G.; Tselepidakib, I.; Moustrisb, K.; Asimakopoulosb, D.; Poulopouloub, G.; Trichopoulos, D. Evidence for interaction between air pollution and high temperature in the causation of excess mortality. Arch. Environ. Health 1993, 48, 235–242. [Google Scholar] [CrossRef] [PubMed]
- Ebi, K.; Mills, M.; Smith, J.; Grambsch, A. Climate change and human health impacts in the United States: An update on the results of the U.S. National Assessment. Environ. Health Perspect. 2006, 114, 1318–1324. [Google Scholar] [CrossRef] [PubMed]
- Ren, C.; Williams, G.; Tong, S. Does particulate matter modify the association between temperature and cardiorespiratory diseases? Environ. Health Perspect. 2006, 114, 1690–1696. [Google Scholar] [CrossRef] [PubMed] [Green Version]
- Jalaludin, B.; Cowie, C. Particulate air pollution and cardiovascular disease—It is time to take it seriously. Rev. Environ. Health 2014, 29, 129–132. [Google Scholar] [CrossRef] [PubMed]
- AIHW. The Health and Welfare of Australia’s Aboriginal and Torres Strait Islander Peoples. Available online: http://www.aihw.gov.au/WorkArea/DownloadAsset.aspx?id=10737418955 (accessed on 12 September 2015).
- SCRGSP. Overcoming Indigenous Disadvantage: Key Indicators 2014. Available online: http://www.pc.gov.au/research/ongoing/overcoming-indigenous-disadvantage/key-indicators-2014 (accessed on 12 September 2015).
- CoA. Closing the Gap Prime Minister’s Report 2014. Available online: https://www.dpmc.gov.au/sites/default/files/publications/closing_the_gap_2014.pdf (accessed on 12 September 2015).
- NATSIHP. National Aboriginal and Torres Strait Islander Health Plan 2013–2023. Available online: http://www.health.gov.au/natsihp (accessed on 12 September 2015).
- Loughnan, M.; Nicholls, N.; Tapper, N. Demographic, seasonal, and spatial differences in acute myocardial infarction admissions to hospital in Melbourne, Australia. Int. J. Health Geogr. 2008, 7. [Google Scholar] [CrossRef] [PubMed]
- Ayres, J.; Forsberg, B.; Annesi-Maesano, I.; Dey, R.; Ebi, K.; Helms, P. Climate change and respiratory disease: European respiratory society position statement. Eur. Respir. J. 2009, 34, 295–302. [Google Scholar] [CrossRef] [PubMed]
- Gosling, S.; Lowe, J.; McGregor, G.; Pelling, M.; Malamud, B. Associations between elevated atmospheric temperature and human mortality: A critical review of the literature. Clim. Chang. 2009, 92, 299–341. [Google Scholar] [CrossRef]
- IPCC. Managing the Risks of Extreme Events and Disasters to Advance Climate Change Adaptation. In A Special Report of Working Groups I and II of the Intergovernmental Panel on Climate Change; Field, C.B.V., Barros, T.F., Stocker, D., Qin, D.J., Dokken, K.L., Ebi, M.D., Mastrandrea, K.J., Mach, G.-K., Plattner, S.K., Allen, M., et al., Eds.; Cambridge University Press: Cambridge, UK; New York, NY, USA, 2012. [Google Scholar]
- McGregor, G.R.; Bessemoulin, P.; Ebi, K.; Menne, B. Heatwaves and Health: Guidance on Warning-System Development, Global Change. Available online: http://www.who.int/globalchange/publications/heatwaves-health-guidance/en/ (accessed on 12 September 2015).
- Nicholls, N.; Skinner, C.; Loughnan, M.; Tapper, N. A simple heat alert system for Melbourne, Australia. Int. J. Biometeorol. 2008, 52, 375–384. [Google Scholar] [CrossRef] [PubMed]
- McMichael, A.; Weaver, H.; Berry, H.; Beggs, P.J.; Currie, B.; Higgins, J.; Kelly, B.; McDonald, J.; Tong, S. National Climate Change Adaptation Research Plan for Human Health. Available online: https://www.nccarf.edu.au/publications/national-climate-change-adaptation-research-plan-human-health (accessed on 12 September 2015).
- Loughnan, M.; Nicholls, N.; Tapper, N. The effects of summer temperature, age and socioeconomic circumstance on Acute Myocardial Infarction admissions in Melbourne, Australia. Int. J. Health Geogr. 2010, 9. [Google Scholar] [CrossRef] [PubMed]
- IPCC. Climate Change 2014: Impacts, Adaptation, and Vulnerability. Part B: Regional Aspects. In Contribution of Working Group II to the Fifth Assessment Report of the Intergovernmental Panel on Climate Change; Barros, V.R., Field, C.B., Dokken, D.J., Mastrandrea, M.D., Mach, K.J., Bilir, T.E., Chatterjee, M., Ebi, K.L., Estrada, Y.O., Genova, R.C., et al., Eds.; Cambridge University Press: Cambridge, UK; New York, NY, USA, 2014. [Google Scholar]
- Portier, C.J.; Thigpen Tart, K.; Carter, S.R.; Dilworth, C.H.; Grambsch, A.E.; Gohlke, J.; Hess, J.; Howard, S.N.; Luber, G.; Lutz, J.T.; et al. A Human Health Perspective On Climate Change: A Report Outlining the Research Needs on the Human Health Effects of Climate Change. Available online: www.niehs.nih.gov/climatereport (accessed on 12 September 2015).
- Weinhold, B. Health disparities: Climate change and health: A native American perspective. Environ. Health Perspect. 2010, 118. [Google Scholar] [CrossRef] [PubMed]
- Ford, J. Indigenous health and climate change. Am. J. Public Health 2012, 102, 1260–1266. [Google Scholar] [CrossRef] [PubMed]
- Green, D.; King, U.; Morrison, J. Disproportionate burdens: The multidimensional impacts of climate change on the health of Aboriginal Australians. Med. J. Aust. 2009, 190, 4–5. [Google Scholar] [PubMed]
- Guo, Y.; Wang, Z.; Li, S.; Tong, S.; Barnett, A. Temperature sensitivity in indigenous Australians. Epidemiology 2013, 24, 471–472. [Google Scholar] [CrossRef] [PubMed]
- Webb, L.; Bambrick, H.; Tait, P.; Green, D.; Alexander, L. Effect of ambient temperature on Australian Northern Territory public hospital admissions for cardiovascular disease among Indigenous and non-Indigenous populations. Int. J. Environ. Res. Public Health 2014, 11, 1942–1959. [Google Scholar] [CrossRef] [PubMed]
- AIH. Overview of Australian Indigenous Health Status 2013. Available online: http://www.healthinfonet.ecu.edu.au/health-facts/overviews (accessed on 13 November 2014).
- Ye, X.; Wolff, R.; Yu, W.; Vaneckova, P.; Pan, X.; Tong, S. Ambient temperature and morbidity: A review of epidemiological evidence. Environ. Health Perspect. 2012, 120, 19–28. [Google Scholar] [CrossRef] [PubMed] [Green Version]
- Australian Bureau of Statistics. Customised Report—Unpublished; Commonwealth of Australia: Canberra, Australia, 2012.
- Bhaskaran, K.; Gasparrini, A.; Hajat, S.; Smeeth, L.; Armstrong, B. Time series regression studies in environmental epidemiology. Int. J. Epidemiol. 2013, 42, 1187–1195. [Google Scholar] [CrossRef] [PubMed]
- Mäkinen, T.M.; Juvonen, R.; Jokelainen, J.; Harju, T.H.; Peitso, A.; Bloigu, A.; Silvennoinen-Kassinen, S.; Leinonen, M.; Hassi, J. Cold temperature and low humidity are associated with increased occurrence of respiratory tract infections. Respir. Med. 2009, 103, 456–462. [Google Scholar] [CrossRef] [PubMed]
- Lin, S.; Luo, M.; Walker, R.; Liu, X.; Hwang, S.; Chinery, R. Extreme high temperatures and hospital admissions for respiratory and cardiovascular diseases. Epidemiology 2009, 20, 738–746. [Google Scholar] [CrossRef] [PubMed]
- Green, R.; Basu, R.; Malig, B.; Broadwin, R.; Kim, J.; Ostro, B. The effect of temperature on hospital admissions in nine California counties. Int. J. Public Health 2010, 55, 113–121. [Google Scholar] [CrossRef] [PubMed]
- D'Ippoliti, D.; Michelozzi, P.; Marino, C.; de'Donato, F.; Menne, B.; Katsouyanni, K.; Kirchmayer, U.; Analitis, A.; Medina-Ramón, M.; Paldy, A.; et al. The impact of heat waves on mortality in 9 European cities: Results from the EuroHEAT project. Environ. Health 2010, 9. [Google Scholar] [CrossRef] [PubMed]
- Ballester, F.; Corella, D.; Perez-Hoyos, S.; Saez, M.; Hervas, A. Mortality as a function of temperature. A study in Valencia, Spain, 1991–1993. Int. J. Epidemiol. 1997, 26, 551–561. [Google Scholar] [CrossRef] [PubMed]
- Huynen, M.; Martens, P.; Schram, D.; Weijenberg, M.; Kunst, A. The impact of heat waves and cold spells on mortality rates in the Dutch population. Environ. Health Perspect. 2001, 109, 463–470. [Google Scholar] [CrossRef] [PubMed]
- Davis, R.; Knappenberger, P.; Michaels, P.; Novicoff, W. Seasonality of climate-human mortality relationships in U.S. cities and impacts of climate change. Clim. Res. 2004, 26, 61–76. [Google Scholar] [CrossRef]
- Goldie, J.; Sherwood, S.C.; Green, D.; Alexander, L. Temperature and humidity effects on hospital morbidity in Darwin, Australia. Ann. Glob. Health 2015. [Google Scholar] [CrossRef] [PubMed]
- Pozos, R.; Danzl, D. Human physiological response to cold stress and hypothermia. Med. Asp. Harsh Environ. 2011, 1, 351–382. [Google Scholar]
- Gardinassi, L.G.A.; Simas, P.V.M.; Salomão, J.B.; Durigon, E.L.; Trevisan, D.M.Z.; Cordeiro, J.A.; Lacerda, M.N.; Rahal, P.; Souza, F.P. Seasonality of viral respiratory infections in southeast of Brazil: The influence of temperature and air humidity. Braz. J. Microbiol. 2012, 43, 98–108. [Google Scholar] [CrossRef] [PubMed]
- Wang, Z.; Scott, J.; Wang, Z.; Hoy, W. Trends in health status and chronic disease risk factors over 10–14 years in a remote Australian community: A matched pair study. Aust. N. Z. J. Public Health 2014, 38, 73–77. [Google Scholar] [CrossRef] [PubMed]
- Bowman, D.; Dingle, J.; Johnston, F.; Parry, D.; Foley, M. Seasonal patterns in biomass smoke pollution and the mid 20th-century transition from Aboriginal to European fire management in northern Australia. Glob. Ecol. Biogeogr. 2007, 16, 246–256. [Google Scholar] [CrossRef]
- Hanigan, I.C.; Johnston, F.H.; Morgan, G.G. Vegetation fire smoke, indigenous status and cardio-respiratory hospital admissions in Darwin, Australia, 1996–2005: A time-series study. Environ. Health 2008, 7. [Google Scholar] [CrossRef] [PubMed]
- Crabbe, H. Risk of respiratory and cardiovascular hospitalisation with exposure to bushfire particulates: New evidence from Darwin, Australia. Environ. Geochem. Health 2012, 34, 697–709. [Google Scholar] [CrossRef] [PubMed]
- Tseng, C.M.; Chen, Y.T.; Ou, S.M.; Hsiao, Y.H.; Li, S.Y.; Wang, S.J.; Yang, A.C.; Chen, T.J.; Perng, D.W. The effect of cold temperature on increased exacerbation of chronic obstructive pulmonary disease: A nationwide study. PLoS ONE 2013, 8. [Google Scholar] [CrossRef] [PubMed]
- AIH. Hospitalisation. In Overview of Australian Indigenous Health Status 2014 . Available online: http://www.healthinfonet.ecu.edu.au/health-facts/overviews/hospitalisation (accessed on 7 August 2015).
- Australian Bureau of Statistics. 3238.0.55.001—Estimates of Aboriginal and Torres Strait Islander Australians, June 2011. Updated 30 August 2013. Available online: http://www.abs.gov.au/ausstats/[email protected]/mf/3238.0.55.001 (accessed on 12 October 2015).
- Friel, S.; Marmot, M.; McMichael, M.; Kjellstrom, T.; Vagero, D. Global health and equity and climate change: A common agenda. Lancet 2008, 372, 1677–1683. [Google Scholar] [CrossRef]
© 2015 by the authors; licensee MDPI, Basel, Switzerland. This article is an open access article distributed under the terms and conditions of the Creative Commons by Attribution (CC-BY) license (http://creativecommons.org/licenses/by/4.0/).
Share and Cite
Green, D.; Bambrick, H.; Tait, P.; Goldie, J.; Schultz, R.; Webb, L.; Alexander, L.; Pitman, A. Differential Effects of Temperature Extremes on Hospital Admission Rates for Respiratory Disease between Indigenous and Non-Indigenous Australians in the Northern Territory. Int. J. Environ. Res. Public Health 2015, 12, 15352-15365. https://doi.org/10.3390/ijerph121214988
Green D, Bambrick H, Tait P, Goldie J, Schultz R, Webb L, Alexander L, Pitman A. Differential Effects of Temperature Extremes on Hospital Admission Rates for Respiratory Disease between Indigenous and Non-Indigenous Australians in the Northern Territory. International Journal of Environmental Research and Public Health. 2015; 12(12):15352-15365. https://doi.org/10.3390/ijerph121214988
Chicago/Turabian StyleGreen, Donna, Hilary Bambrick, Peter Tait, James Goldie, Rosalie Schultz, Leanne Webb, Lisa Alexander, and Andrew Pitman. 2015. "Differential Effects of Temperature Extremes on Hospital Admission Rates for Respiratory Disease between Indigenous and Non-Indigenous Australians in the Northern Territory" International Journal of Environmental Research and Public Health 12, no. 12: 15352-15365. https://doi.org/10.3390/ijerph121214988