1. Introduction
Industrial and mining activities have always been leading sources of soil pollution [
1,
2]. In China, mining and industrial gathering areas have been established and rapidly developed across the country. According to several studies [
3,
4,
5] and the National Soil Pollution Survey Bulletin [
6], over ten million hectares of land in China have been threatened by soil pollution. Among these, two million hectares are threatened by mining and five million are threatened by petroleum pollution. Moreover, because of irrational planning and rough development in the initial construction stage, types, range and potential risks of the pollutants in soil of industrial and mining gathering areas are intricate and should not be underestimated.
In the interests of preventing and controlling soil pollution caused by industrial and mining activities, several studies have conducted ecological and health risk assessments, evaluation criteria grading, and spatial distributions of pollutants in different regions of China. Since the 1990s, China has developed quality standards for general soil environments [
7] and for soils allocated to specific land usages [
8,
9,
10,
11]. Li
et al. [
12] summarized the published data (2005–2012) on soils polluted with heavy metals originating from mining areas in China, and then comprehensively assessed the heavy metal pollution derived from these mines based on soil pollution levels and human health risks. In previous studies, the mines and surrounding areas were identified as sources and heavy metals were considered the most serious pollutants. The spatial distribution [
2,
13,
14,
15], risk assessment [
2,
13,
16,
17,
18], and mobility [
19,
20] of pollutants in soils also provided important information.
However, the risk assessment of soil pollutants has focused almost exclusively on heavy metal pollution. Organic pollution, especially the organic pollutants generated by the petrochemical industries, is largely ignored, despite its strong presence in the industrial and mining gathering areas and its potential for serious harm. Moreover, although most researchers have analyzed the risk sources, the survey, classification, grading, and management methods of polluting factories (the main sources of pollution in industrial and mining gathering areas) are relatively simple and not associated with the risk analysis. Finally, the difficulty of investigation and data collection has precluded a spatial analysis that combines a soil pollution study with an evaluation of the inherent risk level of polluting factories. Therefore, to understand the overall status of the soil environment in industrial and mining gathering areas, a comprehensive method that considers the soil risk caused by complex pollutants and pollution sources is necessary.
The present study proposes a comprehensive method for evaluating soil risk status. It includes the human health risk, the inherent risk level of the polluting factories and evaluated risk regionalization and characteristics of pollution sources. The method was piloted in Binhai New Area, Tianjin, China, a typical area of high mining and industrial activity.
2. Methodology
This study assesses human health risk and the inherent risk levels of polluting factories. From these results, a comprehensive method for assessing hazardous soil environments in industrial and mining gathering areas is developed.
2.1. Human Health Risk Assessment
By assessing human health risk, we can characterize the potential health hazards imposed by environmental pollution and elucidate the impacts and damage to human health [
21,
22]. The latter (including the carcinogenic and non-carcinogenic health risks of soil contamination) are revealed by the land use patterns and exposure pathways.
Appendix A describes the assessment of human health risk on both organic pollutants and heavy metal contaminants. This assessment provides a scientific basis and technical support for comprehensive risk management.
2.2. Inherent Risk Assessment of Polluting Factories
Polluting factories, refer to factories engaged in industrial production or other industries, which may directly or indirectly cause large-scale environmental or ecological pollution. As mentioned in the Introduction, mining and industrial activities are major sources of soil contamination in industrial and mining gathering area. The operating conditions, pollutant emission levels, environmental management, and risk prevention levels of polluting factories are all important affecters of soil environmental risks. Therefore, to guide the soil environmental management in industrial and mining gathering areas, the risk assessment of polluting factories should be included in the soil environmental risk assessment.
2.2.1. Evaluation Index System
The polluting factories in industrial and mining gathering areas significantly differ in type, pollutant emission characteristics, and risk supervision level. Therefore, the environmental risks also differ among factories. The evaluation system is divided into three levels. The first layer, referred to as the target layer, measures the overall level of soil environmental risk posed by polluting factories. The second layer, the criteria layer, includes the inherent degree of sudden environmental risks, degree of cumulative environmental risk, and degree of environmental risk supervision by factories. The third level includes the assessment indicators.
Appendix B described the construction of indicator system and the weight distribution of indicators, the results are listed in
Table 1.
2.2.2. Scoring of Indicators and Comprehensive Assessment
Because the dimensions of each index in the index system are variable, these indices cannot be directly calculated and must instead be standardized. In this study, the indicators were scored and standardized by referencing the national standards and evaluation guidelines of related industries. The standardized indicators and calculation method of parameters are presented in
Appendix C.
2.3. Spatial Analysis
To guide the functional zoning of contaminated soil environment and identify the primary areas of soil contamination management, we require spatial analysis, risk regionalization, and a comprehensive risk partitioning method. In the current study, the human health risks were quantified by sampling, surveying, and analyzing the soil pollutants, soil environment, and the integrated status of the industrial and mining gathering areas. The assessment methods are described in
Section 2.1. The results were then spatially interpolated using the inverse distance weighted (IDW) method, implemented in the ArcGis 9.3 software environment (Spatial Analyst module, ESRI, Beijing, China).
Table 1.
Risk assessment indicators of polluting factories.
Table 1.
Risk assessment indicators of polluting factories.
| Target Layer | Criteria Layer | Indicators |
|---|
| Indicators of polluting factories risk assessment | Inherent level of sudden environmental risk (0.30) | Inventory level of hazardous substances (0.35) |
| Service life of equipment (0.1) |
| Environmental emergency response plan (0.15) |
| Emergency rescue personnel (0.2) |
| Environmental emergency drills frequency (0.05) |
| Number of environmental emergencies in last three years (0.15) |
| Level of cumulative environmental risk (0.30) | Industrial policy requirements (0.06) |
| Construction Period (0.02) |
| Industrial output value (0.08) |
| Annual production time (0.04) |
| Annual emissions of soot (0.15) |
| Annual emissions of sulfur dioxide (0.15) |
| Annual emissions of nitrogen oxide (0.15) |
| Supervision level of environmental risk (0.40) | Industrial water recycling rate (0.05) |
| Utilization rate of industrial solid waste (0.05) |
| Online sewage monitoring system (0.15) |
| Routine environmental monitoring capacity (0.15) |
| Rain and sewage system (0.05) |
| Ground seepage treatment (0.1) |
| Treatment rate of soot (0.15) |
| Treatment rate of sulfur dioxide (0.15) |
| Treatment rate of nitrogen oxide (0.15) |
Compared with the IDW interpolation, other commonly employed methods such as Kriging and Spline interpolation also have strong ability to predict the overall trend of soil pollution. However, in purpose of identifying of the polluted areas, it is necessary to require the interpolation method to predict the local feature of soil pollution. In industrial and mining gathering areas, the concentration of pollutants in soil showed a high spatial variability, but the local maxima of soil pollution (concentration or risk value) is likely to be smoothed out by Kriging or Spline interpolation. Therefore, to reserve the local maxima and minima of soil pollution in industrial and mining gathering areas, IDW interpolation is an appropriate choice. Moreover, relevant study [
23] indicated that, according to the root mean square error (RMSE) for cross validation, although Kriging and Spline interpolation are more accurate than other methods, the interpolation results of soils in polluted area estimated by Kriging are significantly smaller than the results by actual statistical results. Therefore, as a measure of overall sample prediction accuracy, RMSE cannot describe the estimated error of local extreme values.
From the interpolation results, the spatial distribution maps of human health risk were derived. Again, using the spatial interpolation, the assessment results of the polluting factories were embedded in an integrated risk regionalization map. In this way, the soil environment risks and inherent risks of the polluting factories were combined into a comprehensively partitioned classification of the soil environmental risks in the study area.
2.4. Comprehensive Analysis
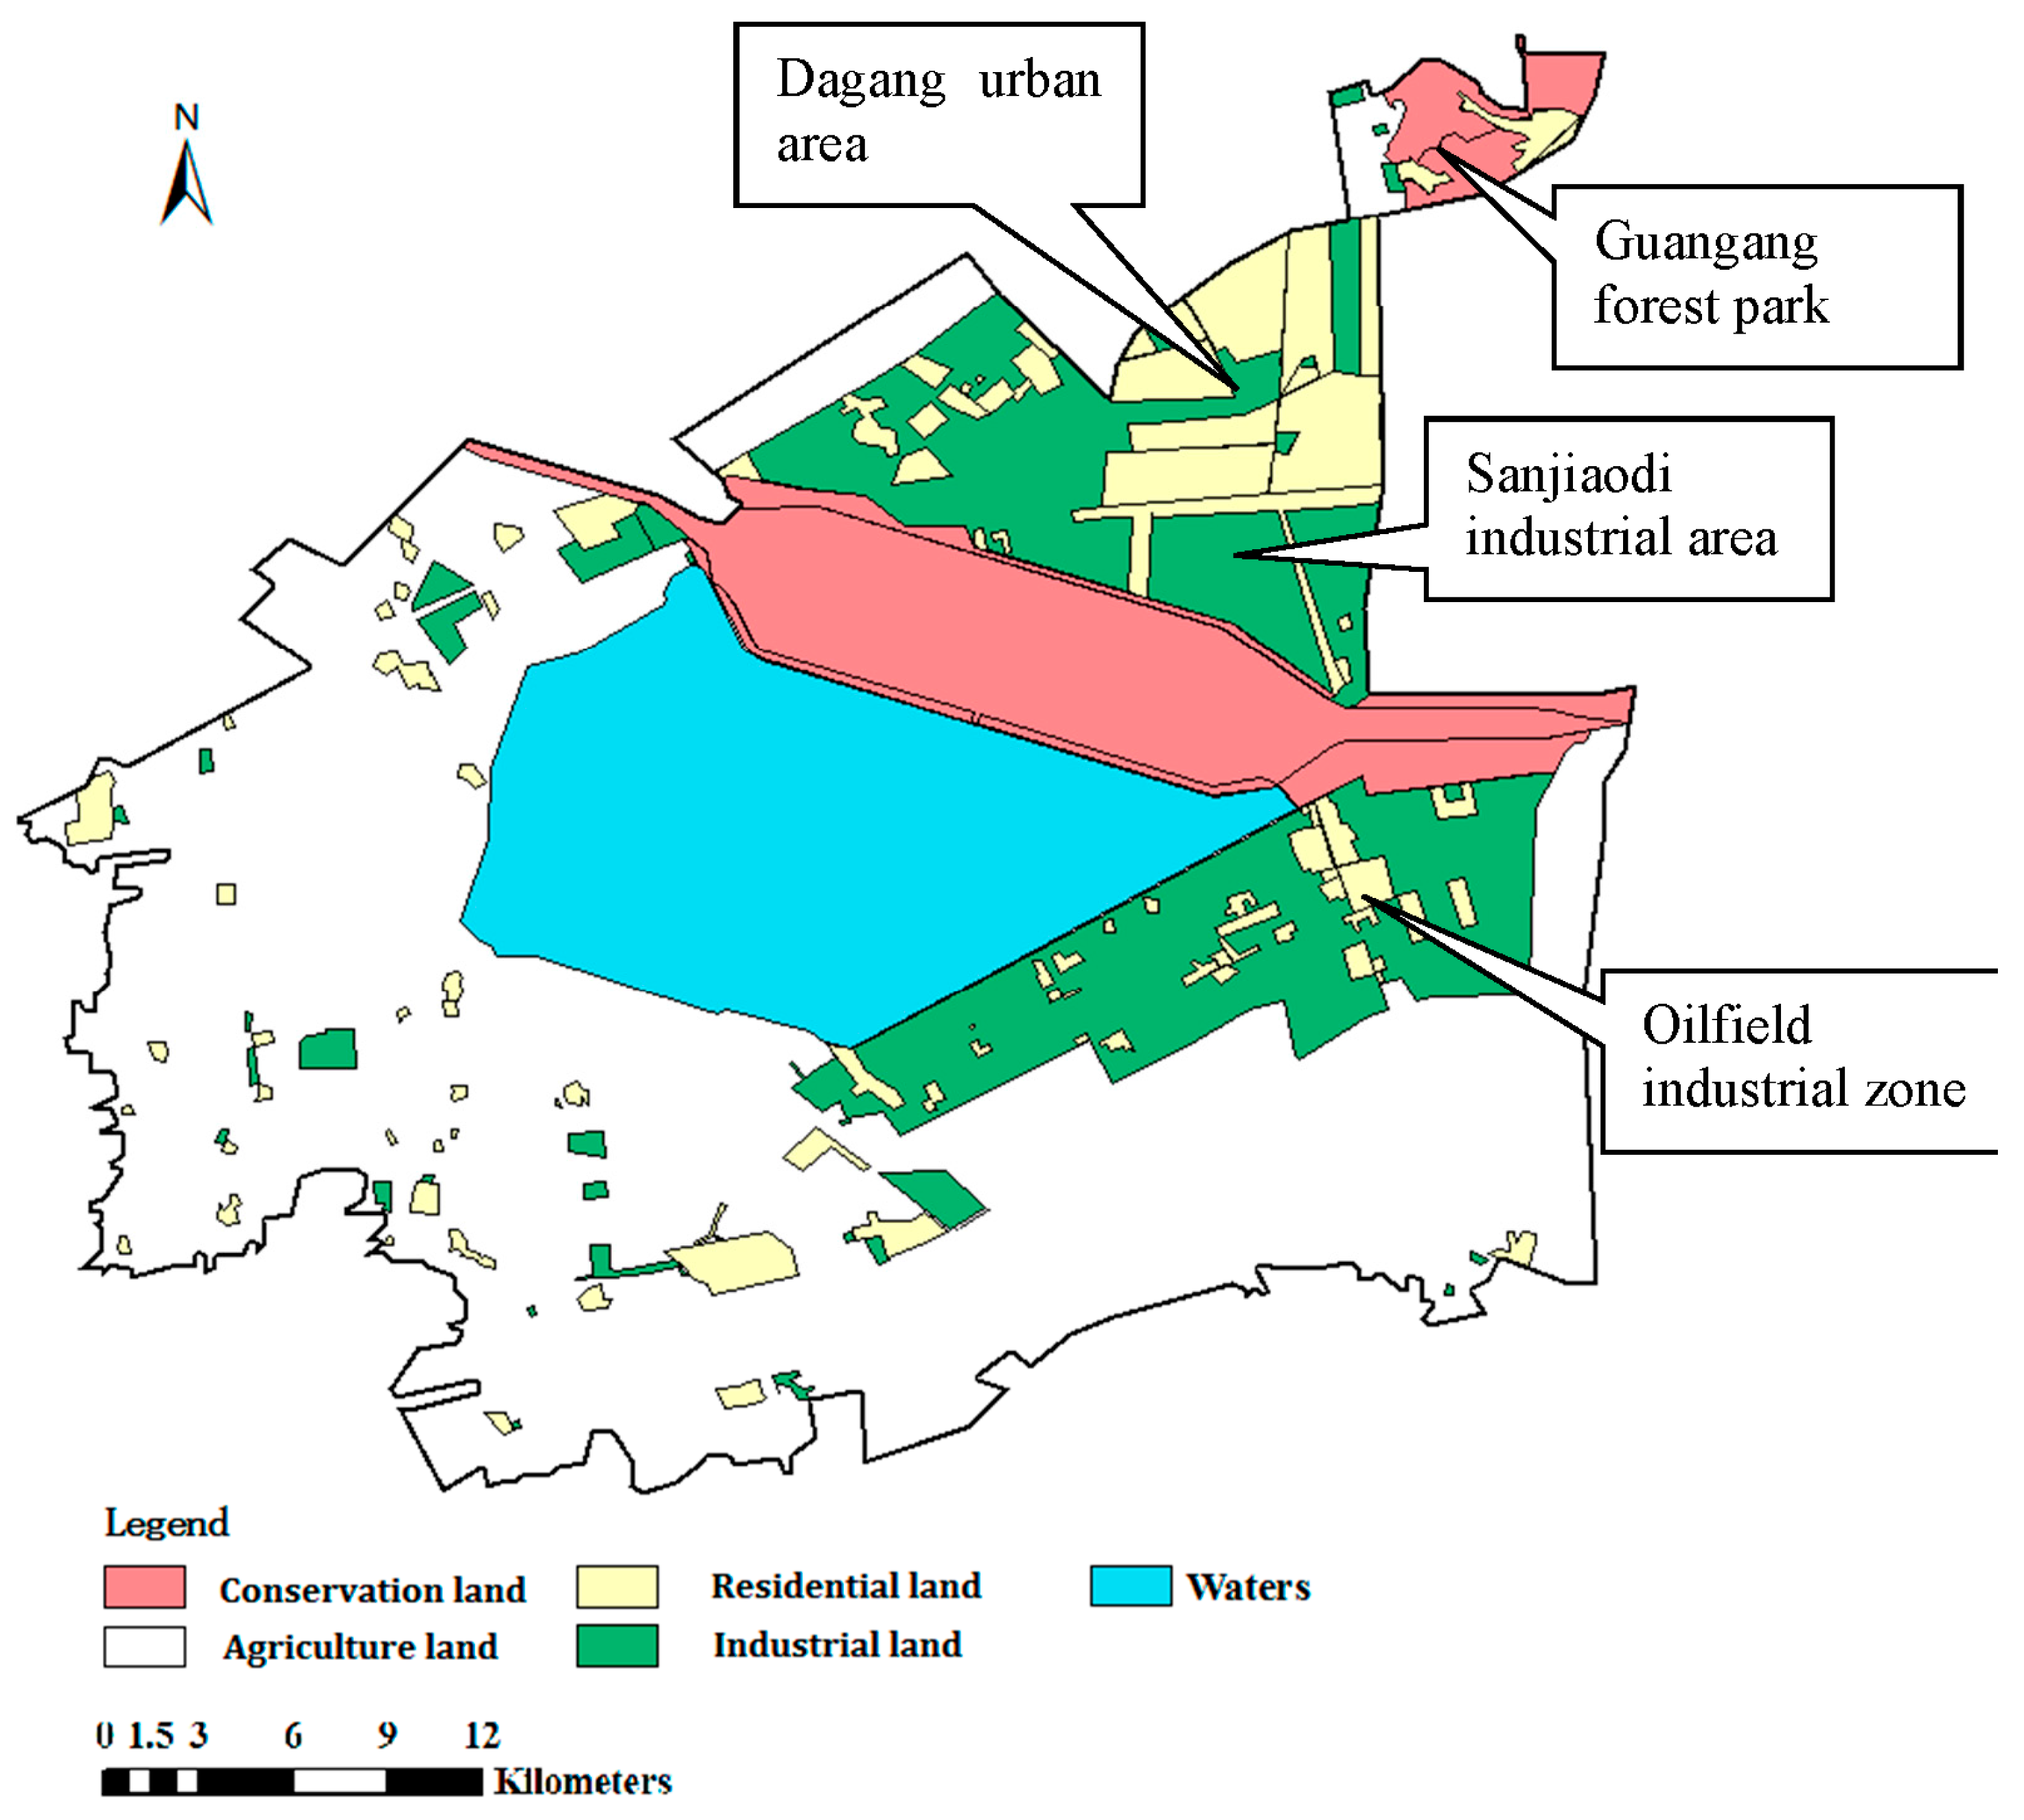
The classification of land use in industrial and mining gathering areas was performed based on landscape, distribution and characteristics of population, functional requirements of lands, and protection requirements of ecological sensitive targets. Different types of land are divided into four classes: industrial land, including industrial land and mining sites, storage land, supply facilities area and so on; agriculture land, including farmland, orchards, aquaculture bases and so on; residential land, including residential areas, living areas, culture and entertainment land, education and health land, business area and so on; conservation land, including nature conservation objectives, coastal waters, wetlands and so on.
The regionalization results of human health risk (
TCR value) and the land use class of the study area were incorporated into a matrix assessment method. This method uses the comprehensive risk classifications in
Table 2 to evaluate the risk status of the industrial and mining gathering areas. From the classification results, risk management and control measures can be designated.
Table 2.
Classification method of soil integrated risk.
Table 2.
Classification method of soil integrated risk.
| Human Health Risk (TCR) | Land Use |
|---|
| Industrial Land | Agriculture Land | Residential Land | Conservation Land |
|---|
| Low risk | Low risk | Low risk | Moderate risk | High risk |
| Moderate risk | Low risk | Moderate risk | Moderate risk | High risk |
| High risk | Moderate risk | Moderate risk | High risk | Extreme risk |
| Extreme risk | High risk | High risk | Extreme risk | Extreme risk |
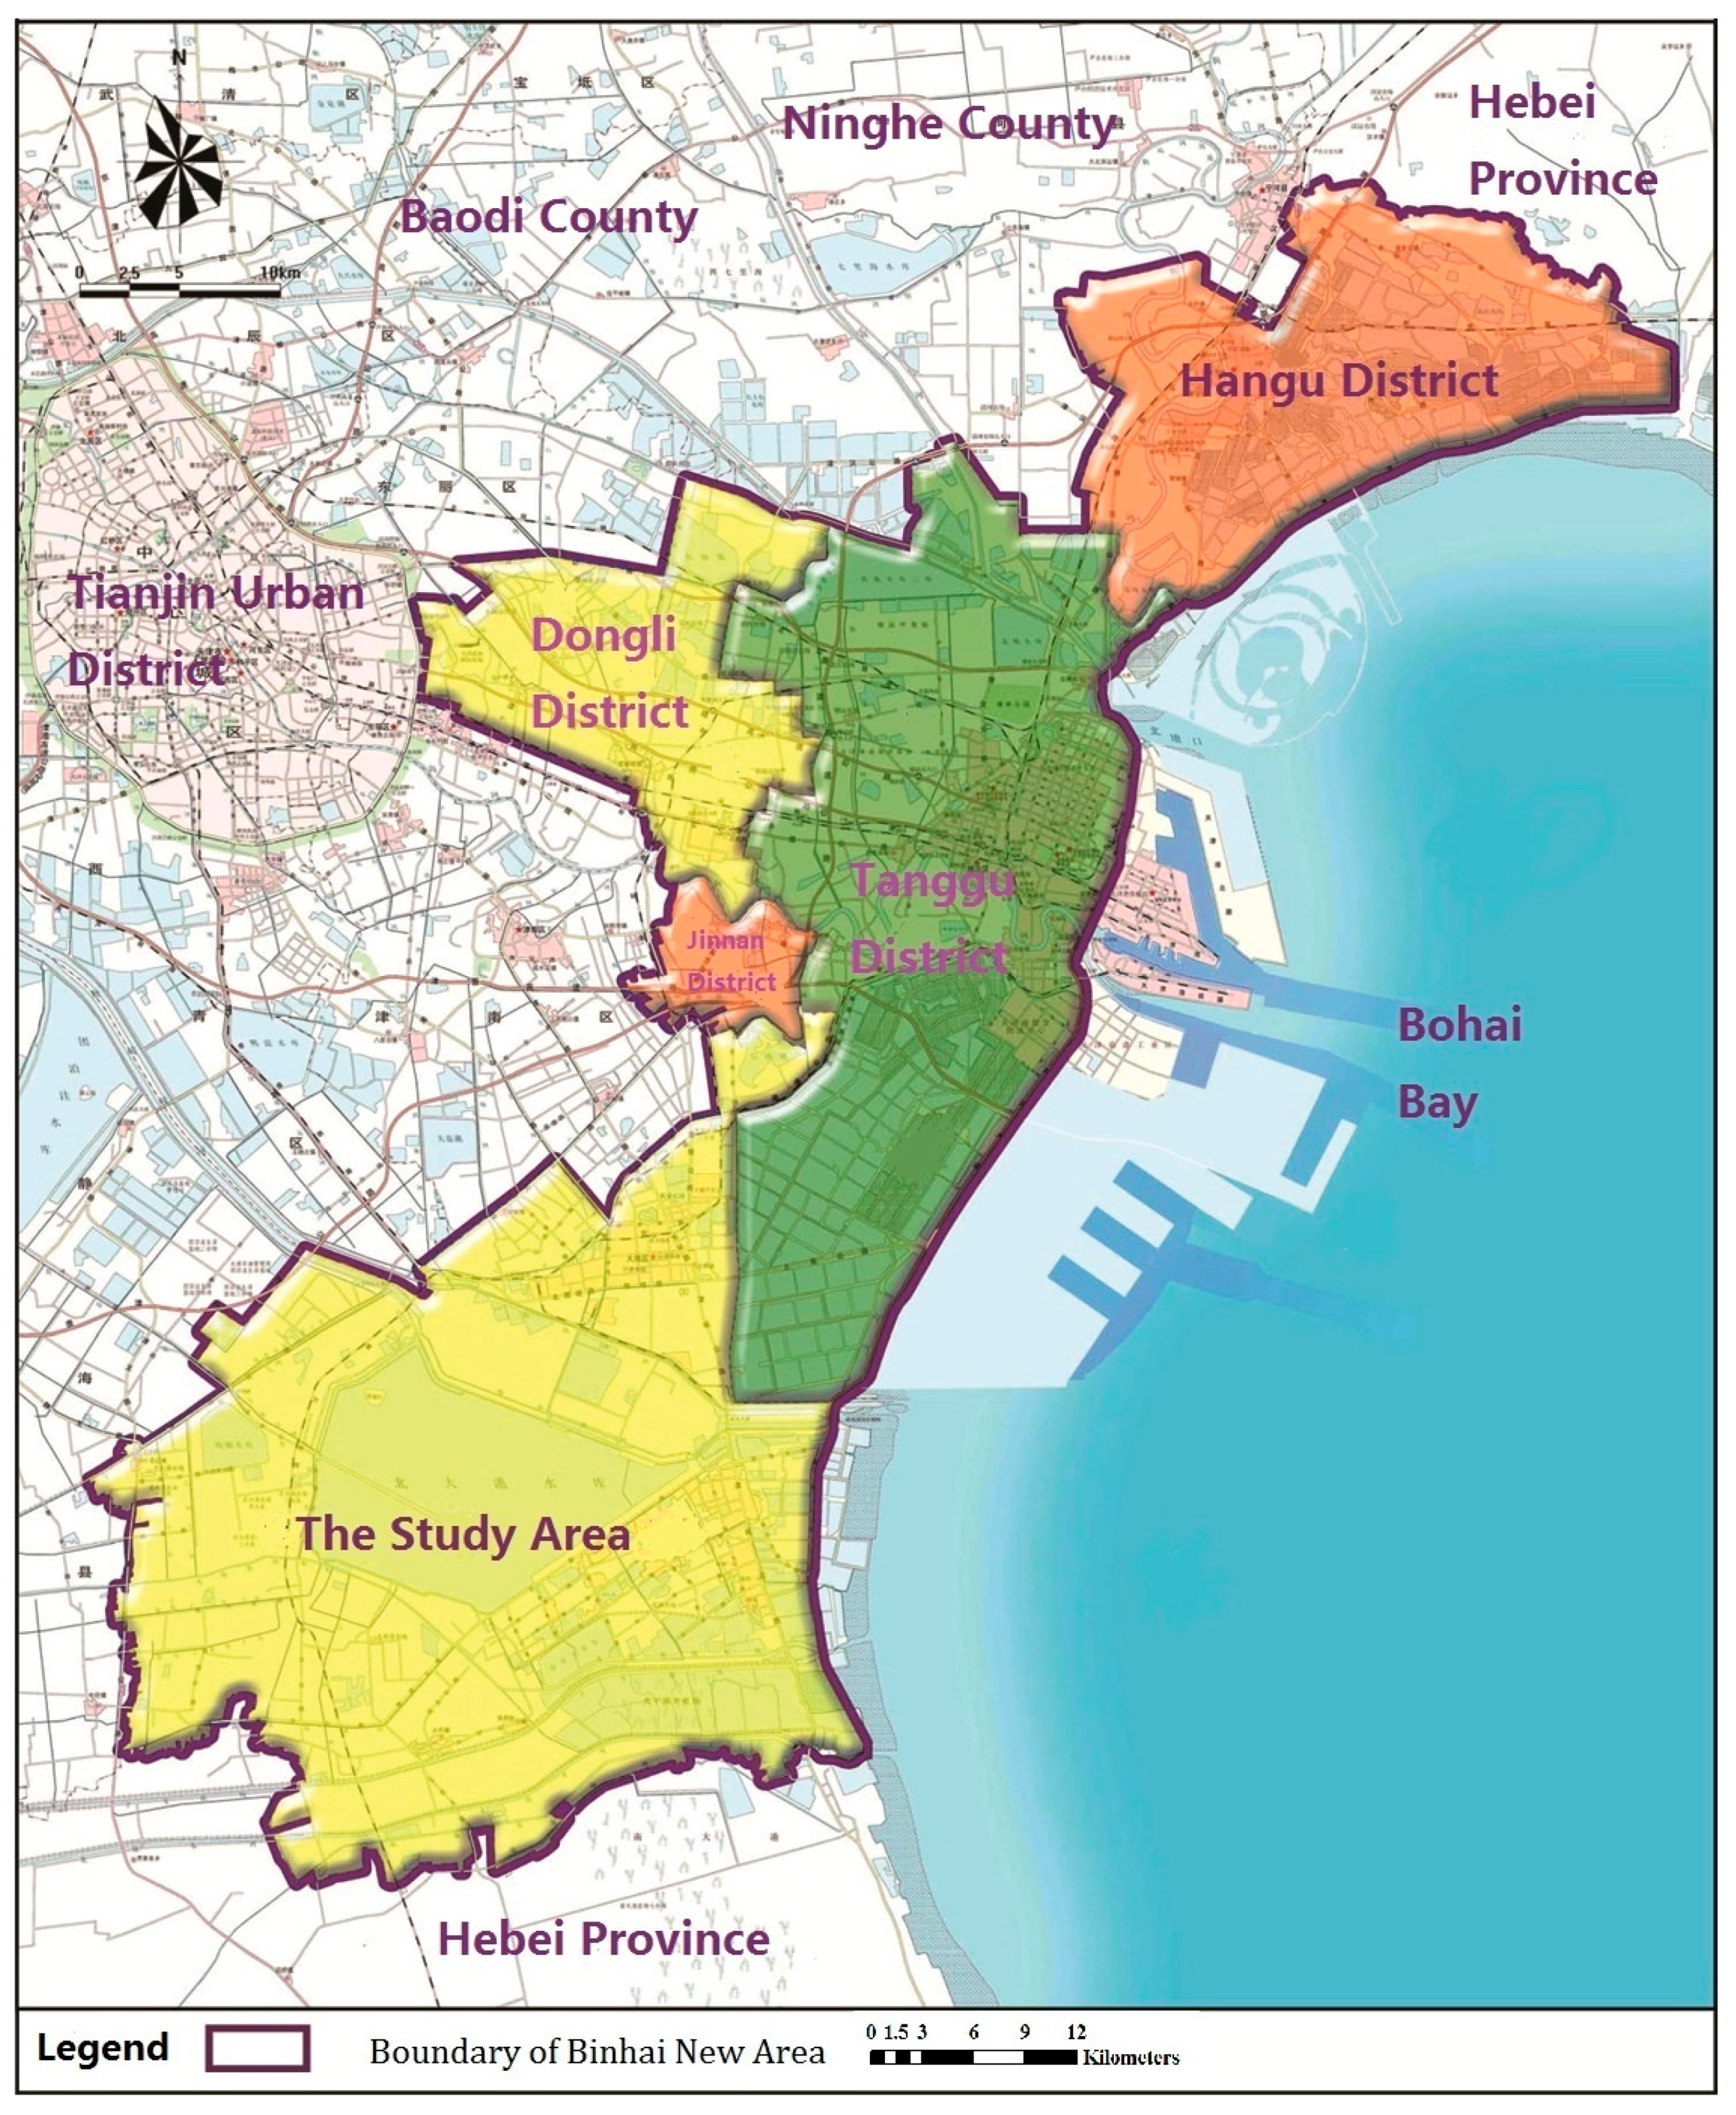
2.5. Site Description
The selected study area is a typical mining and industrial gathering area in the Binhai New Area, Tianjin, China, located southeast of Tianjin, China. The study area, shown in
Figure 1, mainly covers the southern region of this area. Established in 1994, the Binhai New Area has become an important industrial and economic center in Tianjin, one of China’s largest industrial cities. The area is also the third zone especially designated for industrial economy development in China [
24]. Unfortunately, industrial economic expansion and progress of the mining industry has been accompanied by increased soil contamination (mainly heavy metals). The study area covers approximately 1200 km
2 and experiences a warm temperate, semihumid continental monsoon climate. Its average annual temperature and precipitation levels are 14 °C and 600 mm, respectively [
25]. As noted in reports on National Major Function-oriented Zoning, China has invested heavily in developing this international port city as an eco-city and in enhancing the northern economic center of Tianjin. Owing to its rich reserves of oil and metal resources near Bohai Bay, the Binhai New Area is of significant strategic interest. The main industries are located in the northeastern and eastern parts of the region and include petrochemical, metallurgical, and mining industries. In particular, this area is becoming an important petrochemical industry base in northern China, as outlined in the Overall Plan for the New Town in Tianjin (2006–2020).
The ecological environment of this area is extremely sensitive and fragile because it borders the river, sea, and land. The pollution problem is exacerbated by the uneven distributions of the residential and industrial regions. Heavy metals introduced to the soil by human activity have contaminated large portions of this area and its vicinities [
26,
27,
28]. Specifically, rivers, farmlands, and coastal waters have been polluted to varying extents by heavy metals discharging into water bodies over long periods.
Figure 1.
Location and scope of the study area.
Figure 1.
Location and scope of the study area.
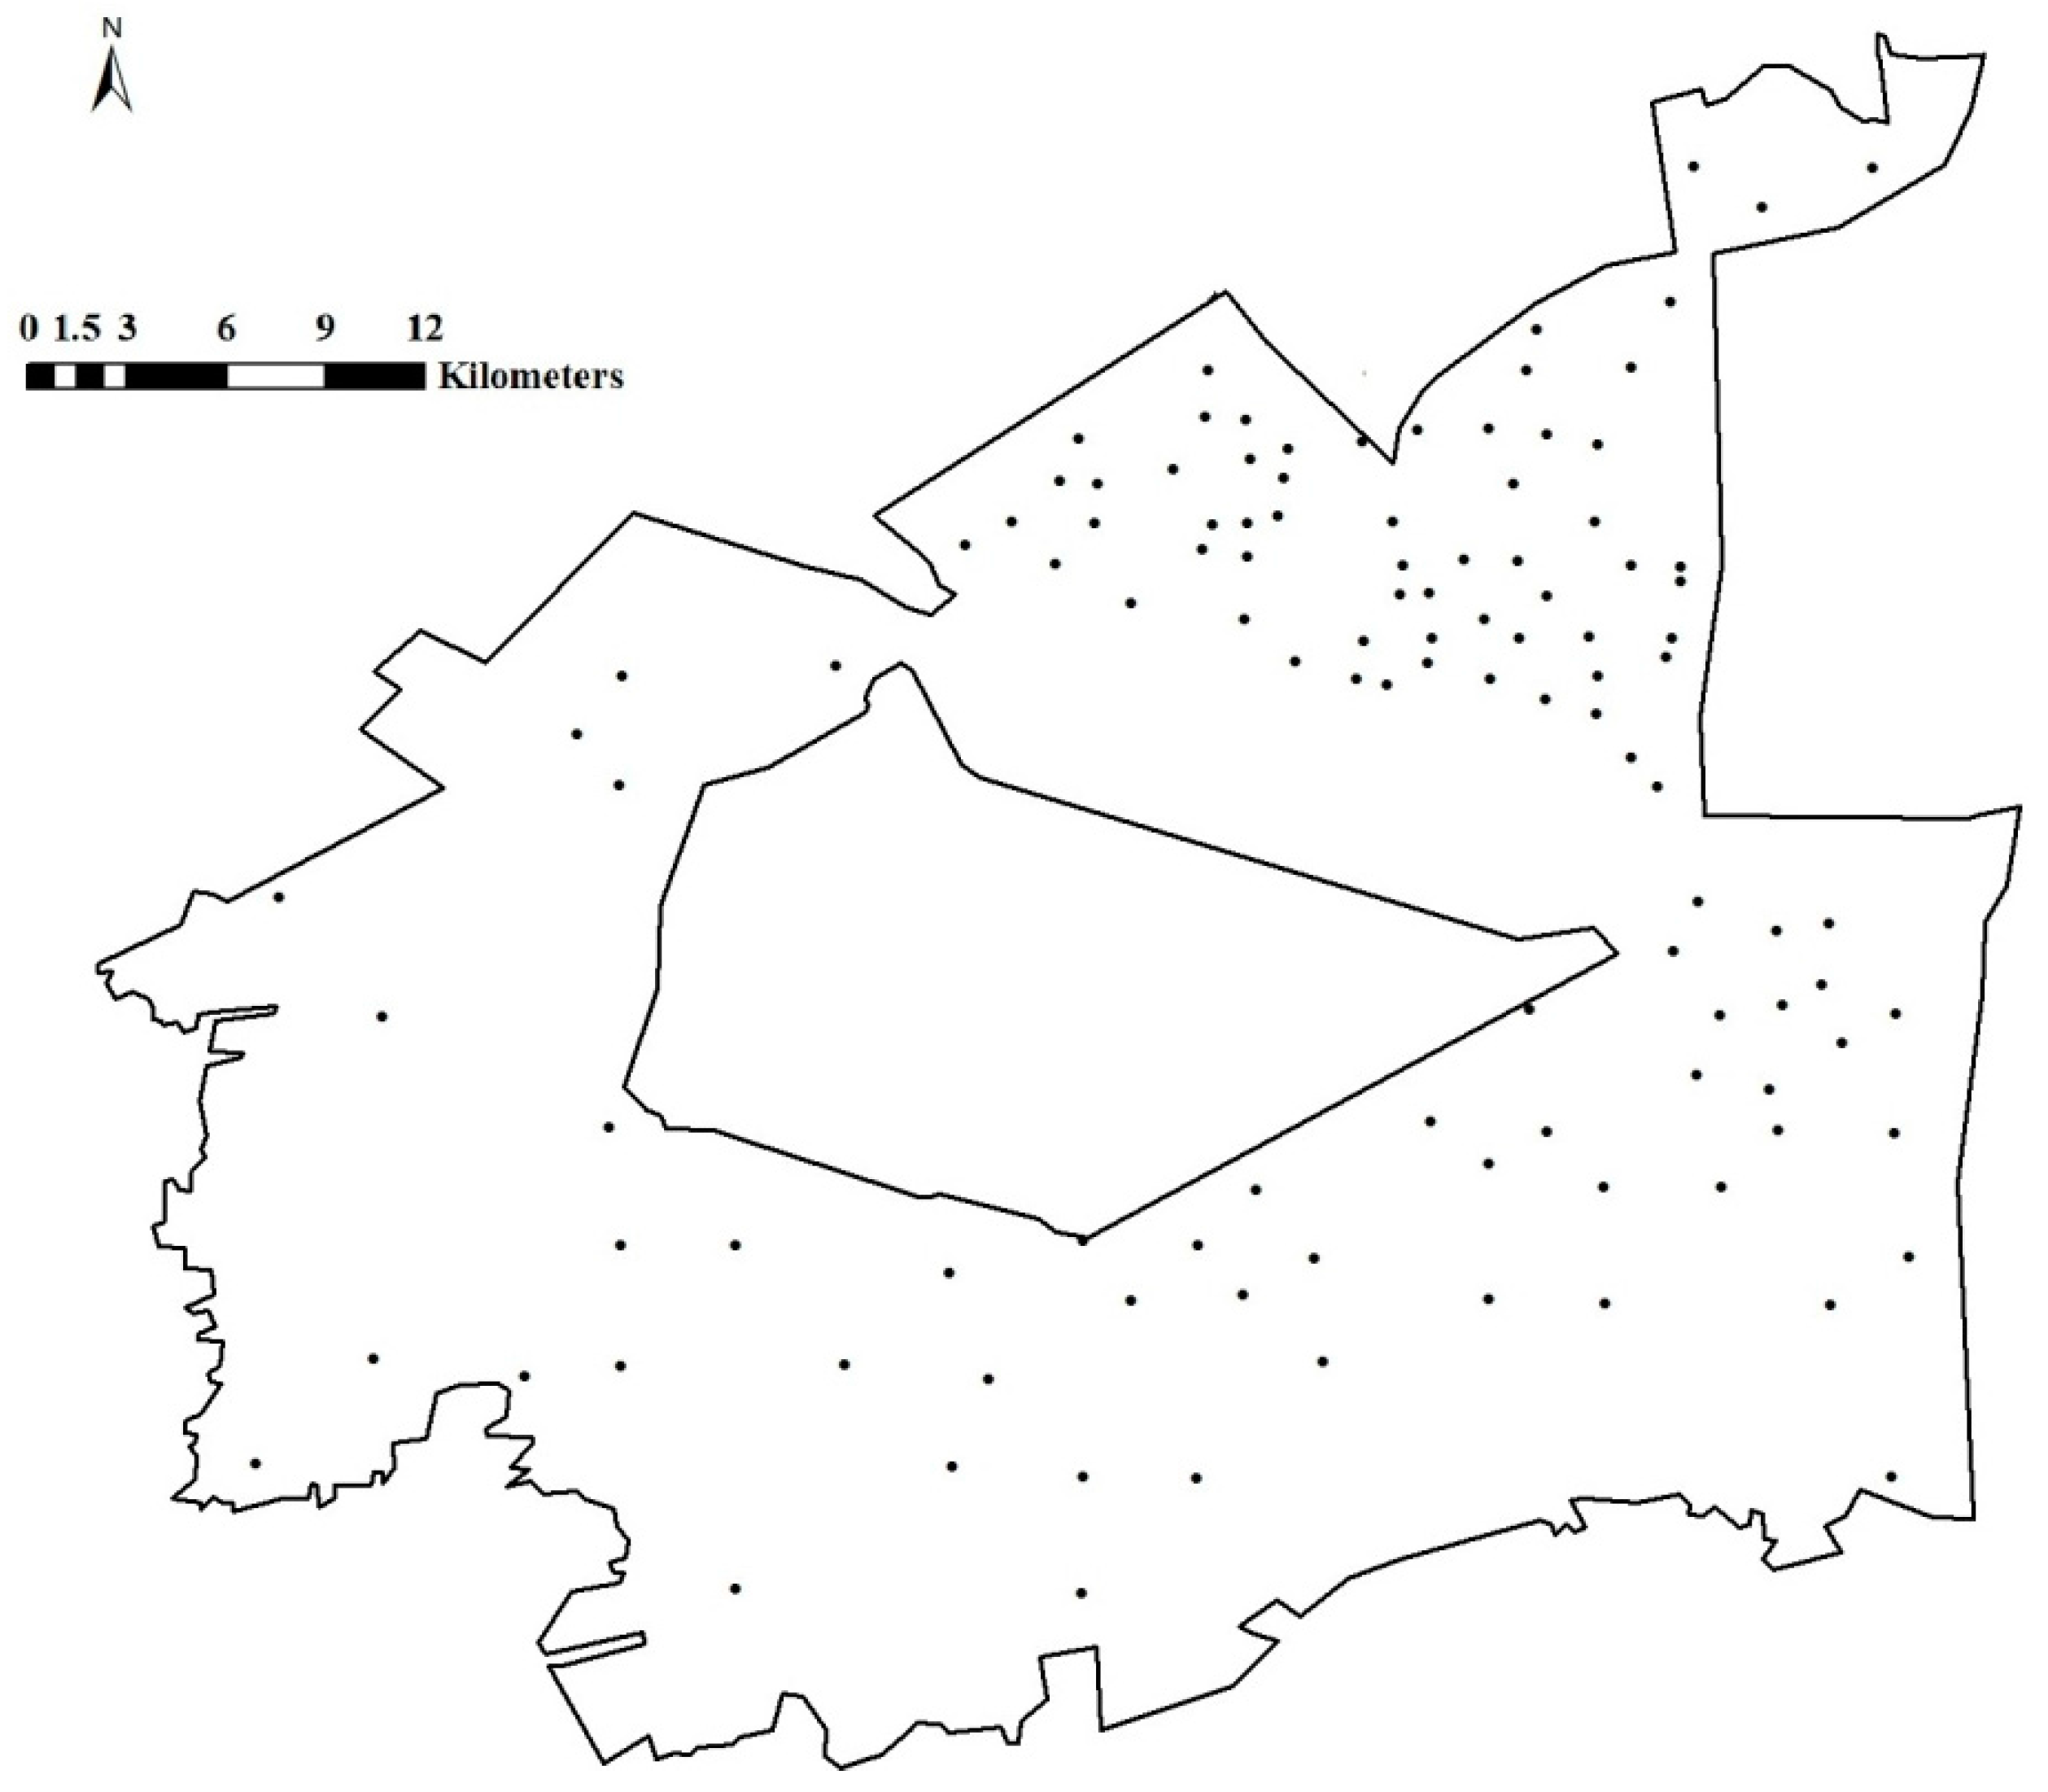
2.6. Sampling and Analysis
Soil samples were collected from the study area in 2013. Forty-six census points were selected by systematic random grid sampling, the grid spacing of census points was 3 km. These points were separated by soil type, topographic characteristics, and the distribution of their contamination sources by a grid laying method. Moreover, to fully reflect the impact of highly aggregated mining industries on the quality of the soil environment, 68 encrypted points were selected in densely mined areas and areas with industrial activity (
Figure 2), the grid spacing of encrypted points was 1 km. The large empty area in the sampling point map is occupied by a water reservoir.
Figure 2.
Soil sampling bitmaps. Note: the blank area is the North Dagang Reservoir.
Figure 2.
Soil sampling bitmaps. Note: the blank area is the North Dagang Reservoir.
The selected monitoring targets were eight common heavy metals, namely, As, Cd, Cr, Cu, Ni, Pb, Zn, and Hg; two common pollutants of mining industries, Co and V; and eight organic pollutants including Pyrene, Carbon tetrachloride, Dichloroethane, 1,2-, Trichlorothane, 1,1,1-, Benzene, Ethylbenzene, Fluoranthene, and Xylenes. The soil samples were pretreated by air-drying at room temperature. Plant roots, organic residues, and visible intrusions were removed from the samples. Finally, the samples were crushed, ground, and passed through a 0.85-mm sieve. The samples were suspended in deionized water (1:2.5 v/v), agitated for 1 h using a Sartorius PB-10 (Sartorius, Beijing, China), and subjected to pH measurements. The concentrations of the monitoring targets (except As and Hg) were determined by inductively coupled plasma-atomic emission spectrometry. The As and Hg concentrations were measured by atomic fluorescence spectrometry (AFS-2202, Haiguang Company, Beijing, China). Volatile and semivolatile organic compounds, polycyclic aromatic hydrocarbon substances, and other organic pollutants were monitored by gas chromatography mass spectrometry.
3. Results
3.1. Overview of Soil Pollutants
Table 3 showed the basic situation of various pollutants in soil. The detection rate of nine kinds of heavy metals reached 100%, and the detection rate of Hg and eight kinds of organic pollutants was less than 10%, indicating that heavy metal pollution was more serious in soil environment of the study area. Moreover, coefficients of variation of nine kinds of heavy metals except Hg were relative low, indicating that the nine kinds of heavy metals were widely distributed in the study area and the content difference of the nine heavy metals at different sampling points were relatively small.
Table 3.
Overview of soil pollutants.
Table 3.
Overview of soil pollutants.
| Item | Average (mg/kg) | Minimum (mg/kg) | Maximum (mg/kg) | Coefficient of Variation | Detection Rate |
|---|
| pH | 8.0878 | 7.74 | 9.64 | 0.045598 | / |
| As | 27.5926 | 10 | 369 | 1.234824 | 100.00% |
| Cd | 0.501 | 0.15 | 3.42 | 1.017565 | 100.00% |
| Cr6+ | 0.1917 | 0.05 | 0.62 | 0.439645 | 100.00% |
| Co | 19.34 | 12.1 | 55.4 | 0.21456 | 100.00% |
| Cu | 28.745 | 15.1 | 44.5 | 0.210611 | 100.00% |
| Pb | 21.432 | 13.7 | 71.6 | 0.364035 | 100.00% |
| Ni | 38.766 | 22.4 | 543 | 1.163055 | 100.00% |
| V | 87.1395 | 55.7 | 123 | 0.149473 | 100.00% |
| Zn | 95.233 | 53.3 | 322 | 0.317936 | 100.00% |
| Hg | 0.0064 | 0 | 0.15 | 3.75 | 7.69% |
| Pyrene | 0.0018 | 0 | 0.23 | 11.25 | 0.77% |
| Carbon tetrachloride | 0.0004 | 0 | 0.05 | 11.00 | 0.77% |
| Dichloroethane, 1,2- | 0.0012 | 0 | 0.1 | 8.18 | 1.54% |
| Trichlorothane, 1,1,1- | 0.0084 | 0 | 0.35 | 0.24 | 5.38% |
| Benzene | 0.0013 | 0 | 0.1 | 8.24 | 1.54% |
| Ethylbenzene | 0.0167 | 0 | 0.77 | 4.74 | 9.23% |
| Fluoranthene | 0.0025 | 0 | 0.32 | 11.27 | 0.77% |
| Xylenes | 0.0888 | 0.03 | 1.39 | 1.77 | 9.17% |
3.2. Human Health Risk
3.2.1. Overview
The
TCR and
THI values of heavy metal contaminants and organic pollutants were separately calculated, as described in
Section 2.1. The
THI values of organic pollutants were below 1 at all sampling points, and the total
TCR values were lower than 10
−6. Therefore, the health hazards posed by organic pollutants in the study area were generally acceptable. The
THI values of heavy metals were also below 1 at all sampling points, indicating that heavy metals pose acceptable non-carcinogenic risk. However, in the carcinogenic risk category, the
TCR values of Cd, As, and Cr
6+ at many of the sampling points exceeded 10
−6. The results confirmed that heavy metals are the most important risk factors in the study area, especially considering their bioaccumulative character and non-biodegradability. Therefore, heavy metal pollution should continue to be targeted in industrial and mining gathering areas.
3.2.2. Human Health Risk of Heavy Metals
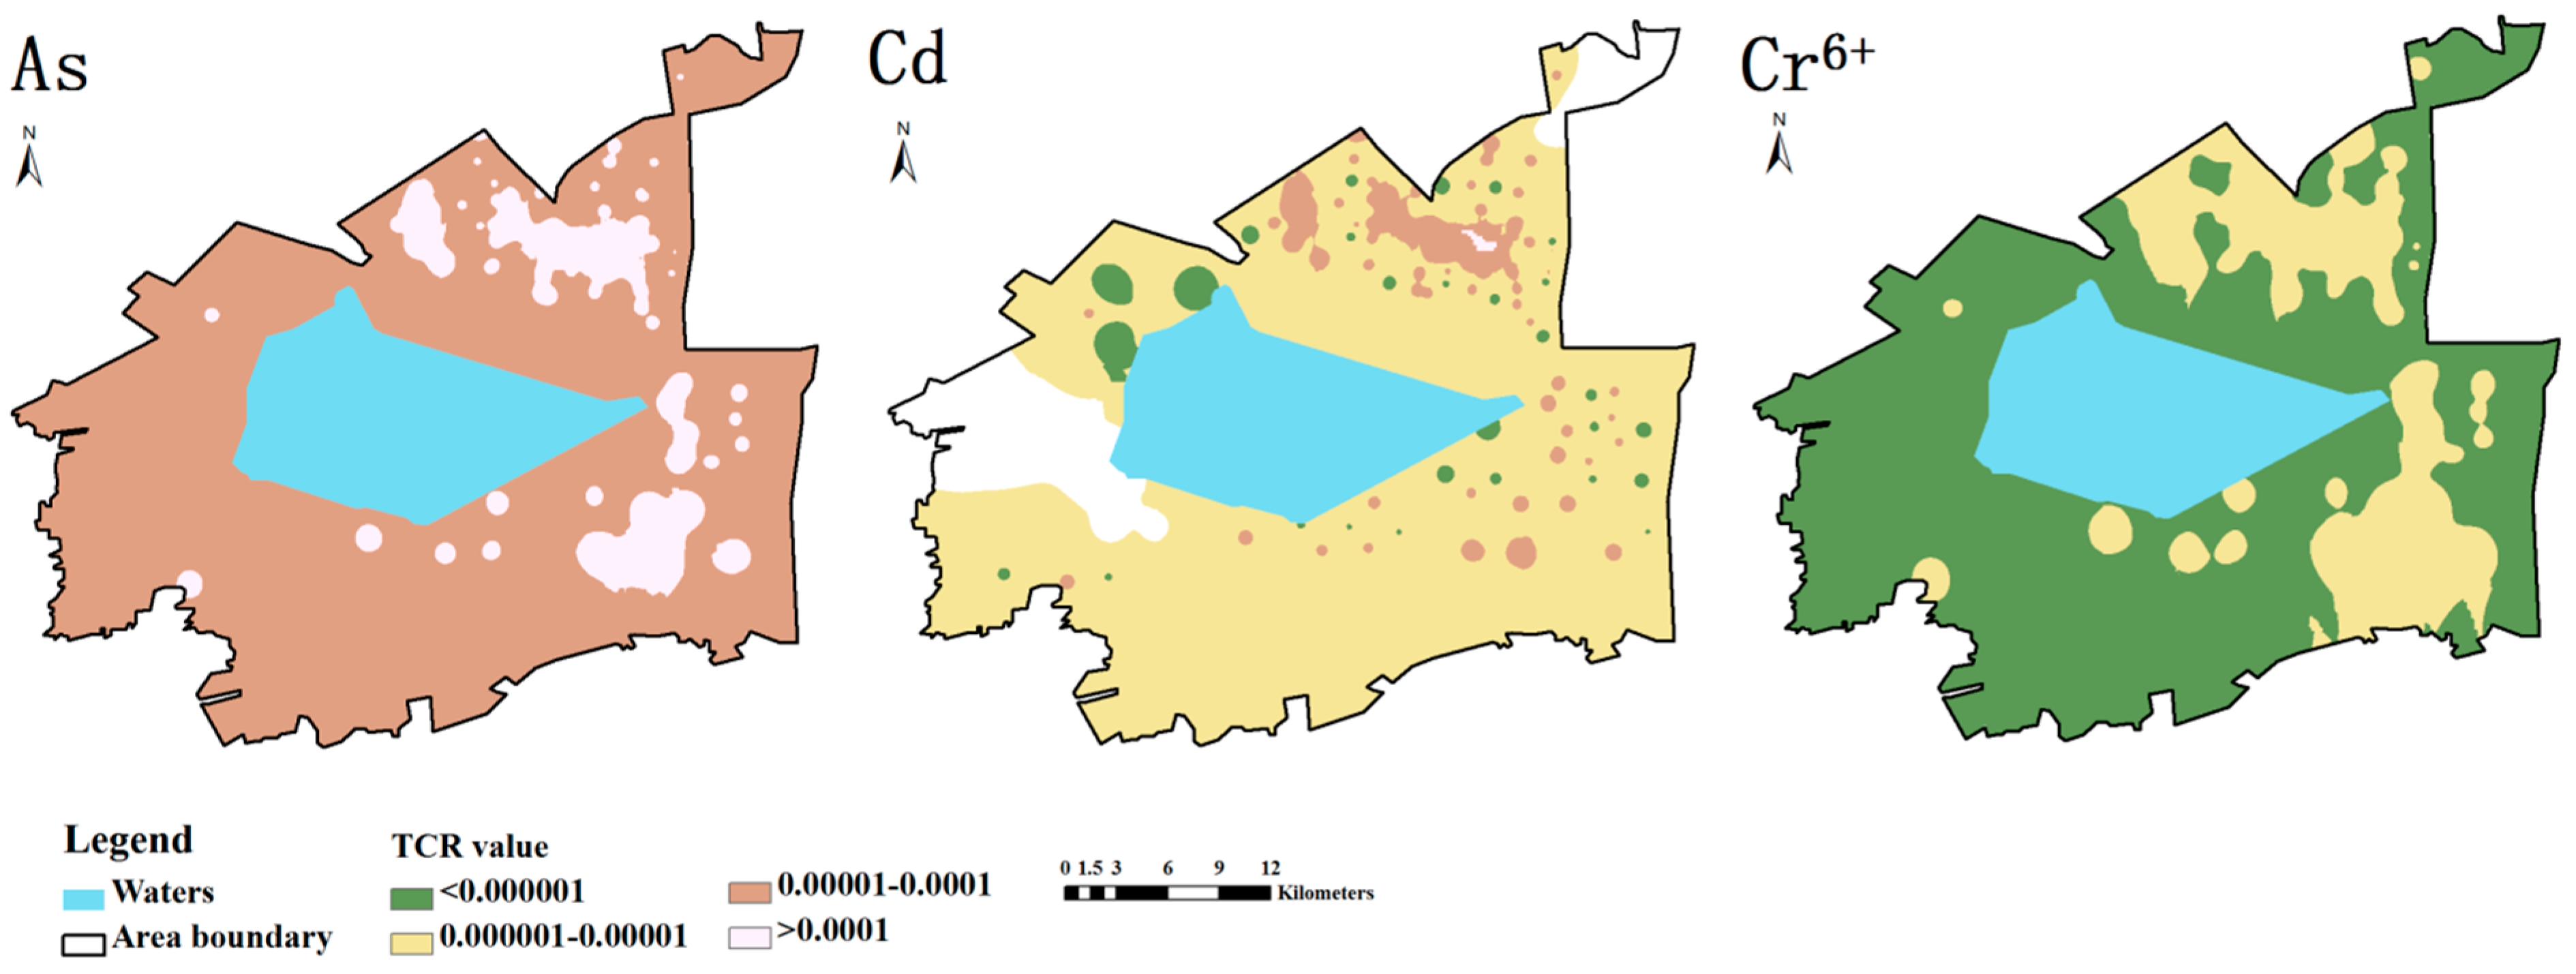
The TCR ranges of Cd, Cr6+ and As were 1.6 × 10⁻⁶ to 3.8 × 10⁻⁴, 2.2 × 10⁻⁸ to 8.3 × 10⁻⁶, and 6.0 × 10⁻⁶ to 7.6 × 10⁻³, respectively, indicating that the carcinogenic risks of these three heavy metals exceeded the acceptable level by varying degrees. At 114 of the sampling points, the TCR of Cr6+ was lower than 1 × 10⁻⁵, indicating that Cr6+ poses a low carcinogenic risk. The TCRs of As and Cd exceeded 1 × 10⁻⁴ at 47 and 37 of the sampling points, respectively. Therefore, these heavy metals pose high or extreme carcinogenic risk at more than 30% of the sampling points.
Figure 3 showed the spatial distribution of carcinogenic risks of Cd, As and Cr
6+. It is clear that the carcinogenic risk of Cr
6+ is low to moderate across most of the study area, the carcinogenic risk of As is high to extreme, and the carcinogenic risk of Cd is moderate to high. The overall level of carcinogenic risk of As is high, indicating that As is the main contributor of carcinogenic risk in the study area. Extreme risk areas of As are mainly concentrated in the north and east of the reservoir. Similarly, high risk areas of Cd and moderate risk areas of Cr
6+ are mainly concentrated in the north and east of the reservoir, indicating that carcinogenic risk in such areas is more serious. Extreme risk areas of Cd are mainly concentrated in the northeast and southwest of the study area.
Figure 3.
Spatial distribution map of the human health risks of three heavy metals posed by contaminated soil.
Figure 3.
Spatial distribution map of the human health risks of three heavy metals posed by contaminated soil.
The spatial distribution of the integrated human health risk (carcinogenic), obtained by IDW interpolation of the calculated
TCR values, is shown in
Figure 4. The human health risk regionalization results revealed the following: (1) The carcinogenic risk is moderate to high risk across most of the study area; low-risk sites are minimal. (2) Extreme risk areas are mainly concentrated in the northeast of the study area and south of the reservoir. (3) Looking at the land use patterns (
Figure 5), high-risk areas are found to be concentrated in the Sanjiaodi industrial area located northeast of the reservoir and in the oilfield industrial zone, with its surroundings (including residential areas). (4) Extreme risk areas are concentrated in the Dagang urban area in the northeast of the study area, the Guangang forest park in the northeast corner, and residential areas affiliated with the oilfield industrial zone. The industrial land uses of these three regions share several common characteristics; complex population composition, frequent living activities, proximity to conservation projects (reservoirs and forest parks), and high vulnerability of receptors. Risk management and pollution prevention in such areas, especially in residential lands, is essential.
Figure 4.
Spatial distribution map of the human health risks posed by contaminated soil.
Figure 4.
Spatial distribution map of the human health risks posed by contaminated soil.
Figure 5.
Land use of study area.
Figure 5.
Land use of study area.
3.3. Inherent Risk of Polluting Factories
According to the Census of Pollution Sources conducted by local environmental protection departments and statistical agencies in 2010, 150 polluting factories exist in the study area. The offending industries include electrical power, metallurgy, non-ferrous metals, petrochemicals, manufacturing (brick, paper, and textiles), and a small number of food production industries. The inherent risk of these polluting factories was calculated by the abovementioned risk evaluation method.
The calculated risks of the 150 polluting factories are summarized in
Table 4. As shown in this table, none of the factories incurred no or low risk, indicating that the polluting factories pose a serious threat in the study area. Half (75) of the factories, especially those involved in smelting, forging, production and processing of non-ferrous and ferrous metals, and some petrochemical factories, posed moderate risk. These industries are the leading industries in typical industrial and mining gathering areas. However, some of the large-scale metal production and processing factories achieved low scores in environmental management system and risk prevention measures. This indicates that after 30 years of development and construction, some leading industries had gradually developed and improved their risk monitoring and prevention systems. On the other hand, a large proportion of the 150 factories were assessed as high-risk. Among the 69 factories in this category, the vast majority was brick production and thermoelectric industries; the remainder included chemical industrial factories and metal production and processing factories. Therefore, large state-owned factories remain important sources of pollution in the study area. However, note that a significant number of small-scale factories involved in property management, food production, and light industry were also high-risk. These results highlight the importance of reasonable risk control measures and risk prevention awareness. Among the six extreme risk factories, four were large state-owned petrochemical factories; the remaining two were the largest brick factory in the study area and a glass factory. The pollutant emission levels of these six factories were also high.
Table 4.
Overview of polluting factory risk in the study area.
Table 4.
Overview of polluting factory risk in the study area.
| Polluting Factory Risk Level | Number of Factories | Main Industries |
|---|
| Low risk (0 ≤ CRI ≤ 1) | 0 | / |
| Moderate risk (1 < CRI ≤ 2) | 75 | Metal forging, processing and production; chemical industry |
| High risk (2 < CRI ≤ 2.5) | 69 | Brick production; thermoelectric |
| Extreme risk (2.5 < CRI ≤ 3) | 6 | Chemical industry |
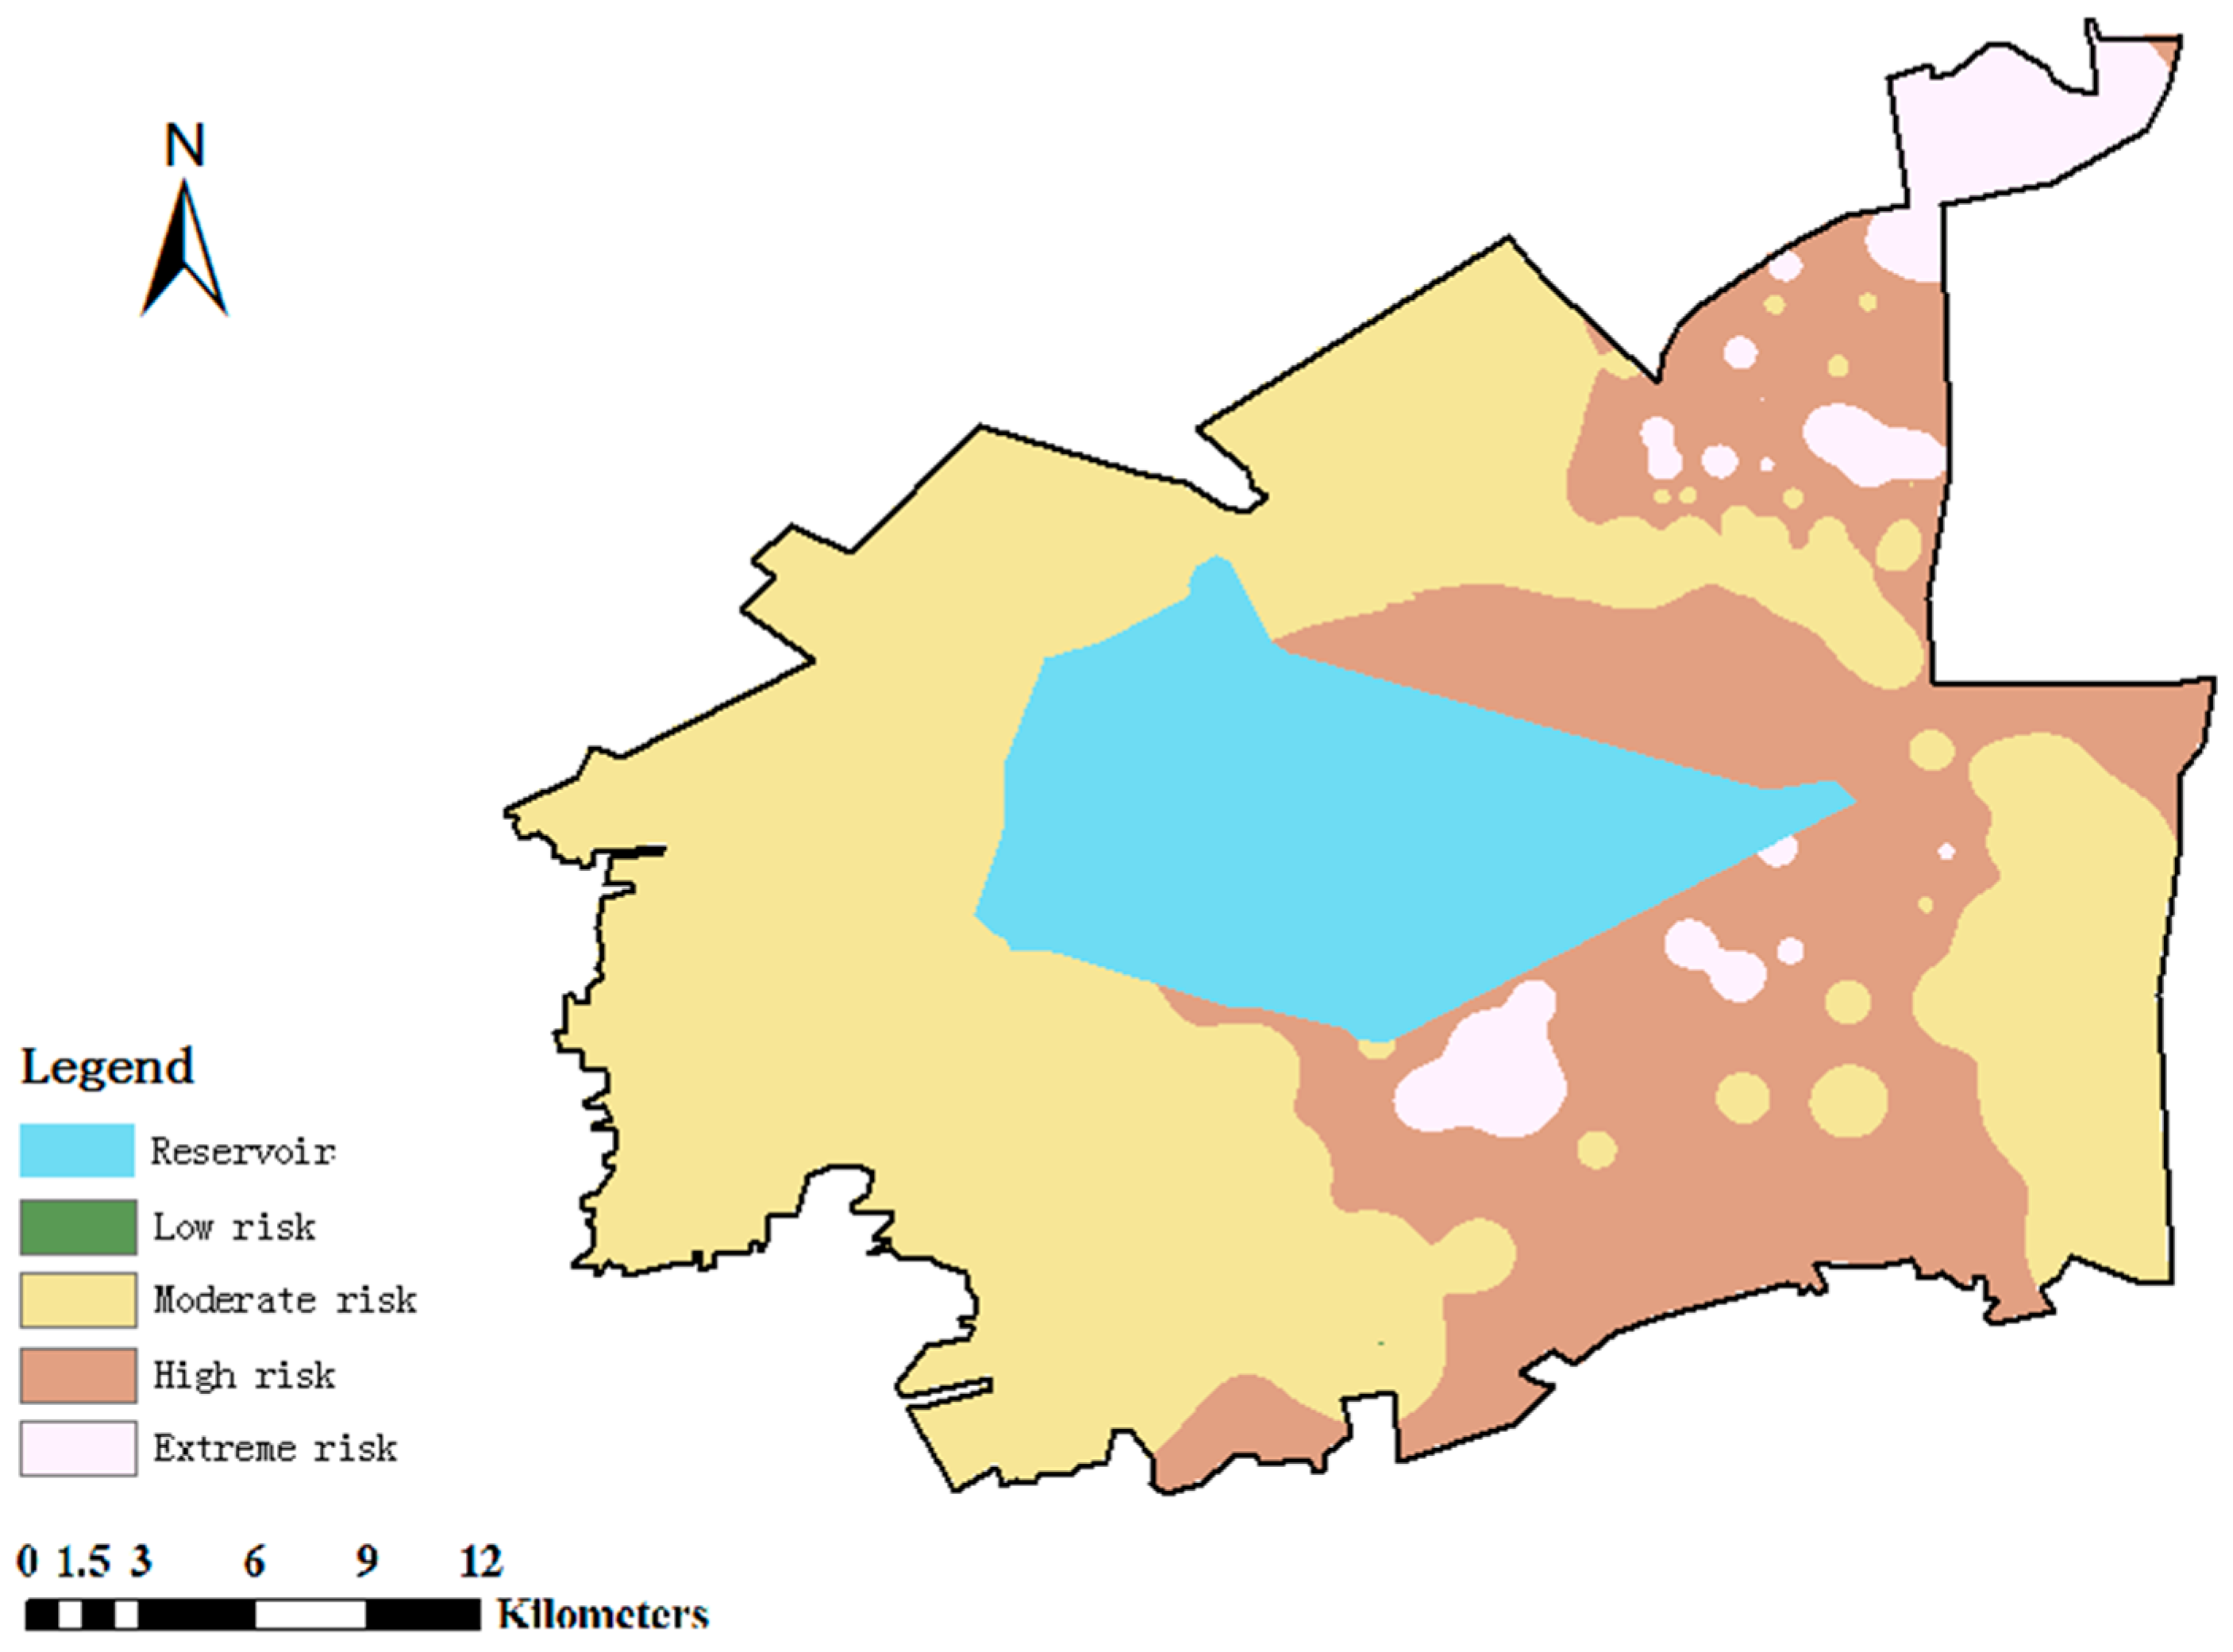
3.4. Integrated Risk
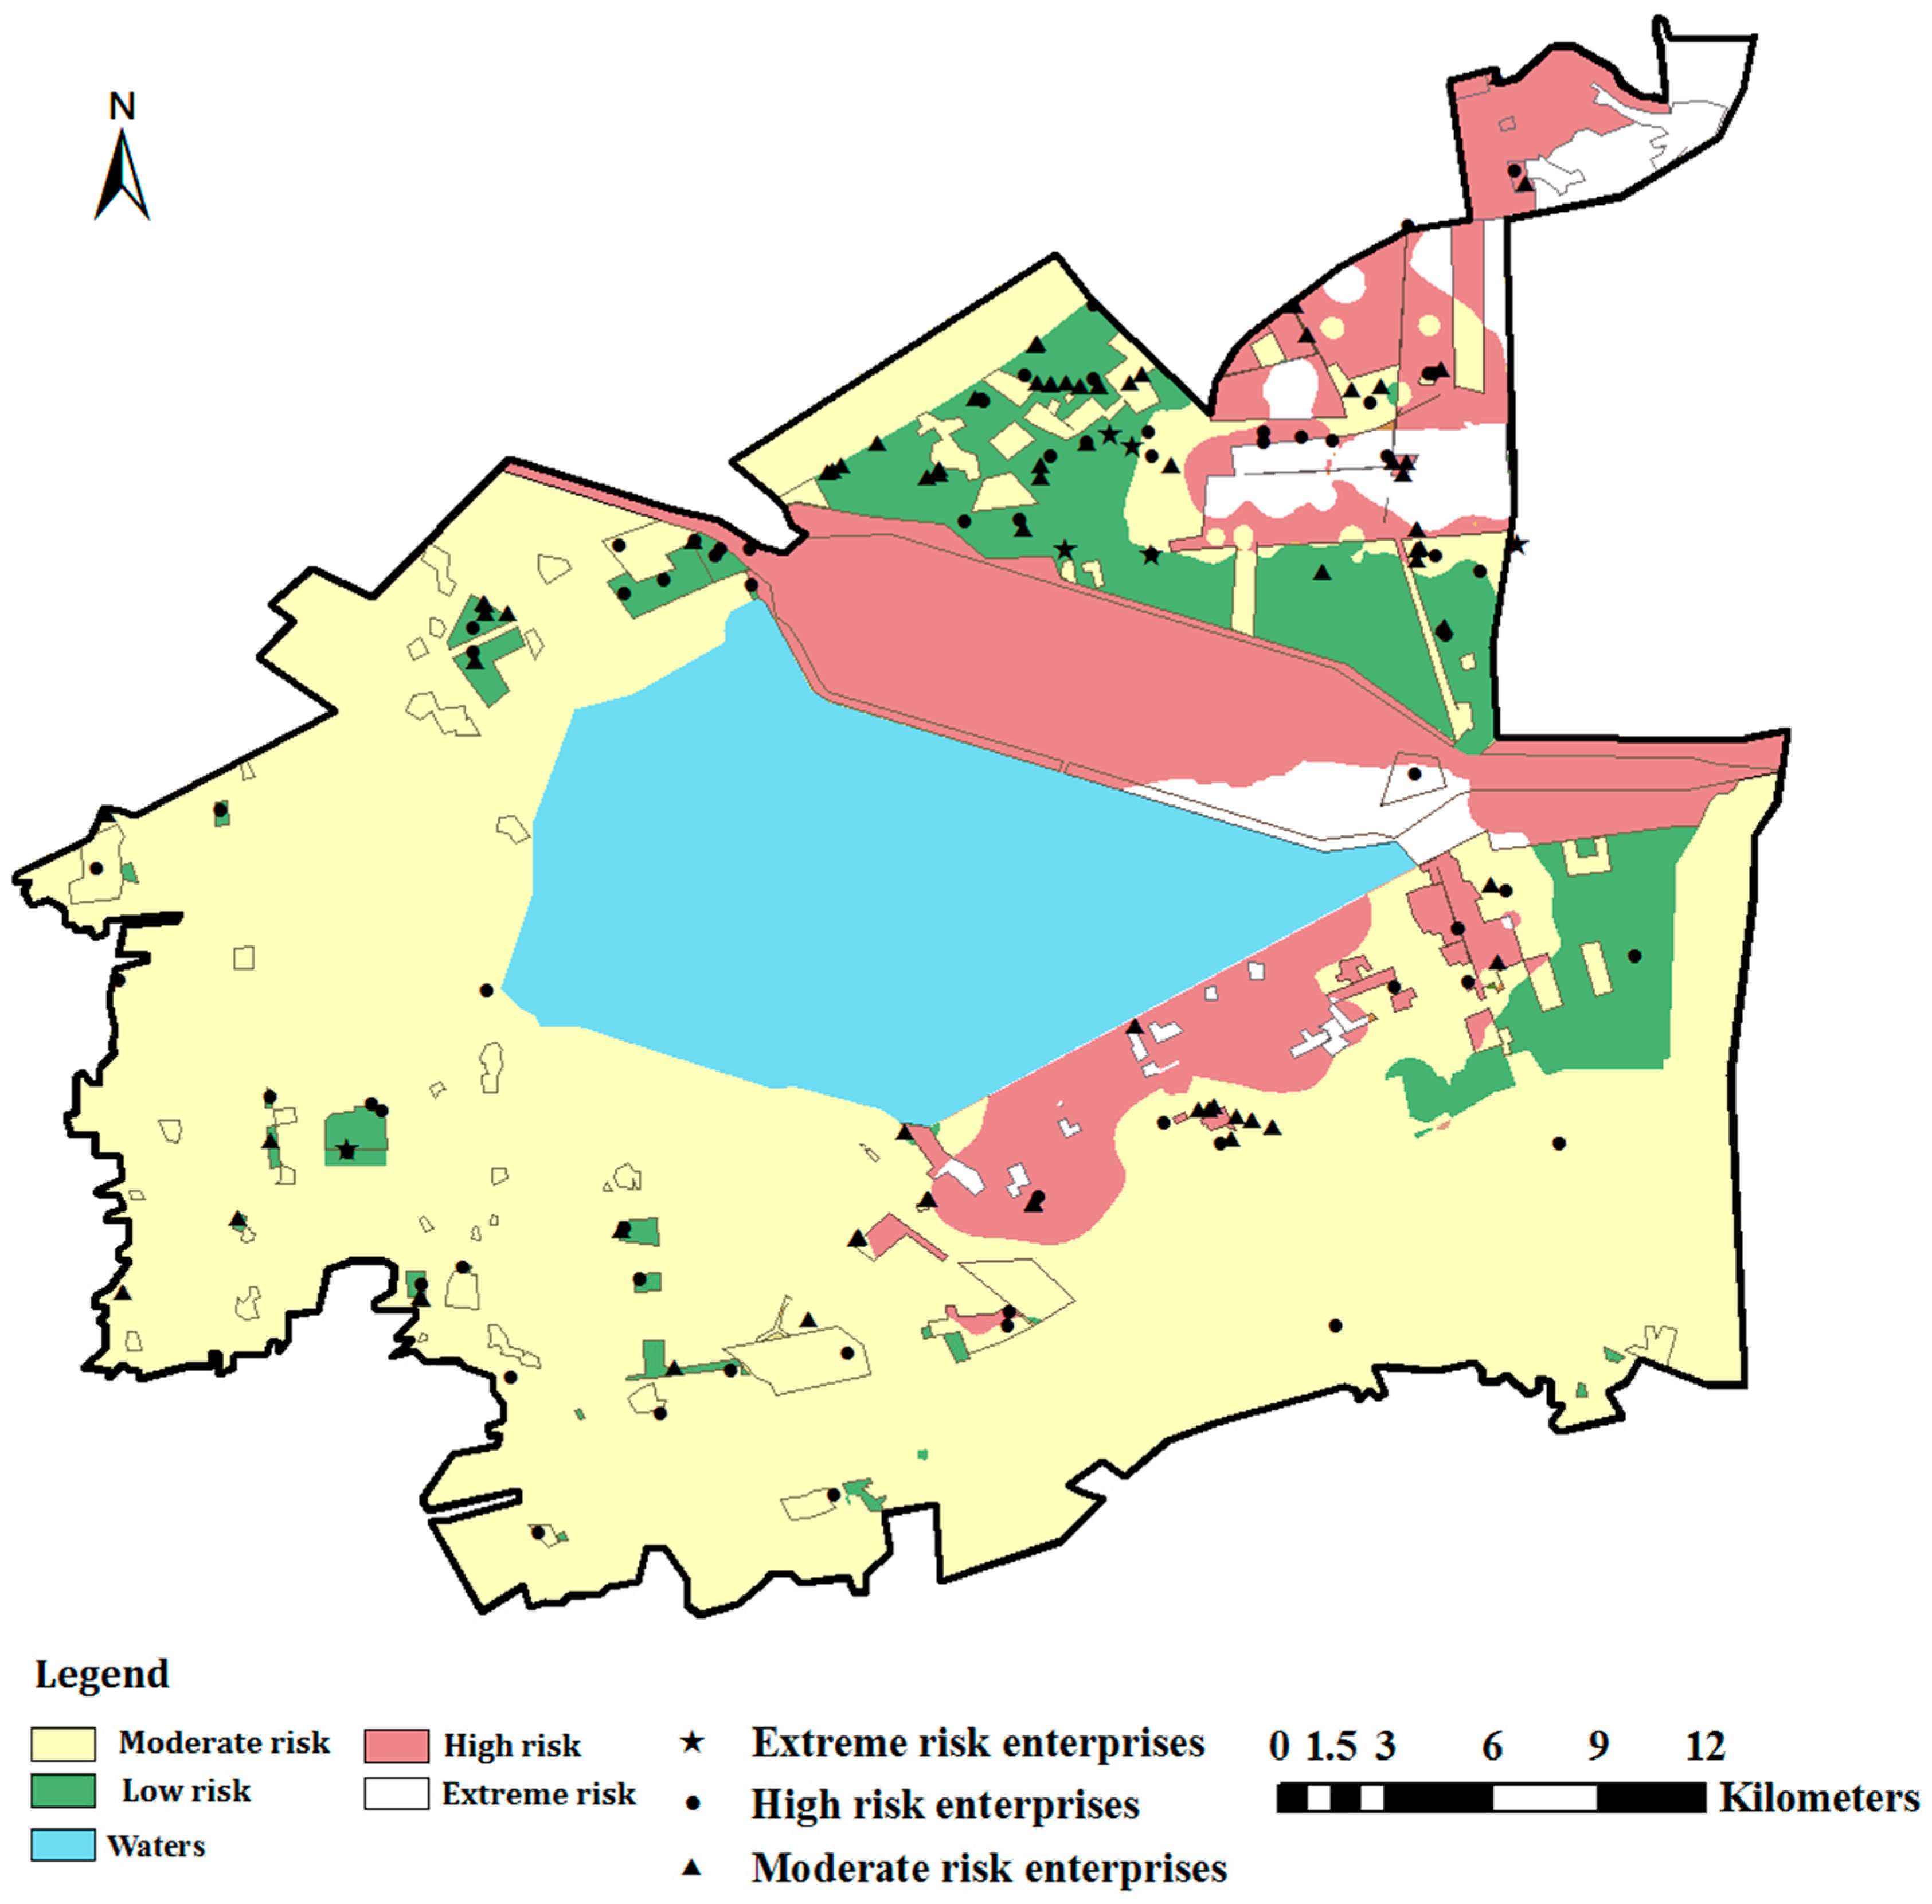
The classification and spatial distribution of integrated risk of soil environment in the study area is presented in
Figure 6. The integrated risk of soil in the study area was moderate to high. Furthermore, in Dagang urban area that located in the northeast of the study area, living areas affiliated to oilfield industrial zone that located in the southeast of the reservoir, wetland and forest park in the northeast of the study area, the integrated risk of soil was high to extreme, indicating that the integrated risks of residential land and conservation land were relative high. In most areas in the west and south of the study area, the integrated risk of soil was generally moderate. In Sanjiaodi industrial area and industrial production area of oilfield industrial zone, the integrated risk of soil was generally low.
More than half of the polluting factories were located in the northeast of the study area, and nearly 20 of these were located in residential areas, posing high to extreme threats to human health. Five of the polluting factories assessed as extreme risk were located in the Sanjiaodi industrial area; the remaining one was surrounded by several polluting factories of different sizes in the southwest of the study area. Polluting factories tended to be distributed throughout green spaces or agricultural lands in the western parts. Such occupancy of non-industrial land by factories typifies industrial and mining gathering areas throughout China, indicating unreasonable planning of land layout and a disordered distribution of factories in the initial stage of regional development. Polluting factories posing high and moderate risks were cluttered and many were located in non-industrial areas. In
Figure 6, we can see that most of the polluting factories are centralized in the three industrial zones, but some are scattered outside of these zones, indicating a need for rational planning and management. Finally, although few of the polluting factories posed extreme risk to human health, their presence around densely populated areas and conservation regions such as reservoirs and forest parks presents a high inherent risk.
Figure 6.
Spatial distribution map of the integrated risk.
Figure 6.
Spatial distribution map of the integrated risk.
4. Discussion
The results revealed that the integrated risk status of residential lands and conservation projects were relatively high and should be improved to ensure that residents are not exposed to contaminated soil and to ensure ecological security. The rational planning of industrial and mining factories is the most important measure against soil environmental risk. In addition, polluting factories near residential lands and conservation areas should maintain their inherent risk below moderate levels. To achieve this goal, they require more comprehensive risk management plans and control measures.
The areas situated northeast to the study area, where polluting factories are largely intermingled with the population and the land use is mainly residential, were assessed as high to extreme integrated risk. Due to the high population density, such areas should be treated as the primary targets for soil risk management and control. A buffer zone should be erected between the urban and industrial areas and the emissions of polluting factories should be monitored.
Polluting factories, especially industrial and mining factories with high or extreme levels of inherent risk, should be relocated to the three major industrial areas to centralize their management and control. Industrial and mining factories located in the southwest of the study area should be shut down or relocated; alternatively, a new industrial zone should be established in this region and the residents should migrate to other residential areas. The non-negligible risks posed by other factories, including brick, food production, papermaking, and property management companies, require special attention. Such factories share common features such as cluttered distribution, lack of proper planning, and poor management. However, the production conditions and requirements and product flow of these industries largely differs from those in the heavy industrial and mining category. Therefore, relocating these factories to the three major industrial zones is neither practical nor wise. One possible solution is to establish specialized industrial areas for light industry and food production and processing in suitable locations. Moreover, these factories require guidance and supervision of their production processes, pollution monitoring systems, and environmental management measures.
From the distribution of industrial land and polluting factories in the southwest of the study area, the staggered distribution of industrial and residential lands was a prominent feature of China’s old industrial areas, and may have derived from the expansion of residential areas and functional areas of factory employees. Such intermingling reflects a lack of overall planning and long-term consideration of risk prevention. To protect residential lands, the long-term planning of industrial and mining gathering areas should separate residential and industrial lands as much as possible. Efficient transportation systems and risk isolation measures would ensure the normal operation of industrial and mining factories without posing risks to the nearby inhabitants.
5. Conclusions
This study established a method for assessing the soil environment risk in industrial and mining gathering areas. To this end, the pollutants and their sources were monitored and investigated. Moreover, the soil environmental risks in a typical industrial and mining gathering area were systematically analyzed. The main contributions of the study are summarized below.
(1) To assess the impacts and damage to human health by soil environmental pollution, a human health risk of heavy metal contaminants and organic pollutants was conducted. Similar to previous studies, heavy metals were identified as the most serious contaminants in the study area. High and extreme risk was found mainly in industrial and residential areas.
(2) The inherent risk level of polluting factories, which pose the main risks in industrial and mining gathering areas, was evaluated. The evaluation system was designed to optimize the layout of the regional environmental risk sources while protecting the residential population and the most sensitive conservation targets.
(3) A comprehensive analysis of soil environmental risk was conducted using a matrix overlay. By this method, the integrated risk in a typical industrial and mining gathering area was assessed. The integrated risk includes the risk level of the soil environment and inherent risk level of the polluting factories.
In industrial and mining gathering areas, the theories and methods of risk assessment and management of the regional soil environment remain at the developmental stage. In particular, the spatial and temporal zoning of environmental risk, multi-risk coupling and risk-field superimposition, and the allocation capacities of regional environmental risk are still being explored. Industrial and mining gathering areas have already implemented technologies and management systems to alleviate their integrated risk to the soil environment. However, further tests, optimization, and upgraded and improved application practices are needed, which should be based on the investigation and evaluation of risk sources.


