Article

Residential Radon Exposure and Incidence of Childhood Lymphoma in Texas, 1995–2011

1
Department of Pediatrics, Section of Hematology-Oncology, Baylor College of Medicine, One Baylor Plaza, MS BCM305, Houston, TX 77030, USA
2
Birth Defects Epidemiology and Surveillance Branch, Texas Department of State Health Services, MC 1964, P.O. Box 149347, Austin, TX 78714-9347, USA
*
Author to whom correspondence should be addressed.
Int. J. Environ. Res. Public Health 2015, 12(10), 12110-12126; https://doi.org/10.3390/ijerph121012110
Submission received: 4 August 2015 / Revised: 11 September 2015 / Accepted: 21 September 2015 / Published: 25 September 2015
(This article belongs to the Special Issue Children’s Exposure to Environmental Contaminants)

Abstract

:
There is warranted interest in assessing the association between residential radon exposure and the risk of childhood cancer. We sought to evaluate the association between residential radon exposure and the incidence of childhood lymphoma in Texas. The Texas Cancer Registry (n = 2147) provided case information for the period 1995–2011. Denominator data were obtained from the United States Census. Regional arithmetic mean radon concentrations were obtained from the Texas Indoor Radon Survey and linked to residence at diagnosis. Exposure was assessed categorically: ≤25th percentile (reference), >25th to ≤50th percentile, >50th to ≤75th percentile, and >75th percentile. Negative binomial regression generated adjusted incidence rate ratios (aIRR) and 95% confidence intervals (CI). We evaluated lymphoma overall and by subtype: Hodgkin (HL; n = 1248), Non-Hodgkin excluding Burkitt (non-BL NHL; n = 658), Burkitt (BL; n = 241), and Diffuse Large B-cell (DLBCL; n = 315). There was no evidence that residential radon exposure was positively associated with lymphoma overall, HL, or BL. Areas with radon concentrations >75th percentile had a marginal increase in DLBCL incidence (aIRR = 1.73, 95% CI: 1.03–2.91). In one of the largest studies of residential radon exposure and the incidence of childhood lymphoma, we found little evidence to suggest a positive or negative association; an observation consistent with previous studies.

1. Introduction

In the United States (US), lymphoma is the third most frequently occurring form of cancer among children, representing approximately one-third of all malignancies in those less than 20 years of age [1]. The overall incidence of lymphoma in children and adolescents is approximately 23 cases per million, which varies by age and subtype [1,2]. Due to advancements in therapy, the overall 5-year survival rate for those diagnosed with lymphoma is greater than 85% [3,4]. However, survivors experience severe and often life-long health consequences as a result of their treatment, including an elevated risk of second primary cancers and other serious chronic conditions [5,6,7,8,9]. Because of these often devastating late effects, the identification of risk factors for the prevention of childhood lymphoma is critical [10]. While environmental pollutants have long been suspected to play a role in the development of childhood lymphoma [11,12], very few risk factors have been identified and confirmed. In fact, most cases of this childhood malignancy are of unknown etiology [13,14,15].
Radon-222 and its decay products are classified as Group 1 carcinogens by the International Agency for Cancer Research [16]. This radioactive gas, resultant from the chemical breakdown of uranium, is associated with severe health outcomes including lung cancer, making exposure to this environmental hazard a significant public health risk [17,18,19]. Radon poses a particular problem as it is an odorless, colorless, naturally-occurring gas that tends to accumulate in homes, often remaining undetected by those exposed [20,21]. The ionizing radiation emitted from the radioactive decay of radon can lead to DNA damage and influence other biologic mechanisms, which may ultimately induce tumorigenesis [22]. Given the established association between radon exposure and lung cancer [23,24,25], there is well-founded interest in evaluating the association between residential exposure to radon and the risk of other malignancies, especially those occurring in children [26,27,28,29]. Previous studies have been largely equivocal in relation to childhood leukemia, and very few assessments have investigated lymphoma specifically [27,28,30,31], although exposure to high levels of ionizing radiation is suggested to increase the risk of non-Hodgkin lymphoma (NHL) among children [12]. As hematologic malignancies including lymphoma arise from mutated cells in the immune system and bone marrow, they are considered one of the most radiosensitive cancers [32,33]. As such, further elucidation of the role radon may play in childhood lymphoma is warranted.
Therefore, we sought to determine if there is an association between indoor radon exposure and the incidence of childhood lymphoma in Texas, a state characterized by variable concentrations of radon due to its diverse geology and history of uranium mining [34]. Additionally, Texas is home to one of the world’s largest population-based cancer registries and was part of the US Geological Indoor Radon Survey, which included mapping of key radon zones in the state [34,35].

2. Experimental Section

2.1. Study Population

Lymphoma cases were obtained from the Texas Cancer Registry (TCR) and limited to those diagnosed less than 20 years of age (n = 2147) for the period of 1995–2011. The TCR is one of the world’s largest, statewide and nationally certified population-based cancer registries, and is ranked “high-quality” by the Centers for Disease Control [36]. The selection of lymphoma subtypes in this study was based on the most recent version of the International Classification of Childhood Cancer (ICCC) [37] and ICD-O3 histologic codes (ICD-O3 HC), in conjunction with World Health Organization 2008 site groups (WHO 2008 SG). For the purposes of this study, we grouped the lymphoma subtypes as follows: Hodgkin (HL; ICD-O3 HC: 9650–9655, 9659, 9661–9665, 9667 and WHO 2008 SG: 33011, 33012; n = 1248); Non-Hodgkin, excluding Burkitt (non-BL NHL; ICD-O3 HC: 9590 (NHL Unspecified); 9591 (NHL B-cell not otherwise specified (NOS)); 9670–9673, 9823 (NHL Mature B-cell-Chronic Small); 9679–9680, 9684 (NHL Mature B-cell-Diffuse Large (DLBCL)); 9698, 9690, 9691 (NHL Mature B-cell-Follicular); 9689, 9699 (NHL Mature B-cell-Nodal Marginal Zone); 9675 (NHL Unknown lineage, NOS); 9727, 9728, 9811 (NHL Precursor-B-cell) and WHO 2008 SG: 33041, 33042; n = 658); Burkitt (BL; ICD-O3 HC: 9687 and WHO 2008 SG: 33041, 33042; n = 241); and DLBCL alone (ICD-O3 HC: 9679-9680, 9684 and WHO 2008 SG: 33041, 33042; n = 315). Population estimates were obtained from the 2000 US Census for all children less than 20 years of age in Texas at that time-point (n = 6,523,632). The Institutional Review Boards (IRB) at Baylor College of Medicine and the Texas Department of State Health Services approved this study.

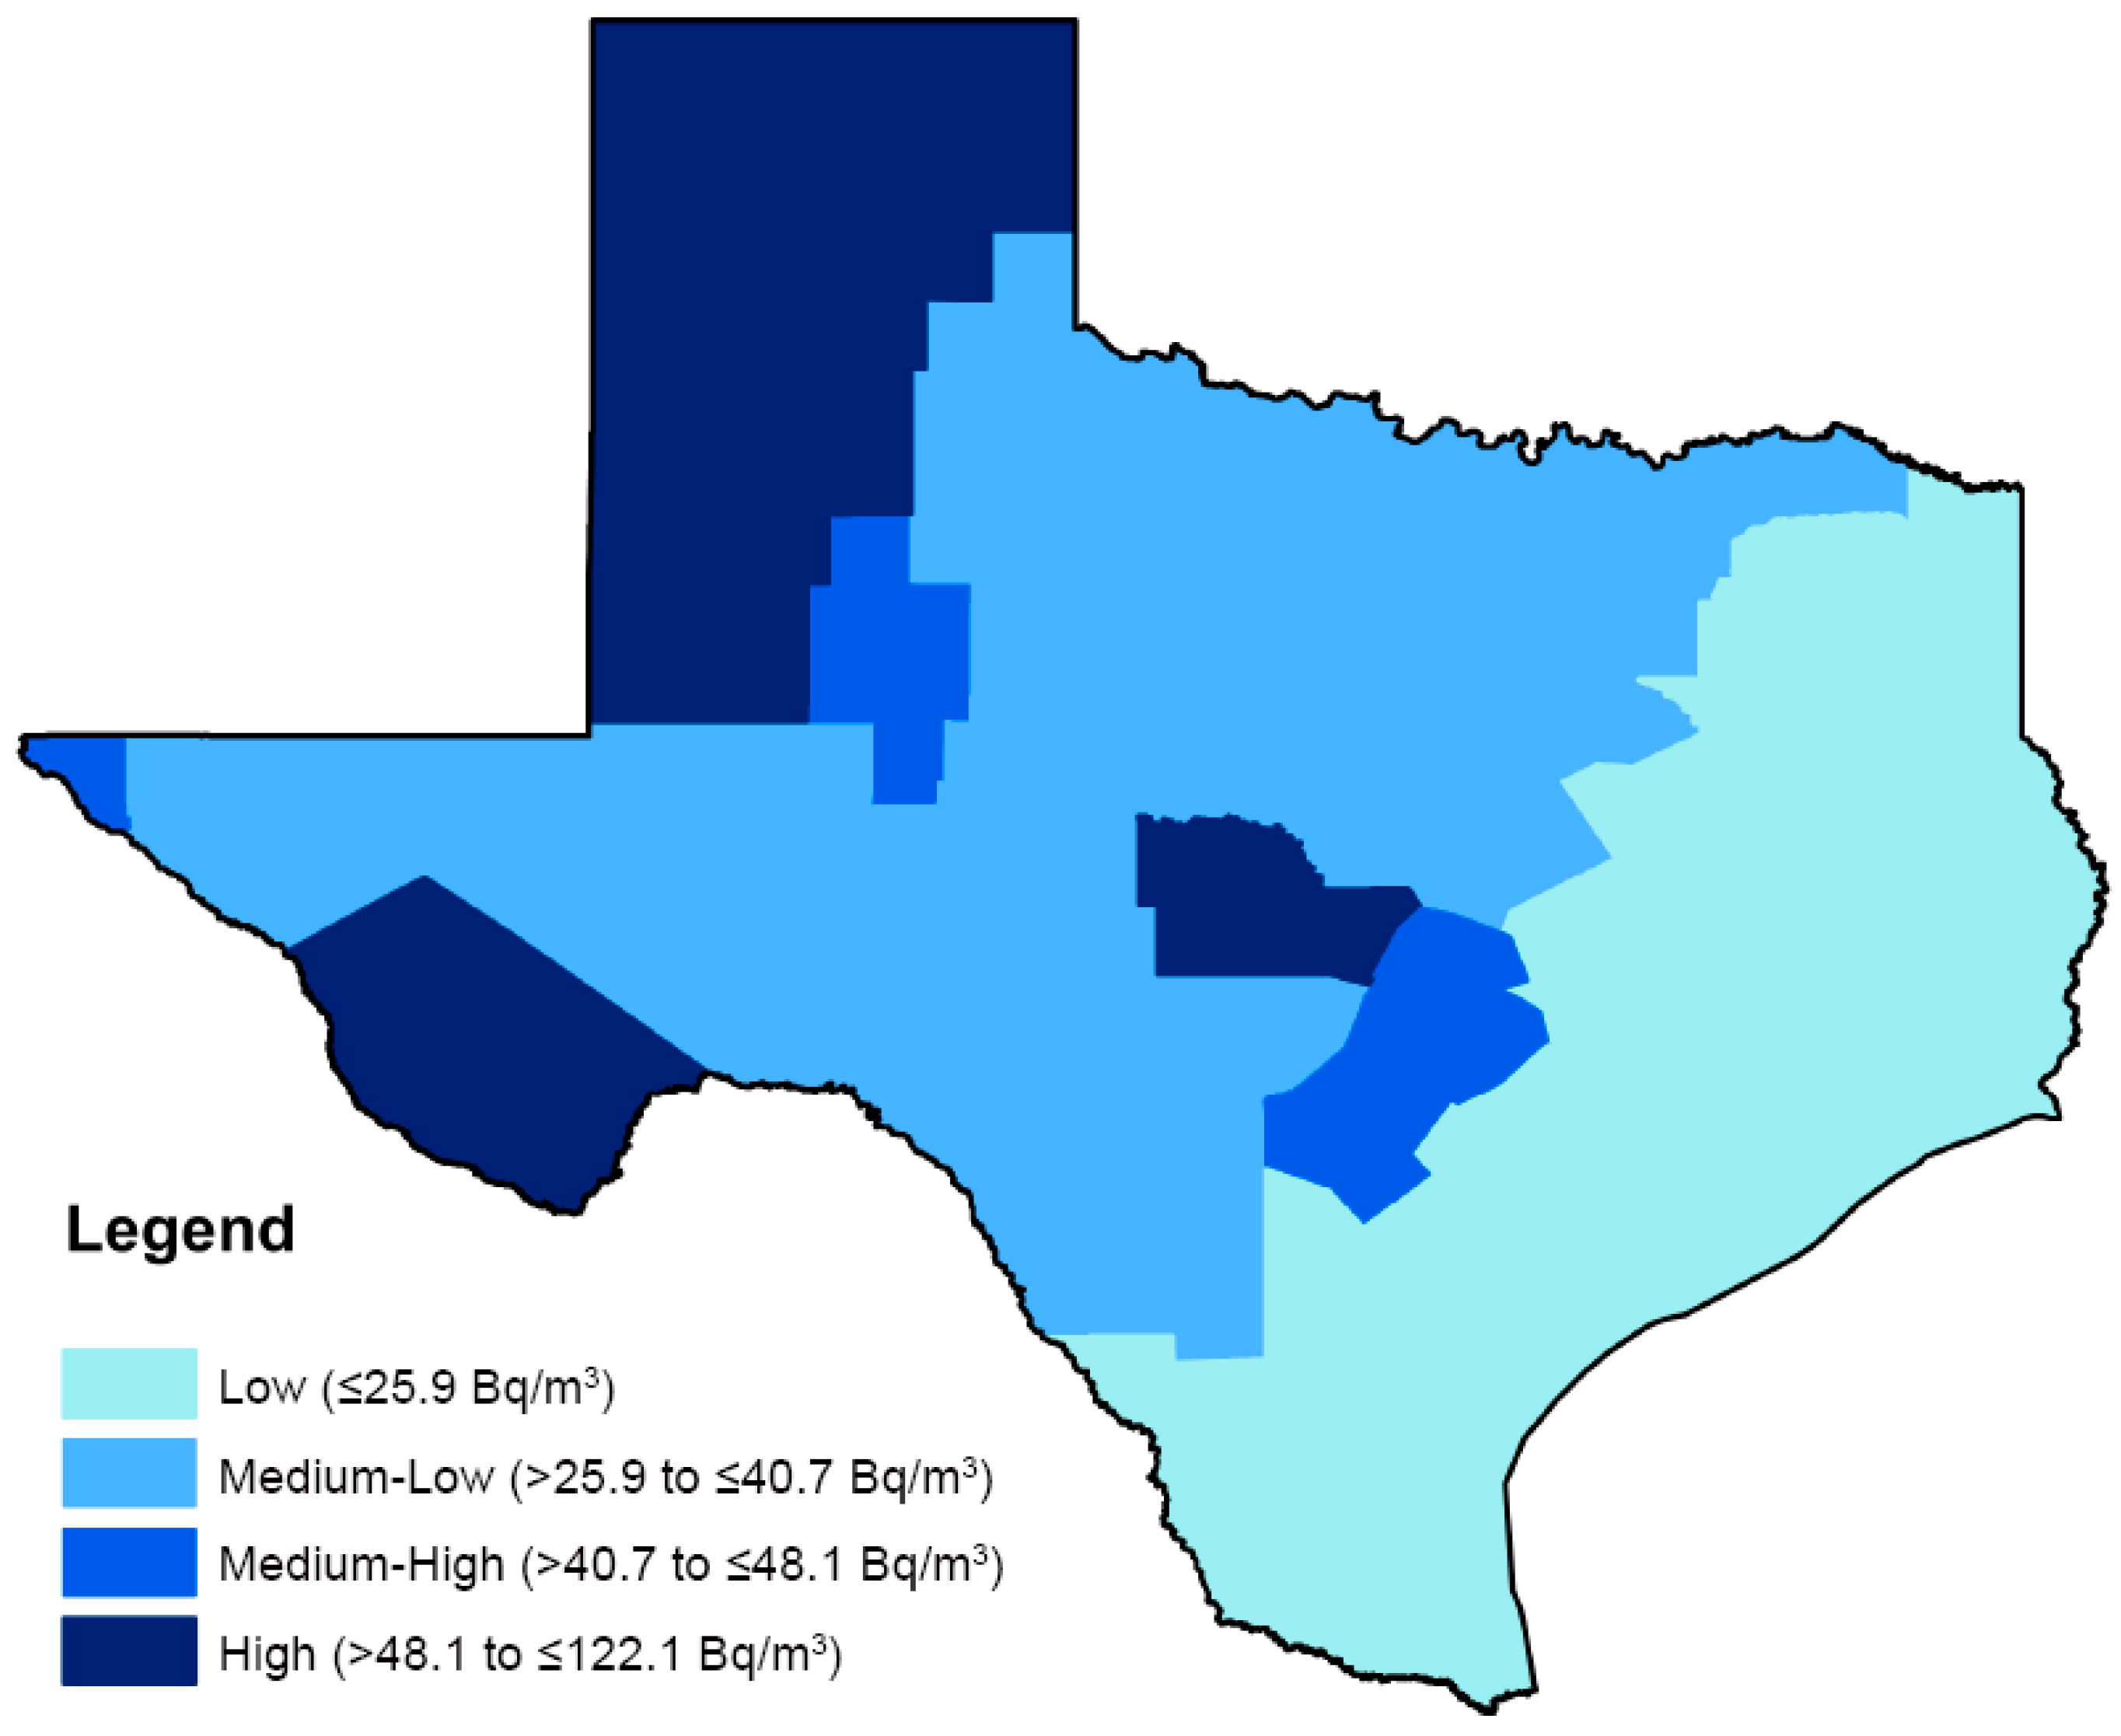
2.2. Exposure Assessment

Exposure to radon was estimated using data from the Texas Indoor Radon Survey, which was a statewide assessment of indoor residential radon conducted January through March, 1991 and supported by a grant from the US Environmental Protection Agency (EPA) [34,35]. Details of the Texas Indoor Radon Survey have been described previously [34,35]. Briefly, residential, owner-occupied single family dwellings were randomly selected and contacted from telephone lists. As Texas is a large state with the potential for regional variation in radon levels given a diverse geologic history, the random allocation of radon detectors used a regional sampling plan, where all counties were grouped into regions based on plausible indoor radon exposure. As example, the Panhandle area of Texas has been shown to have the highest potential for high radon levels, and previously has been the only region in Texas to report a sizable number of homes with residential radon levels greater than 148 Bq/m3, the threshold of concern per EPA guidelines [34]. Additionally, other regions throughout the state, such as Llano Uplift, the Big Bend area, and South Texas also have potential for elevated radon levels given the underlying geologic substructure. In order to determine the study regions for the radon measurements, survey staff grouped all Texas counties together with respect to their potential for residential radon based on subsurface geologic and population data. Then, contiguous counties with similar residential radon potentials were grouped into regions. Further, taking into consideration the potential for rural areas to have less survey representation, large metropolitan areas (e.g., Harris county and the Dallas/Fort-Worth area) were designated as their own regions which were then sampled at a lower percentage than rural areas, thus ensuring that less-populated regions would have adequate survey sample size (Table 1). Thus, in constructing the regions for measurement the goal was two-fold: (a) have regions comprised of homogenous residential radon levels within each region; and (b) ensure a balance in the proportion of houses sampled from both metropolitan and rural areas. Thirteen relatively homogenous regions with little within-region radon variability were thus defined based on estimated radon levels, and all residents within a specific region had an equal chance of being contacted via telephone for survey participation. Notably, Texas had the largest number of regions in comparison to any other state surveyed under the EPA sponsored program, and offered a comprehensive overview of residential radon levels across Texas.
Table 1. Description of the thirteen study regions of the The Texas Indoor Radon Survey, 1991.
Region NameRegion NumberMeasurements for Analysis, n
Southwest Texas1208
El Paso297
Big Bend3122
West Texas Shales4241
North Texas5348
Dallas/Fort Worth6172
East Texas7296
Llano Uplift8213
Central Texas (Austin-San Antonio)9237
Tertiary Sands Crescent10204
Harris County (Houston)11122
Gulf Coast12215
Texas Panhandle13258
The randomly selected residents were then asked to place an activated charcoal adsorption canister in a centrally-located, interior room for the course of seven days. The charcoal absorbed radon decay products which subsequently produced gamma rays able to be measured by scintillation detectors. Upon completion of the seven days, participants sealed the canister and immediately returned via mail to the US Environmental Protection Agency laboratory, where the gamma ray quantification took place. Over seventy-percent of the 4031 canisters sent out (n = 2890; 71.7%) were returned and contributed to the present analysis [35]. The arithmetic mean radon concentration for each region (picoCuries/liter; pCi/l), as published in and available from the final survey report, was assigned to each study subject based on either (i) the county of residence at time of lymphoma diagnosis for cases or (ii) county of residence at time of the 2000 Census for population estimates. For this analysis, exposure was assessed with the unit of comparison as the mean radon concentration in each of the thirteen geologic regions, converted from pCi/l to Becquerel per cubic meter (Bq/m3) to be consistent with international nomenclature.

2.3. Covariate Selection

We considered age at diagnosis, sex, and race/ethnicity, as well as county-level socioeconomic status (SES) and urbanization as potential confounders. Age at diagnosis was assessed categorically with four levels (0–4, 5–9, 10–14, and 15–19 years of age). Race/ethnicity was categorized as non-Hispanic white, Hispanic white, non-Hispanic black, and other which included those who reported being Asian, American Indian/Alaska Native, Hawaiian Island/Pacific Islander, some other race alone, and two or more races. Hispanics of one or more races were classified as “two or more races”, and counted in the “other” category. County-level SES and urbanization were based on data from the 2000 Census, with both case and denominator data for SES and urbanization assigned based on county of residence at diagnosis or at the time of the 2000 Census. Low SES counties were defined as those with greater than the median proportion of the population living under the Federal Poverty Level. Urban counties were defined as those with greater than or equal to 50% of the population living in an “Urban” area as defined by the US Census. County-level SES and urbanization were assessed categorically in four levels as urban-high SES, rural-high SES, urban-low SES, and rural-low SES. No cases were missing data on our covariates of interest.

2.4. Statistical Analyses

Negative binomial regression was used to explore the association between residential radon exposure and the incidence of childhood lymphoma, with our unit of comparison being the mean radon concentration in each of the thirteen geologic regions. While Poisson regression is a traditional method to analyze count data such as this, at times the assumptions of this model are violated as individual counts are more variable, or overdispersed, than is accommodated under the Poisson distribution [38,39]. This limitation may be overcome through the use of a negative binomial model as a random term reflects unexplained between-subject differences to account for overdispersion of data [40]. Thus, given the overdispersed nature of our data, modeling under negative binomial regression was statistically more appropriate than the utilization of Poisson regression [41].
We conducted analyses among all lymphoma cases per geologic region, and separately for each of the following lymphoma subtypes: HL, non-BL NHL, BL, and DLBCL. Mean radon concentration in each region was the primary exposure, and other independent variables included in the model were county-level SES and level of urbanization, sex, age group, and race/ethnicity. Denominator data were obtained from the 2000 Census for all 6.5 million children less than 20 years of age in Texas. We generated unadjusted incidence rate ratios (IRR) and 95% confidence intervals (CI), and IRR adjusted for sex, race/ethnicity, age group, and county-level SES/urbanization (aIRR).
In order to evaluate incidence of childhood lymphoma, regional mean radon concentrations were assessed categorically comparing the regions with “medium-low” radon concentrations (>25th to ≤50th percentile; >25.9 to ≤40.7 Bq/m3), “medium-high” radon concentrations (>50th to ≤75th percentile; >40.7 to ≤48.1 Bq/m3), and the “highest” radon concentrations (>75th percentile; >48.1 Bq/m3) to regions with the “lowest” radon concentrations (≤25th percentile; ≤25.9 Bq/m3). Cut-points were based on the distribution across the state (Figure 1). All analyses were conducted using STATA (version 13, StataCorp, College Station, TX, USA).
Figure 1. Quartile distribution of residential radon exposure from The Texas Indoor Radon Survey, 1991.
Ijerph 12 12110 g001

3. Results and Discussion

3.1. Results

Demographic characteristics of the lymphoma cases diagnosed under the age of 20 in Texas between 1995 and 2011 are shown in Table 2. Lymphoma cases in our study population were predominantly diagnosed between the ages of 15–19 years (51.2%), male (61.2%), non-Hispanic white (47.9%), and lived in urban, high SES counties (66.2%). Texans under 20 years of age were distributed evenly with respect to age and sex, and as in lymphoma cases, most were non-Hispanic white (42.8%) and the majority lived in urban, high SES counties (66.3%).
The distribution of mean residential radon concentrations measured in Bq/m3 across Texas is presented in Table 3. The arithmetic mean radon concentration across regions was 45.97 Bq/m3, with levels ranging from 9.25 Bq/m3 to 122.10 Bq/m3. The median radon concentration was 40.70 Bq/m3.
Table 2. Demographic characteristics of lymphoma malignancy subtypes among children and adolescents <20 years of age diagnosed in Texas, 1995–2011.
CharacteristicAll Lymphomas (n = 2147)Hodgkin Lymphoma (n = 1248)NHL Excluding BL (n = 658)Burkitt Lymphoma (n = 241)Diffuse Large B-Cell Lymphoma (n = 315)Total TX Population <20 Years Old * (n = 6,523,632)
Age of Diagnosis (years), n (%)
<5197 (9.2)38 (3.0)110 (16.7)49 (20.3)49 (20.3)1,610,302 (24.7)
5 to <10316 (14.7)117 (9.4)123 (18.7)76 (31.5)76 (31.5)1,660,902 (25.5)
10 to <15534 (24.9)323 (25.9)148 (22.5)63 (26.1)63 (26.1)1,642,973 (25.2)
15 to <201100 (51.2)770 (61.7)277 (42.1)53 (22.0)53 (22.0)1,609,455 (24.7)
Sex, n (%)
Male1314 (61.2)702 (56.3)404 (61.4)208 (86.3)208 (86.3)3,348,530 (51.3)
Female833 (38.8)546 (43.8)254 (38.6)33 (13.7)33 (13.7)3,175,102 (48.7)
Race/Ethnicity, n (%) **
Non-Hispanic White1029 (47.9)590 (47.3)310 (47.1)129 (53.5)129 (53.5)2,790,778 (42.8)
Hispanic White787 (36.7)447 (35.8)261 (39.7)79 (32.8)79 (32.8)1,484,094 (22.7)
Non-Hispanic Black243 (11.3)158 (12.7)61 (9.3)24 (10.0)24 (10.0)820,640 (12.6)
Other 88 (4.1)53 (4.3)26 (4.0)9 (3.7)9 (3.7)1,428,120 (21.9)
County-level SES/Level of Urbanization , n (%)
Urban, Higher SES1421 (66.2)818 (65.5)434 (66.0)169 (70.1)169 (70.1)4,326,761 (66.3)
Urban, Lower SES510 (23.8)296 (23.7)167 (25.4)47 (19.5)47 (19.5)1,520,114 (23.3)
Rural, Higher SES144 (6.7)86 (6.9)37 (5.6)21 (8.7)21 (8.7)425,312 (6.5)
Rural, Lower SES72 (3.4)48 (3.9)20 (3.0)4 (1.7)4 (1.7)251,445 (3.9)
Mean Residential Radon Concentration (Bq/m3)33.332.434.334.835.3-----
SES, Socioeconomic status; TX, Texas; * Source: 2000 U.S. Census, U.S. Census Bureau; ** “Other” Race/Ethnicity includes, those who reported being Asian, American Indian/Alaska Native, Hawaiian Island/Pacific Islander, Some other race alone, and Two or more races. Lower SES defined as counties with greater than the median proportion of the population living under the Federal Poverty Level; Urban defined as those counties with greater than or equal to 50% of the population living in Census defined “Urban” county.
Table 3. Distribution of residential radon exposure from The Texas Indoor Radon Survey, 1991.
Indoor Radon Concentration (Becquerel per Cubic Meter; Bq/m3)
Arithmetic mean45.97 *
Geometric mean (95% CI)37.75 (25.19–56.58)
Minimum9.25
Maximum122.10
Percentile
25th25.90
50th40.70
75th48.10
90th96.20
99th122.10
* Mean radon concentration levels as measured in Bq/m3 for each geologic region across Texas were the unit of analysis for exposure assessment.
Similar incidence rate ratios of any lymphoma were observed across areas with “medium-low”, “medium-high”, and the “highest” mean radon concentrations, compared to areas with the “lowest” mean concentrations: aIRR = 0.89, 95% CI: 0.79–1.00; aIRR = 0.90, 95% CI: 0.77–1.04; aIRR = 1.05, 95% CI: 0.83–1.32; p-trend = 0.35 (Table 4). Areas with “medium-low” radon concentrations had a significantly lower incidence of HL compared with areas of “lowest” radon concentrations (aIRR = 0.83, 95% CI: 0.71–0.98). However, this trend was not observed with increasing exposure (p-for-trend = 0.20). Areas with “highest” radon concentrations had a marginal but non-significant increase in non-BL NHL incidence compared to areas with the “lowest” radon concentrations (aIRR = 1.37, 95% CI: 0.95–1.97), however no trend was evident for this subtype (p-for-trend = 0.96). A similar pattern was seen for BL, where areas with “highest” radon concentrations had a marginal but non-significant increase in incidence compared to areas with the “lowest” radon concentrations (aIRR = 1.33, 95% CI: 0.70–2.53, p-for-trend = 0.54). Last, DLBCL incidence was increased in areas with the “highest” mean radon concentrations, although this trend was not identified with increasing exposure (aIRR = 1.73, 95% CI: 1.03–2.91, p-for-trend = 0.22). Notably, only three regions in Texas (Figure 1) were characterized as having “high” radon levels. Furthermore, the region with the highest levels (region 13) appeared to be driving the associations that were seen in that exposure category.
Table 4. Associations between indoor radon exposure and incidence rates of lymphoma malignancy subtypes among children and adolescents <20 years of age diagnosed in Texas, 1995–2011.
Lymphoma SubtypeCases (n)IR *IRR * (95% CI)aIRR * (95% CI)p-for-Trend
All Lymphomas
≤25th percentile (reference)97034.251.001.000.35
>25th to ≤50th percentile71130.920.88 (0.70–1.10)0.89 (0.79–1.00)
>50th to ≤75th percentile37333.380.98 (0.73–1.32)0.90 (0.77–1.04)
>75th percentile9333.880.93 (0.67–1.30)1.05 (0.83–1.32)
Hodgkin Lymphoma
≤25th percentile (reference)58320.591.001.000.20
>25th to ≤50th percentile39117.000.86 (0.64–1.15)0.83 (0.71–0.98)
>50th to ≤75th percentile22720.320.99 (0.68–1.45)0.94 (0.77–1.14)
>75th percentile4717.120.81 (0.51–1.26)0.87 (0.63–1.20)
NHL excluding BL
≤25th percentile (reference)28910.201.001.000.96
>25th to ≤50th percentile23110.040.96 (0.74–1.25)1.00 (0.82–1.21)
>50th to ≤75th percentile1039.220.92 (0.66–1.29)0.82 (0.64–1.05)
>75th percentile3512.751.26 (0.83–1.93)1.37 (0.95–1.97)
Burkitt Lymphoma
≤25th percentile (reference)983.461.001.000.54
>25th to ≤50th percentile893.870.98 (0.65–1.48)1.01 (0.73–1.38)
>50th to ≤75th percentile433.851.08 (0.64–1.80)1.04 (0.71–1.52)
>75th percentile114.011.05 (0.52–2.14)1.33 (0.70–2.53)
Diffuse Large B-Cell
≤25th percentile (reference)1234.341.001.000.22
>25th to ≤50th percentile1195.171.11 (0.80–1.55)1.11 (0.85–1.44)
>50th to ≤75th percentile565.011.11 (0.74–1.68)1.01 (0.73–1.39)
>75th percentile176.191.42 (0.81–2.49)1.73 (1.03–2.91)
CI, confidence interval; IR, incidence rate; IRR, incidence rate ratio; * Per 100,000 individuals; aIRR, adjusted for race/ethnicity, sex, category of age at diagnosis, and county-level SES/level of urbanization.

3.2. Discussion

In one of the largest studies of its kind, we found little evidence to suggest radon is positively or negatively associated with childhood lymphoma incidence. Further, while areas characterized as having the “highest” concentrations of radon did have a significantly higher incidence of DLBCL when compared to areas with the “lowest” concentrations of radon, a dose-response relationship was not observed for increasing exposure. While there have been few previous assessments of residential radon exposure and childhood lymphoma, our results are largely consistent with studies evaluating residential radon and childhood leukemia, where only weak associations have been suggested [26,28,42]. Like leukemia, lymphoma is considered to be a radiosensitive malignancy as it originates from mutated immune cells [32]. However, our findings do not suggest that residential levels of radon are strongly nor consistently associated with risk of this malignancy in children.
Radon is a radioactive decay product of uranium, and occurs naturally in soil, bedrock, and groundwater [43,44]. This inert, odorless gas migrates from the soil and penetrates buildings through cracks when a difference between soil gas and indoor air pressure exists [44,45]. An established public health concern, this carcinogenic, radioactive decay product is responsible for more than half of an individual’s average annual radiation dose, even though it remains undetected to those exposed [22,46,47,48]. Indoor radon exposure is the second leading cause of overall lung cancer, and the leading cause of lung cancer among never-smokers [45,49,50]. Furthermore, radon-associated lung cancer in never-smokers is also characterized by a younger age of onset [51]. While the risk of adverse health effects increases with higher dosage and longer durations of exposure, measuring the impact of low-level radiation levels remains difficult [44,46]. Despite this challenge, elucidating the role of domestic radon exposure in tumorigenesis continues to be of public health importance and interest. As radon decay products lead to DNA damage, somatic mutations and chromosomal aberrations, investigating an association with a malignancy such as lymphoma, which is influenced by genetic abnormalities, is well-founded [22,52,53].
The majority of studies evaluating the role of radon on lymphoma outcomes have focused on adults. One of the few studies to investigate radon and childhood lymphoma, a case-control study from Denmark between 1968–1994, determined a null association in relation to domestic radon exposure (lymphoma relative risk (RR): 0.90, 95% CI: 0.62–1.36) [30], which is similar to our findings. In one recent study among adults in the Eldorado uranium workers cohort, exposure to radon decay products was associated with a modest, but non-significant excess relative risk (ERR) in the incidence of HL among a small case group (HL ERR per 100 working level months: 20.7, 95% CI: 0.00–324.00, p-value: 0.08) [33]. A second study investigating this association among Czech uranium miners concluded that incidences of HL and NHLs were not increased due to radon exposure (HL RR: 2.12, 95% CI: 0.81–5.52; NHL RR: 0.80, 95% CI: 0.46–1.37) [54].
Our results did suggest that incidence of HL was marginally lower in areas of “medium-low” exposure. As relevant risk factors for HL in early life remain elusive, this may represent a previously unidentified association [15]. However, as a lack of biologic plausibility is present, there is also the possibility that this observation may be due to residual confounding, or related to unknown confounders, rather than an inverse association between radon exposure and HL incidence. Our results further suggested a modest increase in DLBCL incidence for areas with the “highest” mean radon concentrations compared to areas of the “lowest”. This may be a true association in support of a threshold effect for this lymphoma subtype. However, we cannot rule out that this increase in incidence may have been driven by the limited sample size of this strata (n = 17 DLBCL cases in this “highest” category) [55], especially as a trend with increasing exposure was not evident. Thus, these results in support of an association between residential radon and either childhood HL or DLBCL incidence remains non-conclusive.
There are certain limitations associated with the exposure assessment. First, the Texas Indoor Radon Survey utilized activated charcoal adsorption canisters rather than alpha track detectors. However, this was done largely in an attempt to capture exposure throughout the state in a cost-effective manner [34]. Second, there was no seasonal assessment of radon levels. Specifically, measurements were taken only in winter months when levels are highest. Therefore, we categorized exposure assuming that while levels may change, the relative ranking of regions would remain comparatively consistent. Third, radon exposure was measured in a centrally-located interior room as opposed to a bedroom where inhabitants may spend the most of their time while home, and thus may not have captured the area in which the main radon exposure may have occurred. Radon levels however are not likely to fluctuate greatly inside a single home, except for a potential decrease in radon concentrations in higher levels of a house (e.g., second-level of a house compared to the basement) [56]. Finally, the data generated from the Texas Indoor Radon Survey suggested that radon levels across the state of Texas are moderately low, with particular “hot-spots”, such as the Texas Panhandle, in concordance with the geologic substructure. This in-turn decreased the range of mean radon concentrations for analytic comparison resulting in a limited number of regions categorized as experiencing the “highest” levels of exposure.
Our study must be considered in the light of additional limitations. As our study was ecologic in nature, one potential limitation was the use of an area-level exposure assessment, which may have resulted in exposure misclassification [57]. However, population-scale individual-level measurements of radon exposure are nonexistent, and monitoring of radon in communities throughout the US is very limited. Therefore, the data generated through the Texas Indoor Radon Survey provide an important and cost-effective resource to evaluate the question of whether residential radon is associated with childhood lymphoma. Similar data sources and ecologic assessments have contributed a great deal of knowledge in terms of elucidating the association between residential radon and cancer [31,42,58,59,60,61,62,63]. Furthermore, county-level and area-level based estimates of residential exposures are commonly used when evaluating environmental contributions to disease [64,65,66,67]. In fact, data from the Texas Indoor Radon Survey have been used recently to explore the association between residential radon levels and structural birth defects [35].
Another potential limitation is exposure misclassification due to residential mobility during critical periods of development and windows of exposure. Specifically, as we only had access to residential information at diagnosis, we were not able to capture changes in exposure for those who may have moved between birth and diagnosis. While mobility during this time is likely, recent studies of the impact of residential mobility on environmental exposure assessment indicate individuals do not typically move great distances, most often staying within the same county or region [68,69,70]. This may lessen the impact of residential mobility on exposure misclassification in our assessment. However, we acknowledge that residential mobility may impact our exposure assessment and our findings.
Last, our exposure of mean radon concentration was estimated in 1991 while our case population was diagnosed between 1995 and 2011. We believe this may minimally influence our results as radon production levels should have remained constant over the period of 1995–2011 [35]. Radon decay products are in equilibrium with underground radium-226 whose half-life is 1600 years [45,47]. Thus, while radon levels over this time period were unlikely to have changed given the length of this half-life, methods of housing construction to influence indoor radon concentration may have changed during this time period [35,71]. A main and probable change in housing construction over this time period would include improved methods of insulation that may have promoted the containment of radon and its progeny [72,73]. Levels of radon exposure may thus have been greater than what was actually captured by the survey instrument resulting in an underestimation of effect size. However, despite potential changes in housing construction, building materials, and other unknown factors that may have influenced radon levels at the time of the survey, we are confident that the measurements from 1991 are reasonable proxies for approximate radon levels over the time of case diagnoses. This conclusion is further supported by the fact that over half of our case population (55.5%) was alive during the time that the exposure assessment was conducted.
A primary strength of our study was the inclusion of over 15 years of data for the state of Texas, with a relatively robust sample size of over 2000 childhood lymphoma cases representing one of the largest studies of this malignancy in children [74,75,76]. Given this reasonably large sample size, we were able to stratify by subtype to comprehensively evaluate our exposure in relation to the most prevalent lymphoma types, which are heterogeneous in nature [77]. Additional strengths of our study included the utility of a population-based sample, which limits the potential for selection bias as none of the study subjects self-selected to participate [65]. Further, we assessed our population and case estimates, in particular SES and level of urbanization, at the county-level prior to additional aggregation, as utilizing a smaller unit of analysis is one method of bias reduction when investigating aggregate data [57,78]. An added benefit of an area-based socioeconomic measure for confounder control is that it represented a mix of both individual-level and area-based socioeconomic effects to diminish potential bias [79]. Last, as we investigated childhood cancers with latency periods that are shorter compared to those of adult malignancies, limiting the possibility for unmeasured confounders or other methodological issues oftentimes related to the constructing exposure histories for adult cancers [80,81,82,83].

4. Conclusions

In conclusion, we found little evidence to suggest residential radon exposure is either positively or negatively associated with childhood lymphoma incidence; similar to previous studies evaluating this environmental exposure and other malignancies in children such as leukemia. To our knowledge, this is the first epidemiologic evaluation of residential radon exposure and childhood lymphoma in Texas, and one of few studies to investigate this exposure in regards to lymphoma among those less than 20 years of age. Future assessments should consider finer levels of exposure assessment, potentially through the use of alpha-track detectors, in order to fully evaluate the potential for residential radon exposure to impact childhood lymphoma incidence. Further, the use of alternative study designs, such as incorporating pooled data from multiple studies, could be utilized to increase the study power of each lymphoma phenotype and add to the clarification of any association. Last, incorporating biomarkers of exposure and response may also significantly improve the potential to further elucidate any association between residential radon and childhood cancers such as lymphoma.

Acknowledgments

This work was supported by the National Institutes of Health Training Program in Pediatric Cancer Epidemiology and Control (R25 CA160078 awarded to MES). Cancer data have been provided by the Texas Cancer Registry, Cancer Epidemiology and Surveillance Branch, Texas Department of State Health Services, 1100 West 49th Street, Austin, TX 78756, USA, http://www.dshs.state.tx.us/tcr/default.shtm, or (512)-776-3080.

Author Contributions

Philip J. Lupo, Michael E. Scheurer, Heather E. Danysh, Peter H. Langlois and Erin C. Peckham conceived and designed the experiments; Erin C. Peckham analyzed the data with the assistance of Philip J. Lupo, Heather E. Danysh, and Joseph Lubega; Erin C. Peckham and Philip J. Lupo wrote the manuscript; all authors contributed to revisions of the manuscript and approved the final manuscript.

Conflicts of Interest

The authors declare no conflict of interest.

References

  1. Cancer Incidence and Survival among Children and Adolescents: United States Seer Program 1975–1995; Ries, L.S.M.; Gurney, J.; Linet, M.; Tamra, T.; Young, J.; Bunin, G. (Eds.) National Cancer Institute, SEER Program: Bethesda, MD, USA, 1999.
  2. American Cancer Society. Cancer Facts & Figures 2014; American Cancer Society: Atlanta, GA, USA, 2014. [Google Scholar]
  3. Englund, A.; Hopstadius, C.; Enblad, G.; Gustafsson, G.; Ljungman, G. Hodgkin lymphoma—A survey of children and adolescents treated in Sweden 1985–2009. Acta Oncol. 2015, 54, 41–48. [Google Scholar] [CrossRef] [PubMed]
  4. Reiter, A. Non-Hodgkin lymphoma in children and adolescents. Klin. Padiatr. 2013, 225, S87–S93. [Google Scholar] [CrossRef] [PubMed]
  5. El-Galaly, T.C.; Mylam, K.J.; Bøgsted, M.; Brown, P.; Rossing, M.; Gang, A.O.; Haglund, A.; Arboe, B.; Clausen, M.R.; Jensen, P.; et al. Role of routine imaging in detecting recurrent lymphoma: A review of 258 patients with relapsed aggressive non-Hodgkin and Hodgkin lymphoma. Am. J. Hematol. 2014, 89, 575–580. [Google Scholar] [CrossRef] [PubMed]
  6. Gebauer, J.; Fick, E.M.; Waldmann, A.; Langer, T.; Kreitschmann-Andermahr, I.; Lehnert, H.; Katalinic, A.; Brabant, G. Self-reported endocrine late effects in adults treated for brain tumours, Hodgkin and non-Hodgkin lymphoma—A registry based study in northern Germany. Eur. J. Endocrinol. 2015, 173, 139–148. [Google Scholar] [CrossRef] [PubMed]
  7. Rihani, R.; Bazzeh, F.; Faqih, N.; Sultan, I. Secondary hematopoietic malignancies in survivors of childhood cancer. Cancer 2010, 116, 4385–4394. [Google Scholar] [CrossRef] [PubMed]
  8. Tieu, M.T.; Cigsar, C.; Ahmed, S.; Ng, A.; Diller, L.; Millar, B.A.; Crystal, P.; Hodgson, D.C. Breast cancer detection among young survivors of pediatric Hodgkin lymphoma with screening magnetic resonance imaging. Cancer 2014, 120, 2507–2513. [Google Scholar] [CrossRef] [PubMed]
  9. Venkatramani, R.; Kamath, S.; Wong, K.; Olch, A.J.; Malvar, J.; Sposto, R.; Goodarzian, F.; Freyer, D.R.; Keens, T.G.; Mascarenhas, L. Pulmonary outcomes in patients with Hodgkin lymphoma treated with involved field radiation. Pediatr. Blood Cancer 2014, 61, 1277–1281. [Google Scholar] [CrossRef] [PubMed]
  10. Robison, L.L.; Green, D.M.; Hudson, M.; Meadows, A.T.; Mertens, A.C.; Packer, R.J.; Sklar, C.A.; Strong, L.C.; Yasui, Y.; Zeltzer, L.K. Long-term outcomes of adult survivors of childhood cancer. Cancer 2005, 104, 2557–2564. [Google Scholar] [CrossRef] [PubMed]
  11. Miligi, L.; Benvenuti, A.; Mattioli, S.; Salvan, A.; Tozzi, G.A.; Ranucci, A.; Legittimo, P.; Rondelli, R.; Bisanti, L.; Zambon, P.; et al. Risk of childhood leukaemia and non-Hodgkin’s lymphoma after parental occupational exposure to solvents and other agents: The setil study. Occup. Environ. Med. 2013, 70, 648–655. [Google Scholar] [CrossRef] [PubMed] [Green Version]
  12. Mcnally, R.J.Q.; Parker, L. Environmental factors and childhood acute leukemias and lymphomas. Leuk. Lymphoma 2006, 47, 583–598. [Google Scholar] [CrossRef] [PubMed]
  13. Lightfoot, T.J.; Roman, E. Causes of childhood leukaemia and lymphoma. Toxicol. Appl. Pharmacol. 2004, 199, 104–117. [Google Scholar] [CrossRef] [PubMed]
  14. Crump, C.; Sundquist, K.; Sieh, W.; Winkleby, M.A.; Sundquist, J. Perinatal and family risk factors for non-Hodgkin lymphoma in early life: A Swedish national cohort study. J. Natl. Cancer Inst. 2012, 104, 923–930. [Google Scholar] [CrossRef] [PubMed]
  15. Crump, C.; Sundquist, K.; Sieh, W.; Winkleby, M.A.; Sundquist, J. Perinatal and family risk factors for Hodgkin lymphoma in childhood through young adulthood. Am. J. Epidemiol. 2012, 176, 1147–1158. [Google Scholar] [CrossRef] [PubMed]
  16. Cogliano, V.J.; Baan, R.; Straif, K.; Grosse, Y.; Lauby-Secretan, B.; El Ghissassi, F.; Bouvard, V.; Benbrahim-Tallaa, L.; Guha, N.; Freeman, C.; et al. Preventable exposures associated with human cancers. J. Natl. Cancer Inst. 2011, 103, 1827–1839. [Google Scholar] [CrossRef] [PubMed]
  17. Darby, S.; Hill, D.; Doll, R. Radon: A likely carcinogen at all exposures. Ann. Oncol. 2001, 12, 1341–1351. [Google Scholar] [CrossRef] [PubMed]
  18. Zielinski, J.M.; Carr, Z.; Krewski, D.; Repacholi, M. World health organization’s international radon project. J. Toxicol. Environ. Health Part A 2006, 69, 759–769. [Google Scholar] [CrossRef] [PubMed]
  19. Kreuzer, M.; Grosche, B.; Schnelzer, M.; Tschense, A.; Dufey, F.; Walsh, L. Radon and risk of death from cancer and cardiovascular diseases in the German uranium miners cohort study: Follow-up 1946–2003. Radiat. Environ. Biophys. 2010, 49, 177–185. [Google Scholar] [CrossRef] [PubMed]
  20. William Field, R.; Krewski, D.; Lubin, J.H.; Zielinski, J.M.; Alavanja, M.; Catalan, V.S.; Klotz, J.B.; Létourneau, E.G.; Lynch, C.F.; Lyon, J.L.; et al. An overview of the North American residential radon and lung cancer case-control studies. J. Toxicol. Environ. Health Part A 2006, 69, 599–631. [Google Scholar] [CrossRef] [PubMed]
  21. Bräuner, E.V.; Andersen, Z.J.; Andersen, C.E.; Pedersen, C.; Gravesen, P.; Ulbak, K.; Hertel, O.; Loft, S.; Raaschou-Nielsen, O. Residential radon and brain tumour incidence in a Danish cohort. PLoS ONE 2013, 8. [Google Scholar] [CrossRef] [PubMed]
  22. Robertson, A.; Allen, J.; Laney, R.; Curnow, A. The cellular and molecular carcinogenic effects of radon exposure: A review. Int. J. Mol. Sci. 2013, 14, 14024–14063. [Google Scholar] [CrossRef] [PubMed] [Green Version]
  23. Darby, S.H.D.; Deo, H.; Auvinen, A.; Barros-Dios, J.M.; Baysson, H.; Bochicchio, F.; Falk, R.; Farchi, S.; Figueiras, A.; Hakama, M.; et al. Residential radon and lung cancer—Detailed results of a collaborative analysis of individual data on 7148 persons with lung cancer and 14,208 persons without lung cancer from 13 epidemiologic studies in Europe. Scand. J. Work Environ. Health 2006, 32, 1–84. [Google Scholar] [PubMed]
  24. Krewski, D.; Lubin, J.H.; Zielinski, J.M.; Alavanja, M.; Catalan, V.S.; William Field, R.; Klotz, J.B.; Létourneau, E.G.; Lynch, C.F.; Lyon, J.L.; et al. A combined analysis of North American case-control studies of residential radon and lung cancer. J. Toxicol. Environ. Health Part A 2006, 69, 533–597. [Google Scholar] [CrossRef] [PubMed]
  25. Nezahat, H.; Colin, R.M.; Francesco, B.; Richard, G.E.H. Calculation of lifetime lung cancer risks associated with radon exposure, based on various models and exposure scenarios. J. Radiol. Prot. 2015, 35, 539–555. [Google Scholar]
  26. Tong, J.; Qin, L.; Cao, Y.; Li, J.; Zhang, J.; Nie, J.; An, Y. Environmental radon exposure and childhood leukemia. J. Toxicol. Environ. Health Part B 2012, 15, 332–347. [Google Scholar] [CrossRef] [PubMed]
  27. Wakefield, M.; Kohler, J.A. Indoor radon and childhood cancer. Lancet 1991, 338, 1537–1538. [Google Scholar] [CrossRef]
  28. Raaschou-Nielsen, O. Indoor radon and childhood leukaemia. Radiat. Prot. Dosim. 2008, 132, 175–181. [Google Scholar] [CrossRef] [PubMed]
  29. Neuberger, J.S.; Gesell, T.F. Childhood cancers, radon, and γ radiations. Lancet 2002, 360, 1437–1438. [Google Scholar] [CrossRef]
  30. Raaschou-Nielsen, O.; Andersen, C.E.; Andersen, H.P.; Gravesen, P.; Lind, M.; Schüz, J.; Ulbak, K. Domestic radon and childhood cancer in Denmark. Epidemiology 2008, 19, 536–543. [Google Scholar] [PubMed]
  31. Henshaw, D.L.; Eatough, J.P.; Richardson, R.B. Radon as a causative factor in induction of myeloid leukaemia and other cancers. Lancet 1990, 335, 1008–1012. [Google Scholar] [CrossRef]
  32. NRC (National Research Council). Health Risks from Exposure to Low Levels of Ionizing Radiation; Beir VII Phase 2; NRC, National Academies Press: Washington, DC, USA, 2006. [Google Scholar]
  33. Zablotska, L.B.; Lane, R.S.D.; Frost, S.E.; Thompson, P.A. Leukemia, lymphoma and multiple myeloma mortality (1950–1999) and incidence (1969–1999) in the Eldorado uranium workers cohort. Environ. Res. 2014, 130, 43–50. [Google Scholar] [CrossRef] [PubMed]
  34. Smith, G.J.C.; Browning, T.; Ransom, S. Final Report of the Texas Indoor Radon Survey; Texas Department of Health: Austin, TX, USA, 1994. [Google Scholar]
  35. Langlois, P.H.; Lee, M.; Lupo, P.J.; Rahbar, M.H.; Cortez, R.K. Residential radon and birth defects: A population-based assessment. Birth Defects Res. Part A: Clin. Mol. Teratol. 2015. [Google Scholar] [CrossRef] [PubMed]
  36. Texas Cancer Registry, Cancer Epidemiology and Surveillance Branch, Texas Department of State Health Services. The Source of Cancer Data in Texas. Published 2015. Avaliable online: http://www.dshs.state.tx.us/tcr/default.shtm. (accessed on 5 May 2015).
  37. Steliarova-Foucher, E.S.C.; Lacour, B.; Kaatsch, P. International classification of childhood cancer, third edition. Cancer 2005, 103, 1457–1467. [Google Scholar] [CrossRef] [PubMed]
  38. Gardner, W.; Mulvey, E.P.; Shaw, E.C. Regression analyses of counts and rates: Poisson, overdispersed poisson, and negative binomial models. Psychol. Bull. 1995, 118, 392–404. [Google Scholar] [CrossRef] [PubMed]
  39. Hayat, M.J.; Higgins, M. Understanding poisson regression. J. Nurs. Educ. 2014, 53, 207–215. [Google Scholar] [CrossRef] [PubMed]
  40. Coxe, S.; West, S.G.; Aiken, L.S. The analysis of count data: A gentle introduction to poisson regression and its alternatives. J. Personal. Assess. 2009, 91, 121–136. [Google Scholar] [CrossRef] [PubMed]
  41. Brown, A.L.; Wilkinson, M.L.; Poston, W.S.C.; Keith Haddock, C.; Jahnke, S.A.; Sue Day, R. Adiposity predicts self-reported frequency of poor health days among male firefighters. J. Occup. Environ. Med. 2014, 56, 667–672. [Google Scholar] [CrossRef] [PubMed]
  42. Evrard, A.S.; Hémon, D.; Billon, S.; Laurier, D.; Jougla, E.; Tirmarche, M.; Clavel, J. Ecological association between indoor radon concentration and childhood leukaemia incidence in France, 1990–1998. Eur. J. Cancer Prev. 2005, 14, 147–157. [Google Scholar] [CrossRef] [PubMed]
  43. George, A.C. The history, development and the present status of the radon measurement programme in the United States of America. Radiat. Prot. Dosim. 2015. [Google Scholar] [CrossRef] [PubMed]
  44. Vogiannis, E.G.; Nikolopoulos, D. Radon sources and associated risk in terms of exposure and dose. Front. Public Health 2015, 2. [Google Scholar] [CrossRef] [PubMed]
  45. Casey, J.A.; Ogburn, E.L.; Rasmussen, S.G.; Irving, J.K.; Pollak, J.; Locke, P.A.; Schwartz, B.S. Predictors of indoor radon concentrations in Pennsylvania, 1989–2013. Environ. Health Perspect. 2015. [Google Scholar] [CrossRef] [PubMed]
  46. Hendry, J.H.; Simon, S.L.; Wojcik, A.; Sohrabi, M.; Burkart, W.; Cardis, E.; Laurier, D.; Tirmarche, M.; Hayata, I. Human exposure to high natural background radiation: What can it teach us about radiation risks? J. Radiol. Prot. 2009, 29, A29–A42. [Google Scholar] [CrossRef] [PubMed]
  47. Sam, K.; John, R.D.; Carolyn, H.; Moiz, M.; Oscar, T.; David, W.W.; Gary, L.D.; Mario, C.; Barber, L.E. Toxicological Profile for Radon. U.S. Department of Health and Human Services, P.H.S., Agency for Toxic Substances and Disease Registry; Agency for Toxic Substances and Disease Registry (US): Atlanta, GA, USA, 2012. [Google Scholar]
  48. Al-Zoughool, M.; Krewski, D. Health effects of radon: A review of the literature. Int. J. Radiat. Biol. 2009, 85, 57–69. [Google Scholar] [CrossRef] [PubMed]
  49. Darby, S.; Hill, D.; Auvinen, A.; Barros-Dios, J.M.; Baysson, H.; Bochicchio, F.; Deo, H.; Falk, R.; Forastiere, F.; Hakama, M.; et al. Radon in homes and risk of lung cancer: Collaborative analysis of individual data from 13 European case-control studies. BMJ 2005, 330. [Google Scholar] [CrossRef] [PubMed]
  50. Ruano-Ravina, A.; Pereyra, M.F.; Castro, M.T.; Pérez-Ríos, M.; Abal-Arca, J.; Barros-Dios, J.M. Genetic susceptibility, residential radon, and lung cancer in a radon prone area. J. Thorac. Oncol. 2014, 9, 1073–1080. [Google Scholar] [CrossRef] [PubMed]
  51. Torres-Durán, M.; Ruano-Ravina, A.; Parente-Lamelas, I.; Leiro-Fernández, V.; Abal-Arca, J.; Montero-Martínez, C.; Pena-Álvarez, C.; Castro-Añón, O.; Golpe-Gómez, A.; Martínez, C.; et al. Residential radon and lung cancer characteristics in never smokers. Int. J. Radiat. Biol. 2015. [Google Scholar] [CrossRef] [PubMed]
  52. Axelsson, G.; Andersson, E.; Barregard, L. Lung cancer risk from radon exposure in dwellings in Sweden: How many cases can be prevented if radon levels are lowered? Cancer Causes Control 2015, 26, 541–547. [Google Scholar] [CrossRef] [PubMed]
  53. Hauri, D.; Spycher, B.; Huss, A.; Zimmermann, F.; Grotzer, M.; von der Weid, N.; Weber, D.; Spoerri, A.; Kuehni, C.; Röösli, M.; et al. Domestic radon exposure and risk of childhood cancer: A prospective census-based cohort study. Environ. Health Perspect. 2013, 121, 1239–1244. [Google Scholar] [CrossRef] [PubMed] [Green Version]
  54. Řeřicha, V.; Kulich, M.; Řeřicha, R.; Shore, D.L.; Sandler, D.P. Incidence of leukemia, lymphoma, and multiple myeloma in Czech uranium miners: A case-cohort study. Environ. Health Perspect. 2006, 114, 818–822. [Google Scholar] [CrossRef] [PubMed]
  55. Rothman, K.J.; Mosquin, P.L. Sparse-data bias accompanying overly fine stratification in an analysis of beryllium exposure and lung cancer risk. Ann. Epidemiol. 2013, 23, 43–48. [Google Scholar] [CrossRef] [PubMed]
  56. Barros-Dios, J.M.; Ruano-Ravina, A.; Gastelu-Iturri, J.; Figueiras, A. Factors underlying residential radon concentration: Results from Galicia, Spain. Environ. Res. 2007, 103, 185–190. [Google Scholar] [CrossRef] [PubMed]
  57. Wakefield, J.; Elliott, P. Issues in the statistical analysis of small area health data. Stat. Med. 1999, 18, 2377–2399. [Google Scholar] [CrossRef]
  58. Muirhead, C.R.; Butland, B.K.; Green, B.M.R.; Draper, G.J. An analysis of childhood leukaemia and natural radiation in Britain. Radiat. Prot. Dosim. 1992, 45, 657–660. [Google Scholar]
  59. Collman, G.W.; Loomis, D.P.; Sandler, D.P. Childhood cancer mortality and radon concentration in drinking water in North Carolina. Br. J. Cancer 1991, 63, 626–629. [Google Scholar] [CrossRef] [PubMed]
  60. Hoffman, W.K.; Schmitz-Feuerhake, I. Radium-226-contaminated drinking water: Hypothesis on an exposure pathway in a population with elevated childhood leukemia. Environ. Health Perspect. Suppl. 1993, 101, 113–115. [Google Scholar] [CrossRef]
  61. Kohli, S.N.B.H.; Löfman, O. Childhood leukaemia in areas with different radon levels: A spatial and temporal analysis using GIS. J. Epidemiol. Community Health 2000, 54, 822–826. [Google Scholar] [CrossRef] [PubMed]
  62. Thorne, R.F.N.; Mott, M.G. Radon in Devon and Cornwall and paediatric malignancies. Eur. J. Cancer 32A, 282–285. [CrossRef]
  63. Butland, B.K.; Muirhead, C.R.; Draper, G.J. Letters to the Editor: Radon and leukaemia. Lancet 1990, 335, 1338–1339. [Google Scholar]
  64. Whitworth, K.W.; Symanski, E.; Coker, A.L. Childhood lymphohematopoietic cancer incidence and hazardous air pollutants in southeast Texas, 1995–2004. Environ. Health Perspect. 2008, 116, 1576–1580. [Google Scholar] [CrossRef] [PubMed]
  65. Heck, J.E.; Wu, J.; Lombardi, C.; Qiu, J.; Meyers, T.J.; Wilhelm, M.; Cockburn, M.; Ritz, B. Childhood cancer and traffic-related air pollution exposure in pregnancy and early life. Environ. Health Perspect. 2013, 121, 1385–1391. [Google Scholar] [CrossRef] [PubMed]
  66. Danysh, H.E.; Mitchell, L.E.; Zhang, K.; Scheurer, M.E.; Lupo, P.J. Traffic-related air pollution and the incidence of childhood central nervous system tumors: Texas, 2001–2009. Pediatr. Blood Cancer 2015, 62, 1572–1578. [Google Scholar] [CrossRef] [PubMed]
  67. Scheurer, M.; Danysh, H.; Follen, M.; Lupo, P. Association of traffic-related hazardous air pollutants and cervical dysplasia in an urban multiethnic population: A cross-sectional study. Environ. Health 2014, 13, 52. [Google Scholar] [CrossRef] [PubMed]
  68. Urayama, K.Y.; von Behren, J.; Reynolds, P.; Hertz, A.; Does, M.; Buffler, P.A. Factors associated with residential mobility in children with leukemia: Implications for assigning exposures. Ann. Epidemiol. 2009, 19, 834–840. [Google Scholar] [CrossRef] [PubMed]
  69. Lupo, P.J.; Symanski, E.; Chan, W.; Mitchell, L.E.; Waller, D.K.; Canfield, M.A.; Langlois, P.H. Differences in exposure assignment between conception and delivery: The impact of maternal mobility. Paediatr. Perinat. Epidemiol. 2010, 24, 200–208. [Google Scholar] [CrossRef] [PubMed]
  70. Canfield, M.A.; Ramadhani, T.A.; Langlois, P.H.; Waller, D.K. Residential mobility patterns and exposure misclassification in epidemiologic studies of birth defects. J. Expos. Sci. Environ. Epidemiol. 2006, 16, 538–543. [Google Scholar] [CrossRef] [PubMed]
  71. Rahman, N.M.; Tracy, B.L. Radon control systems in existing and new construction: A review. Radiat. Prot. Dosim. 2009, 135, 243–255. [Google Scholar] [CrossRef] [PubMed]
  72. Korhonen, P.; Halonen, R.; Kalliokoski, P.; Kokotti, H. Indoor radon concentrations caused by construction materials in 23 workplaces. Sci. Total Environ. 2001, 272, 143–145. [Google Scholar] [CrossRef]
  73. Keller, G.; Hoffmann, B.; Feigenspan, T. Radon permeability and radon exhalation of building materials. Sci. Total Environ. 2001, 272, 85–89. [Google Scholar] [CrossRef]
  74. Meinert, R.; Schüz, J.; Kaletsch, U.; Kaatsch, P.; Michaelis, J. Leukemia and non-Hodgkin’s lymphoma in childhood and exposure to pesticides: Results of a register-based case-control study in Germany. Am. J. Epidemiol. 2000, 151, 639–646. [Google Scholar] [CrossRef] [PubMed]
  75. Meinert, R.; Kaletsch, U.; Kaatsch, P.; Schüz, J.; Michaelis, J. Associations between childhood cancer and ionizing radiation: Results of a population-based case-control study in Germany. Cancer Epidemiol. Biomark. Prev. 1999, 8, 793–799. [Google Scholar]
  76. Spycher BD, L.J.; Zwahlen, M.; Röösli, M.; Niggli, F.; Grotzer, M.A.; Rischewski, J.; Egger, M.; Kuehni, C.E.; Swiss Pediatric Oncology Group; Swiss National Cohort Study Group. Background ionizing radiation and the risk of childhood cancer: A census-based nationwide cohort study. Environ. Health Perspect. 2015, 123, 622–628. [Google Scholar] [CrossRef] [PubMed]
  77. Allen, C.E.; Kelly, K.M.; Bollard, C.M. Pediatric lymphomas and histiocytic disorders of childhood. Pediatr. Clin. N. Am. 2015, 62, 139–165. [Google Scholar] [CrossRef] [PubMed]
  78. Diggle, P.; Elliott, P. Disease risk near point sources: Statistical issues for analyses using individual or spatially aggregated data. J. Epidemiol. Community Health 1995, 49, S20–S27. [Google Scholar] [CrossRef] [PubMed]
  79. Krieger, N.; Chen, J.T.; Waterman, P.D.; Rehkopf, D.H.; Subramanian, S.V. Painting a truer picture of us socioeconomic and racial/ethnic health inequalities: The public health disparities geocoding project. Am. J. Public Health 2005, 95, 312–323. [Google Scholar] [CrossRef] [PubMed]
  80. Yasui, Y.; Liu, Y.; Neglia, J.P.; Friedman, D.L.; Bhatia, S.; Meadows, A.T.; Diller, L.R.; Mertens, A.C.; Whitton, J.; Robison, L.L. A methodological issue in the analysis of second-primary cancer incidence in long-term survivors of childhood cancers. Am. J. Epidemiol. 2003, 158, 1108–1113. [Google Scholar] [CrossRef] [PubMed]
  81. Perez-Andreu, V.; Roberts, K.G.; Xu, H.; Smith, C.; Zhang, H.; Yang, W.; Harvey, R.C.; Payne-Turner, D.; Devidas, M.; Cheng, I.-M.; et al. A genome-wide association study of susceptibility to acute lymphoblastic leukemia in adolescents and young adults. Blood 2015, 125, 680–686. [Google Scholar] [CrossRef] [PubMed]
  82. Sultan, I.; Casanova, M.; Ferrari, A.; Rihani, R.; Rodriguez-Galindo, C. Differential features of nasopharyngeal carcinoma in children and adults: A seer study. Pediatr. Blood Cancer 2010, 55, 279–284. [Google Scholar] [CrossRef] [PubMed]
  83. Hudson, T.J. Cancer genome variation in children, adolescents, and young adults. Cancer 2011, 117, 2262–2267. [Google Scholar] [CrossRef] [PubMed]

