
Local Sustainability and Gender Ratio: Evaluating the Impacts of Mining and Tourism on Sustainable Development in Yunnan, China


Abstract
:1. Introduction
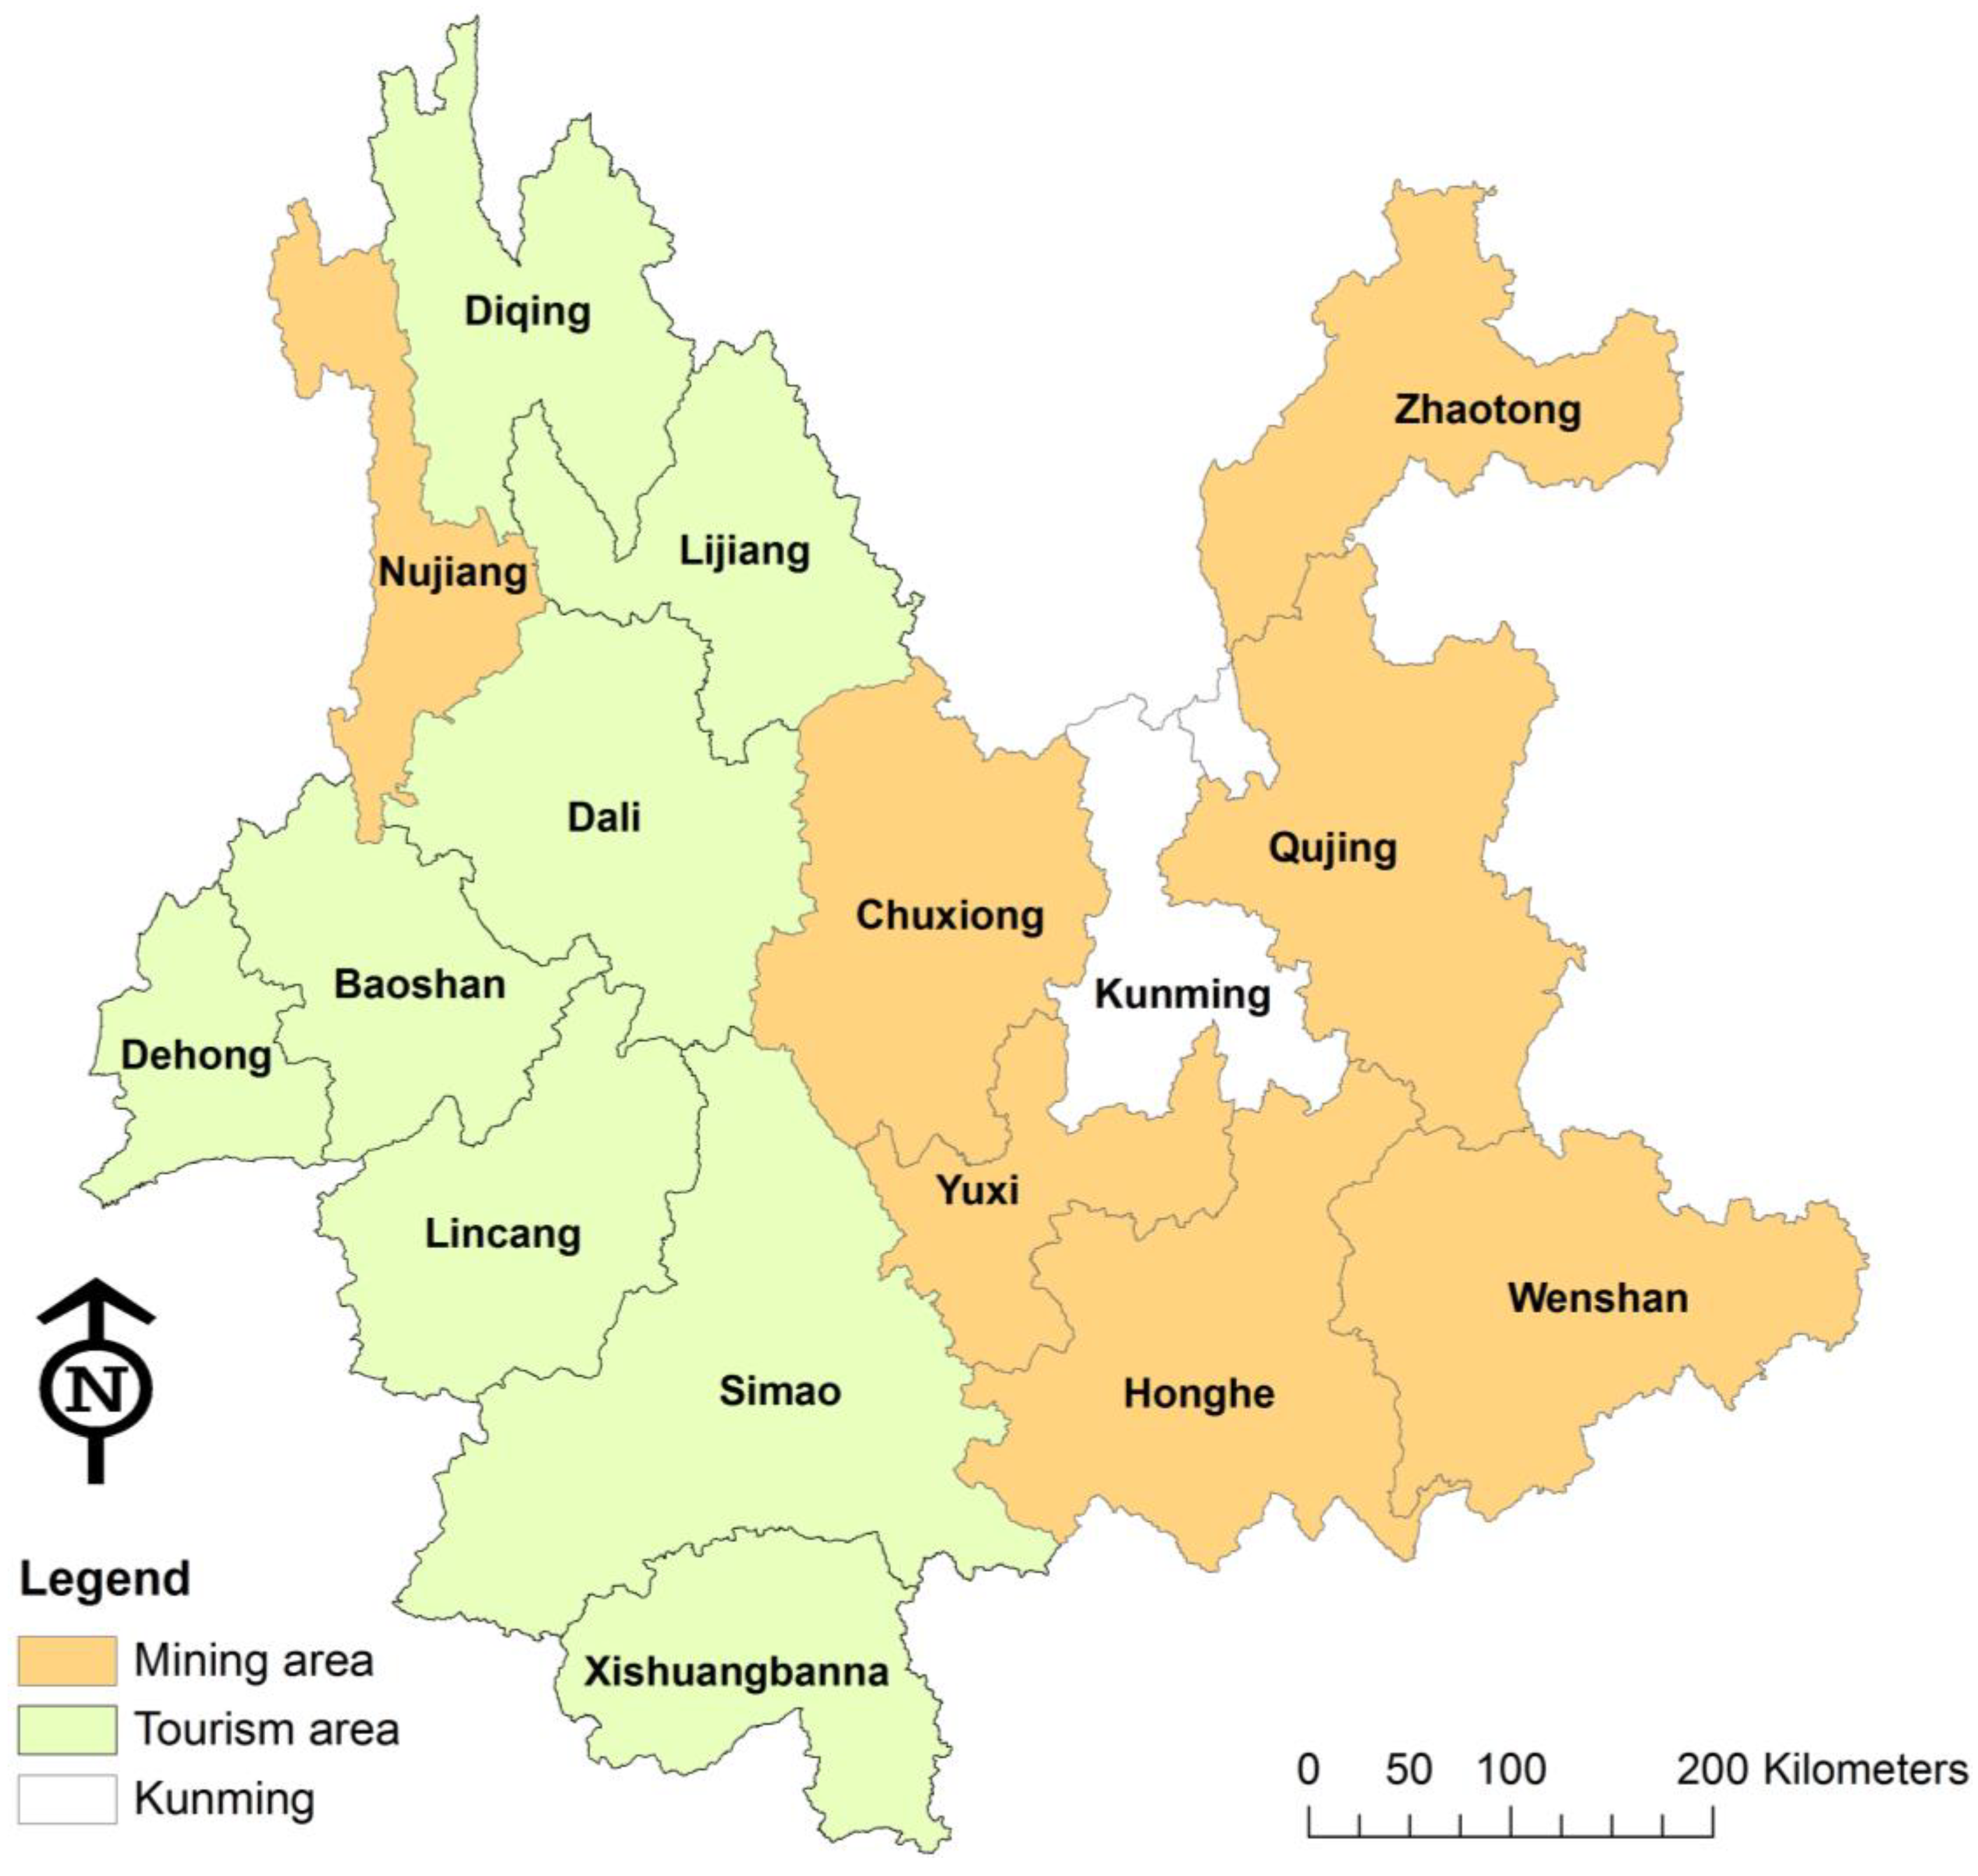
2. Study Site
3. Method
3.1. Data
3.1.1. Economic Status
3.1.2. Social Development
3.1.3. Environmental Status
3.1.4. Temporal Dimension of Data and Time-Series Analysis

| Item | Prefecture | Source | Year 1 | Year 2 |
|---|---|---|---|---|
| Economic Development | GDP per capita | [21] | 1999 | 2005 |
| Pct Poor Counties | [24] | 2005 | ||
| Environmental Status | Prefecture ecological index | [28] | 1999 | |
| Water quality index | [29] | 2005 | ||
| Forest coverage | [29] | 1998 | ||
| Social Development | Pct villages having access to major roads | [21] | 1999 | 2005 |
| Pct villages having access to pipe water | [21] | 1999 | 2005 | |
| Gender ratio | [21] | 1999 | 2005 |
3.2. Data Analyses
4. Results
| Item | Leading Industry | 1999 | 2005 | Change |
|---|---|---|---|---|
| GDP per capita | Mining areas | 4597.39 | 7307.42 | 58.95% |
| Tourism areas | 3119.239 | 5619.44 | 80.15% | |
| Pct Poor Counties | Mining areas | -- | 37.33 | -- |
| Tourism areas | -- | 47.88 | -- | |
| Pct villages having access to major roads | Mining areas | 89.20 | 97.60 | 8.40% |
| Tourism areas | 92.51 | 98.23 | 5.72% | |
| Pct villages having access to pipe water | Mining areas | 69.15 | 87.10 | 17.95% |
| Tourism areas | 76.98 | 91.53 | 14.55% | |
| Gender ratio | Mining areas | 0.9355 | 0.9346 | 0.09% |
| Tourism areas | 0.9515 | 0.9533 | −0.19% | |
| Prefecture ecological index | Mining areas | 446.78 | -- | -- |
| Tourism areas | 535.43 | -- | -- | |
| River water quality index | Mining areas | -- | 3.48 | -- |
| Tourism areas | -- | 3.25 | -- | |
| Forest coverage | Mining areas | 17.78 | -- | -- |
| Tourism areas | 13.53 | -- | -- |
| Item | Prefecture | 1999 | 2005 |
|---|---|---|---|
| Economic Development | GDP per capita | 0.386 | 0.507 |
| Pct Poor Counties | na | 0.196 | |
| Environmental Status | Prefecture ecological index | 0.208 | na |
| Water quality index | na | 0.418 | |
| Forest coverage | 0.270 | na | |
| Social Development | Pct villages having access to major roads | 0.614 | 0.270 |
| Pct villages having access to pipe water | 0.299 | 0.633 | |
| Gender ratio | 0.222 | 0.092 * |
5. Discussion
5.1. Impacts from Mining and Tourism Industries
5.2. Advantages and Limitations of the Evaluation Method
6. Conclusions
Acknowledgments
Author Contributions
Conflicts of Interest
References
- Bruntland, G. Our Common Future: The World Commission on Environment and Development; Oxford University Press: Oxford, UK, 1987. [Google Scholar]
- Bond, R.; Curran, J.; Kirkpatrick, C.; Lee, N.; Francis, P. Integrated impact assessment for sustainable development: A case study approach. World Dev. 2001, 29, 1011–1024. [Google Scholar] [CrossRef]
- Lele, S.M. Sustainable development: A critical review. World Dev. 1991, 19, 607–621. [Google Scholar] [CrossRef]
- Mog, J.M. Struggling with sustainability—A comparative framework for evaluating sustainable development programs. World Dev. 2004, 32, 2139–2160. [Google Scholar] [CrossRef]
- Organisation for Economic Co-operation and Development (OECD). Frameworks to Measure Sustainable Development: An OECD Expert Workshop; OECD: Paris, France, 2000. [Google Scholar]
- United Nations (UN). Indicators of Sustainable Development: Guidelines and Methodologies, 2nd ed.; UN: New York, NY, USA, 2001. [Google Scholar]
- Volkery, A.; Swanson, D.; Jacob, K.; Bregha, F.; Pinter, L. Coordination, challenges, and innovations in 19 national sustainable development strategies. World Dev. 2006, 34, 2047–2063. [Google Scholar] [CrossRef]
- Wahlström, M. Progress and challenges in global disaster reduction. Int. J. Disaster Risk Sci. 2013, 4, 48–50. [Google Scholar] [CrossRef]
- Pretty, J.N. Participatory learning for sustainable agriculture. World Dev. 1995, 23, 1247–1263. [Google Scholar] [CrossRef]
- Tolba, M.K. The Premises for Building a Sustainable Society—Address to the World Commission on Environment and Development; United Nations Environment Programme: Nairobi, Kenya, 1984. [Google Scholar]
- Angelsen, A.; Fjeldstad, O.; Sumaila, U.R. Project Appraisal and Sustainability in Less Developed Countries; Chr. Michelsen Institute: Bergen, Norway, 1994. [Google Scholar]
- Uphoff, N.; Esman, M.J.; Krishna, A. Reasons for Success: Learning from Instructive Experiences in Rural Development; Kumarian Press: West Hartford, CT, USA, 1998. [Google Scholar]
- The World Bank. Sustainable Development in a Dynamic World: Transforming Institutions, Growth, and Quality of Life; World Bank and Oxford University Press: Washington, DC, USA, 2003. [Google Scholar]
- Flora, C.B. Interactions between Agro-Ecosystems and Rural Communities; CRC Press: Boca Raton, FL, USA, 2001. [Google Scholar]
- Harrington, L. Sustainability in perspective: Strengths and limitations of farming systems research in contributing to a sustainable agriculture. J. Sustain. Agric. 1995, 5, 41–59. [Google Scholar] [CrossRef]
- Van Pelt, M.J.F. Ecological Sustainability and Project Appraisal: Case Studies in Developing Countries; Avebury: Aldershot, UK, 1993. [Google Scholar]
- Bell, S.; Morse, S. Measuring Sustainability: Learning by Doing; Earthscan Publications Ltd.: Sterling, VA, USA, 2003. [Google Scholar]
- United Nations (UN). Agenda for Development; UN: New York, NY, USA, 1997. [Google Scholar]
- Ali, S.H. Treasures of the Earth: Need, Greed and a Sustainable Future; Yale University Press: New Haven, CT, USA, 2010. [Google Scholar]
- Rolston, J.S. Mining Coal and Undermining Gender: Rhythms of Work and Family in the American West; Rutgers University Press: New Brunswick, NJ, USA, 2014. [Google Scholar]
- Yunnan Statistics Bureau. Yunnan Statistical Yearbook 1990–2006; Statistics Press: Beijing, China, 1991–2007. [Google Scholar]
- Yunnan Tourism Administration. Yunnan Yearbook of Tourism; DM Press: Yunnan, China, 2004. [Google Scholar]
- Huang, G.; Zhou, W.; Ali, S. Spatial patterns and economic contributions of mining and tourism in biodiversity hotspots: A case study in China. Ecol. Econ. 2011, 70, 1492–1498. [Google Scholar]
- List of National Poor Counties in Yunnan. Available online: http://www.ynfp.cn (accessed on 30 April 2006).
- Costanza, R.; Fisher, B.; Ali, S.; Beer, C.; Bond, L.; Boumans, R. Quality of life: An approach integrating opportunities, human needs, and subjective well-being. Ecol. Econ. 2007, 61, 267–276. [Google Scholar]
- Das Gupta, M.; Li, S. Gender Bias in China, The Republic Of Korea, And India 1920–90—Effects Of War, Famine, and Fertility Decline; Policy Research Working Paper Series 2140; The World Bank: Washington, DC, USA, 1999. [Google Scholar]
- Sen, A. More than 100 Million Women Are Missing; New York Review of Books: New York, NY, USA , 1990. [Google Scholar]
- Yang, S.; Huang, S.; Ou, X.; Yu, C.; Yang, H. Research on the ecologically integrated appraisal on Yunnan Province in China. J. Yunnan Univ. 1999, 21, 124–126. (In Chinese) [Google Scholar]
- Map of Current and Future Water Quality in Yunnan. Available online: http://ynepb1.yn.gov.cn/document/imap2/index.html (accessed on 30 April 2006).
- Regulation of Surface Water Environmental Quality Assessment. Available online: http://www.cnemc.cn (accessed on 15 January 2007).
- Chinese Natural Resources, Environment, Economic and Population Database. Available online: http://www.naturalresources.csdb.cn (accessed on 30 April 2006).
- Shen, L.; Gunson, A.J. The role of artisanal and small-scale mining in China’s economy. J. Clean. Prod. 2006, 14, 427–435. [Google Scholar] [CrossRef]
- Krugman, P. The narrow moving band, the Dutch disease, and the competitive consequences of Mrs. Thatcher: Notes on trade in the presence of dynamic scale economies. J. Dev. Econ. 1987, 27, 41–55. [Google Scholar]
- Sachs, J.; Warner, A. The curse of natural resources. Eur. Econ. Rev. 2001, 45, 827–838. [Google Scholar] [CrossRef]
- Sustainable Tourism and Poverty Elimination Study: A Report to the Department for International Development. Available online: http://www.propoortourism.info/documents/SustT1999.pdf (accessed on 15 January 2015).
- Qian, N. Missing women and the price of tea in China: The effect of sex-specific earnings on sex imbalance. Q. J. Econ. 2005, 123, 1251–1285. [Google Scholar]
© 2015 by the authors; licensee MDPI, Basel, Switzerland. This article is an open access article distributed under the terms and conditions of the Creative Commons Attribution license (http://creativecommons.org/licenses/by/4.0/).
Share and Cite
Huang, G.; Ali, S. Local Sustainability and Gender Ratio: Evaluating the Impacts of Mining and Tourism on Sustainable Development in Yunnan, China. Int. J. Environ. Res. Public Health 2015, 12, 927-939. https://doi.org/10.3390/ijerph120100927
Huang G, Ali S. Local Sustainability and Gender Ratio: Evaluating the Impacts of Mining and Tourism on Sustainable Development in Yunnan, China. International Journal of Environmental Research and Public Health. 2015; 12(1):927-939. https://doi.org/10.3390/ijerph120100927
Chicago/Turabian StyleHuang, Ganlin, and Saleem Ali. 2015. "Local Sustainability and Gender Ratio: Evaluating the Impacts of Mining and Tourism on Sustainable Development in Yunnan, China" International Journal of Environmental Research and Public Health 12, no. 1: 927-939. https://doi.org/10.3390/ijerph120100927