Article

The Impact of Water and Sanitation on Childhood Mortality in Nigeria: Evidence from Demographic and Health Surveys, 2003–2013

1
School of Medicine, University of Western Sydney, Locked Bag 1797, Penrith, NSW 2571, Australia
2
School of Science and Health, University of Western Sydney, Locked Bag 1797, Penrith, NSW 2571, Australia
3
Sydney School of Public Health, Edward Ford Building (A27), University of Sydney, Sydney, NSW 2006, Australia
4
School of Medicine and Public Health, Faculty of Health, University of Newcastle, Callaghan, NSW 2308, Australia
*
Author to whom correspondence should be addressed.
Int. J. Environ. Res. Public Health 2014, 11(9), 9256-9272; https://doi.org/10.3390/ijerph110909256
Submission received: 30 June 2014 / Revised: 13 August 2014 / Accepted: 29 August 2014 / Published: 5 September 2014

Abstract

:
In Nigeria, approximately 109 million and 66 million people lack access to sanitation facilities and water, respectively. This study aimed to determine whether children under 5 years old without access to improved water and sanitation facilities are at higher risk of death in Nigeria. Pooled 2003, 2008 and 2013 Nigeria Demographic and Health Survey data were used to examine the impact of water and sanitation on deaths of children aged 0–28 days, 1–11 months, and 12–59 months using Cox regression analysis. Survival information of 63,844 children was obtained, which included 6285 deaths of children under 5 years old; there were 2254 cases of neonatal mortality (0–28 days), 1859 cases of post-neonatal mortality (1–11 months) and 2,172 cases of child mortality (1–4 years old). Over a 10-year period, the odds of neonatal, post-neonatal and child deaths significantly reduced by 31%, 41% and 47% respectively. The risk of mortality from both unimproved water and sanitation was significantly higher by 38% (Adjusted hazard ratios (HR) = 1.38, 95% confidence interval (CI): 1.14–1.66) for post-neonatal mortality and 24% (HR = 1.24, 95% CI: 1.04–1.48) for child mortality. The risk of neonatal mortality increased by 6% (HR = 1.06, 95% CI: 0.85–1.23) but showed no significant effect. The Nigerian government needs to invest more in water and sanitation to reduce preventable child deaths.

1. Introduction

Access to unimproved water and sanitation among children under 5 years old is a serious public health problem in many developing countries, including Nigeria [1]. Globally, nearly a billion people still lack access to improved sources of drinking water, and about 2.5 billion lack improved sanitation [2]. Unimproved water and sanitation are major causes of diarrhoea, which globally accounts for approximately 1.4 million child deaths each year. The majority of these deaths occur in sub-Saharan Africa where nearly half the population lacks access to improved water and sanitation [3]. Children are more vulnerable to the health hazards associated with unimproved water supply and sanitation; their immune, respiratory, and digestive systems are still developing [4], and children play in areas where contaminants may accumulate [5].
The impact of unimproved water and sanitation as a leading cause of childhood diarrhoea has long been recognized and documented in the public health literature. In response to this, in the past two decades the Nigerian government has launched and implemented the National Water Supply and Sanitation Policy, Presidential Water Initiative, and National Economic Empowerment and Development Strategy [6,7]. Despite all these initiatives, a recent report on global progress on sanitation and drinking water indicates that approximately 109 million and 66 million people in Nigeria still lack access to basic sanitation facilities and improved drinking water, respectively [2].
Past studies have shown that access to improved water and sanitation leads to a reduction in childhood mortality as well as child diarrhoea [8,9]. A recent large cross-sectional study undertaken in 38 developing countries concluded that access to improved water and sanitation can reduce child mortality by approximately 20%, and each year prevent about 2.2 million deaths in children aged under 5 years old from low-income and middle-income countries, excluding China [10].
The number of people with access to improved water and sanitation in Nigeria is very low, particularly in rural areas (48% for water and 28% for sanitation) [11], and could be one of the reasons why Nigeria still has the highest reported number of childhood deaths in Africa [12]. Each year in Nigeria, approximately 150,000 children under 5 years old, die from diarrhoea [13]. Therefore, a detailed understanding of the impact of water and sanitation on childhood mortality is needed to develop effective community mobilisation interventions aimed at reducing unimproved water and sanitation related deaths. Hence, this study aimed to use pooled data from the 2003, 2008 and 2013 Nigeria Demographic and Health Surveys (NDHS) to examine whether children under 5 years old without access to improved water sources and sanitation were at a greater risk of dying compared with children under 5 years old with access to improved water sources and sanitation. Specifically, we examined how well the combined effect of water and sanitation correlated with neonatal mortality (0–28 days), post-neonatal mortality (1–11 months), and child mortality (12–59 months).

2. Methods

2.1. Data Source

Data for this study were obtained from NDHS, which are available online with ethics approval from ICF International (Calverton, MD, USA). NDHS have been conducted in Nigeria approximately every 5 years old since 1990 by the National Population Commission (NPC) in conjunction with ORC Macro international, and are largely sponsored by the United States Agency for International Development (USAID). The NDHS program collects data nationally on a wide range of socio-demographic and health characteristics such as childhood mortality, childhood illnesses, birth history, sex, education, and maternal and child health by interviewing women and men of reproductive age 15–49 and 15–59 years old, respectively. The information gathered from interviewees is recorded in three separate questionnaires. A multi-stage, stratified, cluster random sampling method was used to gather the information. This method has been discussed in detail elsewhere [11,14,15].
The data for the study were from the 2003, 2008 and 2013 NDHS. In this pooled dataset, information was available from 79,953 married women aged 15–49 years old, consisting of 7620 women from the 2003 survey, 33,385 women from the 2008 survey, and 38,948 women from the 2013 survey. The analyses used survival information from 63,844 singleton live-born infants of the most recent birth of a mother within five years prior to the mother’s interview [11,14,15]. Only each mother’s most recent birth was used in the analyses because only these births had detailed information on the use of perinatal health services, and to limit the potential for differential recall of events from mothers who had delivered at very different durations prior to the interview. Participation in NDHS has always been high with an average individual response rate of more than 94% for the surveys examined.

2.2. Outcome Variables

The main outcome variables in the study were neonatal mortality (death between birth and 28 days), post-neonatal mortality (death between 1 month and 11 months), and child mortality (death between 12 and 59 months). The outcome variables took a binary form such that child death was considered a “success” (1 = if death occurred in the specified age periods) or “failure” (0 = if child was alive in the specified age periods).

2.3. Exposure Variables

The key exposure variables examined were the main source of water and type of sanitation (or toilet) facilities available to members of the households. In the merged data set, there were 12 different categories of water source and 11 different categories of sanitation facility available to household members. In the analysis, these categories were classified as improved and unimproved according to WHO/UNICEF guidelines (Table 1).
In the analysis, water source and sanitation facilities were classified into four categories: improved water and improved sanitation, improved water and unimproved sanitation, unimproved water and improved sanitation, and unimproved water and unimproved sanitation facilities. The primary aim was to examine whether the combined impact of unimproved water and sanitation was associated with childhood mortality.
Table 1. Classification of water sources and sanitation facilities based on WHO/UNICEF guidelines [2].
VariableImprovedUnimproved
Water sourcePiped water connection to household, public taps or standpipes, boreholes or tube wells, protected dug well, protected spring and rainwater collection.Unprotected dug well, unprotected spring, cart with small tank or drum, surface water (e.g., river, dam, lake, pond, stream, canal or irrigation channel) and bottled water.
Sanitation facilityPour-flush system, piped sewer system, septic tank, ventilated improved pit latrine (VIP) and pit latrine with slab.Pit latrine without slab, bucket, hanging toilet or latrine, no facilities, bush or field and shared or public facility.
Note: N.B. sanitation refers to toilet facility.

2.4. Potential Confounding Variables

The confounding variables considered in the analyses were based on previous literature on water, sanitation, and child survival [4,10,16,17,18]. These confounding variables were classified into two distinct groups: socioeconomic level factors, and demographic level factors. The socioeconomic variables examined consisted of place of residence (urban or rural areas), mother’s education, and mother’s work status. Other socioeconomic variables included were household wealth index, mother’s literacy level, and father’s level of education. The three demographic level factors assessed were mother’s age at child’s birth, perceived newborn size by the mother, and sex of child. Perceived newborn size at birth by mothers (small or very small, and average or large) was used instead of birth weight at birth because more than half of the newborns were not weighed at birth. This measure was a reasonable proxy because a previous study showed that there is a close relationship between mean birth weight and perceived newborn size by the mother [19].
A household wealth index was constructed using a principal component analysis (PCA) [20]. Weights were assigned to the household facilities and assets of respondents. The assets included were those that were consistent across the pooled NDHS data; these were radio, television, fridge, bicycle, motorcycle, car, telephone, electricity, and type of floor material used in rooms. In the NDHS data set, the household wealth index was categorized into five quintiles: poorest, poorer, middle, richer, and richest. However, in the analysis, the household wealth index was re-categorised into three groups. The bottom 40% of households was arbitrarily referred to as poor households, the next 40% as middle households, and the top 20% as rich households.

2.5. Statistical Analysis

Initially, a frequency tabulation of all the potential confounding variables was conducted by the year of survey to describe the data used in the study, followed by estimation of the mortality rates by combined water sources and sanitation facilities, using a similar method to that described by Rutstien and Rojas [21]. To examine the impact of combined water sources and sanitation facilities, a multivariable analysis was conducted using a Cox proportional hazard regression model.
For the multivariable model, a staged modelling technique was used. In the first stage, all the socioeconomic and demographic variables were entered into the baseline multivariable model to assess their relationship with the study outcomes. A stepwise backwards elimination process was conducted and variables that were significantly associated with the study outcomes at a 5% significance level were retained in the model (model 1).
In the second stage, water source was independently investigated with the socioeconomic and demographic variables that were significantly associated with the mortality outcomes, and those variables with p-values < 0.05 were retained (model 2). In the third stage, sanitation facility was independently examined with the socioeconomic and demographic variables that were significantly associated with the mortality outcomes. As before, those variables with p-values <0.05 were retained (model 3). In the final stage, a similar procedure was used for the combined exposure variables (water and sanitation), which were entered into model 1, and those variables with p-values <0.05 were retained in the final model (model 4).
The hazard ratios (HR) and their 95% confidence intervals obtained from the adjusted Cox proportional Hazard models were used to measure the impact of the combined effect of water sources and sanitation facilities on neonatal, post-neonatal, and child mortality. All analyses were conducted using “SVY” commands in STATA version 12.0 (Stata Corporation, College Station, TX, USA) to adjust for the cluster sampling survey design, weights, and calculate standard errors.

3. Results and Discussion

A weighted total of 63,844 most recent live births of children younger than 5 years old occurred within the 5 year period prior to the survey interview date, including 6285 deaths. Of these deaths, 2254 occurred between birth and 28 days (neonatal mortality), 1859 between 1 and 11 months (post-neonatal mortality) and 2172 between 1 and 4 years old (child mortality). Table 2 shows the distribution of the exposure and confounding variables by year of survey. Place of residence was nearly equally represented in the three study periods. The proportion of children whose mothers had secondary or higher education slightly increased from 24.5% in 2003 to 31.5% in 2013. Both male and female children were nearly equally represented in the three study periods, while the proportion of children whose mothers were from poor households decreased from 42.3% in 2003 to 33.6% in 2013. In 2003, approximately 60% of children under 5 years old lived in households having both unimproved water and sanitation, and this decreased to 27.8% in 2008, and was 27.5% in 2013.
The neonatal mortality rate (NMR) was found to be higher among newborns born to mothers in households with access to both unimproved water sources and unimproved sanitation facilities (NMR: 38.2 vs. 32.6). The post-neonatal mortality rate (PMR) in households with access to unimproved water sources and sanitation was greater than those with access to improved water and sanitation (PMR: 35.7 vs. 20.2). Similarly, the child mortality rate (CMR) for children aged 1–4 years old was higher in households with no access to both improved water sources and sanitation facilities (CMR: 40.8 vs. 23.9).
Table 2. The prevalence of singleton live birth of infants under 5 years old as reported by mothers interviewed during demographic and health surveys in Nigeria, 2003–2013 (n = 63,844).
VariableTotal Live Births% of Weighted Total ˟Prevalence ˟ by Survey (%)
Unweighted ʶ Weighted ˟200320082013
Household environmental factor
Water (n = 61,995)
Improved water31,53032,82151.435.450.455.4
Unimproved water30,53129,17445.762.947.740.6
Sanitation (n = 62,994)
Improved28,41630,08647.112.651.150.3
Unimproved34,51132,90851.685.847.048.9
Combined water and sanitation (n = 61,648)
Improved water, improved sanitation18,10619,68030.89.731.234.6
Improved water, unimproved sanitation13,29913,01320.425.718.820.7
Unimproved water, improved sanitation9420937014.72.919.113.1
Unimproved water, unimproved sanitation20,87819,58530.760.027.827.5
Socioeconomic factor
Residence type
Urban19,30520,47832.128.829.734.8
Rural44,55343,36667.971.270.365.2
Household wealth index
Poor25,24323,78337.342.340.233.6
Middle25,26225,56940.140.537.742.0
Rich13,35314,49222.717.222.124.3
Mother’s education
No education31,20330,94748.551.846.749.4
Primary13,87113,53921.223.623.019.1
Secondary or higher18,78419,35730.324.530.231.5
Mother’s literacy level (n = 63,532)
Cannot read at all38,90538,28360.063.959.459.7
Able to read24,66825,24939.635.840.139.8
Father’s education (n = 61,964)
No education24,63424,36538.239.737.138.8
Primary12,82512,84320.123.021.518.4
Secondary or higher24,43124,75638.834.038.240.2
Mother’s working status (n = 61,857)
Not working21,54421,28933.337.434.631.5
Working40,32840,56863.562.663.164.1
Demographic factor
Currently breastfeeding
Yes35,88535,69155.958.256.455.0
No27,97328,15344.141.843.645.0
Mother’s age ( years)
<20346034735.47.35.45.1
20–2930,82230,87048.451.648.247.8
30–3923,03523,13636.232.636.137.1
40–496541636610.08.610.310.0
Sex of child
Female31,38531,49149.348.849.149.6
Male32,47332,35350.751.250.950.4
Mother’s perceived baby size (n = 62,563)
Small or very small9107902314.114.213.814.4
Average or larger53,44853,54083.984.583.983.7
Notes: ʶ The total unweighted number varies between categories because of some missing values. ˟ Weighting was applied to compensate for the multistage sampling design.

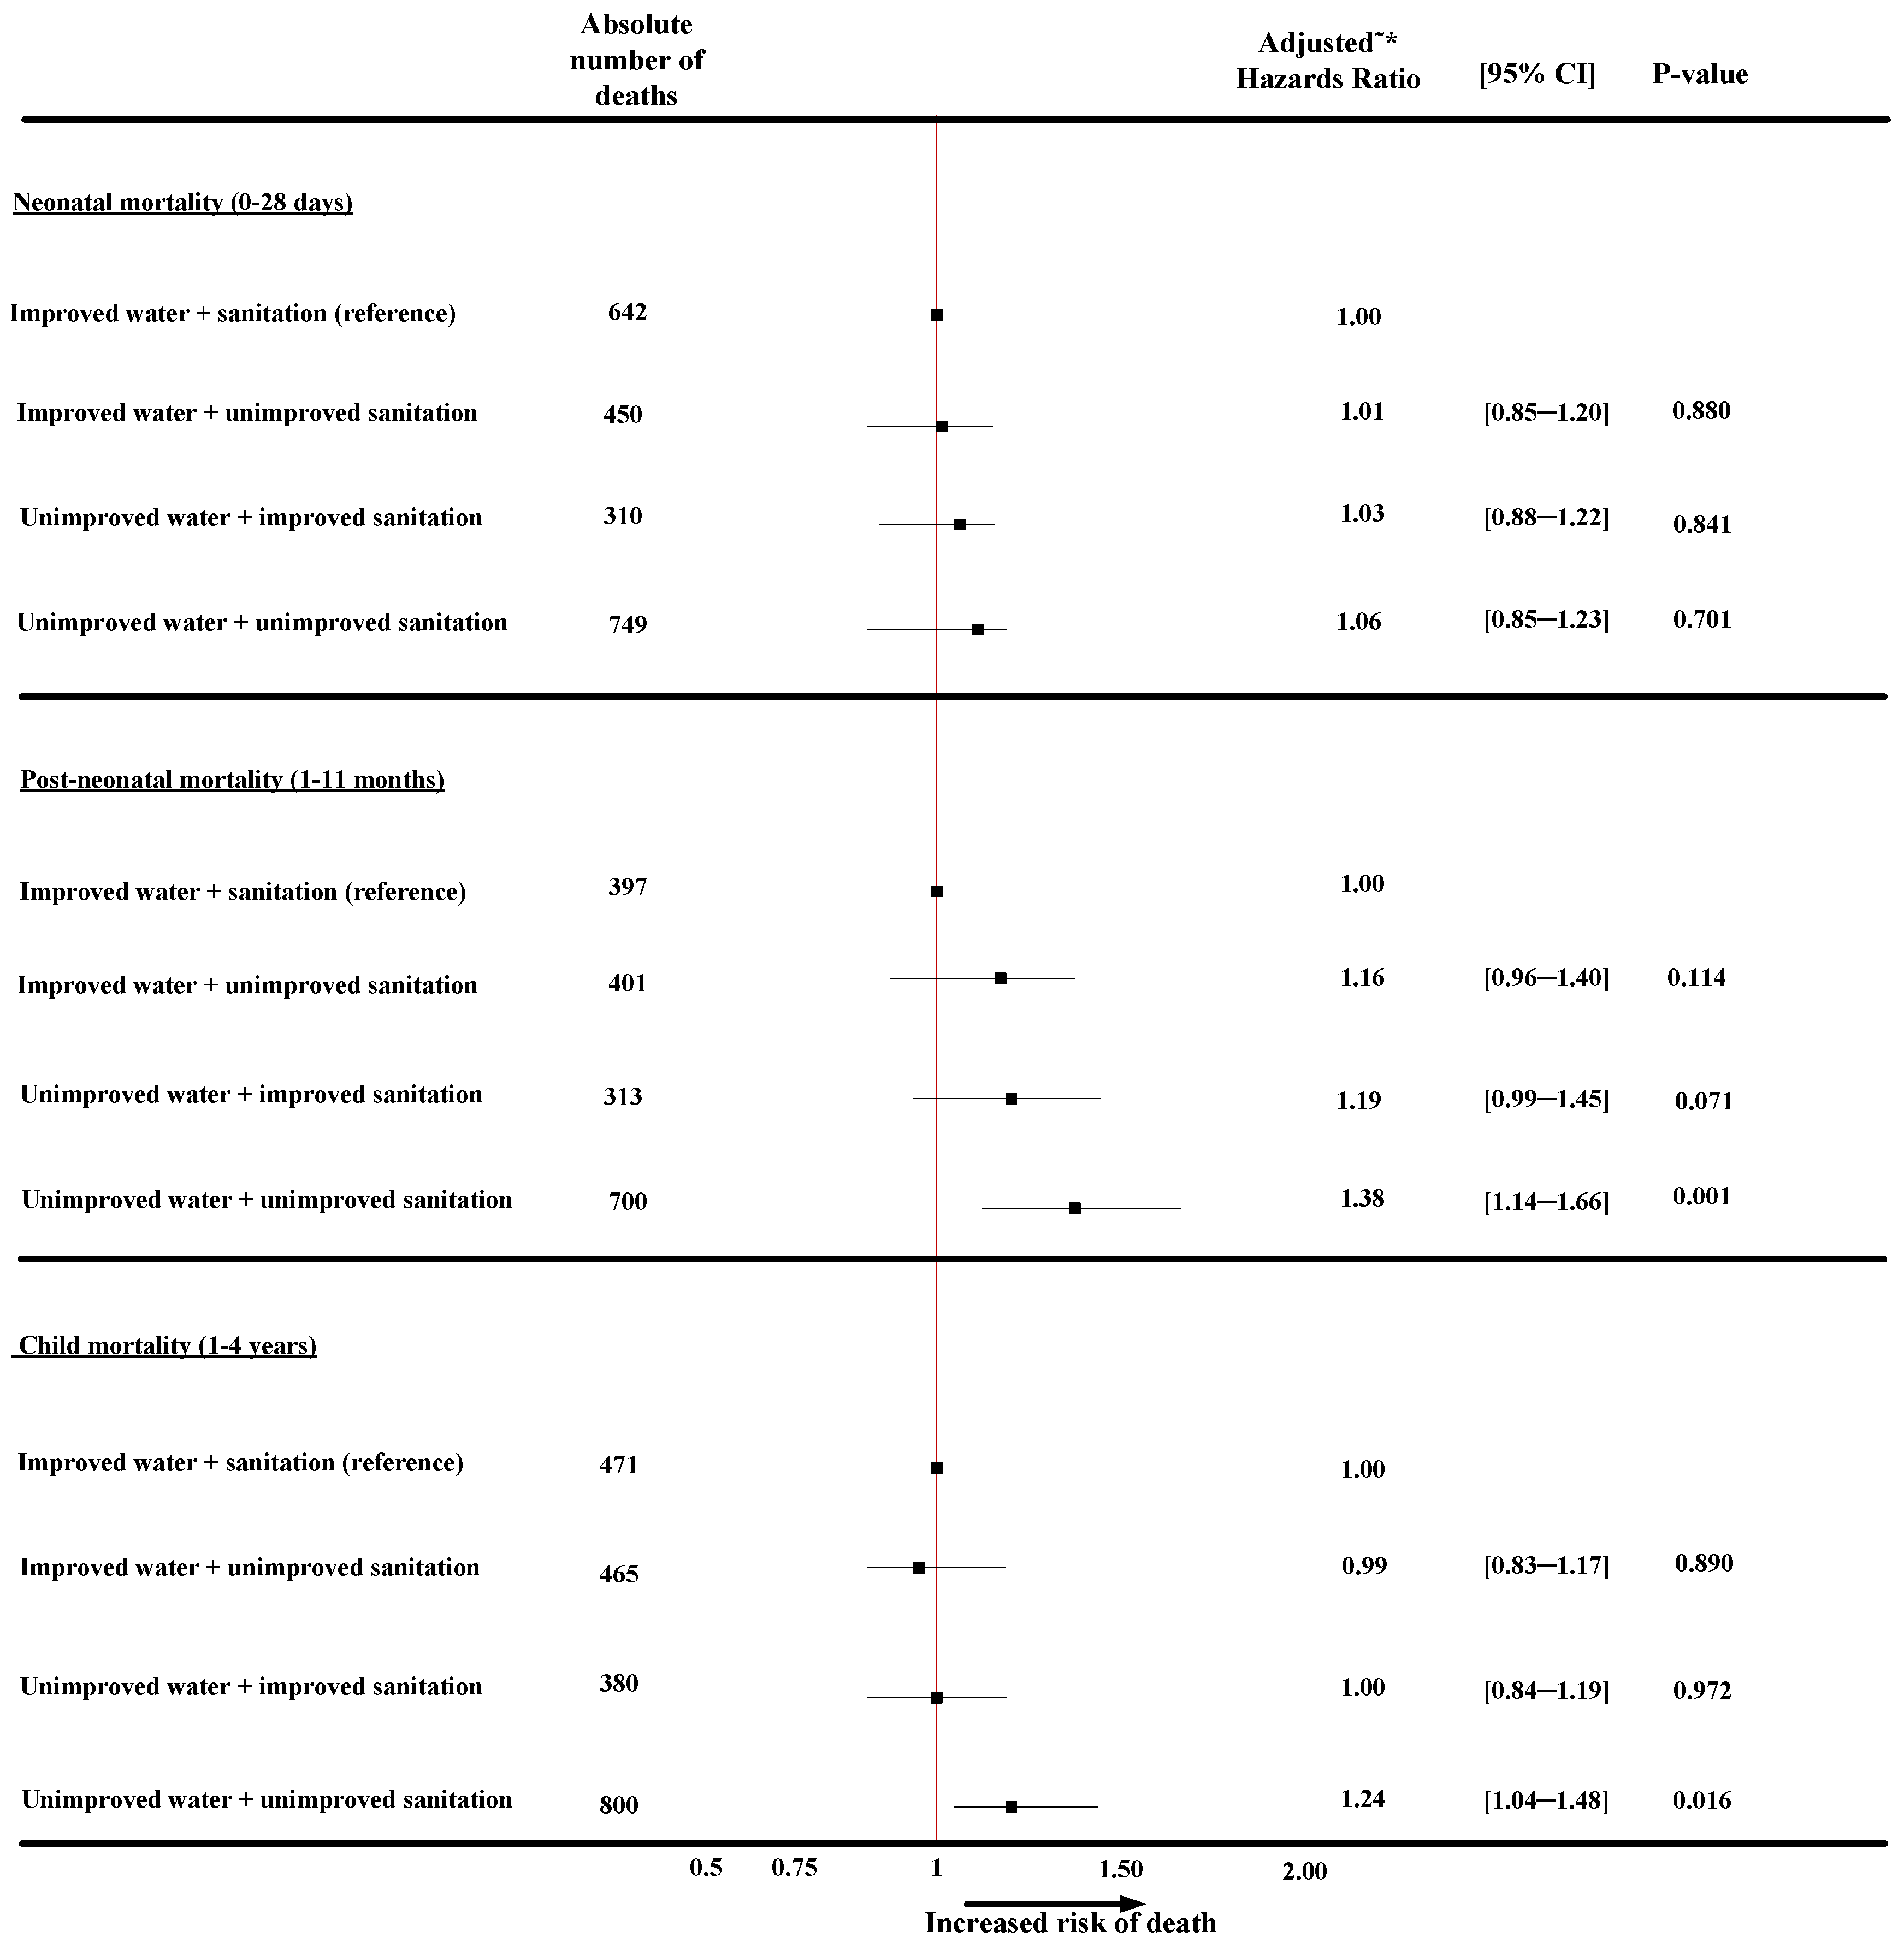
3.1. The Combined Effect of Water and Sanitation on Neonatal-Mortality

Figure 1 presents findings from the multivariate analyses of the combined effect of water and sanitation on neonatal, post-neonatal, and child mortality after adjusting for confounding factors. The results show that neonates born to mothers in households with access to both unimproved water and sanitation had a higher risk of neonatal death (HR = 1.06; CI: 0.85―1.23) compared with the reference category (improved water and improved sanitation), though it was not statistically significantly different.
Table 3 (model 4) shows other significant factors that affected neonatal deaths in addition to unimproved water and sanitation including neonates born to mothers under 20 years old (HR = 3.45; CI: 2.79–4.27), newborns whose body size was perceived by their mothers as small or smaller (HR = 1.93; CI: 1.70–2.20), male newborns (HR = 1.38; CI: 1.24–1.55), newborns from poor households (HR = 1.36; CI: 1.12–1.65), and newborns not currently breastfed were 1.95 times at higher risk of neonatal death (HR = 1.95; CI: 1.73–2.20). In the final model, we removed the household wealth index and replaced it with place of residence. In addition to the impact of water and sanitation, newborns born to mothers residing in rural areas had a significantly higher risk of neonatal death (HR = 1.35; CI: 1.17–1.57) than those newborns born in urban areas.

3.2. The Combined Effect of Water and Sanitation on Post-Neonatal Mortality

Compared with the reference category in Figure 1, households with an unimproved source of water and unimproved sanitation (HR = 1.38; CI: 1.14–1.66) reported a significantly higher risk of post-neonatal mortality. Table 4 (model 4) shows other factors that significantly affected post-neonatal deaths in addition to households having both unimproved source of water and unimproved sanitation. Infants whose fathers had no formal education were more likely to die (HR = 1.22; CI: 1.05–1.42), as were infants whose birth size was perceived as small or smaller (HR = 1.18; CI: 1.03–1.36). Infants that were not currently breastfed had a significantly higher risk of post-neonatal mortality (HR = 1.52; CI: 1.34–1.71) compared with currently breastfed infants.
Figure 1. The combined effect of water and sanitation on neonatal, post-neonatal and child mortality in Nigeria, 2003–2013.
Ijerph 11 09256 g001
Notes: * Independent variables adjusted for were: place of residence, wealth index, mother’s (education, literacy level, working status, age), father’s education, child’s gender, currently breastfeeding and baby size.
˜ Missing values were not included.
Table 3. Model for neonatal mortality.
Variables(Model 0) ˇ(Model 1) ^(Model 2) ^(Model 3) ^(Model 4) ^
HR (95% CI)HR (95% CI)HR (95% CI)HR (95% CI)HR (95% CI)
Year of survey
2003RefRefRefRefRef
20080.83 (0.69–1.01)0.86 (0.71–1.03)0.86 (0.71–1.03)0.86 (0.71–1.04)0.86 (0.71–1.04)
20130.68 (0.56–0.82)0.69 (0.57–0.83)0.69 (0.57–0.84)0.69 (0.57–0.84)0.69 (0.57–0.85)
Socioeconomic factor
Residence type
UrbanRef
Rural1.46 (1.27–1.67)
Household wealth index
RichRef
Poor1.51 (1.28–1.78)1.38 (1.16–1.64)1.37 (1.14–1.64)1.37 (1.13–1.65)1.36 (1.12–1.65)
Middle1.28 (1.08–1.52)1.23 (1.04–1.46)1.22 (1.03–1.46)1.22 (1.02–1.46)1.22 (1.02–1.46)
Mother’s education
Secondary or higherRef
No education1.24 (1.07–1.44)
Primary1.24 (1.06–1.46)
Mother’s literacy level
Able to readRef
Cannot read at all1.24 (1.10–1.40)
Father’s education
Secondary or higherRef
No education1.15 (1.02–1.31)
Primary1.14 (0.98–1.32)
Mother’s working status
Not workingRef
Working0.83 (0.75–0.94)
Demographic factor
Mother’s age
30–39RefRef RefRef
<203.69 (2.98–4.58)3.46 (2.79–4.28)3.45 (2.79–4.27)3.46 (2.79–4.28)3.45 (2.79–4.27)
20–291.17 (1.03–1.32)1.17 (1.03–1.33)1.17 (1.03–1.33)1.17 (1.04–1.33)1.17 (1.03–1.33)
40–491.21 (1.00–1.47)1.09 (0.90–1.33)1.09 (0.90–1.33)1.09 (0.90–1.33)1.09 (0.90–1.33)
Sex of child
FemaleRefRefRefRefRef
Male1.37 (1.23–1.53)1.39 (1.24–1.55)1.39 (1.24–1.55)1.39 (1.24–1.55)1.38 (1.24–1.55)
Mother’s perceived baby size
Average or largerRefRefRefRefRef
Small or very small1.97 (1.74–2.34)1.93 (1.70–2.20)1.93 (1.70–2.20)1.94 (1.70–2.20)1.93 (1.70–2.20)
Currently breastfeeding
YesRefRefRefRefRef
No1.83 (1.62–2.06)1.95 (1.73–2.20)1.95 (1.73–2.20)1.95 (1.73–2.20)1.95 (1.73–2.20)
Household environmental factors
Source of water
ImprovedRef Ref
Unimproved1.18 (1.06–1.33) 1.02 (0.91–1.15)
Type of sanitation facility
ImprovedRef Ref
Unimproved1.20 (1.07–1.35) 1.02 (0.89–1.16)
Notes: ^ Independent variables adjusted were: year of survey, place of residence, wealth index, mother’s (education, literacy level, working-status, age), father’s education, child’s gender, currently breastfeeding and baby size; ˇ Model 0—unadjusted independent variables; Model 1—Independent variables associated with child mortality; Model 2—Model 1 plus water; Model 3—Model 1 plus sanitation; Model 4—Model 1 plus combined water and sanitation.
As shown in Table 4 (model 4), there was a significantly higher risk of post-neonatal death for infants born to mothers from poor households (HR = 1.60; CI: 1.27–2.03) and middle-class households (HR = 1.46; CI: 1.18–1.80) compared with infants from rich households. Infants born to mothers under 20 years old had a 3.07 times greater risk of dying than those born to mothers aged 20 years old or more (HR = 3.07; CI: 2.42–3.90).
Table 4. Model for post-neonatal mortality.
Variables(Model 0) ˇ(Model 1) ^(Model 2) ^(Model 3) ^(Model 4) ^
HR (95% CI)HR (95% CI)HR (95% CI)HR (95% CI)HR (95% CI)
Year of survey
2003RefRefRefRefRef
20080.70 (0.58–0.85)0.73 (0.61–0.89)0.75 (0.62–0.91)0.74 (0.60–0.90)0.73 (0.60–0.90)
20130.55 (0.45–0.67)0.57 (0.47–0.70)0.59 (0.48–0.73)0.58 (0.47–0.71)0.59 (0.47–0.72)
Socioeconomic factor
Residence type
UrbanRef
Rural1.51 (1.30–1.75)
Household wealth index
RichRefRefRefRefRef
Poor2.08 (1.72–2.51)1.75 (1.42–2.15)1.64 (1.32–2.04)1.73 (1.37–2.18)1.60 (1.27–2.03)
Middle1.72 (1.42–2.07)1.56 (1.28–1.89)1.51 (1.23–1.84)1.55 (1.26–1.89)1.46 (1.18–1.80)
Mother’s education
Secondary or higherRef
No education1.57 (1.34–1.83)
Primary1.21 (1.01–1.45)
Mother’s literacy level
Able to readRef
Cannot read at all1.54 (1.35–1.76)
Father’s education
Secondary or higherRefRefRefRefRef
No education1.53 (1.33–1.75)1.24 (1.07–1.45)1.23 (1.06–1.43)1.25 (1.07–1.45)1.22 (1.05–1.42)
Primary1.32 (1.11–1.57)1.15 (0.97–1.37)1.15 (0.96–1.36)1.15 (0.97–1.37)1.14 (0.96–1.36)
Mother’s working status
Not workingRef
Working0.86 (0.77–0.96)
Demographic factor
Mother’s age
30–39RefRefRefRefRef
< 203.54 (2.80–4.47)3.10 (2.44–3.95)3.08 (2.42–3.91)3.10 (2.44–3.95)3.07 (2.42–3.90)
20–291.18 (1.04–1.33)1.15 (1.02–1.31)1.15 (1.02–1.31)1.15 (1.02–1.31)1.15 (1.02–1.31)
40–491.01 (0.83–1.23)0.89 (0.74–1.09)0.90 (0.74–1.09)0.89 (0.74–1.09)0.90 (0.74–1.09)
Sex of child
FemaleRef
Male1.03 (0.92–1.15)
Mother’s perceived baby size
Average or largerRefRefRefRefRef
Small or very small1.29 (1.12–1.49)1.19 (1.03–1.37)1.18 (1.03–1.36)1.17 (1.02–1.35)1.18 (1.03–1.36)
Currently breastfeeding
YesRefRefRefRefRef
No1.37 (1.22–1.55)1.51 (1.34–1.70)1.51 (1.34–1.71)1.51 (1.34–1.70)1.52 (1.34–1.71)
Household environmental factors
Source of water
ImprovedRef Ref
Unimproved1.44 (1.27–1.62) 1.16 (1.02–1.31)
Type of sanitation facility
ImprovedRef Ref
Unimproved1.35 (1.19–1.53) 1.02(0.88–1.17)
Notes: ^ Independent variables adjusted were: place of residence, wealth index, mother’s (education, literacy level, working status, age), father’s education, child’s gender, currently breastfeeding and baby size; ˇ Model 0—unadjusted independent variables; Model 1—Independent variables associated with child mortality; Model 2—Model 1 plus water; Model 3—Model 1 plus sanitation; Model 4—Model 1 plus combined water and sanitation.

3.3. The Combined Effect of Water and Sanitation on Child Mortality

As shown in Figure 1, children aged between 1 and 4 years old living in households with access to both an unimproved source of water and sanitation facilities had a greater risk of child mortality (HR = 1.24; CI: 1.04―1.48) compared with the reference category. Table 5 (model 4), shows other factors associated with a significantly higher risk of child mortality in addition to unimproved water and unimproved sanitation.
Table 5. Model for child mortality.
Variables(Model 0) ˇ(Model 1) ^(Model 2) ^(Model 3) ^(Model 4) ^
HR (95% CI)HR (95% CI)HR (95% CI)HR (95% CI)HR (95% CI)
Year of survey
2003RefRefRefRefRef
20080.76 (0.62–0.93)0.79 (0.66–0.95)0.80 (0.67–0.97)0.76 (0.63–0.92)0.76 (0.63–0.92)
20130.52 (0.42–0.63)0.54 (0.45–0.66)0.55 (0.45–0.67)0.52 (0.43–0.64)0.53 (0.43–0.64)
Socioeconomic factor
Residence type
UrbanRef
Rural2.31 (1.98–2.69)
Household wealth index
RichRefRefRefRefRef
Poor3.21 (2.68–3.84)2.29 (1.87–2.79)2.21 (1.80–2.71)2.45 (1.97–3.06)2.33 (1.86–2.90)
Middle2.37 (1.98–2.84)1.95 (1.61–2.36)1.91 (1.58–2.32)2.03 (1.67–2.47)1.95 (1.60–2.37)
Mother’s education
Secondary or higherRef
No education3.13 (2.64–3.72)
Primary2.04 (1.68–2.47)
Mother’s literacy level
Able to readRef
Cannot read at all2.46 (2.14–2.84)
Father’s education
Secondary or higherRefRefRefRefRef
No education2.36 (2.05–2.71)1.80 (1.54–2.09)1.78 (1.53–2.08)1.79 (1.53–2.08)1.76 (1.51―2.06)
Primary1.78 (1.53–2.07)1.45 (1.24–1.69)1.44 (1.24–1.68)1.45 (1.24–1.69)1.44 (1.23―1.68)
Mother’s working status
Not workingRef
Working0.81 (0.72–0.91)
Demographic factor
Mother’s age
30–39Ref
<201.54 (1.15–2.05)
20–291.10 (0.98–1.22)
40–491.20 (1.03–1.41)
Sex of child
FemaleRef
Male1.05 (0.95–1.17)
Mother’s perceived baby size
Average or largerRef
Small or very small1.35 (1.17–1.55)
Currently breastfeeding
YesRefRefRefRefRef
No1.03 (0.93–1.14)1.13 (1.02–1.25)1.13 (1.02–1.26)1.13 (1.02–1.25)1.13 (1.02―1.26)
Household environmental factors
Source of water
ImprovedRef Ref
Unimproved1.50 (1.33–1.69) 1.09 (0.96–1.23)
Type of sanitation facility
ImprovedRef Ref
Unimproved1.34 (1.19–1.51) 0.89 (0.79–1.02)
Notes: ^ Independent variables adjusted were: place of residence, wealth index, mother’s (education, literacy level, working status, age), father’s education, child’s gender, currently breastfeeding and baby size; ˇ Model 0—unadjusted independent variables; Model 1—Independent variables associated with child mortality; Model 2—Model 1 plus water; Model 3—Model 1 plus sanitation; Model 4—Model 1 plus combined water and sanitation.
These include children that were not currently breastfed (HR = 1.13; CI: 1.02–1.26), children whose fathers had no formal education (HR = 1.76; CI: 1.51–2.06), and children from poor households (HR = 2.33; CI: 1.86–2.90).

3.4. Discussion

In this study, the impact of water and sanitation on neonatal, post-neonatal, and child mortality was examined. We found that unimproved water and sanitation significantly increased the risk of post-neonatal and child mortality; however, it had no significant effect on the risk of neonatal mortality. This pattern is consistent with previous studies conducted in Egypt and Eritrea [17,22]; these authors reported that the impact of household environmental factors is very weak during the neonatal period; however, there was a large and statistically significant impact during the post-neonatal and child periods. A possible explanation of our findings is that exclusive breastfeeding has important protective effects on the survival of infants, increases immunity, and decreases the risk of prolonged diarrhoea; neonates are less likely to be exposed to pathogens in contaminated water [23,24,25,26]. The large impact of breastfeeding observed during the neonatal and post-neonatal periods reaffirms the protective effects of breastfeeding in reducing the risk of infant mortality.
The effect of unimproved water and sanitation was substantial during the post-neonatal period. Children learn to crawl and walk during this period, and they experience increased exposure to pathogens that cause diarrhoea from a variety of environmental sources, including contaminated water [5]. It is also during this period that the weaning process commences, and low income households often use unimproved water to prepare weaning foods, thereby transmitting pathogens to infants that cause diarrheal diseases, which has been shown to result in high mortality [27,28,29]. Similarly, children aged between 1 and 4 years old exposed to unimproved water and sanitation had increased mortality risk, though the effect was lower compared with that of the post-neonatal period. The lower mortality risk reported among children aged between 1 and 4 years old could be attributed to their relatively well developed immune response to pathogens compared with that during the infancy period; for example, maternal immunoglobulin is weak, short lived, and of low avidity during the first year of life [30].
Findings from this study showed that household economic status influenced survival of children under 5 years old. During all age periods, children from poor households had a significantly higher risk of mortality compared with children from rich households [17,31]. This finding is not surprising because wealthier households were more likely to have improved water sources and excreta disposal facilities than poor households. There was a strong effect in the final model when we replaced the household wealth index with place of residence, indicating that household dwelling had a significant influence on neonatal, post-neonatal, and child mortality. This finding is supported by other studies [32,33] that have found rural dwellings to be a strong predictor of mortality of children under 5 years old. Limited access to health facilities and maternal healthcare services disproportionally hinders rural dwellers from receiving adequate healthcare services, resulting in a high probability of child death. In Nigeria, as in many low and medium income countries, the majority of well-equipped hospitals and health centres are located in urban areas.
We found that male neonates had a significantly higher risk of dying during the neonatal period compared with female neonates. This finding is consistent with a cross-sectional study conducted in Kenya in 2007, which reported that male neonates were 1.34 times at greater risk of dying than female neonates [34]. Biological factors are a possible explanation for this disparity [35]. The findings further indicated that maternal age at birth (<20 years old) and perception of newborn size at birth (small or very small) by mothers were strongly related to both neonatal and post-neonatal mortality, though they were not significantly related to child mortality. Paternal education had a strong impact on post-neonatal and child mortality. Children whose fathers had a secondary education or higher had significantly lower risk of death than those whose fathers had a primary or no formal education. This finding is consistent with studies in Bangladesh and Pakistan [31,36] which showed a strong relationship between childhood mortality and the level of education of the father. The lower risk of death observed for children whose fathers were educated may be because educated fathers are more likely to invest in both improved water sources and sanitation facilities [16].
The definitions of indicators (water and sanitation) used in this study were based on those recommended by WHO; other important strengths of the study were restricting analyses to the most recent births within 5 years prior to each survey to minimise any recall bias on birth and death dates reported by mothers, using a nationally representative survey with appropriate adjustment for sampling design and sampling weight, and the high response rate (95%) to the survey. However, limitations to be considered when interpreting the results include that no firm conclusions can be made on causes and effects in a cross-sectional design, and that other factors such as water storage facilities, quality and safety of the water sources as well as information on maintenance of existing water supply infrastructure [37] were not considered. Another possible limitation of this study is that information on medical status of children under 5 years old and causes of death were lacking in the NDHS data.4.

4. Conclusions

Our analyses of the impact of water and sanitation in Nigeria indicated that children under 5 years old in households with access to both unimproved water sources and sanitation facilities had increased risk of neonatal, post-neonatal, and child death than children with access to improved water sources and sanitation. In addition to the effect of unimproved water and sanitation, the results revealed that households in rural areas, poor households, mother’s age at birth (<20 years old), mothers who perceived their newborns to be smaller than average at birth, and illiterate parents had a significantly higher risk of neonatal, post-neonatal, and child mortality. The findings from the study showed that Water and Sanitation community-based interventions are needed to prevent child deaths, and that such interventions should target low socioeconomic households in Nigeria.

Acknowledgments

This study was part of the first author’s thesis for a doctoral dissertation with the School of Medicine, at the University of Western Sydney, Australia. We are grateful to Measure DHS, ORC Macro, Calverton, MD, USA for providing the 2003, 2008 and 2013 NDHS data for this analysis.

Author Contributions

Osita K. Ezeh and Kingsley Agho were involved in the conception and design of this study. Osita K. Ezeh conducted the literature review, carried out the analysis, and drafted the manuscript. Kingsley Agho, Michael J. Dibley, John Hall, and Andrew N. Page gave advice on interpretation, and revised and edited the manuscript. All authors read and approved the manuscript.

Conflicts of Interest

The authors declare no conflict of interest.

References

  1. Diarrhoea: Why Children are still Dying and What Can Be Done; UNICEF/WHO: Geneva, Switzerland, 2009.
  2. Report of the Joint Monitoring Programme: Progress on Sanitation and Drinking-Water; UNICEF/WHO: New York, NY, USA, 2013.
  3. Progress on Drinking Water and Sanitation Joint Monitoring Programme; UNICEF/WHO: Geneva, Switzerland, 2012.
  4. Fayehun, O.A. Household Environmental Health Hazards and Child Survival in Sub-Saharan Africa. DHS Working papers, Demographic and Health Research 2010, No. 74. Available online: http://dhsprogram.com/pubs/pdf/WP74/WP74.pdf (accessed on 15 May 2013).
  5. The Physical School Environment: An Essential Element of a Health-Promoting School; WHO: Geneva, Switzerland, 2003.
  6. USAID. Nigeria Water and Sanitation Profile. March 2010. Available online: www.washplus.org/sites/default/files/nigeria.pdf (accessed on 25 August 2013).
  7. Effective Financing of Local Governments to Provide Water and Sanitation Services, August 2008; WaterAid Nigeria: Abuja, Nigeria, 2008.
  8. Fort, A.L.; Kothari, M.T.; Abderrahim, N. Association between Maternal, Birth, and Newborn Characteristics and Neonatal Mortality in Five Asian Countries. DHS Working Papers 2008, No. 55. Available online: http://www.path.org/publications/files/MCHN_dhs_nnm_asian.pdf (accessed on 29 December 2012).
  9. Aiello, A.E.; Larson, E.L.; Sedlak, R. Hidden heroes of the health revolution Sanitation and personal hygiene. Amer. J. Infect. Control 2008, 36, S128–S151. [Google Scholar] [CrossRef]
  10. Fink, G.; Günther, I. The Impact and Cost of Water and Sanitation Infrstructure; Development Economics Prospects Group, World Bank: Zurich, Switzerland, 2011. [Google Scholar]
  11. National Population Commission, Federal Republic of Nigeria. Final Report on Nigeria Demographic and Health Survey; ORC Macro: Calverton, MD, USA, 2013.
  12. Levels and Trends in Child Mortality; UNICEF/WHO: Geneva, Switzerland, 2012.
  13. UNICEF Nigeria. Launch of Hand Washing Campaign in Abuja. 2008. Available online: http://www.unicef.org/nigeria/media_2364.html (accessed on 15 January 2014).
  14. National Population Commission, Federal Republic of Nigeria. Final Report on Nigeria Demographic and Health Survey 2008; ORC Macro: Calverton, MD, USA.
  15. National Population Commission, Federal Republic of Nigeria. Final Report on Nigeria Demographic and Health Survey 2003; ORC Macro: Calverton, MD, USA.
  16. Fink, G.; Günther, I. Water, Sanitation and Children’s Health: Evidence from 172 DHS Surveys; Development Economics Prospects Group, World Bank: Zurich, Switzerland, 2010. [Google Scholar]
  17. Woldemicael, G. The effects of water supply and sanitation on childhood mortality in urban Eritrea. J. Biosoc. Sci. 2000, 32, 207–227. [Google Scholar] [CrossRef]
  18. Fink, G.; Günther, I.; Hill, K. The effect of water and sanitation on child health: Evidence from the demographic and health surveys 1986–2007. Int. J. Epidemiol. 2011, 40, 1196–1204. [Google Scholar] [CrossRef]
  19. Titaley, C.R.; Dibley, M.J.; Roberts, C.L.; Hall, J.; Agho, K. Iron and folic acid supplements and reduced early neonatal deaths in Indonesia. Bull. WHO 2010, 88, 500–508. [Google Scholar]
  20. Deon, F.; Pritchett, L.H. Estimating wealth effects without expenditure data—Or tears: An application to educational enrollments in states of India. Demography 2001, 38, 115–132. [Google Scholar]
  21. Rutstein, S.; Rojas, G. Guide to Demographic and Health Survey (DHS); ORC Macro: Calverton, MD, USA, 2006. [Google Scholar]
  22. Ali, H.A. The Effect of Water and Sanitation on Child Mortality in Egypt; Environmental Economics Unit, Göteborg University: Göteborg, Sweden, 2003. [Google Scholar]
  23. Obungu, W.; Kizito, P.M.; Bicego, G. Trends, Age Patterns, and Determinants of Early Childhood Mortality in Kenya. Available online: http://www.dhsprogram.com/pubs/pdf/FA12/FA12.pdf (accessed on 17 November 2013).
  24. Habicht, J.P.; Davanzo, J.; Butz, W.P. Does breast-feeding really save lives, or are apparent benefits due to biases? Amer. J. Epidemiol. 1986, 123, 279–290. [Google Scholar]
  25. Victora, C.G.; Smith, P.G.; Vaughan, J.P.; Nobre, L.C.; Lombardi, C.; Teixeira, A.M.; Fuchs, S.C.; Moreira, L.B.; Gigante, L.P.; Barros, F.C. Infant feeding and deaths due to diarrhea: A case-control study. Amer. J. Epidemiol. 1989, 129, 1032–1041. [Google Scholar]
  26. Huttly, S.R.; Blum, D.; Kirkwood, B.R.; Emeh, R.N.; Feachem, R.G. The epidemiology of acute diarrhoea in a rural community in Imo State, Nigeria. Trans. Roy. Soc. Trop. Med. Hyg. 1987, 81, 865–870. [Google Scholar]
  27. VanDerslice, J.; Popkin, B.; Briscoe, J. Drinking-water quality, sanitation, and breast-feeding: Their interactive effects on infant health. Bull. WHO 1994, 72, 589–601. [Google Scholar]
  28. Trussell, J.; Hammerslough, C. A hazards—Model analysis of the covariates of infant and child mortality in Sri Lanka. Demography 1983, 20, 1–26. [Google Scholar] [CrossRef]
  29. Jinadu, M.K.; Olusi, S.O.; Agun, J.I.; Fabiyi, A.K. Childhood diarrhoea in rural Nigeria. I. Studies on prevalence, mortality and socio-environmental factors. J. Diarrhoeal Dis. Res. 1991, 9, 323–327. [Google Scholar]
  30. Jaspan, H.B.; Lawn, S.D.; Safrit, J.T.; Bekker, L. The maturing immune system: Implications for development and testing HIV-1 vaccines for children and adolescents. Aids 2006, 20, 483–494. [Google Scholar]
  31. Agha, S. The determinants of infant mortality in Pakistan. Soc. Sci. Med. 2000, 51, 199–208. [Google Scholar]
  32. Oti, S.O.; Odimegwu, C. Perinatal mortality in Nigeria: Do place of delivery and delivery assistants matter? Open Demogr. J. 2011, 4, 1–10. [Google Scholar]
  33. Golding, J.; Greenwood, R.; McCaw-Binns, A.; Thomas, P. Associations between social and environmental factors and perinatal mortality in Jamaica. Paediatr. Perinat. Epidemiol. 1994, 8, 17–39. [Google Scholar] [CrossRef]
  34. Mutunga, C.J. Environmental Determinants of Child Mortality in Kenya. Available online: http://www.econstor.eu/handle/10419/63263 (accessed on 10 November 2012).
  35. Khoury, M.J.; Marks, J.S.; McCarthy, B.J.; Zaro, S.M. Factors affecting the sex differential in neonatal mortality: The role of respiratory distress syndrome. Amer. J. Obstet. Gynecol. 1985, 151, 777–782. [Google Scholar]
  36. Mondal, N.; Hossain, K.; Ali, K. Factors influencing infant and child mortality: A case study of Rajshahi District, Bangladesh. J. Hum. Ecol. 2009, 26, 31–39. [Google Scholar]
  37. Neumann, L.E.; Moglia, M.; Cook, S.; Nguyen, M.N.; Sharma, A.K.; Nguyen, T.H.; Nguyen, B.V. Water use, sanitation and health in a fragmented urban water system: Case study and household survey. Urban Water J. 2013, 11, 198–210. [Google Scholar]

