Article

Relationship between Obesity, Adipocytokines and Inflammatory Markers in Type 2 Diabetes: Relevance for Cardiovascular Risk Prevention

Clinic for Endocrinology, Diabetes and Metabolic Diseases, Clinical Center of Serbia, Faculty of Medicine, University of Belgrade, Dr. Subotica 13, Belgrade 11000, Serbia
*
Author to whom correspondence should be addressed.
Int. J. Environ. Res. Public Health 2014, 11(4), 4049-4065; https://doi.org/10.3390/ijerph110404049
Submission received: 14 January 2014 / Revised: 20 March 2014 / Accepted: 31 March 2014 / Published: 14 April 2014

Abstract

:
This study aimed to analyse the impact of obesity in type 2 diabetes (T2D) on adipocytokines (adiponectin, leptin and resistin) and inflammatory markers (TNF-α, IL-6 and hsCRP) as cardiovascular risk factors. A cross-sectional study comparing the basal levels of adipocytokines and inflammatory markers was done in 18 obese (BMI ≥ 30 kg/m2) (group A), 21 overweight (25 kg/m2 ≤ BMI < 30 kg/m2) (group B), 25 non-obese T2D patients (group C) and 15 non-obese controls (group D). The lowest levels of adiponectin and the highest levels of leptin, resistin, TNF-α, IL-6 and hsCRP were found in group A. Adiponectin levels were significantly lower, and resistin, TNF-α, and hsCRP levels were elevated in group C vs. D. However, leptin and IL-6 levels differed significantly between groups A and B, but not between groups C and D. Moreover, we found a significant negative correlation between adiponectin and TNF-α, but not with other markers, which was independent of the presence of obesity. In contrast, leptin and resistin correlated with the inflammatory markers, and this correlation was obesity-dependent. Our results suggest that obesity influences cardiovascular risk primarily through changes in leptin and resistin and less efficiently at the level of adiponectin.

1. Introduction

Previous studies have shown that obesity is associated with increased cardiovascular risk, especially when coexisting with type 2 diabetes (T2D) [1,2]. However, the mechanisms underlying this increased risk, either in obese T2D patients or in non-diabetic obese individuals, have not yet been clarified.
Moreover, it has been shown that in most studies aimed at reducing obesity by changes in lifestyle (diet and physical activity), lifestyle intervention had beneficial effects not only for preventing T2D but also when prevention of cardiovascular diseases (CVD) was concerned [3,4,5]. The mechanisms of this beneficial influence and their clinical relevance are poorly understood.
Some of the previous studies have suggested that adipocytokines and inflammatory markers might mediate the facilitating effect of obesity on the appearance of its comorbidities such as insulin resistance (IR), T2D and CVD [6].
Adiponectin levels were previously observed to be significantly diminished both in obesity and T2D [7,8,9]. Many studies described a significant negative correlation between adiponectin and the parameters of obesity [10,11]. In patients with T2D, adiponectin levels were lower than in age and BMI-matched non-diabetic men and women [12]. On the other hand, many studies showed that low adiponectin concentrations correlated with high plasma insulin and high IR, while adiponectin administration was found to suppress proinflammatory agents, e.g., TNF-α and IL-6, and to directly ameliorate endothelial dysfunction by increasing nitric oxide (NO) production [11,12,13,14].
Obesity is associated with hyperleptinaemia and leptin resistance. Leptin levels are elevated in proportion to the degree of adiposity, while the association of increased leptin with T2D is still unclear [15,16,17]. In cross-sectional studies, leptin levels have been associated with IR and the proinflammatory state that accompanies obesity [18]. At the same time, elevated leptin levels have been reported in patients with coronary artery disease (CAD) [19,20].
Resistin levels have been associated with obesity [20,21,22]. Moreover, some studies reported that resistin levels were higher in T2D subjects, but this increase could not be confirmed by other studies, or the relationship with IR or fasting insulin levels [23,24,25]. Also, clinical studies have revealed that plasma resistin levels correlate with markers of inflammation and might be predictive of coronary atherosclerosis [26].
Systemic inflammation could be the causative link between obesity, diabetes and cardiovascular diseases [27], as it induces inflammatory processes in the vessel wall. The chronic inflammatory response is characterized increases in the production of markers of inflammation i.e., C-reactive protein (CRP), interleukin 6 (IL-6) and tumor necrosis factor alpha (TNF-α) [8,28]. High-sensitive CRP (hsCRP) has been proposed as an independent risk factor for CVD. Elevated concentrations of hsCRP were seen when obesity and diabetes were studied separately [27,29]. Several authors reported increased plasma IL-6 levels in obese patients as well as in patients with T2D [30,31,32,33]. However, some authors found a correlation between IL-6 and obesity and IR, but the results are still conflicting [34,35]. In obesity, chronically elevated TNF-α levels were detected and were also found to be associated with IR, increased plasma glucose and insulin levels [3,7] IRAS study confirmed that TNF-α is associated with T2D independently of adiposity [36]. Also, TNF-α was shown to correlate with carotid intima-media thickness (IMT) [37] and to be increased in premature CAD [38].
Therefore, in this study, we analysed the impact of obesity on changes in the levels of adipocytokines and inflammatory markers which might facilitate cardiovascular disease, in obese T2D patients. The analysis has also revealed the potential relevance of modulating these changes to cardiovascular risk prevention during lifestyle interventions targeting obesity.

2. Experimental Section

2.1. Subjects

In this study, we examined 65 T2D patients (mean age 57.8 years) and 15 control subjects. Diagnosis of T2D was confirmed using the oral glucose tolerance test (OGTT) in accordance with the WHO criteria [39]. The whole cohort of T2D patients was subdivided according to their body mass index (BMI) into three groups: obese patients (group A, n = 21, BMI ≥ 30 kg/m2), overweight patients (group B, n = 18, 25 kg/m2 ≤ BMI < 30 kg/m2) and lean patients (group C, n = 25, BMI < 25 kg/m2). Control subjects were healthy individuals with BMI < 25 kg/m2 (group D, n = 15). In addition to diet and exercise, the participants in the study were treated with metformin and sulfonylureas for hyperglycemia, either alone or in combination, as well as lipid lowering and antihypertensive therapy, all following standard recommendations [40]. Patients with clinically manifest CVD (except essential hypertension), renal diseases, urinary tract infections, thyroid disorders and liver function abnormalities, chronic inflammatory disorders, malignancies and psychiatric diseases were not included. The anthropometric and metabolic characteristics of patients and controls are shown in Table 1.
Table 1. Metabolic and anthropometric characteristics of the study subjects.
CharacteristicGroup A
Obese T2D
Group B
Overweight T2D
Group C
Lean T2D
Group D
Control Subjects
Number of subjectsMale/Female21
10/11
18
10/8
25
13/12
15
7/8
Duration of T2D (y) 15.84 ± 0.17.3 ± 0.26.5 ± 0.1/
HbAlc (%) 16.3 ± 0.76.6 ± 0.46.5 ± 0.54.6 ± 0.4
BMI (kg/ m2) 233.4 ± 2.828.3 ± 1.023.8 ± 1.522.7 ± 2.9
Waist (cm) 3
Fat mass (kg) 4
110.4 ± 9.6
36.09 ± 7.0
100.7 ± 6.0
24.5 ± 6.0
85.5 ± 6.2
17.2 ± 4.5
82.4 ± 7.8
15.7 ± 6.8
Notes: 1 A vs. B vs. C: p = NS; 2 A vs. B vs. C vs. D: p < 0.05; A vs. B: p < 0.05; B vs. C: p < 0.01; C vs. D: p = NS; 3 A vs. B: vs. C vs. D: p < 0.01; A vs. B: p < 0.01; B vs. C: p < 0.01; C vs. D: p = NS; 4 A vs. B vs. C vs. D: p < 0.01; A vs. B: p < 0.01; B vs. C: p < 0.05; C vs. D: p = NS.

2.2. Measurement of Anthropometric and Metabolic Characteristics

Body mass index (BMI) was calculated as weight divided by height squared (kg/m2). Body composition and the amount and distribution of body fat (Fat Mass (FM)) were measured by bioelectrical impedance analysis techniques with bi-pedal electrode arrangement (Tanita Body Composition Analyzer, model TBF-300, manufacturer, Arlington Heights, IL, USA). The anthropometric and metabolic characteristics of patients and controls are shown in Table 1.
All the participants were studied at the Clinic for Endocrinology, Diabetes and Metabolic Diseases, Clinical Center of Serbia, Faculty of Medicine, University of Belgrade. The study was approved by the Ethics Committee of the Faculty of Medicine, University of Belgrade. All the participants provided written informed consent.

2.3. Laboratory Measurements

In T2D patients, antihyperglycemic, lipid lowering and antihypertensive medications were stopped 24 h before blood sampling. All the samples were taken after a 12 h fasting period.
Levels of total adiponectin (Mercodia, city, Sweden) as well as resistin, TNF-α, IL-6 (ALPCO Diagnostics, Windham, NH, USA), and hsCRP (ACL-Instrument Laboratory, Lexington, MA, USA) were measured in duplicate by an ELISA method using commercially available kits. Leptin (Linco, Seaford, DE, USA) and insulin levels (INEP, Beograd, Serbia) were determined with RIA. Glucose levels were measured by a glucose-oxidase method (Beckman Instruments, Fullerton, CA, USA). Homeostasis model assessment for insulin resistance evaluation (HOMA-IR) was calculated using the equation: fasting plasma insulin × glucose/22.5 [41].

2.4. Statistical Analysis

SPSS for Windows Version 16.0 (Chicago, IL, USA) was utilized for statistical evaluation. Values are expressed as mean ± SE. The Kolmogorov-Smirnov test was employed to compare normally distributed variables. One-way ANOVA with the Bonferroni post hoc multiple comparison test was used to compare differences between continuous variables in the groups, and Student T test was used to compare differences in variables between two groups. To compare differences in non-normally distributed variables the Kruskal-Wallis H test was used and the Mann-Whitney test was employed to compare differences between two groups. Spearman correlation coefficients were calculated to describe crude associations between variables (bivariate correlation) and the effect of potential confounding factors was tested in multivariate linear regression models. A p-value of <0.05 was considered statistically significant.

3. Results and Discussion

Metabolic and anthropometric characteristics of the subjects were summarized in Table 1. Patients were aged 40–70 years and matched for gender and duration of diabetes. In T2D the mean duration of diabetes was 6.6 years. All the diabetic patients had optimal glycemic control and HbA1c did not differ between the groups. BMI and fat mass significantly differed between the groups.

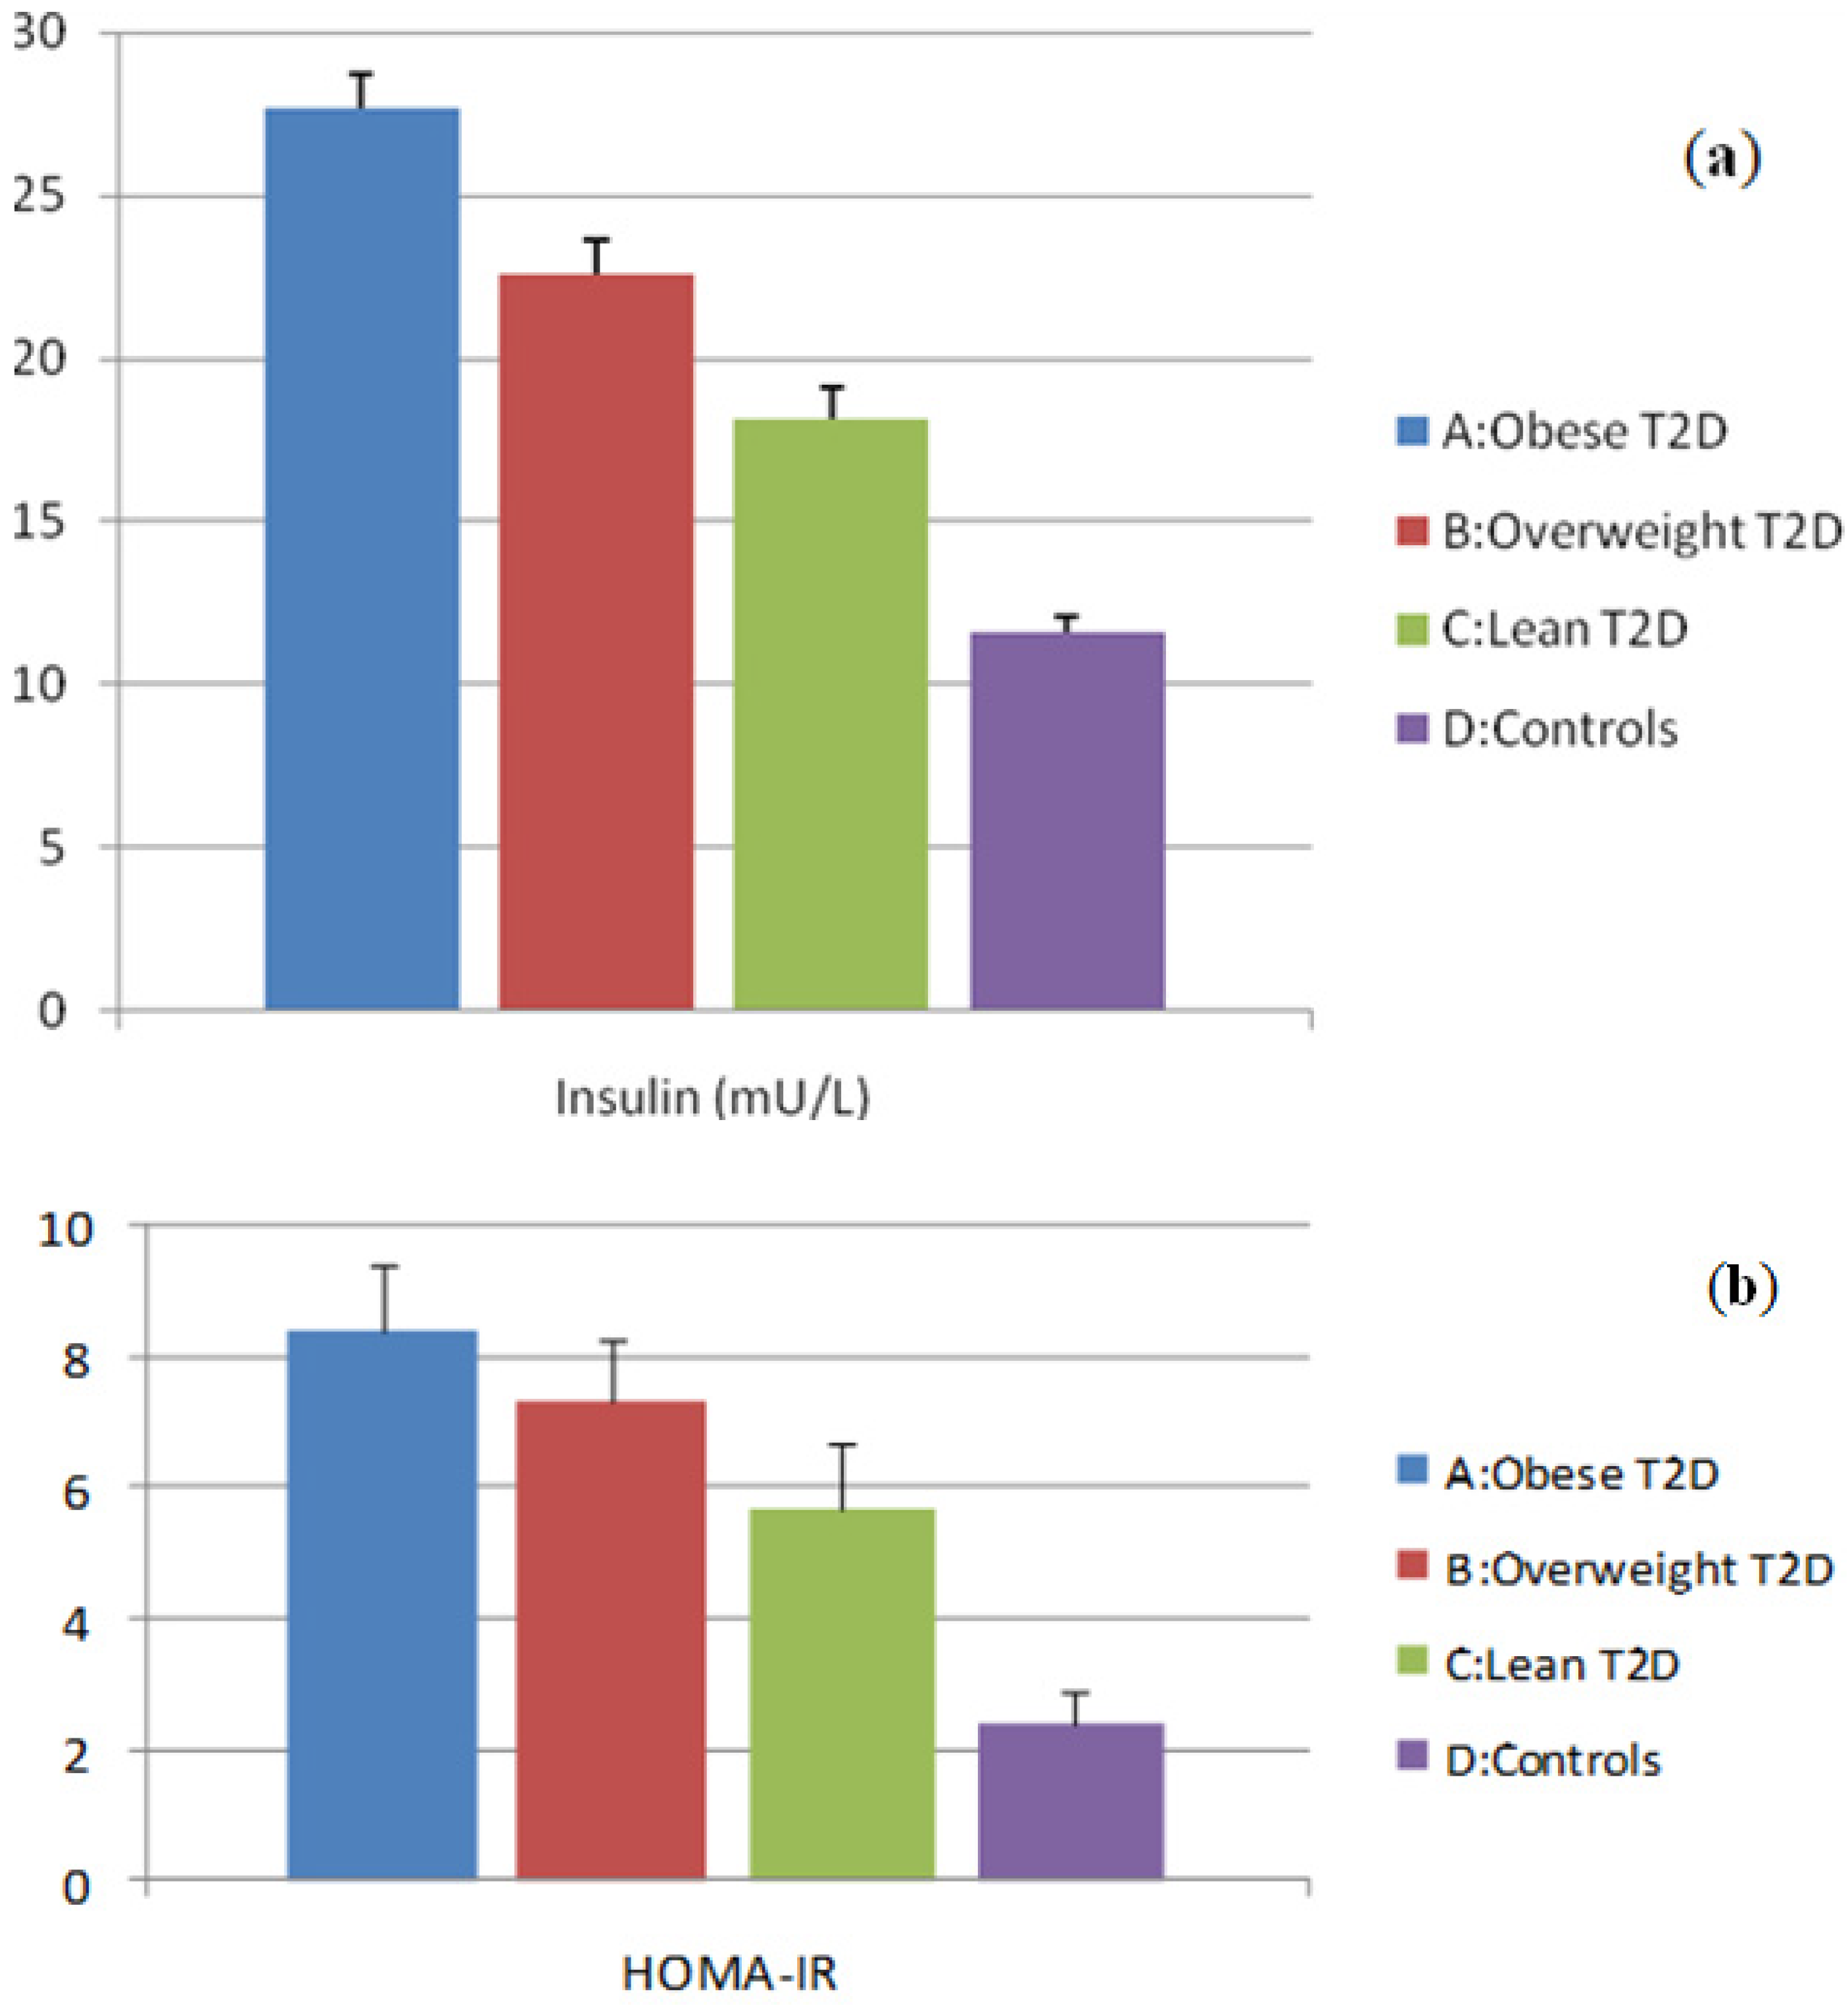
3.1. Evaluation of Insulin and HOMA-IR Levels

Basal plasma insulin concentrations and HOMA-IR levels are shown in Figure 1a,b. The highest levels of insulin and HOMA-IR were found in group A and they were significantly higher than in group B. Both group A and group B had higher insulin and HOMA-IR levels compared with group C. There was a significant difference between group C and group D (Figure 1a,b).
Figure 1. (a) Plasma levels of insulin; (b) Plasma levels of HOMA-IR.
Ijerph 11 04049 g001
Notes: A vs. B: p < 0.01; A, B vs. C: p < 0.05; C vs. D: p < 0.01.

3.2. Evaluation of Adipocytokine Levels

Basal plasma concentrations of adipocytokines (adiponectin, leptin, resistin) are shown in Figure 2a–c. The lowest levels of adiponectin were found in group A while there was no difference between group A and group B. Both groups A and B had lower levels of adiponectin compared with group C. Adiponectin levels were significantly lower in group C when compared with group D (Figure 2a).
The highest levels of leptin were found in group A and they were significantly higher than in group B. Both groups A and B had higher leptin levels compared with group C and there was no difference between group C and group D (Figure 2b).
Moreover, the highest levels of resistin were found in group A but there was no difference between group A and group B. Both groups A and B had higher resistin levels compared with group C and the latter resistin levels significantly differed in comparison to group D (Figure 2c).
Figure 2. (a) Plasma levels of adiponectin; (b) Plasma levels of leptin; (c) Plasma levels of resistin.
Ijerph 11 04049 g002
Notes: In (a): A vs. B: p = NS; A, B vs. C: p < 0.01; C vs. D: p < 0.01; In (b): A vs. B: p < 0.01; A, B vs. C: p < 0.01; C vs. D: p = NS; In (c): A vs. B: p = NS; A, B vs. C: p < 0.01; C vs. D: p < 0.05.

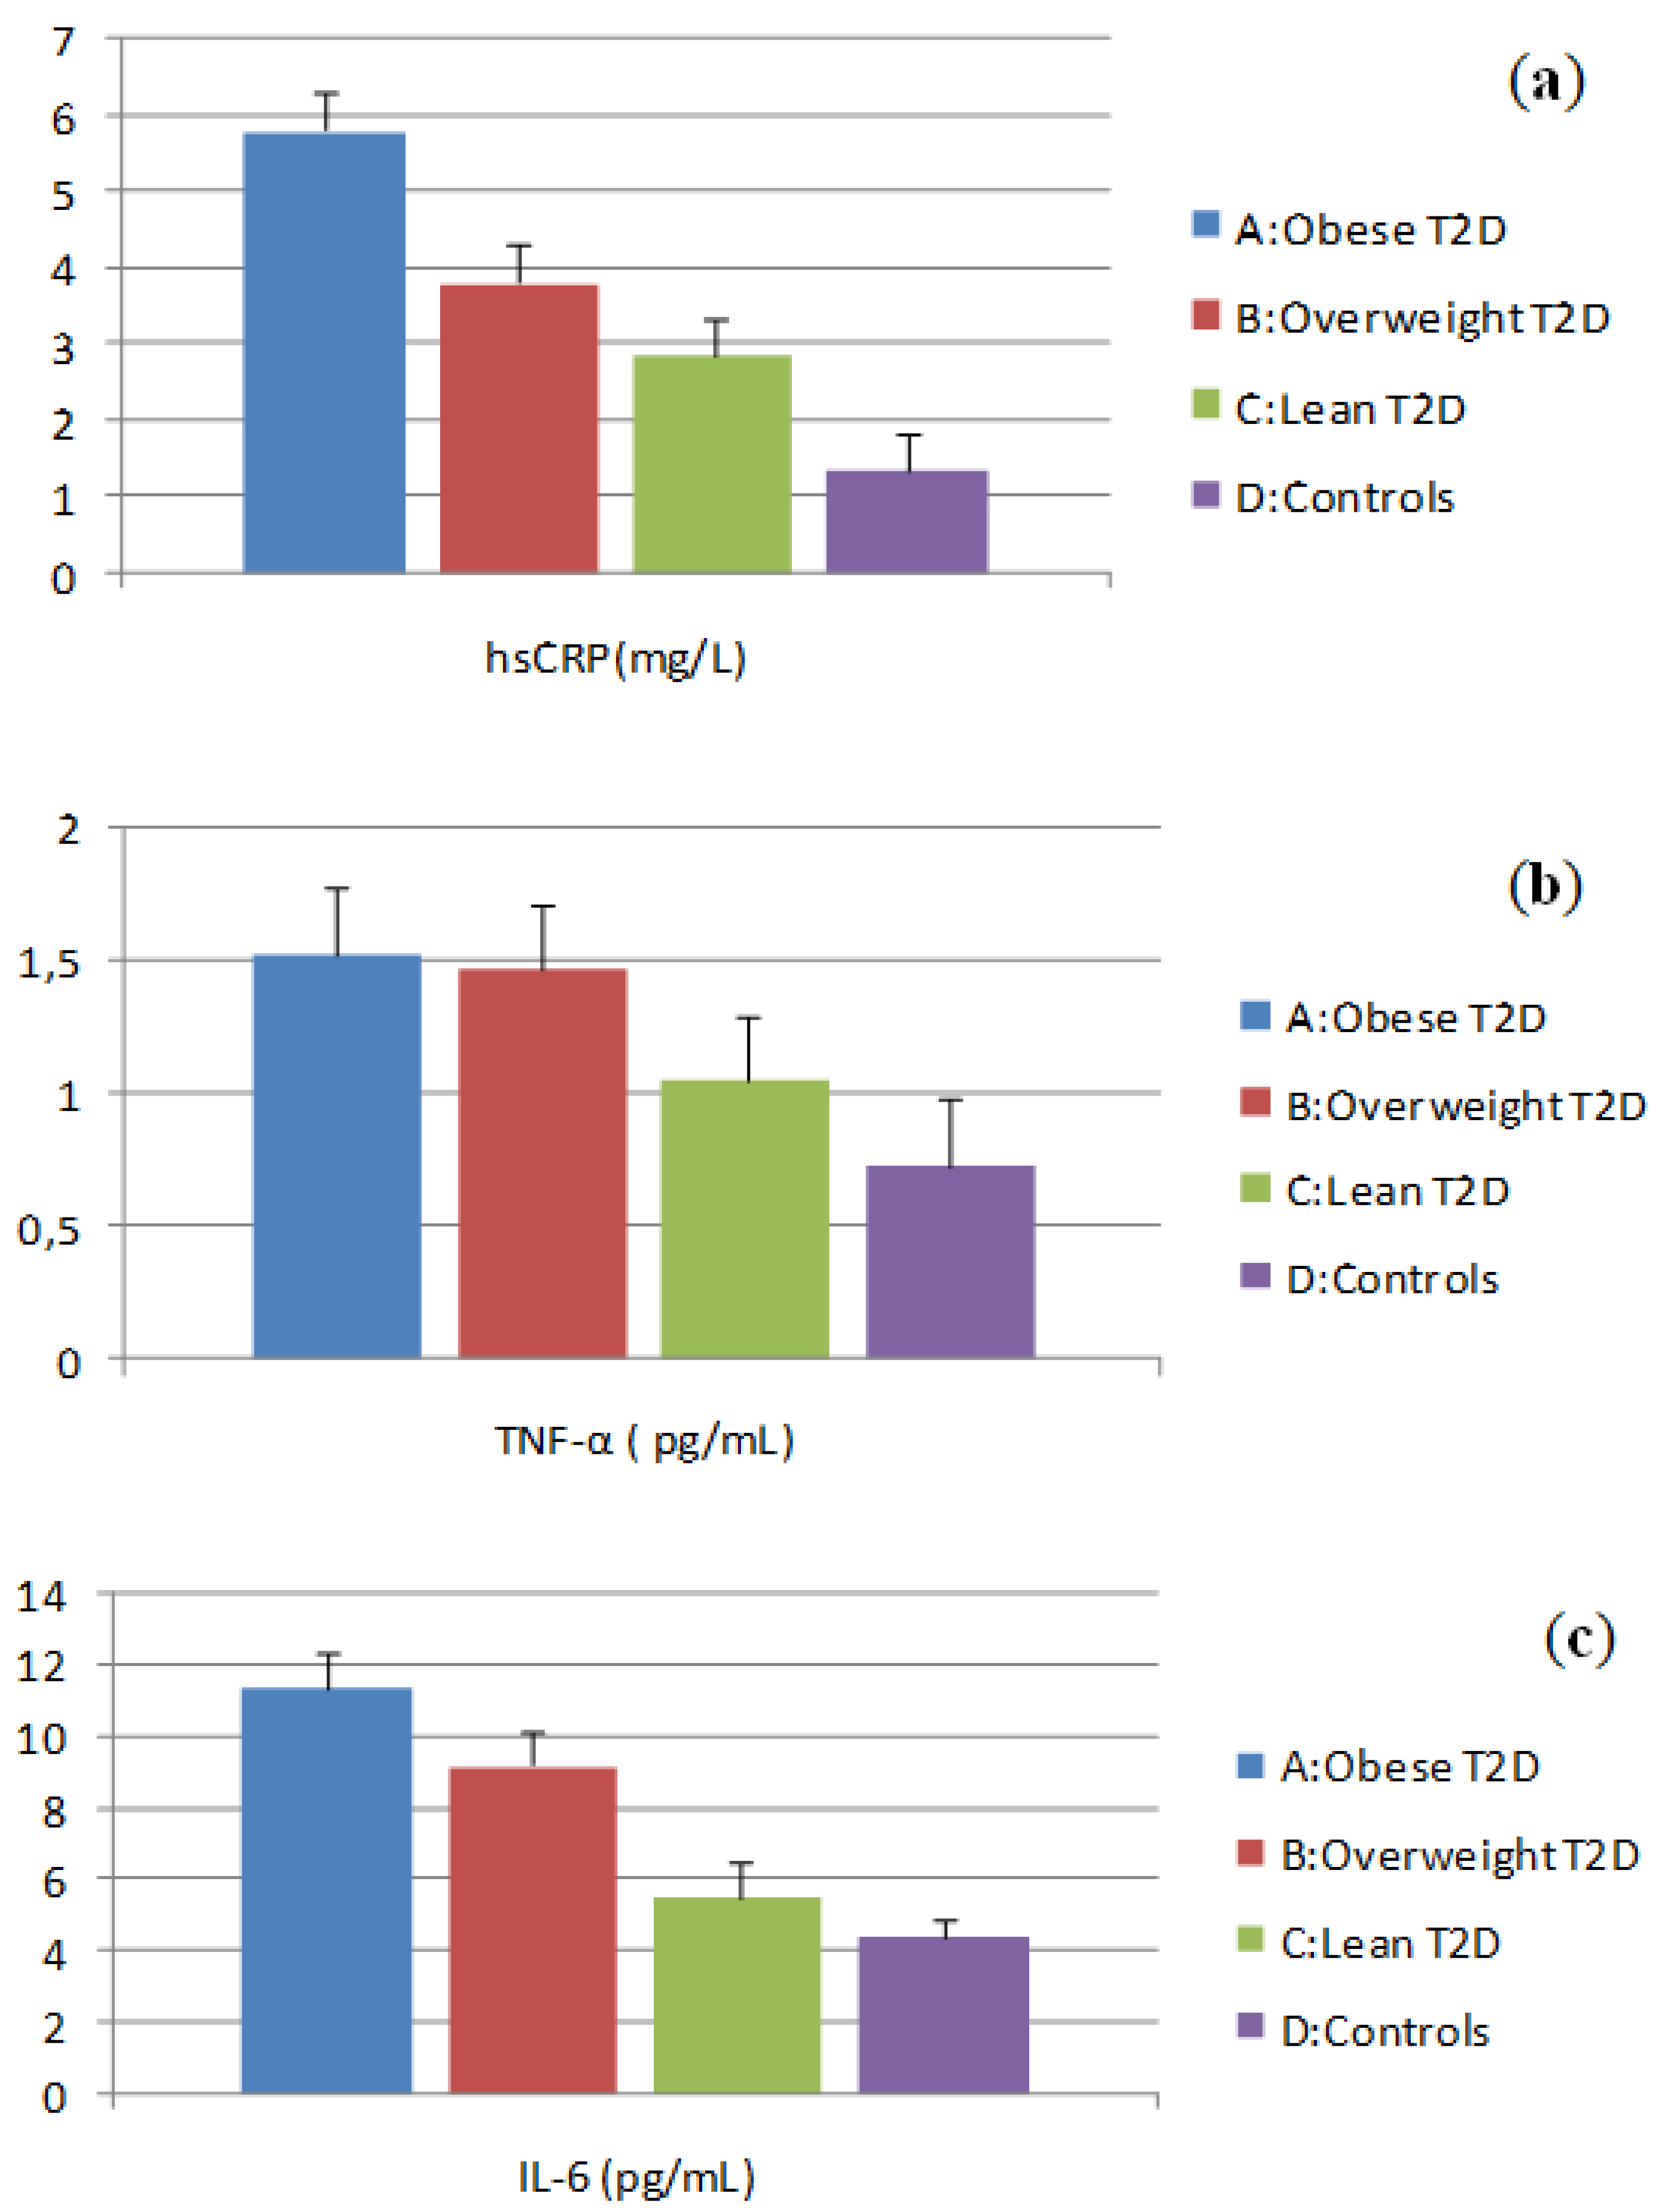
3.3. Evaluation of Inflammatory Marker Levels

Basal plasma levels of the inflammatory markers hsCRP, IL-6 and TNF-α are shown in Figure 3a–c. The highest levels of hsCRP were found in group A which differed significantly from group B. Both groups A and B had higher hsCRP levels compared with group C and there was a significant difference between group C and group D (Figure 3a).
The plasma TNF-α levels were the highest in group A and did not differ from group B. Group A and group B had higher TNF-α levels compared with group C, while the latter had significantly higher TNF-α levels compared to group D (Figure 3b).
Also, the highest IL-6 levels were found in group A, higher than in group B. Both groups A and B had higher IL-6 levels compared to group C. Group C IL-6 levels were not different from those in group D (Figure 3c).
Figure 3. (a) Plasma levels of hsCRP; (b) Plasma levels of TNF-α; (c) Plasma levels of IL-6.
Ijerph 11 04049 g003
Notes: In (a): A vs. B: p < 0.01; A, B vs. C: p < 0.05; C vs. D: p < 0.01; In (b): A vs. B: p = NS; A, B vs. C: p < 0.01; C vs. D: p < 0.05; In (c): A vs. B: p < 0.05; A, B vs. C: p < 0.01; C vs. D: = NS.

3.4. Correlations

Correlations between adipocytokine levels, inflammatory markers and the parameters of obesity are presented in Table 2. Bivariate correlation between adipocytokines and BMI, waist circumference and fat mass that included all the subjects showed a significant negative correlation between adiponectin and these parameters of obesity. Correlations between leptin and resistin levels and obesity parameters were significant and positive. Also, inflammatory markers and the parameters of obesity exhibited a significant positive correlation.
Table 2. Correlation between adipocytokines and inflammatory markers and parameters of obesity.
Adipocytokines and Inflammatory MarkersBMIWaistFat Mass
rprprp
Adiponectin−0.53˂0.01−0.60˂0.01−0.40˂0.01
Leptin0.58˂0.010.35˂0.010.65˂0.01
Resistin0.45˂0.010.43˂0.010.41˂0.01
TNF-α0.57˂0.010.55˂0.010.48˂0.01
IL-60.57˂0.010.50˂0.010.51˂0.01
hsCRP0.29˂0.010.20˂0.050.32˂0.01
For all the study participants, significance of the correlations between adipocytokine levels, inflammatory markers, plasma insulin levels and IR is presented in Table 3 and Table 4.
Among the adipocytokines, adiponectin showed a significant negative correlation with plasma insulin and HOMA-IR, while resistin exhibited a significant positive correlation with both plasma insulin and HOMA-IR. However, we could not demonstrate the significance of the correlation between leptin, plasma insulin and HOMA-IR (Table 3). Among the inflammatory markers, we found a significant positive correlation between hsCRP, TNF-α and IL-6 levels and plasma insulin and HOMA-IR (Table 4).
Table 3. Correlation between adipocytokines, inflammatory markers and insulin resistance.
Adipocytokinesand Inflammatory MarkersInsulinHOMA-IR
rprp
Adiponectin−0.55<0.01−0.57<0.01
Leptin0.24NS0.24NS
Resistin0.49<0.010.51<0.01
TNF-α0.50<0.010.54<0.01
IL-60.33<0.010.37<0.01
hsCRP0.31<0.010.33<0.01
When correlations between the levels of adipocytokines and inflammatory markers were analysed in T2D patients, a significant negative correlation was found only between adiponectin levels and TNF-α. Leptin levels showed a positive correlation with both IL-6 and hsCRP and resistin levels were in a significant positive correlation with TNF-α and IL-6 (Table 4).
Table 4. Correlation between adipocytokines and inflammatory markers in T2D patients.
Inflammatory MarkersAdiponectinLeptinResistin
rprprp
TNF-α−0.34<0.010.08NS0.26<0.05
IL-6−0.10NS0.35<0.010.34˂0.01
hsCRP−0.09NS0.43<0.010.49NS
To adjust for potential confounders we created multivariate regression models, adjusting for successively introduced covariates: BMI, fat mass, waist circumference, HOMA-IR and insulin level. After adjustment for BMI (R2 = 0.88) all the positive and negative significant correlations became non- significant except a negative correlation between TNF-α and adiponectin. Our findings indicate that the correlation between TNF-α and adiponectin is independent of obesity among diabetic patients and that the correlation of leptin and resistin with the inflammatory markers is obesity-dependent. With adjustment for waist circumference (R2 = 0.92) we got the same results as with adjustment for BMI, indicating that abdominal obesity as well as total obesity had a strong influence on the correlation between leptin and resistin and the inflammatory markers. When we created a multivariate linear model with FM as a potential confounder (R2 = 0.78), we found that all the positive and negative significant correlations between adipocytokines and the inflammatory markers became non-significant, pointing to a role of adipose tissue mass in the correlation between adipocytokines and inflammatory markers. However, after adjusting for HOMA-IR and insulin (R2 = 0.84) all associations became non-significant, which confirmed prior findings of the strong influence of insulin resistance as a background for the interplay of adipocytokines and inflammation.

3.5. Discussion

In this study, we analysed the impact of obesity and T2D on adipocytokines (adiponectin, leptin and resistin) and inflammatory markers (hsCRP, TNF-α and IL-6) which leads to increased risk for CVD and might be a target for preventive obesity-reducing intervention.
The present study confirmed previous findings that obesity and T2D are associated with low plasma adiponectin concentrations. Many studies have described a significant negative correlation between BMI and plasma adiponectin levels, as well as a negative correlation between adiponectin and percent body fat, waist-to-hip ratio and intra-abdominal fat [11,12,42]. Our findings indicate that non-obese T2D patients have lower plasma adiponectin levels when compared with matched non-obese normoglycemic control subjects. Moreover, increased body weight in diabetics makes hypo-adiponectinemia more evident even among overweight T2D patients. However, hypoadiponectinemia does not become more prominent with further increases in BMI in obese T2D, which is in concordance with a number of previous studies [12,38,43,44,45,46]. As far as IR is concerned, it has been demonstrated that plasma adiponectin concentrations correlate positively with insulin sensitivity and negatively with fasting plasma insulin concentrations [10,11,47] and in some studies this correlation was independent of obesity [48]. In our study, adiponectin was found to be correlated with IR and insulinemia. Our results show that the hypoadiponectinemia in patients with obesity and T2D is more related to diabetes; however, obesity among diabetic patients causes further decreases in the adiponectin level.
Many studies in the human population have shown that obesity is generally associated with elevated leptin levels in proportion to the degree of adiposity [16]. There are a lot of conflicting results regarding the increase or decrease in leptin levels among T2D patients [49,50]. In our study, no difference in leptin levels was found between non-obese T2D patients and non-obese controls. The highest concentrations of leptin were found among obese T2D patients, and a significant difference in leptin levels was discovered between overweight and obese T2D patients. In cross-sectional studies, elevated leptin levels have been associated with IR and other comorbidities that accompany obesity such as CVD [19,20,51]. A growing body of evidence suggests that either impaired or deficient leptin signaling results in the development of IR and impaired glucose metabolism [52,53]. In our study, leptin levels did not correlate with the parameters of IR. Our data confirmed that increased leptin levels in T2D patients were more related to the degree of adiposity than to the presence of T2D.
Over the past years, some studies in humans have examined the relationship of circulating resistin levels to obesity and diabetes [34,35]. The results of these studies have been contradictory and difficult to interpret due to inconsistencies in the target epitopes used in resistin assays, as well as in ethnicity and clinical background of the subjects investigated. We demonstrated that plasma resistin concentrations are higher in non-obese T2D patients when compared with healthy non-obese control subjects. Resistin levels rise in parallel with increases in BMI in overweight and obese T2D patients, but not in proportion to the degree of adiposity. Some studies have described the same results as ours, confirming higher circulating resistin levels in diabetic patients [42,54]. Several studies showed that increased resistin in T2D was not associated with markers of insulin resistance [22,23,55]. In contrast, Silha [56] as well as Al Harithy [57] reported the same results as we did, of a significant correlation between elevated resistin levels and the HOMA-IR index in patients with T2D. Our results show that in T2D patients elevated resistin levels are more related to the diabetic state and IR than to total adiposity.
In previous studies, elevated concentrations of CRP have been associated with obesity, diabetes and CVD [27,29]. The highest levels of hsCRP in our study were found in obese T2D patients and were higher in comparison to overweight, lean diabetic patients and the control group. In our study, hsCRP levels correlated with the parameters of IR. Our data confirmed that increased hsCRP levels in obese T2D patients were related to the presence of T2D as well as to the degree of total adiposity.
We found that plasma TNF-α levels were higher in lean T2D patients in comparison to lean healthy subjects. TNF-α levels were further increased in overweight and obese diabetic patients but not in proportion to the increase in total obesity. Furthermore, we demonstrated a correlation between TNF-α levels and the parameters of IR. Nilsson reported that the plasma TNF-α concentrations were increased in lean and in obese T2D patients [58], the same results as we found. Katsuki found that the serum TNF-α concentration was elevated in obese T2D, but not in lean T2D patients [59]. Zinman reported that the serum TNF-α concentration was elevated in T2D, but after adjustment for the severity of IR (HOMA-IR) it was not higher than in control subjects [60]. The Insulin Resistance Atherosclerosis Study (IRAS) confirmed that increased TNF-α levels in T2D were predominantly associated with IR, independently of adiposity [36]. We have shown that the elevated TNF-α levels in patients with obesity and T2D are more related to the diabetic state and IR than to the degree of obesity, however, obesity among diabetic patients further increases TNF-α levels.
It has been shown that adipose tissue is a source of circulating IL-6 and a significant relation of IL-6 to BMI and adipocyte size was demonstrated [6,7]. Increased plasma levels of IL-6 were reported in obese patients as well as in T2D [31,32,33]. We found the IL-6 levels were elevated among obese diabetic patients and were higher compare with overweight T2D patients. We did not find a difference in IL-6 levels between non-obese T2D patients and non-obese healthy subjects. Some authors have reported a correlation between IL-6 and IR [34] but others failed to find such a correlation [35]. In our study, IL-6 levels were correlated with the parameters of IR. Our data have shown that increased IL-6 levels in obese T2D patients are more related to the degree of adiposity than to the presence of T2D state.
Recent studies in type 2 diabetic patients demonstrated an inverse correlation between plasma adiponectin and inflammatory markers, including hsCRP [7,16]. In our study, we confirmed the prior findings of a negative correlation between adiponectin and TNF-α. We did not find a correlation between adiponectin levels and IL-6 and hsCRP. Moreover, the correlation between TNF-α and adiponectin was independent of obesity among our diabetic patients, as has been shown in some studies [44]. Some observational studies have suggested that leptin is associated with inflammatory markers independently of fat mass [61,62,63], while others have demonstrated that this relationship is not significant or becomes non-significant with careful control for measures of body fat [15,64]. In our study, we confirmed the significant association of obesity and the degree of obesity with leptin levels. Moreover, we showed a significant correlation between leptin levels and IL-6 and hsCRP among T2D patients and demonstrated that the correlation between leptin and the inflammatory markers is dependent on obesity. These findings indicate that leptin probably mediates the effects of obesity on inflammatory markers. We found a significant correlation between resistin levels and inflammatory markers among T2D patients and demonstrated that total obesity as well as abdominal obesity had a strong influence on the correlation between resistin and inlammatory markers. Shetty and coworkers showed that resistin’s associations with inflammatory markers in diabetic patients appear to be independent of the BMI [65].
This study provides a new data about the relationship between adipocytokines and inflammatory markers and the parameters of obesity, especially with regard to the subset of non-obese T2D patients. This subset represents only 10% of all Caucasian T2D patients, and according to our data exhibits specific characteristics compared to the obese and overweight T2D patients.

4. Conclusions

In conclusion, the present study showed that obesity might influence CVD risk though significant changes in adipocytokines and inflammatory markers in T2D patients. Correlation between leptin and resistin and the inflammatory markers was found to be highly dependent on obesity, in contrast to the one between adiponectin and TNF-α. Thus, leptin and resistin may represent the principal mediators of the impact of obesity on the inflammatory markers involved in cardiovascular risk in T2D patients.

Acknowledgments

This work was funded by project 175097 from the Ministry of Science, Republic of Serbia.

Authors Contributions

Natasa Rajkovic and Nebojsa M. Lalic designed the research process and conceived the whole paper. Miroslava Zamaklar, Katarina Lalic, Aleksandra Jotic, Ljiljana Lukic and Tanja Milicic gave important suggestions included into for the study design and the interpretation of the results. Natasa Rajkovic and Ljiljana Lukic analyzed the data. Sandra Singh and Ljubica Stosic, each of them, contributed to the tables and the figures. Natasa Rajkovic wrote the paper and Natasa Rajkovic and Nebojsa M. Lalic checked through the whole paper. Natasa Rajkovic and Nebojsa M. Lalic had full access to all of the data in the study and take responsibility for the integrity of the data and the accuracy of the data analysis and Nebojsa M. Lalic is the corresponding author.

Conflicts of Interest

The authors declare no conflict of interest.

References

  1. Eeg-Olofsson, K.; Cederholm, J.; Nilsson, P.M.; Zethelius, B.; Nunez, L.; Gudbjörnsdóttir, S.; Eliasson, B. Risk of cardiovascular disease and mortality in overweight and obese patients with type 2 diabetes: An observational study in 13,087 patients. Diabetologia 2009, 52, 65–73. [Google Scholar] [CrossRef]
  2. Kiadaliri, A.; Clarke, P.M.; Gerdtham, U.G.; Nilsson, P.; Eliasson, B.; Gudbjörnsdottir, S.; Steen, K.A. Predicting changes in cardiovascular risk factors in type 2 diabetes in the post-UKPDS era: Longitudinal analysis of the Swedish national diabetes register. Diabetes Res. 2013, 2013. [Google Scholar] [CrossRef]
  3. Gallagher, R.; Kirkness, A.; Zelestis, E.; Hollams, D.; Kneale, C.; Armari, E.; Bennett, T.; Daly, J.; Tofler, G. A randomised trial of a weight loss intervention for overweight and obese people diagnosed with coronary heart disease and/or type 2 diabetes. Ann. Behav. Med. 2012, 44, 119–128. [Google Scholar]
  4. Espeland, M.A.; Rejeski, W.J.; West, D.S.; Action for Health in Diabetes Research Group. Intensive weight loss intervention in older individuals: Results from the action for health in diabetes type 2 diabetes mellitus trial. J. Amer. Geriat. Soc. 2013, 61, 912–922. [Google Scholar] [CrossRef]
  5. Hwang, C.L.; Wu, Y.T.; Chou, C.H. Effect of aerobic interval training on exercise capacity and metabolic risk factors in people with cardiometabolic disorders: A meta-analysis. J. Cardiopulm. Rehabil. Prev. 2011, 31, 378–385. [Google Scholar] [CrossRef]
  6. Gustafson, B. Adipose tissue, inflammation and atherosclerosis. J. Atheroscler. Thromb. 2010, 17, 332–341. [Google Scholar] [CrossRef]
  7. Calle, M.C.; Fernandez, M.L. Inflammation and type 2 diabetes. Diabetes Metab. 2012, 38, 183–191. [Google Scholar] [CrossRef]
  8. Bastard, J.P.; Maachi, M.; Lagathu, C.; Kim, M.J.; Caron, M.; Vidal, H.; Capeau, J.; Feve, B. Recent advances in the relationship between obesity, inflammation, and insulin resistance. Eur. Cytokine Netw. 2006, 17, 4–12. [Google Scholar]
  9. Ouchi, N.; Kihara, S.; Funahashi, T.; Matsuzawa, Y.; Walsh, K. Obesity, adiponectin and vascular inflammatory disease. Curr. Opin. Lipidol. 2003, 14, 561–566. [Google Scholar] [CrossRef]
  10. Cnop, M.; Havel, P.J.; Utzschneider, K.M.; Carr, D.B.; Sinha, M.K.; Boyko, E.J.; Retzlaff, B.M.; Knopp, R.H.; Brunzell, J.D.; Kahn, S.E. Relationship of adiponectin to body fat distribution, insulin sensitivity and plasma lipoproteins: Evidence for independent roles of age and sex. Diabetologia 2003, 46, 459–469. [Google Scholar]
  11. Weyer, C.; Funahashi, T.; Tanaka, S.; Hotta, K.; Matsuzawa, Y.; Pratley, R.E.; Tataranni, P.A. Hypoadiponectinemia in obesity and type 2 diabetes: Close association with insulin resistance and hyperinsulinemia. J. Clin. Endocrinol. Metab. 2001, 86, 1930–1935. [Google Scholar] [CrossRef]
  12. Hotta, K.; Funahashi, T.; Arita, Y.; Arita, Y.; Takahashi, M.; Matsuda, M.; Okamoto, Y.; Iwahashi, H.; Kuriyama, H.; Ouchi, N.; et al. Plasma concentrations of a novel, adipose-specific protein, adiponectin, in type 2 diabetic patients. Arterioscler. Thromb. Vasc. Biol. 2000, 20, 1595–1599. [Google Scholar] [CrossRef]
  13. Ouchi, N.; Kihara, S.; Arita, Y.; Maeda, K.; Kuriyama, H.; Okamoto, Y.; Hotta, K.; Nishida, M.; Takahashi, M.; Nakamura, T.; et al. Novel modulator for endothelial adhesion molecules: Adipocyte-derived plasma protein adiponectin. Circulation 1999, 100, 2473–2476. [Google Scholar] [CrossRef]
  14. Deng, G.; Long, Y.; Yu, Y.R.; Li, M.R. Adiponectin directly improves endothelial dysfunction in obese rats through the AMPK-eNOS Pathway. Int. J. Obesity 2010, 34, 165–171. [Google Scholar] [CrossRef]
  15. Brennan, A.M.; Li, T.Y.; Kelesidis, I.; Gavrila, A.; Hu, F.B.; Mantzoros, C.S. Circulating leptin levels are not associated with cardiovascular morbidity and mortality in women with diabetes: A prospective cohort study. Diabetologia 2007, 50, 1178–1185. [Google Scholar] [CrossRef]
  16. Hajer, G.R.; van Haeften, T.W.; Visseren, F.L.J. Adipose tissue dysfunction in obesity, diabetes, and vascular diseases. Eur. Heart J. 2008, 29, 2959–2971. [Google Scholar] [CrossRef]
  17. Hartge, M.M.; Unger, T.; Kontscher, U. The endothelium and vascular inflammation in diabetes. Diab. Vasc. Res. 2007, 4, 84–88. [Google Scholar] [CrossRef]
  18. Qi, Q.; Wang, J.; Li, H.; Yu, Z.; Ye, X.; Hu, F.B.; Franco, O.H.; Pan, A.; Liu, Y.; Lin, X. Associations of resistin with inflammatory and fibrinolytic markers, insulin resistance, and metabolic syndrome in middle-aged and older Chinese. Eur. J. Endocrinol. 2008, 159, 585–593. [Google Scholar] [CrossRef]
  19. Wallace, A.M.; McMahon, A.D.; Packard, C.J.; Kelly, A.; Shepherd, J.; Gaw, A.; Sattar, N.; The WOSCOPS Executive Committee. Plasma leptin and the risk of cardiovascular disease in the west of Scotland coronary prevention study (WOSCOPS). Circulation 2001, 104, 3052–3056. [Google Scholar] [CrossRef]
  20. Wolk, R.; Berger, P.; Lennon, R.J.; Brilakis, E.S.; Johnson, B.D.; Somers, V.K. Plasma leptin and prognosis in patients with established coronary atherosclerosis. J. Amer. Coll. Cardiol. 2004, 44, 1819–1824. [Google Scholar] [CrossRef]
  21. Vozarova de Courten, B.; Degawa-Yamauchi, M.; Considine, R.V.; Tataranni, P.A. High serum resistin is associated with an increase in adiposity but not a worsening of insulin resistance in Pima Indians. Diabetes 2004, 53, 1279–1284. [Google Scholar] [CrossRef]
  22. Azuma, K.; Katsukawa, F.; Oguchi, S.; et al. Correlation between serum resistin level and adiposity in obese individuals. Obesity 2003, 11, 997–1001. [Google Scholar] [CrossRef]
  23. Youn, B.S.; YU, K.Y.; Park, H.J.; Roberts, C.K.; Manson, J.A.E.; Rifai, N.; Buring, J.E.; Gaziano, J.M.; Liu, S. Plasma resistin concentrations measured by enzyme-linked immunosorbent assay using a newly developed monoclonal antibody are elevated in individuals with type 2 diabetes mellitus. J. Clin. Endocrinol. Metab. 2004, 89, 150–156. [Google Scholar] [CrossRef]
  24. McTernan, P.G.; Fisher, F.M.; Valsamakis, G.; Chetty, R.; Harte, A.; MCternan, C.L.; Clark, P.M.S.; Smith, S.A.; Barnett, A.H.; Kumars, S. Resistin and type 2 diabetes: Regulation of resistin expression by insulin and rosiglitazone and the effects of recombinant resistin on lipid and glucose metabolism in human differentiated adipocytes. J. Clin. Endocrinol. Metab. 2003, 88, 6098–6106. [Google Scholar] [CrossRef]
  25. Heilbronn, L.K.; Rood, J.; Janderova, L.; Albu, J.B.; Kelley, D.E.; Ravussin, E.; Smith, S.R. Relationship between serum resistin concentrations and insulin resistance in nonobese, obese, and obese diabetic subjects. J. Clin. Endocrinol. Metab. 2004, 89, 1844–1848. [Google Scholar] [CrossRef]
  26. Reilly, M.P.; Lehrke, M.; Wolfe, M.L.; Rohatgi, A.; Lazar, M.A.; Rader, D.J. Resistin is an inflammatory marker of atherosclerosis in humans. Circulation 2005, 111, 932–939. [Google Scholar] [CrossRef]
  27. Devaraj, S.; Singh, U.; Jialal, I. The evolving role of C-reactive protein in atherothrombosis. Clin. Chem. 2009, 55, 229–238. [Google Scholar] [CrossRef]
  28. Bastard, J.P.; Maachi, M.; van Nhieu, T.J.; Jardel, C.; Bruckert, E.; Grimaldi, A.; Robert, J.J.; Capeau, J.; Hainque, B. Adipose tissue IL-6 content correlates with resistance to insulin activation of glucose uptake both in vivo and in vitro. J. Clin. Endocrinol Metab. 2002, 87, 2084–2089. [Google Scholar] [CrossRef]
  29. Pannacciulli, N.; Cantatore, F.P.; Minenna, A.; Bellacicco, M.; Giorgino, R.; de pergola, G. C–reactive protein is independetly associated with total body fat and insulin resistance in adult women. Int. J. Obesity 2001, 25, 1461–1420. [Google Scholar]
  30. Fontana, L.; Eagon, J.C.; Trujillo, M.E.; Scherer, P.E.; Klein, S. Visceral fat adipokine secretion is associated with systemic inflammation in obese humans. Diabetes 2007, 56, 1010–1013. [Google Scholar] [CrossRef]
  31. Sola, E.; Jover, A.; López-Ruiz, A.; Jarabo, M.; Vayá, A.; Morillas, C.; Gómez-Balaguer, M.; Hernández-Mijares, A. Parameters of inflammation in morbid obesity: Lack of effect of moderate weight loss. Obes. Surg. 2009, 19, 571–576. [Google Scholar] [CrossRef]
  32. Bastard, J.P.; Jardel, C.; Bruckert, E.; Blondy, P.; Capeau, J.; Laville, M.; Vidal, H.; Hainque, B. Elevated levels of interleukin 6 are reduced in serum and subcutaneous adipose tissue of obese women after weight loss. J. Clin. Endocrinol Metab. 2000, 85, 3338–3342. [Google Scholar]
  33. Ziccardi, P.; Nappo, F.; Giugliano, G.; Esposito, K.; Marfella, R.; Cioffi, M.; D’Andrea, F.; Molinari, A.M.; Giugliano, D. Reduction of inflammatory cytokine concentrations and improvement of endothelial functions in obese women after weight loss over one year. Circulation 2002, 105, 804–809. [Google Scholar] [CrossRef]
  34. Tilg, H.; Moschen, A.R. Inflammatory mechanisms in the regulation of insulin resistance. Mol. Med. 2008, 14, 222–231. [Google Scholar]
  35. Skalicky, J.; Muzakova, V.; Kandar, R.; Meloun, M.; Rousar, T.; Palicka, V. Evaluation of oxidative stress and inflammation in obese adults with metabolic syndrome. Clin. Chem. Lab. Med. 2008, 46, 499–505. [Google Scholar]
  36. Olson, C.N.; Callas, W.P.; Hanley, A.J.G.; Festa, A.; Haffner, S.M.; Wagenknecht, L.E.; Tracy, R.P. Circulating levels od TNF are associated with impaired glucose tolerance, icreased insulin reistance, and ethinicity: The insulin resistance atherosclerosis study. J. Clin. Endocrinol. Metab. 2012, 97, 1032–1040. [Google Scholar] [CrossRef]
  37. Bahceci, M.; Gokalp, D.; Bahceci, S.; Tuzcu, A.; Atmaca, S.; Arikan, S. The correlation between adiposity and adiponectin, tumor necrosis factor alpha, interleukin-6 and high-sensitivity C-reactive protein levels. Is adipocyte size associated with the inflammation in adults? J. Endocrinol. Invest. 2007, 30, 210–214. [Google Scholar]
  38. Skoog, T.; Dichtl, W.; Boquist, S.; Skoglund-Andersson, C.; Karpe, F.; Tang, R.; Bond, M.G.; de Faire, U.; Nilsson, J.; Eriksson, P.; Hamsten, A. Plasma tumour necrosis factor-alpha and early carotid atherosclerosis in healthy middle-aged men. Eur. Heart J. 2002, 23, 376–383. [Google Scholar] [CrossRef]
  39. World Health Organization (WHO). Definition and Diagnosis of Diabetes Mellitus and Intermediate Hyperglycemia: Report of a WHO/IDF Consultation; WHO: Geneva, Switzerland, 2006. [Google Scholar]
  40. National Committee for the Clinical Guidelines for Good Clinical Practice. Group for Diabetes. Nacionalni Vodič Dobre Kliničke Prakse Diabetes Mellitus; Agencija za Akreditaciju Zdravstvenih Ustanova Srbije: Beograd, Serbia, 2012. [Google Scholar]
  41. Matthews, D.R.; Hosker, J.P.; Rudenski, A.S. Homeostasis model assessment: Insulin resistance and beta cell function from fasting plasma glucose and insulin concentrations in man. Diabetologia 1985, 13, 412–419. [Google Scholar] [CrossRef]
  42. Goto, M.; Goto, A.; Morita, A; Deura, K.; Sasaki, S.; Aiba, N.; Shimbo, T.; Terauchi, Y.; Miyachi, M.; Noda, M.; Watanabe, S.; Saku Cohort Study Group. Low-molecular-weight adiponectin and high-molecular-weight adiponectinlevels in relation to diabetes. Obesity 2013, 1. [Google Scholar] [CrossRef]
  43. Hasegawa, G.; Ohta, M.; Ichida, Y.; Obayashi, H.; Shigeta, M.; Yamasaki, M.; Fukui, M.; Yoshikawa, T.; Nakamura, N. Increased serum resistin levels in patients with type 2 diabetes are not linked with markers of insulin resistance and adiposity. Acta Diabetol. 2005, 42, 104–109. [Google Scholar] [CrossRef]
  44. Hansen, D.; Dendale, P.; Beelen, M.; Jonkers, R.A.; Mullens, A.; Corluy, L.; Meeusen, R.; van Loon, L.J. Plasma adipokine and inflammatory marker concentrations are altered in obese, as opposed to non-obese, type 2 diabetes patients. Eur. J. Appl. Physiol. 2010, 109, 397–404. [Google Scholar] [CrossRef]
  45. Marita, A.R.; Sarkar, J.A.; Rane, S. Type 2 diabetes in non-obese Indian subjects is associated with reduced leptin levels: Study from Mumbai, western India. Mol. Cell. Biochem. 2005, 275, 143–151. [Google Scholar] [CrossRef]
  46. Yang, Y.; Lu, H.L.; Zhang, J.; Yu, H.Y.; Wang, H.W.; Zhang, M.X.; Cianflone, K. Relationships among acylation stimulating protein, adiponectin and complement C3 in lean vs. obese type 2 diabetes. Int. J. Obesity 2006, 30, 439–446. [Google Scholar] [CrossRef]
  47. Gao, H.; Fall, T.; van Dam, R.M.; Flyvbjerg, A.; Zethelius, B.; Ingelsson, E.; Hägg, S. Evidence of a causal relationship between adiponectin levels and insulin sensitivity: A Mendelian randomization study. Diabetes 2013, 62, 1338–1344. [Google Scholar] [CrossRef]
  48. Abdelgadir, M.; Karlsson, A.F.; Berglund, L.; Berne, C. Low serum adiponectin concentrations are associated with insulin sensitivity independent of obesity in Sudanese subjects with type 2 diabetes mellitus. Diabetol. Metab. Synd. 2013, 5((1)), 15. [Google Scholar] [CrossRef]
  49. Sayeed, M.A.; Khan, A.K.A.; Mahtab, H.; Ahsan, K.A.; Banu, A.; Khanam, P.A.; Ahrén, B. Leptin is reduced in lean subjects with type 2 diabetes in Bangladesh. Diabetes Care 2003, 26. [Google Scholar] [CrossRef]
  50. Mohammadzadeh, G.; Zarghami, N. Serum leptin level is reduced in non-obese subjects with type 2 diabetes. Int. J. Endocrinol. Metab. 2013, 11, 3–10. [Google Scholar]
  51. Mattu, H.S.; Randeva, H.S. Role of adipokines in cardiovascular disease. J. Endocrinol. 2013, 216, 17–36. [Google Scholar] [CrossRef]
  52. Morton, G.J.; Gelling, R.W.; Niswender, K.D.; Morrison, C.D.; Rhodes, C.J.; Schwartz, M.W. Leptin regulates insulin sensitivity via phosphatidylinositol-3-OH kinase signaling in mediobasal hypothalamic neurons. Cell. Metab. 2005, 2, 411–420. [Google Scholar] [CrossRef]
  53. German, P.J.; Wisse, B.E.; Thaler, J.P.; Oh-I, S.; Sarruf, D.A.; Ogimoto, K.; Kaiyala, K.J.; Fischer, J.D.; Matsen, M.E.; Taborsky, G.J., Jr.; Schwartz, M.W.; Morton, G.J. Leptin deficiency causes insulin resistance induced by uncontrolled diabetes. Diabetes 2010, 59, 1626–1634. [Google Scholar] [CrossRef]
  54. Chanchay, S.; Tungtrongchitr, R.; Harnroongroj, T.; Phonrat, B.; Rungseesakorn, O.; Paksanont, S.; Pooudong, S.; Saowakontha, S.; Varongchayakul, C. Plasma resistin, insulin concentration in non-diabetic and diabetic, overweight/obese Thai. Int. J. Vitam. Nutr. Res. 2006, 76, 125–131. [Google Scholar] [CrossRef]
  55. Lee, J.H.; Chan, J.L.; Yiannakouris, N.; Kontogianni, M.; Estrada, E.; Seip, R.; Orlova, C.; Mantzoros, C.S. Circulating resistin levels are not associated with obesity or insulin resistance in humans and are not regulated by fasting or leptin administration: Cross-sectional and interventional studies in normal, insulin-resistant, and diabetic subjects. J. Clin. Endocrinol. Metab. 2003, 88, 4848–4856. [Google Scholar] [CrossRef]
  56. Silha, J.V.; Krsek, M.; Skrha, J.V.; Sucharda, P.; Nyomba, B.L.; Murphy, L.J. Plasma resistin, adiponectin and leptin levels in lean and obese subjects: Correlations with insulin resistance. Eur. J. Endocrinol. 2003, 149, 331–335. [Google Scholar] [CrossRef]
  57. Al Harithy, R.N.; Al Ghamdi, S. Serum resistin, adiposity and insulin resistance in Saudi women with type 2 diabetes mellitus. Ann. Saudi Med. 2005, 25, 283–287. [Google Scholar]
  58. Nilsson, J.; Jovinge, S.; Niemann, A.; Reneland, R.; Lithell, H. Relationship between plasma tumor necrosis factor α and insulin sensitivity in elderly men with non-insulin-dependent diabetes mellitus. Arterioscler. Thromb. Vasc. Biol. 1998, 18, 1199–1202. [Google Scholar] [CrossRef]
  59. Katsuki, A.; Sumida, Y.; Murashima, S.; Murata, K.; Takarada, Y.; Ito, K.; Fujii, M.; Tsuchihashi, K.; Goto, H.; Nakatani, K.; Yano, Y. Serum levels of tumor necrosis factor-α are increased in obese patients with noninsulin-dependent diabetes mellitus. J. Clin. Endocrinol. Metab. 1998, 83, 859–862. [Google Scholar]
  60. Zinman, B.; Hanley, A.J.G.; Harris, S.B.; Kwan, J.; Fantus, I.G. Circulating tumor necrosis factor-αconcentrations in a native Canadian population with high rates of type 2 diabetes mellitus. J. Clin. Endocrinol. Metab. 1999, 84, 272–278. [Google Scholar]
  61. Shamsuzzaman, A.S.; Winnicki, M.; Wolk, R.; Svatikova, A.; Phillips, B.G.; Davison, D.E.; Berger, P.B.; Somers, V.K. Independent association between plasma leptin and C-reactive protein in healthy humans. Circulation 2004, 109, 2181–2185. [Google Scholar] [CrossRef]
  62. Van Dielen, F.M.; van’t Veer, C.; Schols, A.M.; Soeters, P.B.; Buurman, W.A.; Greve, J.W. Increased leptin concentrations correlate with increased concentrations of inflammatory markers in morbidly obese individuals. Int. J. Obes. Relat. Metab. Disord. 2001, 25, 1759–1766. [Google Scholar] [CrossRef]
  63. Gomez-Ambrosi, J.; Salvador, J.; Paramo, J.A.; Orbe, J.; de Irala, J.; Diez-Caballero, A.; Gil, M.J.; Cienfuegos, J.A.; Frühbeck, G. Involvement of leptin in the association between percentage of body fat and cardiovascular risk factors. Clin. Biochem. 2002, 35, 315–320. [Google Scholar] [CrossRef]
  64. Gomez-Ambrosi, J.; Salvador, J.; Silva, C.; Rotellar, F.; Gil, M.J.; Cienfuegos, J.A.; Frühbeck, G. Leptin therapy does not affect inflammatory markers. J. Clin. Endocrinol. Metab. 2005, 90, 3803. [Google Scholar]
  65. Shetty, G.K.; Economides, P.A.; Horton, E.S.; Mantzoros, C.S.; Veves, A. Circulating adiponectin and resistin levels in relation to metabolic factors, inflammatory markers, and vascular reactivity in diabetic patients and subjects at risk for diabetes. Diabetes Care 2004, 27, 2450–2457. [Google Scholar] [CrossRef]

