Urinary Concentrations of Toxic and Essential Trace Elements among Rural Residents in Hainan Island, China

 and
and
Abstract
:1. Introduction
2. Material and Methods
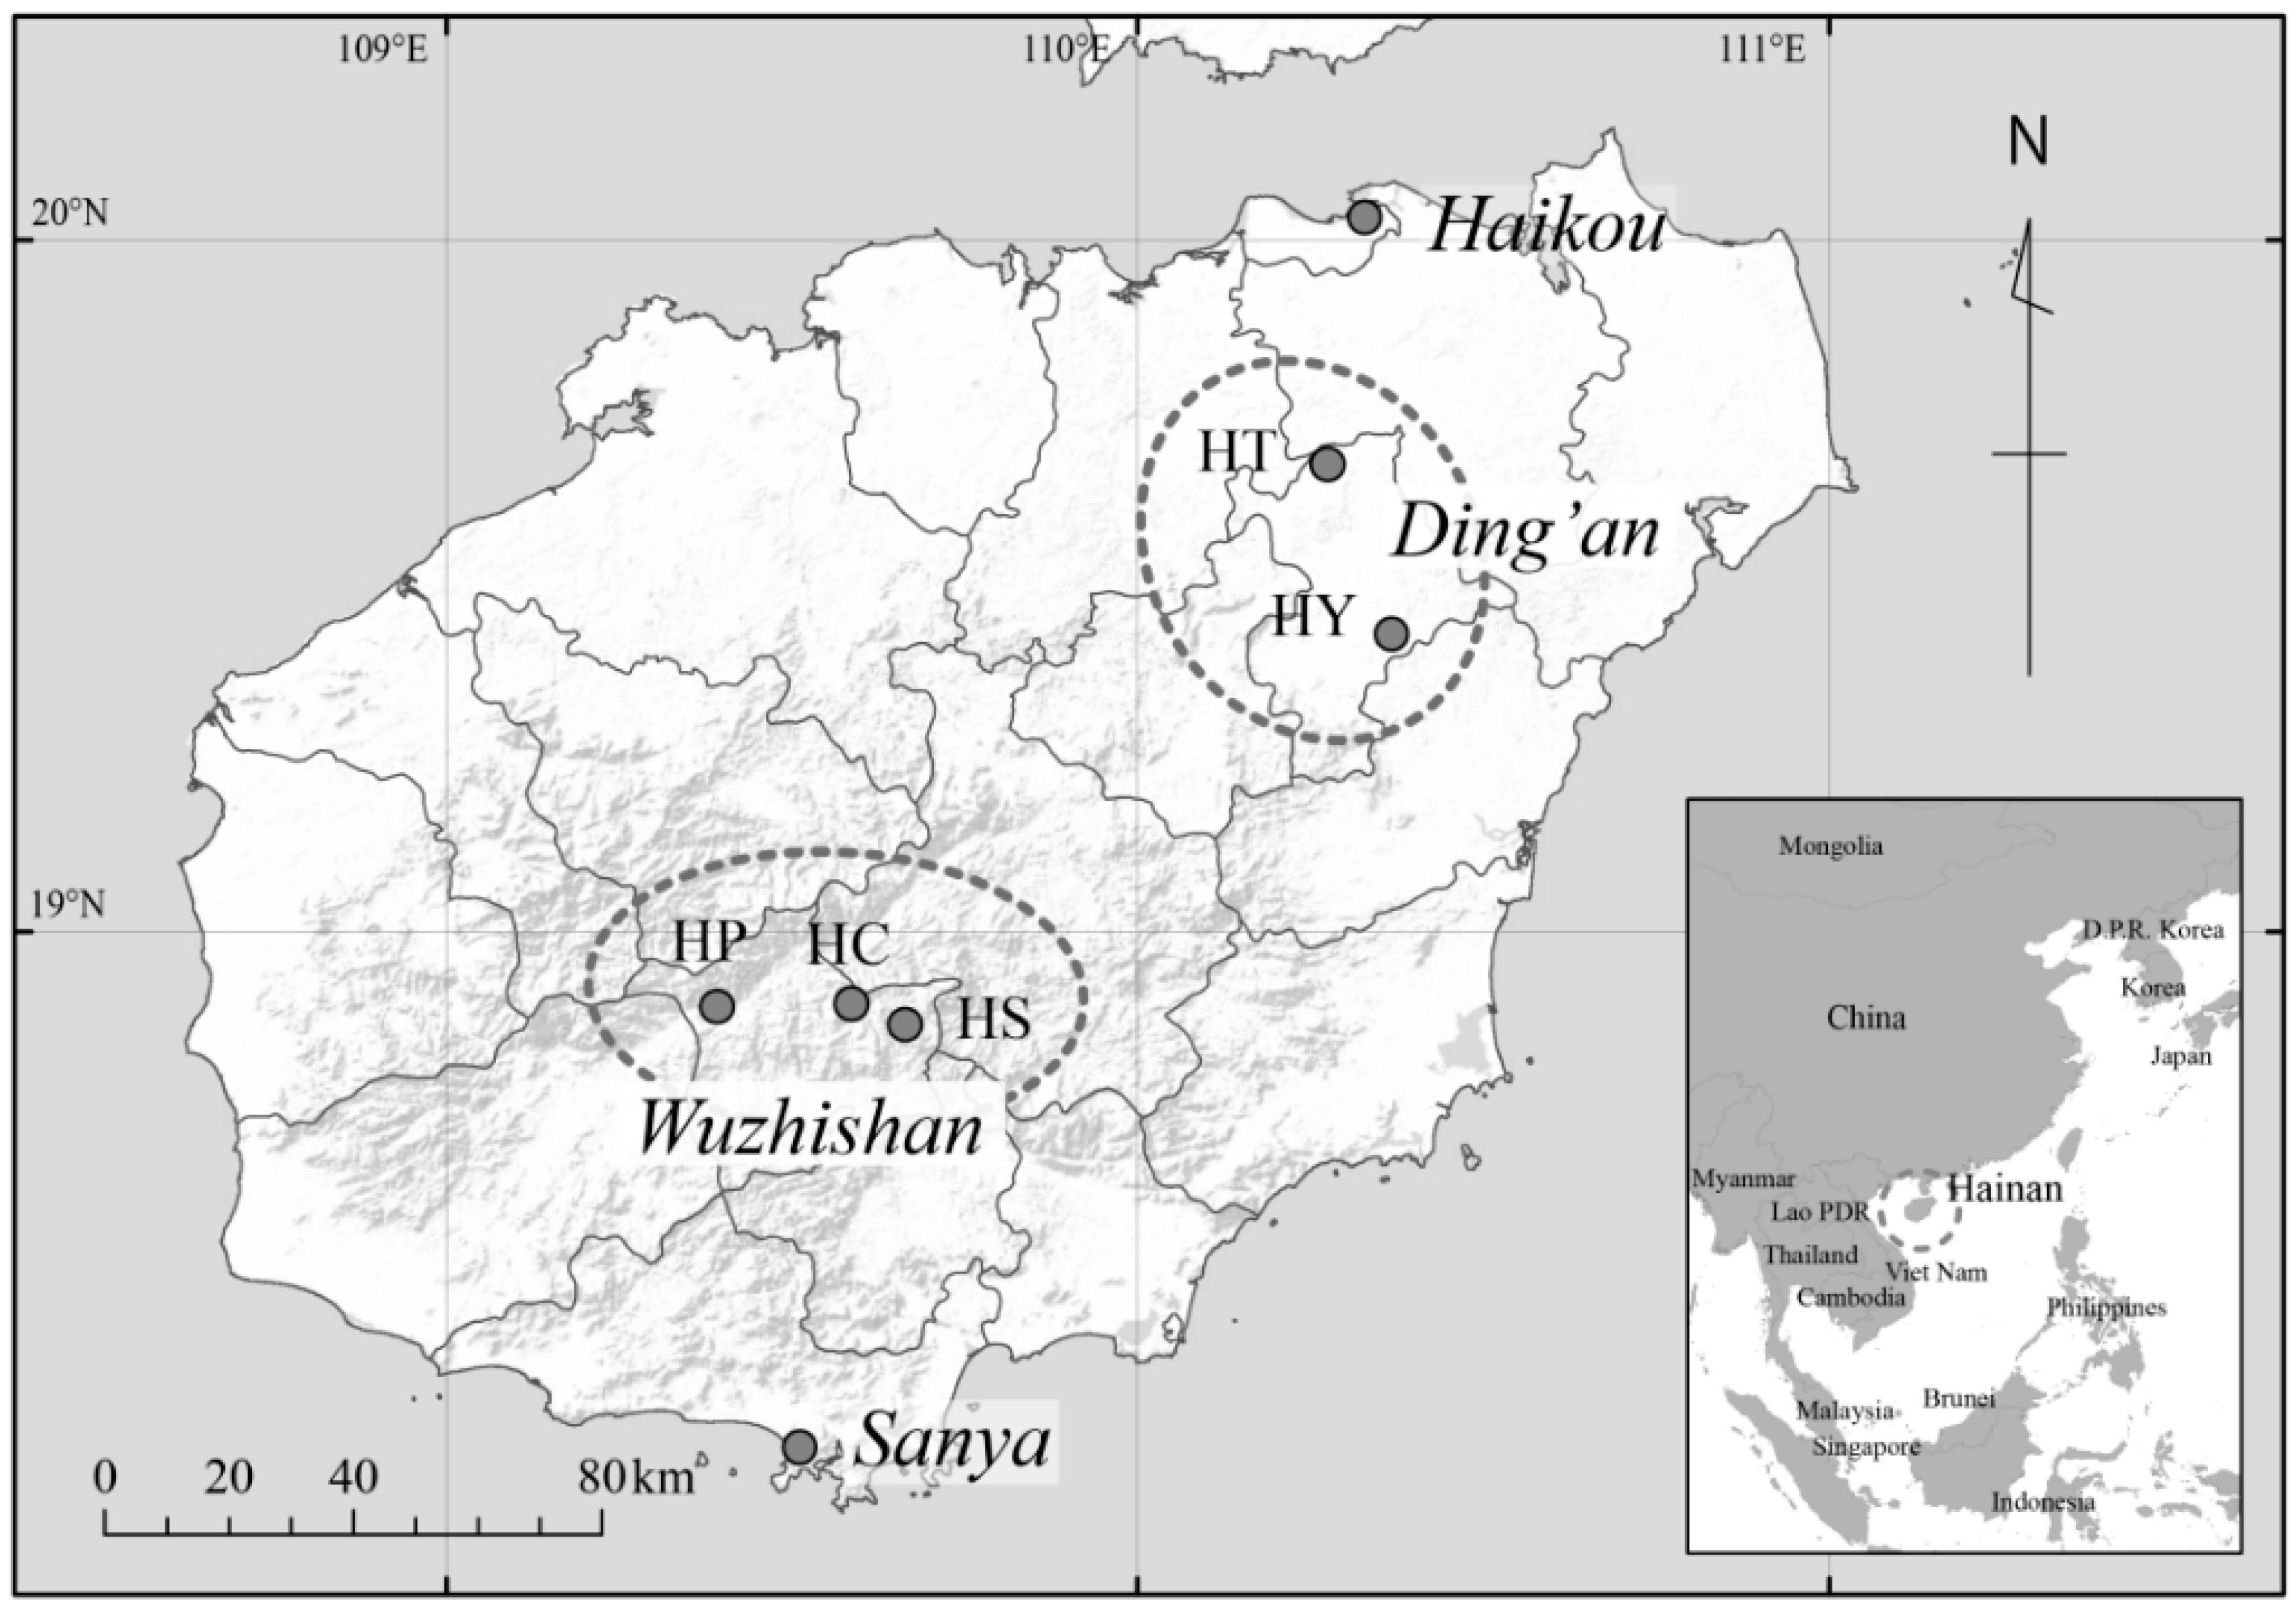
2.1. Study Communities

| Characteristics | HC (n = 64) | HP (n = 38) | HY (n = 91) | HT (n = 104) | HS (n = 40) | |||||
|---|---|---|---|---|---|---|---|---|---|---|
| n | [%] | n | [%] | n | [%] | n | [%] | n | [%] | |
| Housing Type b | ||||||||||
| Concrete | 0 | [0] | 6 | [15.8] | 9 | [9.9] | 30 | [29.1] | 15 | [37.5] |
| Chinese-Tiled | 0 | [0] | 1 | [2.6] | 82 | [90.1] | 72 | [69.9] | 22 | [55.0] |
| Traditional | 59 | [100] | 31 | [81.6] | 0 | [0.0] | 1 | [1.0] | 3 | [7.5] |
| Toilet c | ||||||||||
| Inside | 1 | [1.6] | 3 | [8.1] | 62 | [68.9] | 77 | [74.8] | 35 | [92.1] |
| Outside | 61 | [98.4] | 34 | [91.9] | 28 | [31.1] | 26 | [25.2] | 3 | [7.9] |
2.2. Field Survey
2.3. Measurement of Toxic and Trace Elements
2.4. Statistical Analysis
2.5. Research Ethics
3. Results
| Variables | Mean | SD | n | % | |
|---|---|---|---|---|---|
| Continuous Variables | |||||
| Age (years) | 44.4 | 13.3 | |||
| Body Mass Index (kg/m2) | 20.8 | 2.7 | |||
| Creatinine (g/L) | 1.19 | 0.76 | |||
| Sex | |||||
| Male | 270 | 45.1 | |||
| Education | |||||
| < 9 years | 200 | 33.4 | |||
| 9 years | 344 | 57.4 | |||
| > 9 years | 55 | 9.2 | |||
| Agrochemical use in the previous month | |||||
| Yes | 356 | 59.4 | |||
| Current Smoking | |||||
| Yes | 190 | 31.7 | |||
| Elements | 5th Percentile | 25th Percentile | Median | 75th Percentile | 95th Percentile |
|---|---|---|---|---|---|
| Toxic Elements | |||||
| As | 22.5 | 43.1 | 73.2 | 122.7 | 263.1 |
| Cd | 0.71 | 1.20 | 1.79 | 2.60 | 5.24 |
| Pb | 1.29 | 2.12 | 3.09 | 4.93 | 10.14 |
| Trace Elements | |||||
| Se | 17.9 | 27.2 | 36.5 | 52.3 | 90.1 |
| Zn | 126 | 250 | 371 | 524 | 981 |
| Cu | 4.6 | 7.9 | 11.0 | 16.1 | 37.4 |
| As | Cd | Pb | Se | Zn | Cu | ||||||||
|---|---|---|---|---|---|---|---|---|---|---|---|---|---|
| Coef. | p-value | Coef. | p-value | Coef. | p-value | Coef. | p-value | Coef. | p-value | Coef. | p-value | ||
| Fixed effect (Individual level) | |||||||||||||
| Age | 0.004 | < 0.001 | 0.006 | < 0.001 | 0.002 | 0.068 | < 0.001 | 0.554 | 0.003 | 0.004 | 0.002 | 0.032 | |
| Sex (ref = Male) | Female | 0.064 | 0.018 | 0.107 | < 0.001 | 0.007 | 0.769 | 0.064 | 0.001 | −0.062 | 0.017 | 0.039 | 0.110 |
| BMI | −0.002 | 0.714 | −0.013 | 0.002 | −0.005 | 0.239 | 0.003 | 0.299 | −0.004 | 0.323 | −0.007 | 0.094 | |
| Education a | 9 years | 0.051 | 0.149 | −0.047 | 0.127 | −0.007 | 0.828 | −0.025 | 0.285 | 0.030 | 0.379 | −0.027 | 0.390 |
| (ref < 9 years) | > 9 years | 0.004 | 0.867 | 0.015 | 0.462 | 0.013 | 0.553 | −0.003 | 0.875 | 0.028 | 0.225 | −0.010 | 0.637 |
| Involvement in the market economy b | 0.018 | 0.495 | 0.032 | 0.158 | 0.050 | 0.031 | 0.054 | 0.003 | 0.040 | 0.117 | 0.024 | 0.317 | |
| Fixed effect (Community level) | |||||||||||||
| Community-level development c | 0.023 | 0.561 | 0.067 | 0.025 | 0.027 | 0.516 | 0.049 | 0.131 | −0.036 | 0.539 | −0.001 | 0.985 | |
| Ethnicity (ref = Han) | 0.267 | 0.109 | 0.072 | 0.140 | −0.086 | 0.479 | −0.102 | 0.212 | 0.030 | 0.854 | −0.052 | 0.715 | |
| Random effect | Var. | Var. | Var. | Var. | Var. | Var. | |||||||
| Individual level | 0.079 | 0.061 | 0.060 | 0.035 | 0.072 | 0.063 | |||||||
| Community level | 0.009 | < 0.001 | 0.010 | 0.003 | 0.021 | 0.016 | |||||||
| Intra-class correlation (%) | 10.5 | 0.4 | 14.5 | 7.9 | 22.5 | 20.4 | |||||||
4. Discussion
4.1. Comparison of Urinary Levels with Previous Reports
| Element | Country | n | Geometric Mean | Arithmetic Mean | Median | Ref. |
|---|---|---|---|---|---|---|
| As | China (Hainan) | 531 | 73.2 | 97.1 | 73.2 | This study |
| General Populations | ||||||
| Japan | 210 | 114.9 | [34] | |||
| USA | 13516 | 25.1 | 20.1 | [35] | ||
| UK, Healthy volunteers (Asian) | 21 | 20.6 | 15.4 | [36] | ||
| UK, Healthy volunteers (Somali) | 22 | 7.2 | 6.5 | [36] | ||
| UK, Healthy volunteers (White) | 20 | 24.5 | 17.6 | [36] | ||
| Spain, Ria of Huelva | 818 | 1.44 | 2.03 | 1.63 | [37] | |
| Spain, Other Andalusian cities | 816 | 1.26 | 2.05 | 1.5 | [37] | |
| Vulnerable and Other Populations | ||||||
| USA/Mexico, Seasonal Farm Workers | 258 | 13.2 | 10.7 | [38] | ||
| Mexico (Morales) | 41 | 62.91 | [5] | |||
| Mexico (Martinez) | 39 | 40.28 | [5] | |||
| China (Guizhou), Polluted | 122 | 288.4 | [39] | |||
| China (Guizhou), Control | 123 | 56.23 | [39] | |||
| China, High exposure | 10 | 58.3 | [40] | |||
| China, Low exposure | 35 | 23.4 | [40] | |||
| China, Exposed subjects | 113 | 192.2 | [41] | |||
| China, Control site | 30 | 63.6 | [41] | |||
| Taiwan, Polluted, Male | 489 | 80.1 | [42] | |||
| Taiwan, Polluted, Female | 554 | 88.6 | [42] | |||
| Bangladesh, Village A, Male | 64 | 204 | [23] | |||
| Bangladesh Village A, Female | 108 | 219 | [23] | |||
| Bangladesh Village B, Male | 69 | 126 | [23] | |||
| Bangladesh Village B, Female | 121 | 174 | [23] | |||
| Bangladesh, Male | 4138 | 229.8 | [43] | |||
| Bangladesh, Female | 6264 | 297.6 | [43] | |||
| Bangladesh, Adult | 922 | 77 | [44] | |||
| Cd | China (Hainan) | 522 | 1.9 | 2.6 | 1.8 | This study |
| General Populations | ||||||
| USA | 4224 | 0.4 | 0.3 | [35] | ||
| USA (non-smoker), Age: 20–39, Male | 0.125 | [25] | ||||
| USA (non-smoker), Age: 20–39, Female | 0.179 | [25] | ||||
| USA (non-smoker), Age: 40–59, Male | 0.208 | [25] | ||||
| USA (non-smoker), Age: 20–39, Female | 0.342 | [25] | ||||
| USA (non-smoker), Age: 60+, Male | 0.366 | [25] | ||||
| USA (non-smoker), Age: 60+, Female | 0.507 | [25] | ||||
| Czech Republic, Adult | 657 | 0.29 | 0.31 | [45] | ||
| USA, Male | 6558 | 0.28 | [46] | |||
| USA, Female | 7398 | 0.4 | [46] | |||
| Spain (Ria of Huelva), Age: 18–69 | 818 | 0.49 | 0.65 | 0.57 | [37] | |
| Spain (Other Andalusian cities) | 816 | 0.57 | 0.74 | 0.63 | [37] | |
| Vulnerable and Other Populations | ||||||
| USA/Mexico, Seasonal Farm Workers | 258 | 0.20 | 0.2 | [35] | ||
| China, Exposed | 75 | 2.62 | [47] | |||
| China, Exposed | 80 | 1.64 | [47] | |||
| China, Non-exposed | 132 | 0.89 | [47] | |||
| China (Guizhou), Control | 123 | 0.86 | [39] | |||
| China (Guizhou), Polluted | 122 | 2.16 | [39] | |||
| Belgium, Far from incinerator plant | 63 | 0.49 | [48] | |||
| Belgium, Near incinerator plant 1 | 51 | 0.62 | [48] | |||
| Belgium, Near incinerator plant 2 | 33 | 0.43 | [48] | |||
| Spain, Incinerator plant—Far (1st) | 40 | 0.23 | [49] | |||
| Spain, Incinerator plant—Near (1st) | 46 | 0.37 | [49] | |||
| Spain, Incinerator plant—Far (2nd) | 46 | 0.23 | [49] | |||
| Spain, Incinerator plant—Near (2nd) | 52 | 0.35 | [49] | |||
| Spain, General Population | 165 | 0.25 | 0.23 | [50] | ||
| Occupational Exposure | 161 | 0.12 | 0.25 | 0.18 | [51] | |
| Pb | China (Hainan) | 526 | 3.3 | 4.3 | 3.1 | This study |
| General Populations | ||||||
| USA | 12092 | 1.6 | 1.2 | [35] | ||
| Spain, General Population | 165 | 1.11 | 1.05 | [50] | ||
| Vulnerable and Other Populations | ||||||
| USA/Mexico; Seasonal Farm Workers | 258 | 1.26 | 1.1 | [38] | ||
| Japan, Male (1985) | 159 | 3.17 | [52] | |||
| Japan, Male (1993) | 155 | 1.78 | [52] | |||
| Japan, Male (1998) | 156 | 1.04 | [52] | |||
| Japan, Female (1985) | 118 | 3.35 | [52] | |||
| Japan, Female (1993) | 157 | 2.26 | [52] | |||
| Japan, Female (1998) | 155 | 1.15 | [52] | |||
| Occupational Exposure | 161 | 12.75 | 22.28 | 9.42 | [35] | |
| Japan, Occupational Exposure | 257 | 87 | [26] | |||
| Se | China (Hainan) | 529 | 38.3 | 44.7 | 36.5 | This study |
| General Populations | ||||||
| USA | 114 | 83.6 | 76.6 | [35] | ||
| Vulnerable and Other Populations | ||||||
| Heroin Abuser | 48 | 18.82 | [53] | |||
| Healthy Control | 53 | 24.3 | [53] | |||
| Zn | China (Hainan) | 528 | 359 | 470 | 371 | This study |
| General Populations | ||||||
| USA | 2369 | 371.5 | 297.7 | [35] | ||
| Spain (Urban + Rural) | 434 | 698.7 | [54] | |||
| Cu | China (Hainan) | 528 | 11.6 | 15.1 | 11.0 | This study |
| General Populations | ||||||
| USA | 4648 | 22.5 | 16.0 | [35] | ||
| Spain (Ria of Huelva) | 818 | 8.4 | 11.7 | 8.9 | [37] | |
| Spain (Other Andalusia cities) | 816 | 8.6 | 12.6 | 9.0 | [44] | |
| Spain (Urban + Rural) | 434 | 26.6 | [54] |
4.2. Explanatory Variables for Element Concentrations
4.3. Limitations
5. Conclusions
Acknowledgments
Author Contributions
Conflicts of Interest
References
- Arsenic, Metals, Fibres, and Dusts; International Agency for Research on Cancer (IARC): Lyon, France, 2012.
- Inorganic and Organic Lead Compounds; IARC: Lyon, France, 2006.
- Abernathy, C.O.; Liu, Y.P.; Longfellow, D.; Aposhian, H.V.; Beck, B.; Fowler, B.; Goyer, R.; Menzer, R.; Rossman, T.; Thompson, C.; et al. Arsenic: Health effects, mechanisms of actions, and research issues. Environ. Health Perspect. 1999, 107, 593–597. [Google Scholar] [CrossRef]
- Godt, J.; Scheidig, F.; Grosse-Siestrup, C.; Esche, V.; Brandenburg, P.; Reich, A.; Groneberg, D.A. The toxicity of cadmium and resulting hazards for human health. J. Occup. Med. Toxicol. 2006, 1. [Google Scholar] [CrossRef]
- Calderón, J.; Navarro, M.E.; Jimenez-Capdeville, M.E.; Santos-Diaz, M.A.; Golden, A.; Rodriguez-Levya, I.; Borja-Aburto, V.; Diaz-Barriga, F. Exposure to arsenic and lead and neuropsychological development in Mexican children. Environ. Res. 2001, 85, 69–76. [Google Scholar]
- Carrizales, L.; Razo, I.; Tellez-Hernandez, J.I.; Torres-Nerio, R.; Torres, A.; Batres, L.E.; Cubillas, A.C.; Diaz-Barriga, F. Exposure to arsenic and lead of children living near a copper-smelter in San Luis Potosi, Mexico. Environ. Res. 2006, 101, 1–10. [Google Scholar] [CrossRef] [PubMed]
- Buat-Menard, P.; Peterson, P.J.; Havas, M.; Steinnes, E.; Turner, D. Group report: Arsenic. In Lead, Mercury, Cadmium and Arsenic in the Environment; Hutchinson, T.C., Meema, K.M., Eds.; John Wiley and Sons, Ltd.: New York, NY, USA, 1987; pp. 43–48. [Google Scholar]
- Hutton, M.; Chaney, R.; Krishna-Murti, C.R.; Olade, M.A.; Page, A.L. Group report: Cadmium. In Lead, Mercury, Cadmium and Arsenic in the Environment; Hutchinson, T.C., Meema, K.M., Eds.; John Wiley and Sons, Ltd.: New York, NY, USA, 1987; pp. 35–42. [Google Scholar]
- Jaworski, J.F.; Nriagu, J.; Denny, P.; Hart, B.T.; Lasheen, M.R.; Subramanian, V.; Wong, M.H. Group report: Lead. In Lead, Mercury, Cadmium and Arsenic in the Environment; Hutchinson, T.C., Meema, K.M., Eds.; John Wiley and Sons, Ltd.: New York, NY, USA, 1987; pp. 3–16. [Google Scholar]
- Mertz, W. The essential trace elements. Science 1981, 213, 1332–1338. [Google Scholar] [CrossRef] [PubMed]
- Rayman, M.P. Selenium and human health. Lancet 2012, 379, 1256–1268. [Google Scholar] [CrossRef] [PubMed]
- Burjonrappa, S.C.; Miller, M. Role of trace elements in parenteral nutrition support of the surgical neonate. J. Pediatr. Surg. 2012, 47, 760–771. [Google Scholar] [CrossRef] [PubMed]
- Gad, S.C. Zinc. In Encyclopedia of Toxicology; Furst, A., Radding, S.B., Eds.; Elsevier Inc.: Amsterdam, The Netherlands, 1998; Volume 3, pp. 424–424. [Google Scholar]
- Fraga, C.G. Relevance, essentiality and toxicity of trace elements in human health. Mol. Aspects Med. 2005, 26, 235–244. [Google Scholar] [CrossRef] [PubMed]
- Brown, K.M.; Arthur, J.R. Selenium, selenoproteins and human health: A review. Public Health Nutr. 2001, 4, 593–599. [Google Scholar] [CrossRef] [PubMed]
- Kanumakala, S.; Boneh, A.; Zacharin, M. Pamidronate treatment improves bone mineral density in children with Menkes disease. J. Inherit. Metab. Dis. 2002, 25, 391–398. [Google Scholar] [CrossRef] [PubMed]
- Moomaw, W.; Griffin, T.; Kurczak, K.; Lomax, J. The Critical Role of Global Food Consumption Patterns in Achieving Sustainable Food Systems and Food for All; United Nations Environment Programme: Paris, France, 2012. [Google Scholar]
- Du, S.; Mroz, T.A.; Zhai, F.; Popkin, B.M. Rapid income growth adversely affects diet quality in China—Particularly for the poor! Soc. Sci. Med. 2004, 59, 1505–1515. [Google Scholar] [CrossRef] [PubMed]
- Monda, K.L.; Gordon-Larsen, P.; Stevens, J.; Popkin, B.M. China’s transition: The effect of rapid urbanization on adult occupational physical activity. Soc. Sci. Med. 2007, 64, 858–870. [Google Scholar] [CrossRef] [PubMed]
- Popkin, B.M. Urbanization, lifestyle changes and the nutrition transition. World Dev. 1999, 27, 1905–1916. [Google Scholar] [CrossRef]
- Jiang, H.W.; Umezaki, M.; Ohtsuka, R. Inter-household variation in adoption of cash cropping and its effects on labor and dietary patterns: A study in a Li hamlet in Hainan island, China. Anthropol. Sci. 2006, 114, 165–173. [Google Scholar] [CrossRef]
- Arsenic and Arsenic Compounds; International Programme on Chemical Safety: Geneva, Switzerland, 2001.
- Watanabe, C.; Inaoka, T.; Kadono, T.; Nagano, M.; Nakamura, S.; Ushijima, K.; Murayama, N.; Miyazaki, K.; Ohtsuka, R. Males in rural bangladeshi communities are more susceptible to chronic arsenic poisoning than females: Analyses based on urinary arsenic. Environ. Health Perspect. 2001, 109, 1265–1270. [Google Scholar] [CrossRef] [PubMed]
- Selenium; International Programme on Chemical Safety: Geneva, Switzerland, 1986.
- Ruiz, P.; Mumtaz, M.; Osterloh, J.; Fisher, J.; Fowler, B.A. Interpreting NHANES biomonitoring data, cadmium. Toxicol. Lett. 2010, 198, 44–48. [Google Scholar] [CrossRef] [PubMed]
- Fukui, Y.; Miki, M.; Ukai, H.; Okamoto, S.; Takada, S.; Higashikawa, K.; Ikeda, M. Urinary lead as a possible surrogate of blood lead among workers occupationally exposed to lead. Int. Arch. Occup. Environ. Health 1999, 72, 516–520. [Google Scholar] [CrossRef] [PubMed]
- Lowe, N.M.; Fekete, K.; Decsi, T. Methods of assessment of zinc status in humans: A systematic review. Amer. J. Clin. Nutr. 2009, 89, 2040–2051. [Google Scholar] [CrossRef]
- Turnlund, J.R.; Jacob, R.A.; Keen, C.L.; Strain, J.J.; Kelley, D.S.; Domek, J.M.; Keyes, W.R.; Ensunsa, J.L.; Lykkesfeldt, J.; Coulter, J. Long-term high copper intake: Effects on indexes of copper status, antioxidant status, and immune function in young men. Amer. J. Clin. Nutr. 2004, 79, 1037–1044. [Google Scholar] [PubMed]
- Hainan Statistical Yearbook; Hainan Provincial Bureau of Statistics: Beijing, China, 2010.
- Shinohara, T. The Death of Slash-and-Burn Agriculture on Hainan Island, China; The University of Tokyo Press: Tokyo, Japan, 2004. [Google Scholar]
- Inoue, Y.; Umezaki, M.; Watanabe, C. Emergence of income inequality and its impact on subjective quality of life in an ethnic minority community in Hainan Island, China. Anthropol. Sci. 2012, 120, 51–60. [Google Scholar] [CrossRef]
- Yazawa, A.; Inoue, Y.; Li, D.; Du, J.; Jin, Y.; Chen, Y.; Nishitani, M.; Watanabe, C.; Umezaki, M. Impact of lifestyle changes on stress in a modernizing rural population in Hainan Island, China. Amer. J. Hum. Biol. 2014, 26, 36–42. [Google Scholar] [CrossRef]
- Pinheiro, J.; Bates, D.; Maintainer, R. Package “nlme”. 2014. Available online: http://cran.r-project.org/web/packages/nlme/nlme.pdf (accessed on 9 Decembner 2014).
- Hata, A.; Endo, Y.; Nakajima, Y.; Ikebe, M.; Ogawa, M.; Fujitani, N.; Endo, G. HPLC-ICP-MS speciation analysis of Arsenic in urine of Japanese subjects without occupational exposure. J. Occup. Health 2007, 49, 217–223. [Google Scholar] [CrossRef] [PubMed]
- Komaromy-Hiller, G.; Ash, K.O.; Costa, R.; Howerton, K. Comparison of representative ranges based on U.S. patient population and literature reference intervals for urinary trace elements. Clin. Chim. Acta 2000, 296, 71–90. [Google Scholar] [CrossRef] [PubMed]
- Brima, E.I.; Haris, P.I.; Jenkins, R.O.; Polya, D.A.; Gault, A.G.; Harrington, C.F. Understanding arsenic metabolism through a comparative study of arsenic levels in the urine, hair and fingernails of healthy volunteers from three unexposed ethnic groups in the United Kingdom. Toxicol. Appl. Pharm. 2006, 216, 122–130. [Google Scholar] [CrossRef]
- Aguilera, I.; Daponte, A.; Gil, F.; Hernandez, A.F.; Godoy, P.; Pla, A.; Ramos, J.L.; Grp, D. Biomonitoring of urinary metals in a population living in the vicinity of industrial sources: A comparison with the general population of Andalusia, Spain. Sci. Total Environ. 2008, 407, 669–678. [Google Scholar] [CrossRef] [PubMed]
- Quandt, S.A.; Jones, B.T.; Talton, J.W.; Whalley, L.E.; Galvan, L.; Vallejos, Q.M.; Grzywacz, J.G.; Chen, H.Y.; Pharr, K.E.; Isom, S.; et al. Heavy metals exposures among Mexican farmworkers in eastern North Carolina. Environ. Res. 2010, 110, 83–88. [Google Scholar] [CrossRef]
- Nordberg, G.F.; Jin, T.; Hong, F.; Zhang, A.; Buchet, J.P.; Bernard, A. Biomarkers of cadmium and arsenic interactions. Toxicol. Appl. Pharmacol. 2005, 206, 191–197. [Google Scholar] [CrossRef] [PubMed]
- Li, X.; Pi, J.B.; Li, B.; Xu, Y.Y.; Jin, Y.P.; Sun, G.F. Urinary arsenic speciation and its correlation with 8-OHdG in Chinese residents exposed to arsenic through coal burning. Bull. Environ. Contam. Toxicol 2008, 81, 406–411. [Google Scholar] [CrossRef] [PubMed]
- Wang, J.P.; Wang, S.L.; Lin, Q.; Zhang, L.; Huang, D.; Ng, J.C. Association of arsenic and kidney dysfunction in people with diabetes and validation of its effects in rats. Environ. Int. 2009, 35, 507–511. [Google Scholar] [CrossRef] [PubMed]
- Chen, J.W.; Chen, H.Y.; Li, W.F.; Liou, S.H.; Chen, C.J.; Wu, J.H.; Wang, S.L. The association between total urinary arsenic concentration and renal dysfunction in a community-based population from central Taiwan. Chemosphere 2011, 84, 17–24. [Google Scholar] [CrossRef] [PubMed]
- Heck, J.E.; Nieves, J.W.; Chen, Y.; Parvez, F.; Brandt-Rauf, P.W.; Graziano, J.H.; Slavkovich, V.; Howe, G.R.; Ahsan, H. Dietary intake of methionine, cysteine, and protein and urinary arsenic excretion in Bangladesh. Environ. Health Persp. 2009, 117, 99–104. [Google Scholar] [CrossRef]
- Lindberg, A.L.; Ekstrom, E.C.; Nermell, B.; Rahman, M.; Lonnerdal, B.; Persson, L.A.; Vahter, M. Gender and age differences in the metabolism of inorganic arsenic in a highly exposed population in Bangladesh. Environ. Res. 2008, 106, 110–120. [Google Scholar] [CrossRef] [PubMed]
- Batáriová, A.; Spěváčková, V.; Beneš, B.; Čejchanová, M.; Šmíd, J.; Cerná, M. Blood and urine levels of Pb, Cd and Hg in the general population of the czech republic and proposed reference values. Int. J. Hyg. Environ. Health 2006, 209, 359–366. [Google Scholar] [CrossRef] [PubMed]
- Menke, A.; Muntner, P.; Silbergeld, E.K.; Platz, E.A.; Guallar, E. Cadmium levels in urine and mortality among U.S. adults. Environ. Health Persp. 2009, 117, 190–196. [Google Scholar]
- Cui, Y.J.; Zhu, Y.G.; Zhai, R.H.; Huang, Y.Z.; Qiu, Y.; Liang, J.Z. Exposure to metal mixtures and human health impacts in a contaminated area in Nanning, China. Environ. Int. 2005, 31, 784–790. [Google Scholar] [CrossRef] [PubMed]
- Fierens, S.; Mairesse, H.; Heilier, J.F.; Focant, J.F.; Eppe, G.; de Pauw, E.; Bernard, A. Impact of iron and steel industry and waste incinerators on human exposure to dioxins, PCBs, and heavy metals: Results of a cross-sectional study in Belgium. J. Toxicol. Environ. Health Pt. A 2007, 70, 222–226. [Google Scholar] [CrossRef]
- Zubero, M.B.; Aurrekoetxea, J.J.; Ibarluzea, J.M.; Arenaza, M.J.; Rodriguez, C.; Saenz, J.R. Heavy metal levels (Pb, Cd, Cr and Hg) in the adult general population near an urban solid waste incinerator. Sci. Total Environ. 2010, 408, 4468–4474. [Google Scholar] [CrossRef] [PubMed]
- Castaño, A.; Sánchez-Rodríguez, J.E.; Cañas, A.; Esteban, M.; Navarro, C.; Rodríguez-García, A.C.; Arribas, M.; Díaz, G.; Jiménez-Guerrero, J.A. Mercury, lead and cadmium levels in the urine of 170 Spanish adults: A pilot human biomonitoring study. Int. J. Hyg. Environ. Health 2012, 215, 191–195. [Google Scholar] [PubMed]
- Gil, F.; Hernandez, A.F.; Marquez, C.; Femia, P.; Olmedo, P.; Lopez-Guarnido, O.; Pla, A. Biomonitorization of cadmium, chromium, manganese, nickel and lead in whole blood, urine, axillary hair and saliva in an occupationally exposed population. Sci. Total Environ. 2011, 409, 1172–1180. [Google Scholar] [CrossRef] [PubMed]
- Jin, Y.P.; Kobayashi, E.; Okubo, Y.; Suwazono, Y.; Nogawa, K.; Nakagawa, H. Changes of lead levels in 24-h urine from 1985 to 1998 in Japanese adults. Toxicol. Lett. 2000, 114, 91–99. [Google Scholar] [CrossRef] [PubMed]
- Rodríguez, E.M.R.; Alaejos, M.S.; Romero, C.D. Urinary selenium concentrations in heroin abusers. Clin. Chim. Acta 1994, 231, 39–46. [Google Scholar] [CrossRef] [PubMed]
- Schuhmacher, M.; Domingo, J.L.; Corbella, J. Zinc and copper levels in serum and urine: Relationship to biological, habitual and environmental factors. Sci. Total Environ. 1994, 148, 67–72. [Google Scholar] [CrossRef] [PubMed]
- Borak, J.; Hosgood, H.D. Seafood arsenic: Implications for human risk assessment. Regul. Toxicol. Pharm. 2007, 47, 204–212. [Google Scholar] [CrossRef]
- Roels, H.A.; Hoet, P.; Lison, D. Usefulness of biomarkers of exposure to inorganic mercury, lead, or cadmium in controlling occupational and environmental risks of nephrotoxicity. Ren. Fail. 1999, 21, 251–262. [Google Scholar] [PubMed]
- Gidlow, D. Lead toxicity. Occup.Med. 2004, 54, 76–81. [Google Scholar] [CrossRef]
- Hanazawa, K.; Kido, T.; Honda, R. Significance of urinary cadmium concentration as an indicator of cadmium exposure in a population exposed to cadmium in a general environment. Sangyo Igaku 1991, 33, 221–230. [Google Scholar] [CrossRef] [PubMed]
- Andriollo-Sanchez, M.; Hininger-Favier, I.; Meunier, N.; Toti, E.; Zaccaria, M.; Brandolini-Bunlon, M.; Polito, A.; O’Connor, J.M.; Ferry, M.; Coudray, C.; et al. Zinc intake and status in middle-aged and older european subjects: The ZENITH study. Eur. J. Clin. Nutr. 2005, 59, S37–S41. [Google Scholar] [CrossRef] [PubMed]
- Asante, K.A.; Agusa, T.; Biney, C.A.; Agyekum, W.A.; Bello, M.; Otsuka, M.; Itai, T.; Takahashi, S.; Tanabe, S. Multi-trace element levels and arsenic speciation in urine of e-waste recycling workers from Agbogbloshie, Accra in Ghana. Sci. Total Environ. 2012, 424, 63–73. [Google Scholar] [CrossRef] [PubMed]
- Kristiansen, J.; Christensen, J.M.; Iversen, B.S.; Sabbioni, E. Toxic trace element reference levels in blood and urine: Influence of gender and lifestyle factors. Sci. Total Environ. 1997, 204, 147–160. [Google Scholar] [CrossRef] [PubMed]
- Rodrigues, E.G.; Kile, M.; Hoffman, E.; Quamruzzaman, Q.; Rahman, M.; Mahiuddin, G.; Hsueh, Y.; Christiani, D.C. GSTO and AS3MT genetic polymorphisms and differences in urinary arsenic concentrations among residents in Bangladesh. Biomarkers 2012, 17, 240–247. [Google Scholar] [CrossRef] [PubMed]
- Hasunuma, R.; Tsuda, M.; Ogawa, T.; Kawanishi, Y. Urinary selenium levels in Japanese males and females. Bull. Environ. Contam. Toxicol. 1990, 44, 501–507. [Google Scholar] [PubMed]
- O'Connor, R.J.; Li, Q.; Stephens, W.E.; Hammond, D.; Elton-Marshall, T.; Cummings, K.M.; Giovino, G.A.; Fong, G.T. Cigarettes sold in China: Design, emissions and metals. Tob. Control 2010, 19, 47–53. [Google Scholar] [CrossRef]
- Lloyd, B.; Lloyd, R.S.; Clayton, B.E. Effect of smoking, alcohol, and other factors on the selenium status of a healthy population. J. Epidemiol. Community Heath 1983, 37, 213–217. [Google Scholar] [CrossRef]
- Zinc; International Programme on Chemical Safety: Geneva, Switzerland, 2001.
- Milne, D.B.; Nielsen, F.H. Effects of a diet low in copper on copper-status indicators in postmenopausal women. Amer. J. Clin. Nutr. 1996, 63, 358–364. [Google Scholar] [PubMed]
- Inorganic Lead; International Programme on Chemical Safety: Geneva, Switzerland, 1995.
© 2014 by the authors; licensee MDPI, Basel, Switzerland. This article is an open access article distributed under the terms and conditions of the Creative Commons Attribution license (http://creativecommons.org/licenses/by/4.0/).
Share and Cite
Inoue, Y.; Umezaki, M.; Jiang, H.; Li, D.; Du, J.; Jin, Y.; Yang, B.; Li, B.; Li, Y.; Watanabe, C. Urinary Concentrations of Toxic and Essential Trace Elements among Rural Residents in Hainan Island, China. Int. J. Environ. Res. Public Health 2014, 11, 13047-13064. https://doi.org/10.3390/ijerph111213047
Inoue Y, Umezaki M, Jiang H, Li D, Du J, Jin Y, Yang B, Li B, Li Y, Watanabe C. Urinary Concentrations of Toxic and Essential Trace Elements among Rural Residents in Hainan Island, China. International Journal of Environmental Research and Public Health. 2014; 11(12):13047-13064. https://doi.org/10.3390/ijerph111213047
Chicago/Turabian StyleInoue, Yosuke, Masahiro Umezaki, Hongwei Jiang, Dandan Li, Jianwei Du, Yuming Jin, Bin Yang, Bai Li, Yufeng Li, and Chiho Watanabe. 2014. "Urinary Concentrations of Toxic and Essential Trace Elements among Rural Residents in Hainan Island, China" International Journal of Environmental Research and Public Health 11, no. 12: 13047-13064. https://doi.org/10.3390/ijerph111213047