Odor and VOC Emissions from Pan Frying of Mackerel at Three Stages: Raw, Well-Done, and Charred


Abstract
:1. Introduction
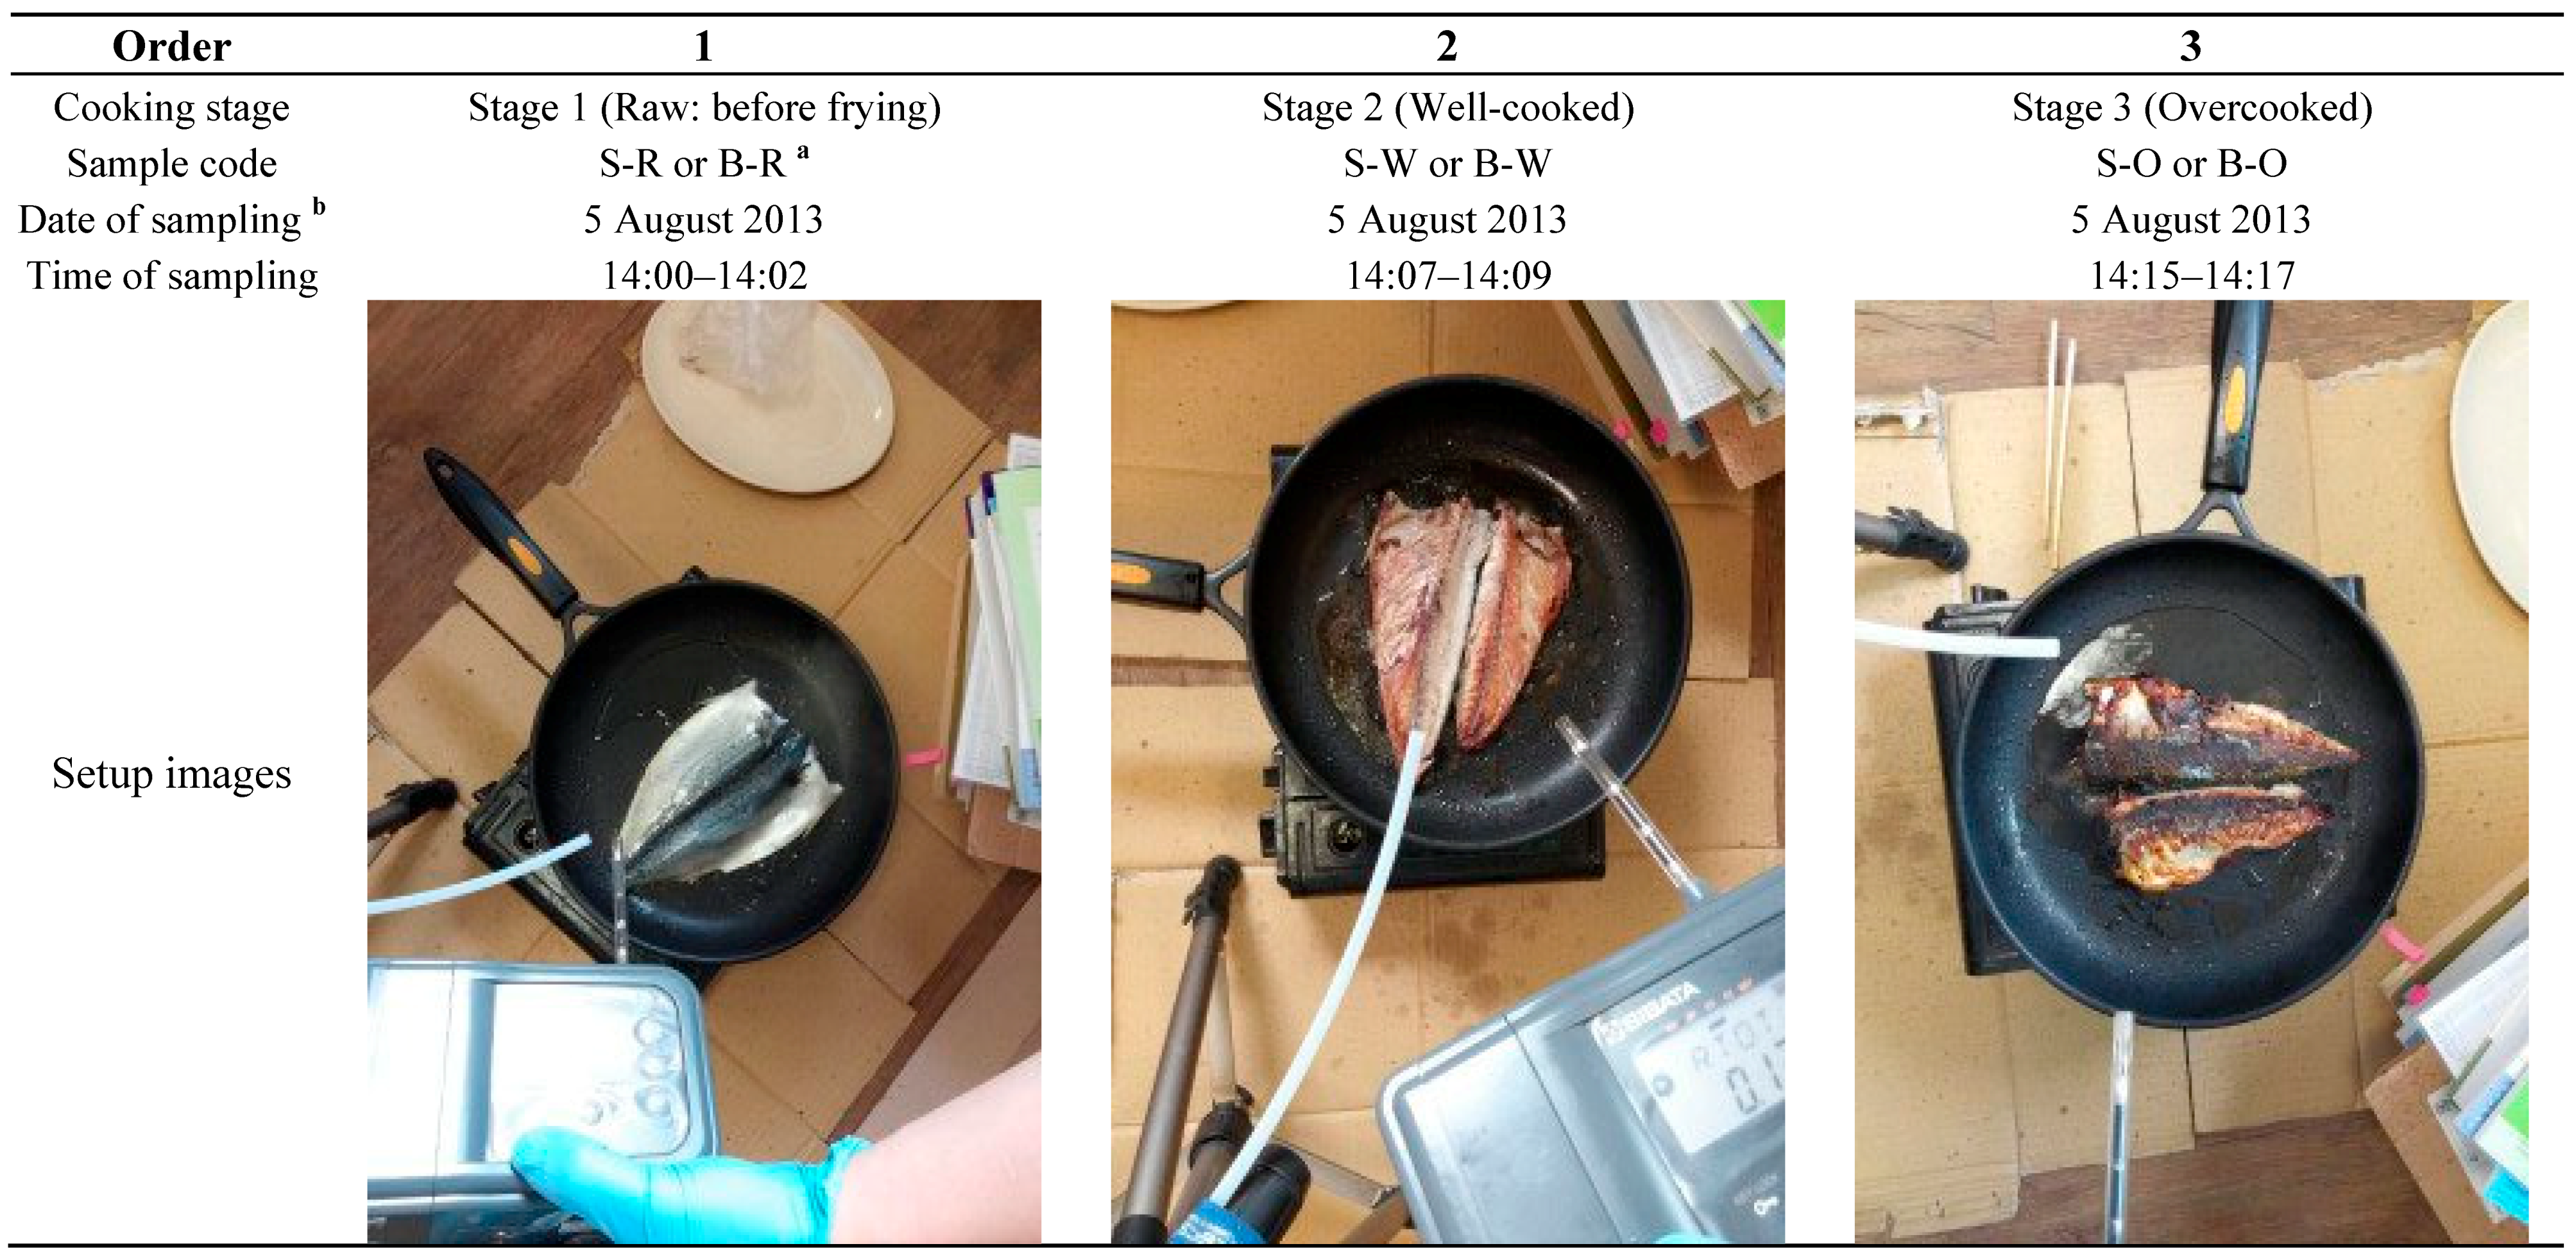
2. Experimental Section
2.1. Preparation of Working Standards (WS)

| Order | Group | Compound | Short Name | MW (g/mol) | Formula | CAS Number |
|---|---|---|---|---|---|---|
| A. Target Compounds | ||||||
| 1 | Aldehydes | Propionaldehyde | PA | 58.1 | C3H6O | 123-38-6 |
| 2 | Butyraldehyde | BA | 72.1 | C4H8O | 123-72-8 | |
| 3 | Isovaleraldehyde | IA | 86.1 | C5H10O | 590-86-3 | |
| 4 | Valeraldehyde | VA | 86.1 | C5H10O | 110-62-3 | |
| 5 | Methyl ethyl ketone | MEK | 72.1 | C4H8O | 78-93-3 | |
| 6 | Ketones | Methyl isobutyl ketone | MIBK | 100 | C6H12O | 108-10-1 |
| 7 | Butyl acetate | BuAc | 116 | C6H12O2 | 123-86-4 | |
| 8 | Isobutyl alcohol | i-BuAl | 74.1 | C4H10O | 78-83-1 | |
| 9 | Aromatic | Benzene | B | 78.1 | C6H6 | 71-43-2 |
| 10 | hydrocarbons | Toluene | T | 92.1 | C7H8 | 108-88-3 |
| 11 | p-Xylene | p-X | 106 | C8H10 | 106-42-3 | |
| 12 | m-Xylene | m-X | 106 | C8H10 | 108-38-3 | |
| 13 | o-Xylene | o-X | 106 | C8H10 | 95-47-6 | |
| 14 | Styrene | S | 104 | C8H8 | 100-42-5 | |
| 15 | Volatile | Acetic acid | ACA | 60.1 | C2H4O2 | 64-19-7 |
| 16 | fatty acids | Propionic acid | PPA | 74.1 | C3H6O2 | 79-09-4 |
| 17 | i-Butyric acid | IBA | 88.1 | C4H8O2 | 79-31.2 | |
| 18 | n-Butyric acid | BTA | 88.1 | C4H8O2 | 107-92-6 | |
| 19 | i-Valeric acid | IVA | 102 | C5H10O2 | 503-74-2 | |
| 20 | n-Valeric acid | VLA | 102 | C5H10O2 | 109-52-4 | |
| 21 | Hexanoic acid | HXA | 116 | C6H12O2 | 142-62-1 | |
| 22 | Heptanoic acid | HPA | 130 | C7H14O2 | 111-14-8 | |
| 23 | Amine | Trimethylamine | TMA | 59.1 | C3H9N | 75-50-3 |
| B. Reference Compounds | ||||||
| 1 | Aliphatic | n-Decane | -- | 142 | C10H22 | 124-18-5 |
| 2 | Hydrocarbons | n-Dodecane | -- | 170 | C12H26 | 112-40-3 |
| 3 | Aldehydes | Crotonaldehyde | -- | 70.1 | C4H6O | 4170-30-3 |
| 4 | n-Hexanaldehyde | -- | 100 | C6H12O | 66-25-1 | |
| 5 | n-Heptanal | -- | 114 | C7H14O | 111-71-7 | |
| 6 | n-Octanaldehyde | -- | 128 | C8H16O | 124-13-0 | |
| 7 | (E,E)-2,4-Decadienal | -- | 152 | C10H16O | 25152-84-5 | |
| 8 | trans-2-Decenal | -- | 154 | C10H18O | 3913-71-1 | |
| 9 | 2-Undecenal | -- | 168 | C11H20O | 2463-77-6 | |
| 10 | Alcohol | 1-Pentanol | -- | 88.2 | C5H12O | 71-41-0 |
| 11 | Haloalkane | Chloroform | -- | 119 | CHCl3 | 67-66-3 |
2.2. The Collection of Odorants from Fish Frying
| A-1. Preparation of primary standard and working standard of 22 compounds | ||||||||||||||||||||||||
| Compound | PA | BA | IA | VA | MEK | MIBK | BuAc | i-BuAl | B | T | p-X | m-X | o-X | S | ACA | PPA | IBA | BTA | IVA | VLA | HXA | HPA | Methanol | |
| Primary Grade | Purity (%) | 97.0 | 99.0 | 97.0 | 97.0 | 99.0 | 99.5 | 99.5 | 99.0 | 99.5 | 99.5 | 99.0 | 99.0 | 97.0 | 99.0 | 99.99 | 99.0 | 99.0 | 99.0 | 99.0 | 99.0 | 99.0 | 99.0 | -- |
| Chemical | Density (g/mL) | 0.798 | 0.805 | 0.797 | 0.81 | 0.805 | 0.802 | 0.881 | 0.801 | 0.878 | 0.866 | 0.87 | 0.87 | 0.88 | 0.906 | 1.049 | 0.99 | 0.9697 | 0.96 | 0.93 | 0.94 | 0.927 | 0.9181 | -- |
| Primary | Volume (μL) | 300 | 300 | 300 | 300 | 300 | 300 | 300 | 300 | 300 | 300 | 300 | 300 | 300 | 300 | 300 | 300 | 300 | 300 | 300 | 300 | 300 | 300 | 13,400 |
| Standard | Concentration (ng/μL) | 11,611 | 11,954 | 11,596 | 11,786 | 11,954 | 11,970 | 13,149 | 11,895 | 13,104 | 12,925 | 12,845 | 12,845 | 12,804 | 13,454 | 15,733 | 14,702 | 14,400 | 14,226 | 13,736 | 19,482 | 13,766 | 13,634 | -- |
| 1st WS | Volume (μL) | -- | -- | -- | -- | -- | -- | -- | -- | -- | -- | 300 | -- | -- | -- | -- | -- | -- | -- | -- | -- | -- | 19,700 | |
| -- | Concentration (ng/μL) | 174 | 179 | 174 | 177 | 179 | 180 | 197 | 178 | 197 | 194 | 193 | 193 | 192 | 202 | 236 | 221 | 216 | 213 | 206 | 292 | 206 | 205 | -- |
| A-2. Preparation of (final) liquid working standard for four point calibration a | ||||||||||||||||||||||||
| Order | Mixing Volume (μL) | Mass (ng) in 1 µL | ||||||||||||||||||||||
| 1st WS | Methanol | PA | BA | IA | VA | MEK | MIBK | BuAc | i-BuAl | B | T | p-X | m-X | o-X | S | ACA | PPA | IBA | BTA | IVA | VLA | HXA | HPA | |
| 1 | 40 | 1560 | 4.35 | 4.48 | 4.35 | 4.42 | 4.48 | 4.49 | 4.93 | 4.46 | 4.91 | 4.85 | 4.82 | 4.82 | 4.80 | 5.05 | 5.90 | 5.51 | 5.40 | 5.33 | 5.15 | 7.31 | 5.16 | 5.11 |
| 2 | 80 | 1520 | 8.71 | 8.97 | 8.70 | 8.84 | 8.97 | 8.98 | 9.86 | 8.92 | 9.83 | 9.69 | 9.63 | 9.63 | 9.60 | 10.1 | 11.8 | 11.0 | 10.8 | 10.7 | 10.3 | 14.6 | 10.3 | 10.2 |
| 3 | 160 | 1440 | 17.4 | 17.9 | 17.4 | 17.7 | 17.9 | 18.0 | 19.7 | 17.8 | 19.7 | 19.4 | 19.3 | 19.3 | 19.2 | 20.2 | 23.6 | 22.1 | 21.6 | 21.3 | 20.6 | 29.2 | 20.6 | 20.5 |
| 4 | 400 | 1200 | 43.5 | 44.8 | 43.5 | 44.2 | 44.8 | 44.9 | 49.3 | 44.6 | 49.1 | 48.5 | 48.2 | 48.2 | 48.0 | 50.5 | 59.0 | 55.1 | 54.0 | 53.3 | 51.5 | 73.1 | 51.6 | 51.1 |
| B-1. Preparation of the 1st working standard of TMA (gas phase) | ||||||||||||||||||||||||
| Compound | TMA | N2 | ||||||||||||||||||||||
| Primary Standard | Concentration (ppm) | 5010 | 99.999% | |||||||||||||||||||||
| 1st WS | Volume (mL) | 0.2 | 999.8 | |||||||||||||||||||||
| Concentration (ppb) | 1002 | -- | ||||||||||||||||||||||
| B-2. Adsorbed mass (ng) of TMA for four point calibration | ||||||||||||||||||||||||
| Order | Loading | Loading | TMA | |||||||||||||||||||||
| timea (min) | volume (mL) | mass (ng) | ||||||||||||||||||||||
| 1 | 0.1 | 10 | 24.2 | |||||||||||||||||||||
| 2 | 0.2 | 20 | 48.4 | |||||||||||||||||||||
| 3 | 0.5 | 50 | 121 | |||||||||||||||||||||
| 4 | 1 | 100 | 242 | |||||||||||||||||||||

2.3. Instrumental Setup for Analysis
3. Results and Discussion
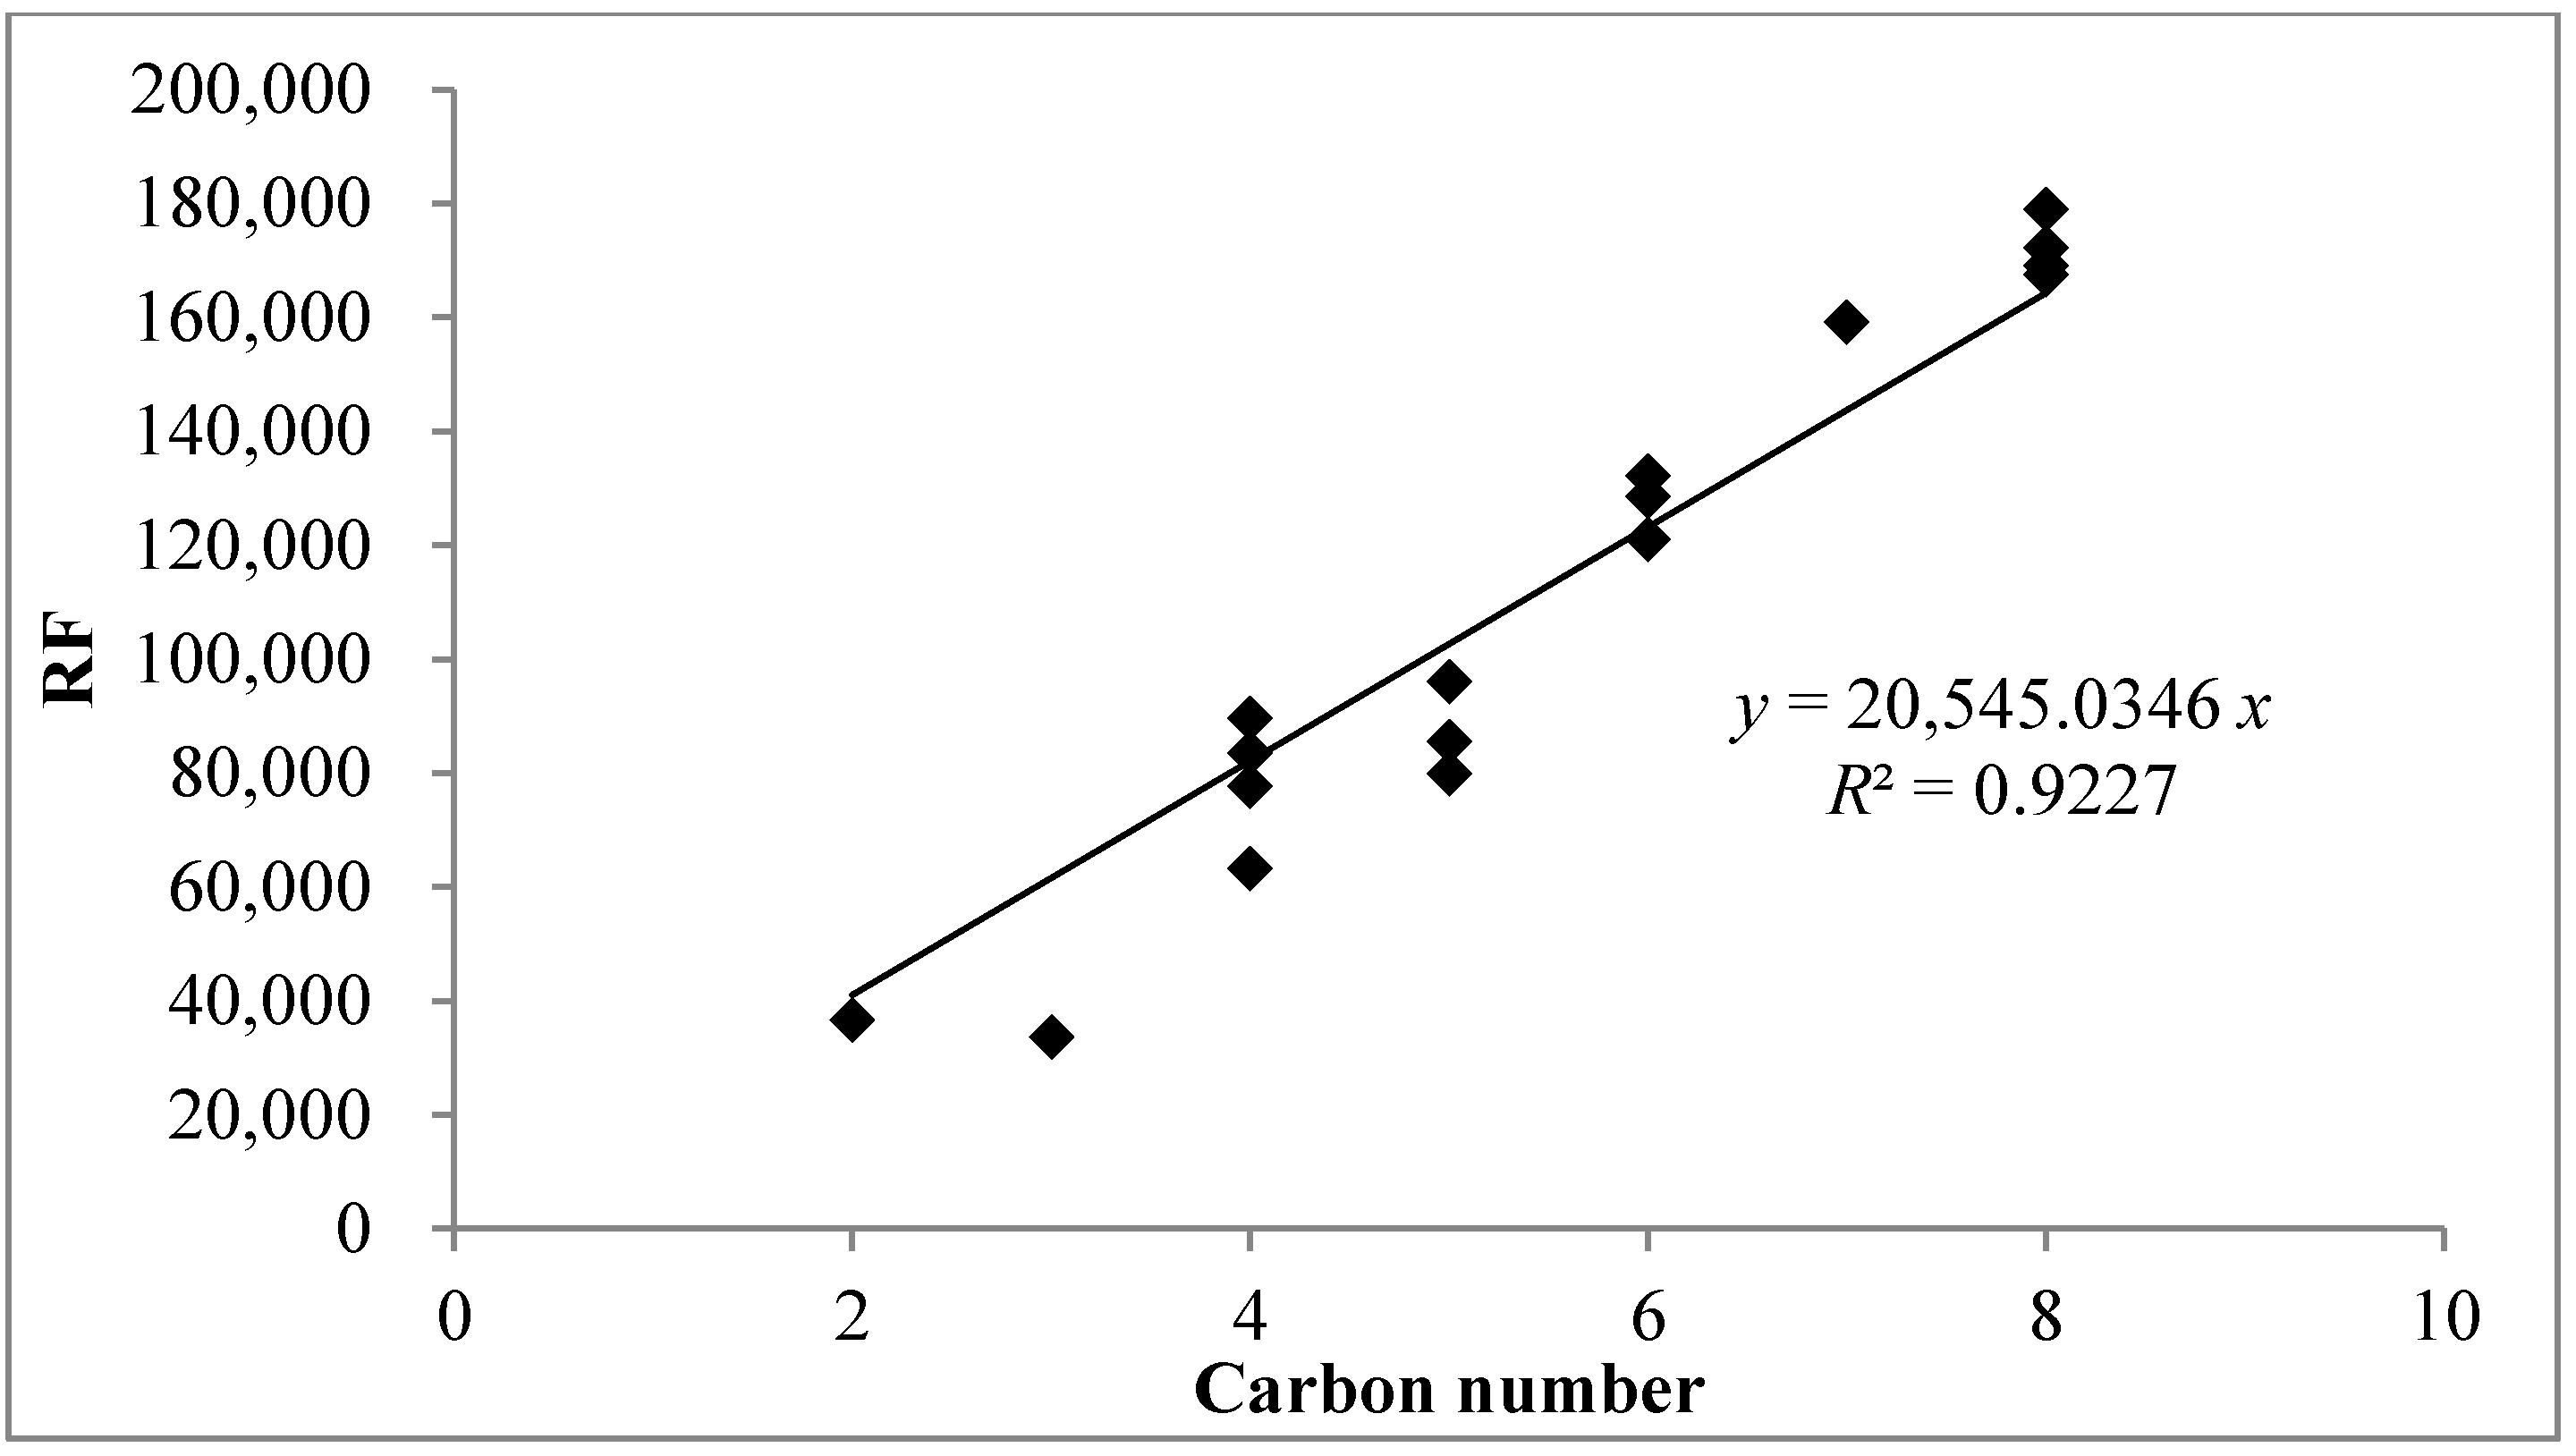
3.1. Calibration Characteristics
| a. Sampling conditions | |||
| Sampling flow rate: | 100 mL·min−1 | Sorbent tube sampling temperature: | ~70 °C |
| Sampling volume: | 200 mL | Bag sampling temperature: | 25 °C |
| b. Sorbent tube desorption settings | |||
| Sorbent material: | Carbopack C + Carbopack B + Carbopack X (mass = 100, 70, 70 mg) | ||
| Desorption flow: | 50 mL·min−1 | ||
| Desorption time: | 10 min | Desorption temperature: | 300 °C |
| c. Thermal desorber (Unity, Markes International, Ltd.) settings | |||
| Cold trap sorbent: | Carbopack C + Carbopack B (volume ratio = 1:1) | ||
| Split ratio: | 1:5 | Adsorption temperature: | −5 °C |
| Split flow: | 5 mL | Desorption temperature: | 320 °C |
| Trap hold time: | 10 min | Flow path temperature: | 180 °C |
| d. GC (Shimadzu GC-2010) and Q MS (Shimadzu GCMS-QP2010) settings | |||
| Column: CP Wax (diameter: 0.25 mm, length: 60 m, and film thickness: 0.25 µm) | |||
| Oven settings | MS detector settings | ||
| Oven temperature: | 40 °C (10 min) | Ionization mode: | EI (70 eV) |
| Oven ramping rate: | 5 °C·min−1 | Ion source temperature: | 230 °C |
| Max oven temperature: | 220 °C (4 min) | Interface temperature: | 230 °C |
| Total run time: | 50 min | TIC scan range: | 35~600 m/z |
| Carrier gas: | He (99.999%) | Emission current: | 150 μA |
| Carrier Pressure: | 25.0 psi | ||
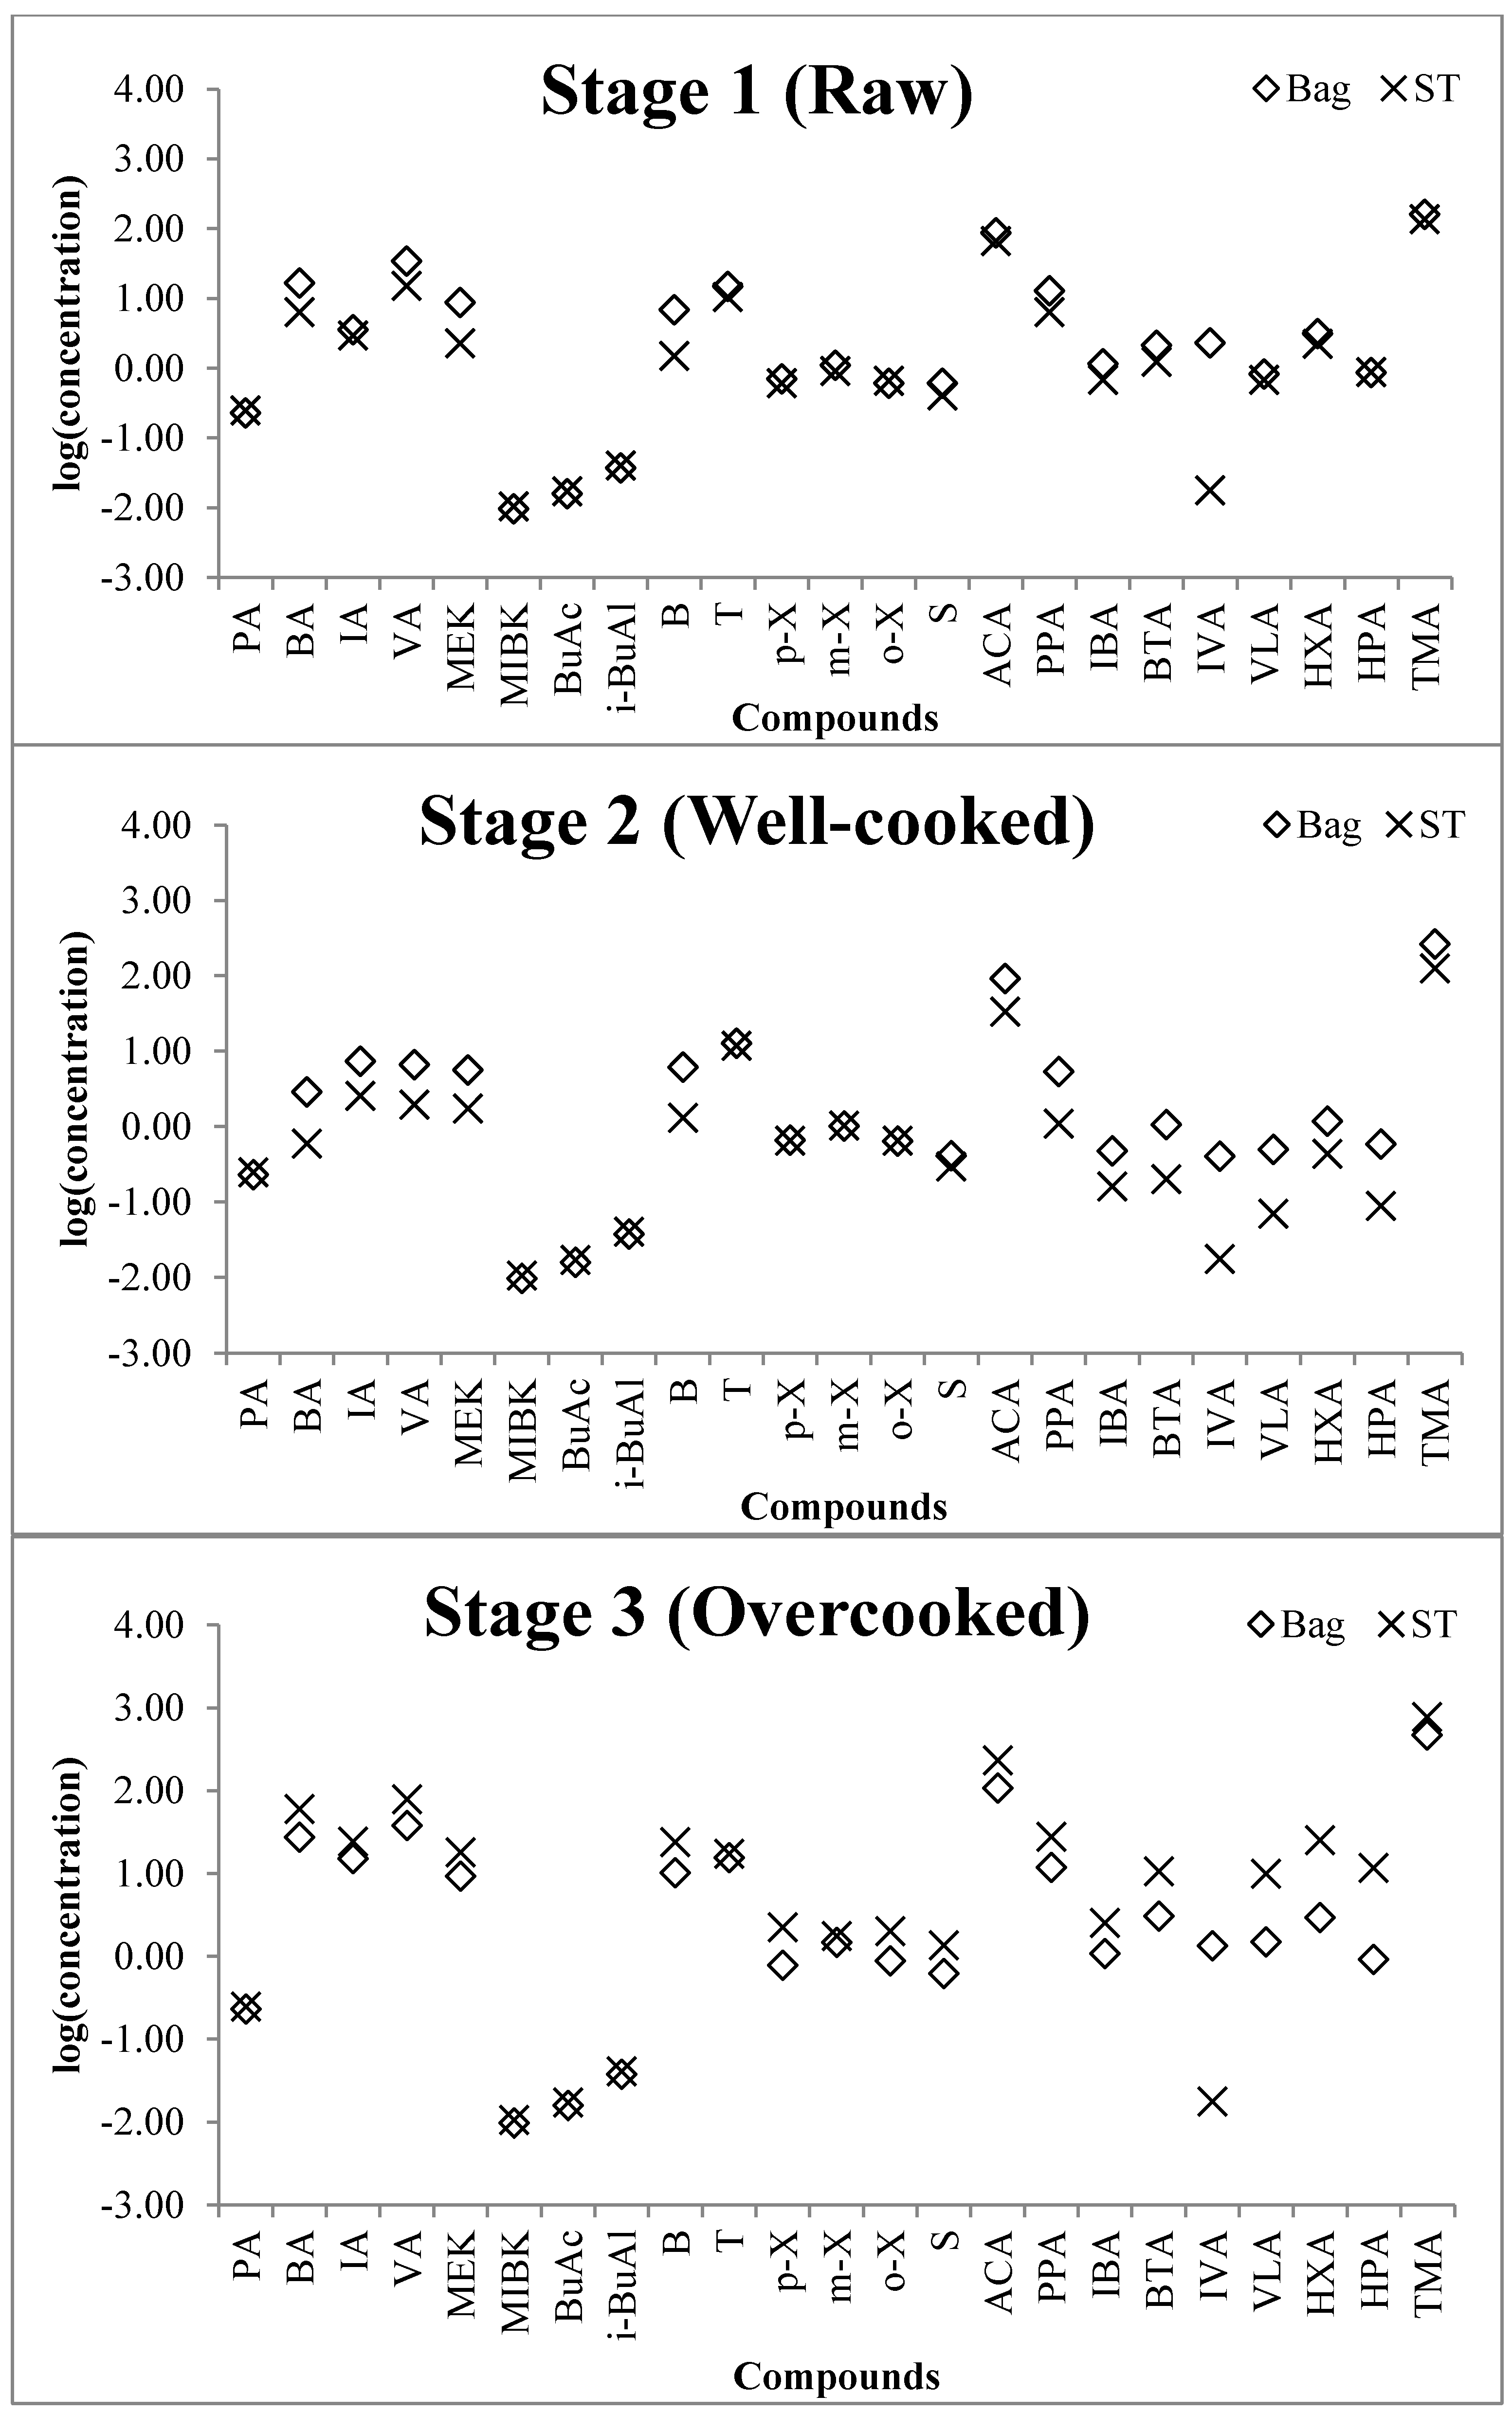
3.2. Comparison of Concentrations between Bag Sampling and Sorbent Tube Sampling Method
| Order | Group | Compound | RF | R2 | RSE a (%) | MDL | |
|---|---|---|---|---|---|---|---|
| (ng) | (ppb) b | ||||||
| A. Target compounds | |||||||
| 1 | Aldehydes | Propionaldehyde | 7828 | 0.9923 | 3.01 | 0.108 | 0.228 |
| 2 | Butyraldehyde | 63,131 | 0.9927 | 0.63 | 0.006 | 0.011 | |
| 3 | Isovaleraldehyde | 95,981 | 0.9960 | 0.89 | 0.010 | 0.015 | |
| 4 | Valeraldehyde | 79,889 | 0.9957 | 3.18 | 0.026 | 0.037 | |
| 5 | Methyl ethyl ketone | 83,474 | 0.9938 | 0.87 | 0.037 | 0.063 | |
| 6 | Ketones | Methyl isobutyl ketone | 132,143 | 0.9974 | 0.91 | 0.008 | 0.010 |
| 7 | Butyl acetate | 128,506 | 0.9924 | 1.27 | 0.015 | 0.016 | |
| 8 | Isobutyl alcohol | 89,544 | 0.9962 | 0.83 | 0.023 | 0.037 | |
| 9 | Benzene | 120,914 | 0.9925 | 1.23 | 0.011 | 0.017 | |
| 10 | Toluene | 159,105 | 0.9932 | 1.05 | 0.034 | 0.045 | |
| 11 | Aromatic | p-Xylene | 172,208 | 0.9905 | 0.07 | 0.006 | 0.007 |
| 12 | hydrocarbons | m-Xylene | 167,521 | 0.9925 | 1.56 | 0.015 | 0.017 |
| 13 | o-Xylene | 178,910 | 0.9911 | 1.13 | 0.019 | 0.022 | |
| 14 | Styrene | 169,088 | 0.9921 | 1.82 | 0.017 | 0.020 | |
| 15 | Acetic acid | 36,696 | 0.9919 | 4.14 | 0.036 | 0.072 | |
| 16 | Propionic acid | 33,591 | 0.9954 | 2.47 | 0.039 | 0.064 | |
| 17 | i-Butyric acid | 75,064 | 0.9910 | 1.26 | 0.017 | 0.023 | |
| 18 | Volatile | n-Butyric acid | 77,611 | 0.9944 | 1.86 | 0.017 | 0.023 |
| 19 | fatty acids | i-Valeric acid | 96,075 | 0.9958 | 0.72 | 0.014 | 0.016 |
| 20 | n-Valeric acid | 85,543 | 0.9952 | 0.55 | 0.015 | 0.018 | |
| 21 | Hexanoic acid | 85,823 | 0.9971 | 0.13 | 0.015 | 0.016 | |
| 22 | Heptanoic acid | 87,487 | 0.9968 | 1.09 | 0.015 | 0.014 | |
| 23 | Amine c | Trimethylamine | 27,952 | 0.9988 | -- | 0.047 | 0.097 |
| B. Reference compounds c | |||||||
| 1 | Aliphatic | n-Decane | 205,450 | -- | -- | 0.032 | 0.005 |
| 2 | hydrocarbons | n-Dodecane | 246,540 | -- | -- | 0.026 | 0.004 |
| 3 | Crotonaldehyde | 82,180 | -- | -- | 0.079 | 0.028 | |
| 4 | n-Hexanaldehyde | 123,270 | -- | -- | 0.053 | 0.013 | |
| 5 | Aldehydes | n-Heptanal | 143,815 | -- | -- | 0.045 | 0.010 |
| 6 | n-Octanaldehyde | 164,360 | -- | -- | 0.040 | 0.008 | |
| 7 | (E,E)-2,4-Decadienal | 205,450 | -- | -- | 0.032 | 0.005 | |
| 8 | trans-2-Decenal | 205,450 | -- | -- | 0.032 | 0.005 | |
| 9 | 2-Undecenal | 225,995 | -- | -- | 0.029 | 0.004 | |
| 10 | Alcohol | 1-Pentanol | 102,725 | -- | -- | 0.064 | 0.018 |
| 11 | Haloalkane | Chloroform | 20,545 | -- | -- | 0.318 | 0.065 |
3.3. The Evaluation of Odorants Emitted from Mackerel at Different Frying Stages
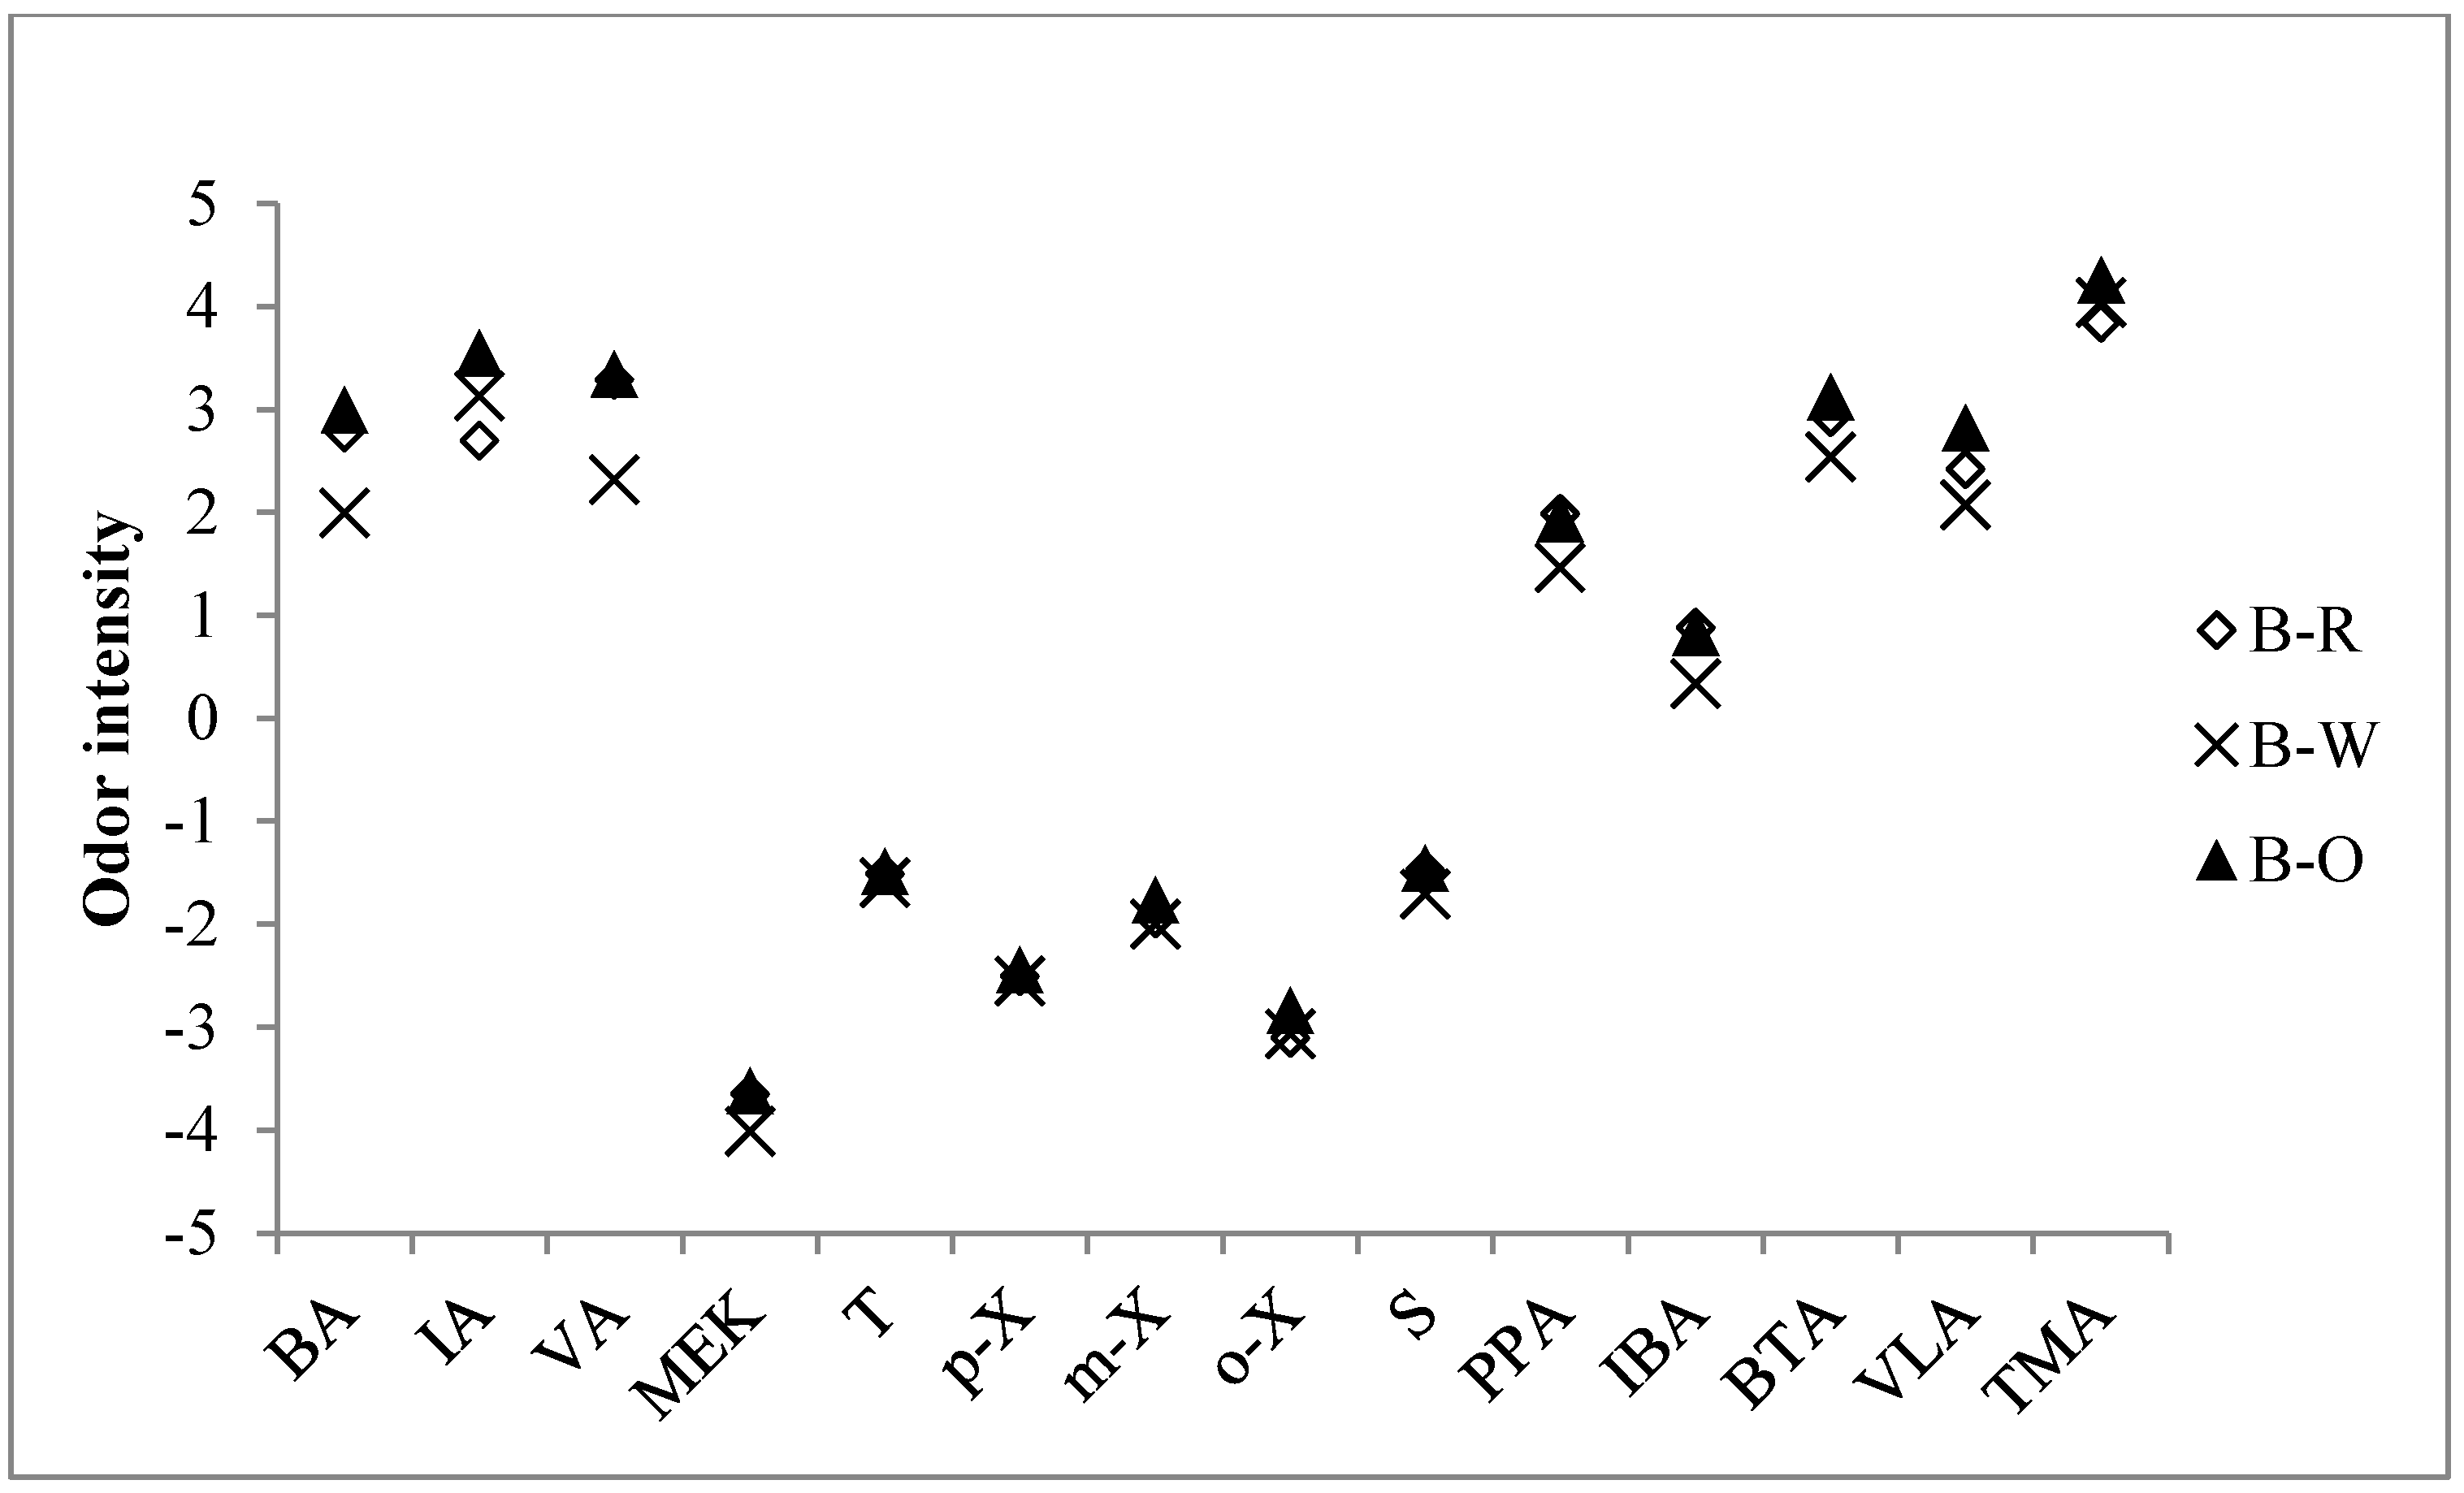
3.4. The Evaluation of Odor Intensity at Each Frying Stage
| Order | Group | Compound | Concentration (ppb) by Bag Method at Each Stage | Concentration (ppb) by Sorbent Tube Method at Each Stage | Ratio (S/B) of VOCs | ||||||
|---|---|---|---|---|---|---|---|---|---|---|---|
| B-R a | B-W | B-O | S-R | S-W | S-O | R | W | O | |||
| A. Target compounds | |||||||||||
| 1 | Aldehydes | Propionaldehyde | 0.228 | 0.228 | 0.228 | 0.247 | 0.247 | 0.247 | -- | -- | -- |
| 2 | Butyraldehyde | 16.6 | 2.88 | 27.1 | 6.36 | 0.60 | 59.6 | 0.38 | 0.21 | 2.20 | |
| 3 | Isovaleraldehyde | 3.53 | 7.34 | 15.0 | 2.92 | 2.56 | 24.1 | 0.83 | 0.35 | 1.61 | |
| 4 | Valeraldehyde | 34.4 | 6.61 | 37.7 | 15.1 | 1.97 | 78.2 | 0.44 | 0.30 | 2.07 | |
| 5 | Methyl ethyl ketone | 8.81 | 5.61 | 9.16 | 2.28 | 1.75 | 17.8 | 0.26 | 0.31 | 1.94 | |
| 6 | Ketones | Methyl isobutyl ketone | 0.010 | 0.010 | 0.010 | 0.011 | 0.011 | 0.011 | -- | -- | -- |
| 7 | Butyl acetate | 0.016 | 0.016 | 0.016 | 0.017 | 0.017 | 0.017 | -- | -- | -- | |
| 8 | Isobutyl alcohol | 0.037 | 0.037 | 0.037 | 0.041 | 0.041 | 0.041 | -- | -- | -- | |
| 9 | Benzene | 6.83 | 6.14 | 10.1 | 1.49 | 1.31 | 23.9 | 0.22 | 0.21 | 2.37 | |
| 10 | Toluene | 14.9 | 12.8 | 15.5 | 10.5 | 11.7 | 17.2 | 0.71 | 0.92 | 1.11 | |
| 11 | Aromatic | p-Xylene | 0.71 | 0.66 | 0.78 | 0.61 | 0.65 | 2.24 | 0.86 | 0.98 | 2.89 |
| 12 | hydrocarbons | m-Xylene | 1.10 | 1.02 | 1.47 | 0.90 | 1.04 | 1.76 | 0.82 | 1.02 | 1.20 |
| 13 | o-Xylene | 0.60 | 0.64 | 0.88 | 0.66 | 0.66 | 1.99 | 1.09 | 1.03 | 2.27 | |
| 14 | Styrene | 0.61 | 0.41 | 0.62 | 0.41 | 0.30 | 1.36 | 0.67 | 0.72 | 2.21 | |
| 15 | Acetic acid | 86.7 | 92.5 | 106 | 66.7 | 33.3 | 232 | 0.77 | 0.36 | 2.18 | |
| 16 | Propionic acid | 12.8 | 5.37 | 11.7 | 6.39 | 1.10 | 27.5 | 0.50 | 0.20 | 2.34 | |
| 17 | i-Butyric acid | 1.15 | 0.48 | 1.07 | 0.68 | 0.16 | 2.51 | 0.59 | 0.33 | 2.35 | |
| 18 | Volatile | n-Butyric acid | 2.15 | 1.06 | 3.04 | 1.24 | 0.20 | 10.5 | 0.58 | 0.19 | 3.46 |
| 19 | fatty acids | i-Valeric acid | 2.30 | 0.40 | 1.34 | 0.018 | 0.018 | 0.018 | - | - | - |
| 20 | n-Valeric acid | 0.83 | 0.50 | 1.48 | 0.68 | 0.07 | 9.9 | 0.82 | 0.14 | 6.69 | |
| 21 | Hexanoic acid | 3.15 | 1.18 | 2.93 | 2.22 | 0.44 | 24.9 | 0.71 | 0.37 | 8.51 | |
| 22 | Heptanoic acid | 0.87 | 0.59 | 0.92 | 0.88 | 0.09 | 11.5 | 1.01 | 0.15 | 12.56 | |
| 23 | Amine | Trimethylamine | 160 | 265 | 465 | 137 | 126 | 772 | 0.86 | 0.47 | 1.66 |
| B. Reference compounds | |||||||||||
| 1 | Aliphatic | n-Decane | 1.46 | 0.97 | 2.33 | 1.00 | 0.93 | 4.29 | 0.69 | 0.96 | 1.84 |
| 2 | hydrocarbons | n-Dodecane | 0.88 | 0.42 | 1.13 | 0.19 | 0.09 | 1.94 | 0.21 | 0.20 | 1.72 |
| 3 | Crotonaldehyde | 28.0 | 4.96 | 51.7 | 12.3 | 0.90 | 111 | 0.44 | 0.18 | 2.14 | |
| 4 | n-Hexanaldehyde | 46.3 | 10.3 | 42.7 | 21.5 | 2.95 | 90.0 | 0.46 | 0.29 | 2.11 | |
| 5 | Aldehydes | n-Heptanal | 13.4 | 2.28 | 18.3 | 6.76 | 0.79 | 45.4 | 0.50 | 0.35 | 2.48 |
| 6 | n-Octanaldehyde | 7.46 | 2.44 | 10.5 | 3.94 | 0.51 | 32.0 | 0.53 | 0.21 | 3.06 | |
| 7 | (E,E)-2,4-Decadienal | 5.54 | 1.01 | 3.96 | 9.38 | 0.45 | 31.3 | 1.69 | 0.45 | 7.92 | |
| 8 | trans-2-Decenal | 14.7 | 2.14 | 13.5 | 11.2 | 0.84 | 62.9 | 0.76 | 0.39 | 4.65 | |
| 9 | 2-Undecenal | 5.85 | 1.10 | 5.07 | 9.29 | 0.56 | 50.7 | 1.59 | 0.51 | 10.00 | |
| 10 | Alcohol | 1-Pentanol | 24.7 | 4.50 | 19.3 | 12.8 | 1.65 | 68.0 | 0.52 | 0.37 | 3.52 |
| 11 | Haloalkane | Chloroform | 8.74 | 49.9 | 55.1 | 18.0 | 63.4 | 53.2 | 2.06 | 1.27 | 0.96 |
| Order | Group | Compound | OI formulaa | OI | ||
|---|---|---|---|---|---|---|
| B-R | B-W | B-O | ||||
| 1 | Aldehydes | Propionaldehyde | Y = 1.010logX + 3.86 | ND | ND | ND |
| 2 | Butyraldehyde | Y = 1.030logX + 4.61 | 2.78 | 1.99 | 3.00 | |
| 3 | Isovaleraldehyde | Y = 1.350logX + 6.01 | 2.70 | 3.13 | 3.55 | |
| 4 | Valeraldehyde | Y = 1.360logX + 5.28 | 3.29 | 2.32 | 3.34 | |
| 5 | Ketones | Methyl ethyl ketone | Y = 1.850logX + 0.149 | −3.65 | −4.01 | −3.62 |
| 6 | Methyl isobutyl ketone | Y = 1.650logX + 2.27 | ND | ND | ND | |
| 7 | Toluene | Y = 1.400logX + 1.05 | −1.51 | −1.60 | −1.49 | |
| 8 | Aromatic | p-Xylene | Y = 1.570logX + 2.44 | −2.51 | −2.56 | −2.44 |
| 9 | hydrocarbons | m-Xylene | Y = 1.460logX + 2.37 | −1.95 | −2.00 | −1.77 |
| 10 | o-Xylene | Y = 1.660logX + 2.24 | −3.10 | −3.07 | −2.84 | |
| 11 | Styrene | Y = 1.420logX + 3.10 | −1.47 | −1.71 | −1.46 | |
| 12 | Propionic acid | Y = 1.380logX + 4.60 | 1.99 | 1.47 | 1.94 | |
| 13 | Volatile | i-Butyric acid | Y = 1.430logX + 5.08 | 0.88 | 0.33 | 0.83 |
| 14 | fatty acids | n-Butyric acid | Y = 1.290logX + 6.37 | 2.93 | 2.53 | 3.12 |
| 15 | n-Valeric acid | Y = 1.580logX + 7.29 | 2.42 | 2.07 | 2.82 | |
| 16 | Amine | Trimethylamine | Y = 0.901logX + 4.56 | 3.84 | 4.04 | 4.26 |
| SOIc | -- | 4.05 | 4.12 | 4.43 | ||
4. Conclusions
Abbreviations
| ACA | acetic acid |
| ADL | activities of daily living |
| B | benzene |
| BA | butyraldehyde |
| BTA | n-butyric acid |
| BuAc | butyl acetate |
| CLASS | compounds lacking authentic standards or surrogates |
| CN | carbon number |
| CT | cold trap |
| FSC | fixed standard concentration |
| FSV | fixed standard volume |
| GC | gas chromatography |
| HPA | heptanoic acid |
| HVAC | heating, ventilating, and air conditioning |
| HXA | hexanoic acid |
| IA | i-valeraldehyde |
| IAQ | indoor air quality |
| IBA | i-butyric acid; i-BuAl; i-butyl alcohol |
| IVA | i-valeric acid |
| MDL | method detection limits |
| MEK | methyl ethyl ketone |
| MIBK | methyl i-butyl ketone |
| MS | mass spectrometry |
| PA | propionaldehyde |
| PEA | polyester aluminum |
| PM | particulate matter |
| PPA | propionic acid |
| ppb | parts per billion |
| QA | quality assurance |
| QC | quality control |
| RF | response factor |
| RGC | reagent grade chemical |
| RH | relative humidity |
| RSE | relative standard error |
| S | styrene |
| SBS | sick building syndrome |
| ST | sorbent tube |
| T | toluene |
| TD | thermal desorption |
| TMA | trimethylamine |
| TVOC | total VOC emissions |
| VA | valeraldehyde |
| VLA | n-valeric acid |
| VOC | volatile organic compound |
| WS | working standard |
| X | xylene |
Acknowledgments
Author Contributions
Conflicts of Interest
References
- Klepeis, N.E.; Nelson, W.C.; Ott, W.R.; Robinson, J.P.; Tsang, A.M.; Switzer, P.; Behar, J.V.; Hern, S.C.; Engelmann, W.H. The National Human Activity Pattern Survey (NHAPS): A resource for assessing exposure to environmental pollutants. J. Expo. Anal. Environ. Epidemiol. 2001, 11, 231–252. [Google Scholar] [CrossRef] [PubMed]
- Weschler, C.J. Changes in indoor pollutants since the 1950s. Atmos. Environ. 2009, 43, 153–169. [Google Scholar] [CrossRef]
- Shin, S.H.; Jo, W.K. Longitudinal variations in indoor VOC concentrations after moving into new apartments and indoor source characterization. Environ. Sci. Pollut. Res. 2013, 20, 3696–3707. [Google Scholar] [CrossRef]
- Nazaroff, W.W.; Weschler, C.J. Cleaning products and air fresheners: exposure to primary and secondary air pollutants. Atmos. Environ. 2004, 38, 2841–2865. [Google Scholar] [CrossRef]
- Long, C.M.; Suh, H.H.; Koutrakis, P. Characterization of indoor particle sources using continuous mass and size monitors. J. Air Waste Manag. Assoc. 2000, 50, 1236–1250. [Google Scholar] [CrossRef] [PubMed]
- Hammond, C.J. Chemical composition of household malodours—An overview. Flavour Frag. J. 2013, 28, 251–261. [Google Scholar] [CrossRef]
- Redlich, C.A.; Sparer, J.; Cullen, M.R. Sick-building syndrome. Lancet 1997, 349, 1013–1016. [Google Scholar] [CrossRef] [PubMed]
- Jones, A.P. Indoor air quality and health. Atmos. Environ. 1999, 33, 4535–4564. [Google Scholar] [CrossRef]
- Ahmad, I.; Tansel, B.; Mitrani, J.D. Effectiveness of HVAC duct cleaning procedures in improving indoor air quality. Environ. Monit. Assess. 2001, 72, 265–276. [Google Scholar] [CrossRef]
- Choi, J.H.; Han, S.Y.; Han, J.H.; Jo, H.J.; Kim, K.H. A preliminary study of hazardous pollutants released from the smoke of fish frying. Korean J. Odor Res. Eng. 2011, 10, 1–7. [Google Scholar]
- Ko, Y.C.; Cheng, L.S.C.; Lee, C.H.; Huang, J.J.; Huang, M.S.; Kao, E.L.; Wang, H.Z.; Lin, H.J. Chinese food cooking and lung cancer in women nonsmokers. Am. J. Epidemiol. 2000, 152, 140–147. [Google Scholar] [CrossRef] [PubMed]
- Kim, K.H.; Jahan, S.A.; Kabir, E. A review of diseases associated with household air pollution due to the use of biomass fuels. J. Hazard. Mater. 2011, 192, 425–431. [Google Scholar] [CrossRef] [PubMed]
- Kim, K.H.; Pandey, S.K.; Kabir, E.; Susaya, J.; Brown, R.J. The modern paradox of unregulated cooking activities and indoor air quality. J. Hazard. Mater. 2011, 195, 1–10. [Google Scholar] [CrossRef] [PubMed]
- Kim, K.H.; Kim, Y.H.; Kim, B.W.; Ahn, J.H.; Bae, M.S.; Brown, R.J. The reproducibility of indoor air pollution (IAP) measurement: A test case for the measurement of key air pollutants from the pan frying of fish samples. Sci. World J. 2014, 2014. [Google Scholar] [CrossRef]
- Kim, Y.H.; Kim, K.H. A statistical estimation approach for quantitative concentrations of compounds lacking authentic standards/surrogates based on linear correlations between directly measured detector responses and carbon number of different functional groups. Sci. World J. 2013, 2013. [Google Scholar] [CrossRef]
- Szulejko, J.E.; Kim, Y.H.; Kim, K.H. Method to predict gas chromatographic response factors for the trace-level analysis of volatile organic compounds based on the effective carbon number concept. J. Sep. Sci. 2013, 36, 3356–3365. [Google Scholar] [PubMed]
- Kim, K.H.; Nguyen, H.T. Effects of injection volume change on gas chromatographic sensitivity determined with two contrasting calibration approaches for volatile organic compounds. J. Sep. Sci. 2007, 30, 367–374. [Google Scholar] [CrossRef] [PubMed]
- U.S. EPA Compendium Method TO-17. Determination of Volatile Organic Compounds in Ambient Air Using Active Sampling onto Sorbent Tubes. Available online: http://berkeleyanalytical.com/node/1703 (accessed on 13 November 2014).
- Kim, K.H.; Lee, M.H.; Szulejko, J.E. Simulation of the breakthrough behavior of volatile organic compounds against Tenax TA sorbent tube sampler as a function of concentration level and sampling volume. Anal. Chim. Acta 2014, 835, 46–55. [Google Scholar] [CrossRef] [PubMed]
- Szulejko, J.E.; Kim, K.H. Re-evaluation of effective carbon number (ECN) approach to predict response factors of “compounds lacking authentic standards or surrogates” (CLASS) by thermal desorption analysis with GC-MS. Anal. Chim. Acta 2014, 851, 14–22. [Google Scholar] [CrossRef]
- Kim, K.H.; Choi, G.H.; Choi, Y.J.; Song, H.N.; Yang, H.S.; Oh, J.M. The effects of sampling materials selection in the collection of reduced sulfur compounds in air. Talanta 2006, 68, 1713–1719. [Google Scholar] [CrossRef]
- Refsgaard, H.H.F.; Haahr, A.M.; Jensen, B. Isolation and quantification of volatiles in fish by dynamic headspace sampling and mass spectrometry. J. Agric. Food Chem. 1999, 47, 1114–1118. [Google Scholar] [CrossRef] [PubMed]
- Kim, Y.H.; Kim, K.H. An accurate and reliable analysis of trimethylamine using thermal desorption and gas chromatography-time of flight mass spectrometry. Anal. Chim. Acta 2013, 780, 46–54. [Google Scholar] [CrossRef] [PubMed]
- Arh, G.; Klasinc, L.; Veber, M.; Pompe, M. Modeling of the mass spectrometric response factors in non-target analysis. Acta Chim. Slov. 2010, 57, 581–585. [Google Scholar] [PubMed]
- Nagata, Y. Measurement of Odor Threshold by Triangle Odor Bag Method; Odor Measurement Review; Ministry of Environment (MOE): Osaka, Japan, 2003; pp. 118–127.
- Ahn, J.W.; Oh, K.Y.; Park, S.Y.; Lee, K.H.; Kim, Y.H.; Kim, K.H. Characterization of odorous emissions from decaying food samples: A case study on trimethylamine and ammonia. Korean J. Odor Res. Eng. 2007, 6, 172–182. [Google Scholar]
- Jo, S.H.; Kim, K.H.; Park, S.J. Emission characteristics of reduced sulfur compounds due to cooking activities. Korean J. Odor Res. Eng. 2011, 10, 62–68. [Google Scholar]
- Kim, B.W.; Ahn, J.H.; Kim, K.H.; Jo, S.H. Emission characteristics of odorous sulfur gases from food types: A case study on boiled egg, milk, canned meat, and strawberry. J. Korean Soc. Atmos. Environ. 2013, 29, 615–624. [Google Scholar] [CrossRef]
- Kabir, E.; Kim, K.H. An investigation on hazardous and odorous pollutant emission during cooking activities. J. Hazard. Mater. 2011, 188, 443–454. [Google Scholar] [CrossRef] [PubMed]
- Sundell, J. On the history of indoor air quality and health. Indoor Air 2004, 14, 51–58. [Google Scholar] [CrossRef] [PubMed]
© 2014 by the authors; licensee MDPI, Basel, Switzerland. This article is an open access article distributed under the terms and conditions of the Creative Commons Attribution license (http://creativecommons.org/licenses/by/4.0/).
Share and Cite
Ahn, J.-H.; Szulejko, J.E.; Kim, K.-H.; Kim, Y.-H.; Kim, B.-W. Odor and VOC Emissions from Pan Frying of Mackerel at Three Stages: Raw, Well-Done, and Charred. Int. J. Environ. Res. Public Health 2014, 11, 11753-11771. https://doi.org/10.3390/ijerph111111753
Ahn J-H, Szulejko JE, Kim K-H, Kim Y-H, Kim B-W. Odor and VOC Emissions from Pan Frying of Mackerel at Three Stages: Raw, Well-Done, and Charred. International Journal of Environmental Research and Public Health. 2014; 11(11):11753-11771. https://doi.org/10.3390/ijerph111111753
Chicago/Turabian StyleAhn, Jeong-Hyeon, Jan E. Szulejko, Ki-Hyun Kim, Yong-Hyun Kim, and Bo-Won Kim. 2014. "Odor and VOC Emissions from Pan Frying of Mackerel at Three Stages: Raw, Well-Done, and Charred" International Journal of Environmental Research and Public Health 11, no. 11: 11753-11771. https://doi.org/10.3390/ijerph111111753