1. Introduction
Currently, parasiticide drugs are considered one of the pillars that sustain the extensive livestock, particularly in tropical regions where the environmental conditions, such as high temperature and humidity, have an important role on both cattle production and the spread of parasites in farm animals. In Brazil, which is one of the world's largest producers of food of animal origin, parasitic diseases are by far the most important factor responsible for livestock production losses [
1]. Among all parasites that affect livestock in Brazil, ectoparasites such as ticks have been considered as one of the main causes of substantial reductions in the production of food such as milk [
2]. Nowadays, the control of parasitic diseases of veterinary importance still relies on the use of chemicals, being pyrethroid-insecticides (PYR;
Figure 1 and
Table 1), especially cypermethrin, widely used for this purpose [
2,
3,
4]. Although most parasites have a well-defined life cycle, which leads to the application of antiparasitic drugs only in specific periods along the year, tick infestations may occur at any time and control relies on the continuous usage of PYR in dairy cattle, which may lead to the undesirable occurrence of its residues in milk or meat [
5,
6,
7,
8].
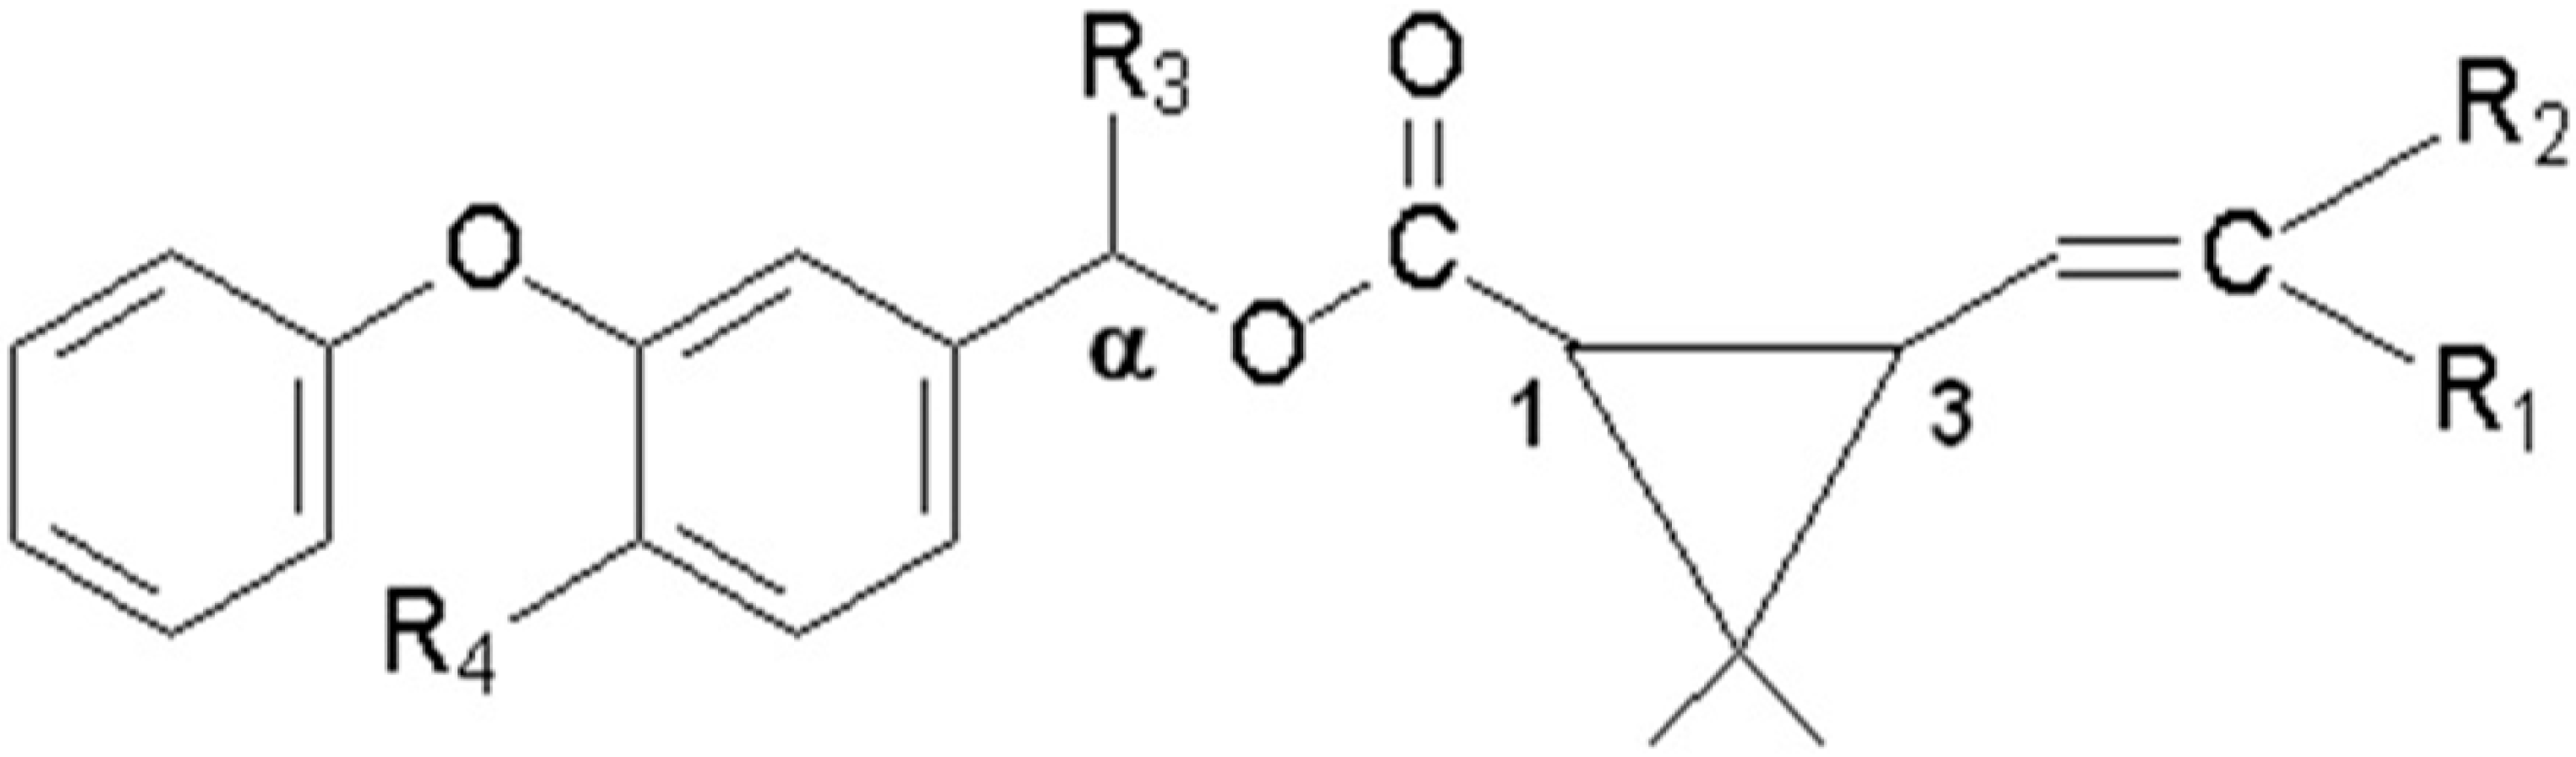
Figure 1.
General structure of the pyrethroids included in the study.
Figure 1.
General structure of the pyrethroids included in the study.
Table 1.
Substituted radicals represented in the
Figure 1 for each pyrethroid.
Table 1.
Substituted radicals represented in the Figure 1 for each pyrethroid.
| Pyrethroid | MW a | R1 b | R2 b | R3 b | R4 b |
|---|
| Gamma-cyhalothrin | 449.9 | Cl | CF3 | CN | H |
| Lambda-cyhalothrin | 449.9 | Cl | CF3 | CN | H |
| cyfluthrin | 391.3 | Cl | Cl | H | H |
| cypermethrin | 434.4 | Cl | Cl | CN | F |
| permethrin | 391.3 | Cl | Cl | CN | H |
| deltamethrin | 434.4 | Br | Br | CN | H |
| fenvalerate | 416.3 | H | Cl | CN | H |
There are several ways these compounds reach the milk, including improper use of the drug, contamination of animal feedstuffs, environmental contamination (from the use of PYR as insecticide) and animal-to-animal drug transfer compromising milk quality. Moreover, considering the diverse nature of PYR contamination, this group has been studied in both environment and food contamination cycles [
4,
5,
6,
7].
According to recent reports, PYR has mainly been analyzed in different matrices either by liquid chromatography with UV detection (LC-UV) or coupled to mass spectrometry with single (LC-MS) or triple quadrupole (LC-MS/MS), and by gas chromatography with electron capture detector (GC-ECD) or coupled to mass spectrometry with single (GC-MS) or triple quadrupole (GC-MS/MS). Although a greater emphasis has been given to mass spectrometry detectors due to the confirmatory nature of this technique, GC-ECD is an important routine tool and the most commonly used detection technique for PYR analyses at low detection limits [
4,
9,
10,
11,
12,
13,
14]. However, methods based on GC-ECD commonly require more laborious and complex sample preparation in order to remove matrix compounds that can improve the imprecision of the analytical method. Furthermore, it can lead to an increase in the use of sorbents and organic solvents.
In Brazil, PYR residues in milk are monitored by a network of analytical laboratories (LANAGRO) through the National Residue Control Plan (NRCP) established by the Brazilian Ministry of Agriculture (MAPA). Generally, PYR residues were determined using methods based on extraction with C18 sorbents and analysis by gas chromatography. Private laboratories linked to MAPA laboratories network may use other analytical methods since they are sensible, confirmatory, and has been fully validated. To meet these requirements for the analysis of PYR in complex matrices, it is essential that the sample preparation technique be effective and provide extracts as free as possible of interfering compounds. For this purpose, different sample extraction procedures have been employed based on techniques such as liquid-liquid extraction (LLE) [
15], solid-phase extraction (SPE), solid-phase micro extraction (SPME) [
16], matrix solid-phase dispersion (MSPD) [
17], supercritical fluid extraction (SFE) [
18] and others, typically in off-line mode and, more recently, in on-line procedures and also by using automatic devices [
19]. The advantages and drawbacks of each technique must be considered. For instance, the combination of high temperature and pressure (SFE) may cause degradation and/or isomer conversion of synthetic pyrethroids; presence of carry-over effect or high cost (SPME) [
19]. Recently, our laboratory (LANAGRO-RS) has proposed an alternative cleanup procedure based on low temperature cleanup (LT) instead of sorbent-based procedures for residue analysis in milk [
20]. Briefly, raw extract was put on a freezer at −20 °C [
14]. Under this condition, the interfering compounds are frozen, whereas moderately polar to apolar analytes remains in the liquid phase and are subsequently separated [
14].
Variability in the matrix composition plays important role in GC-ECD analysis because co-extractive compounds can generate variations in instrumental response (e.g., liner interaction, baseline noise) and, in this way, the extraction method requires a carefully planned optimization. Notwithstanding, fat content and other endogenous compounds are subject to seasonal and regional variation. Besides, some physico-chemical PYR characteristics, including lipophilicity and surface adsorption, can generate inefficient extraction rates [
19,
21,
22].
Method development became more effective using multivariate optimization because more information is obtained about the interaction among the variables, sometimes undetected when univariate approach is used [
19,
23,
24,
25]. For analytical purposes, the Doehlert one has shown to be the most adequate kind of design and can be applied to response surfaces with a good estimation of the parameters of the quadratic mathematical model, allowing the study of independent variables, at different levels, and has been successfully used for optimization of extraction methods in food analysis [
25,
26].
In this way, the present work describes the use of a Doehlert design to optimize the development of a low cost method for determination of the pyrethroids cyfluthrin (CYF), gamma-cyhalothrin (g-CYH), lambda-cyhalothrin (l-CYH), cypermethrin (CYP), deltamethrin (DEL), fenvalerate (FEV) and permethrin (PER) in raw milk using GC-ECD and GC-MS/MS, as well as the practical issues for the implementation of the proposed method in the Brazilian NRCP.
2. Experimental Section
2.1. Chemicals and Apparatus
Individual PYR standards with purity between 96.7%–99.8% (CYF, CYP, l-CYH, g-CYH, DEL, FEV and PER) were obtained from Riedel-de-Häen (Seelze, Germany). CYF, CYP, FEV and PER were a mixture of isomers. A stock solution of each pesticide was prepared individually in acetonitrile (ACN) to obtain the primary calibration solution (1000 mg·L−1; stored at −20 °C) from which the intermediate standard solutions were prepared by dilution in ACN at 100 mg·L−1 and stored in a refrigerator at 5 °C. Methanol (MeOH), hexane (HEX), acetone (ACO), ethyl acetate (EAC), anhydrous sodium sulfate (Na2SO4), were purchased from Mallinckrodt Baker (Phillipsburg, NJ, USA). The sorbent material for the matrix solid phase dispersion (MSPD) was Lichroprep® RP-C18 (25–40 μm, non-endcapped, 16% carbon load; Merck®, Darmstadt, Germany) that was exhaustively prewashed with solvent including MeOH, ACO, ACN and HEX before use. Blank milk samples were obtained from certified producer. Raw milk samples were collected in dairy plants by Federal Inspection Service (SIF).
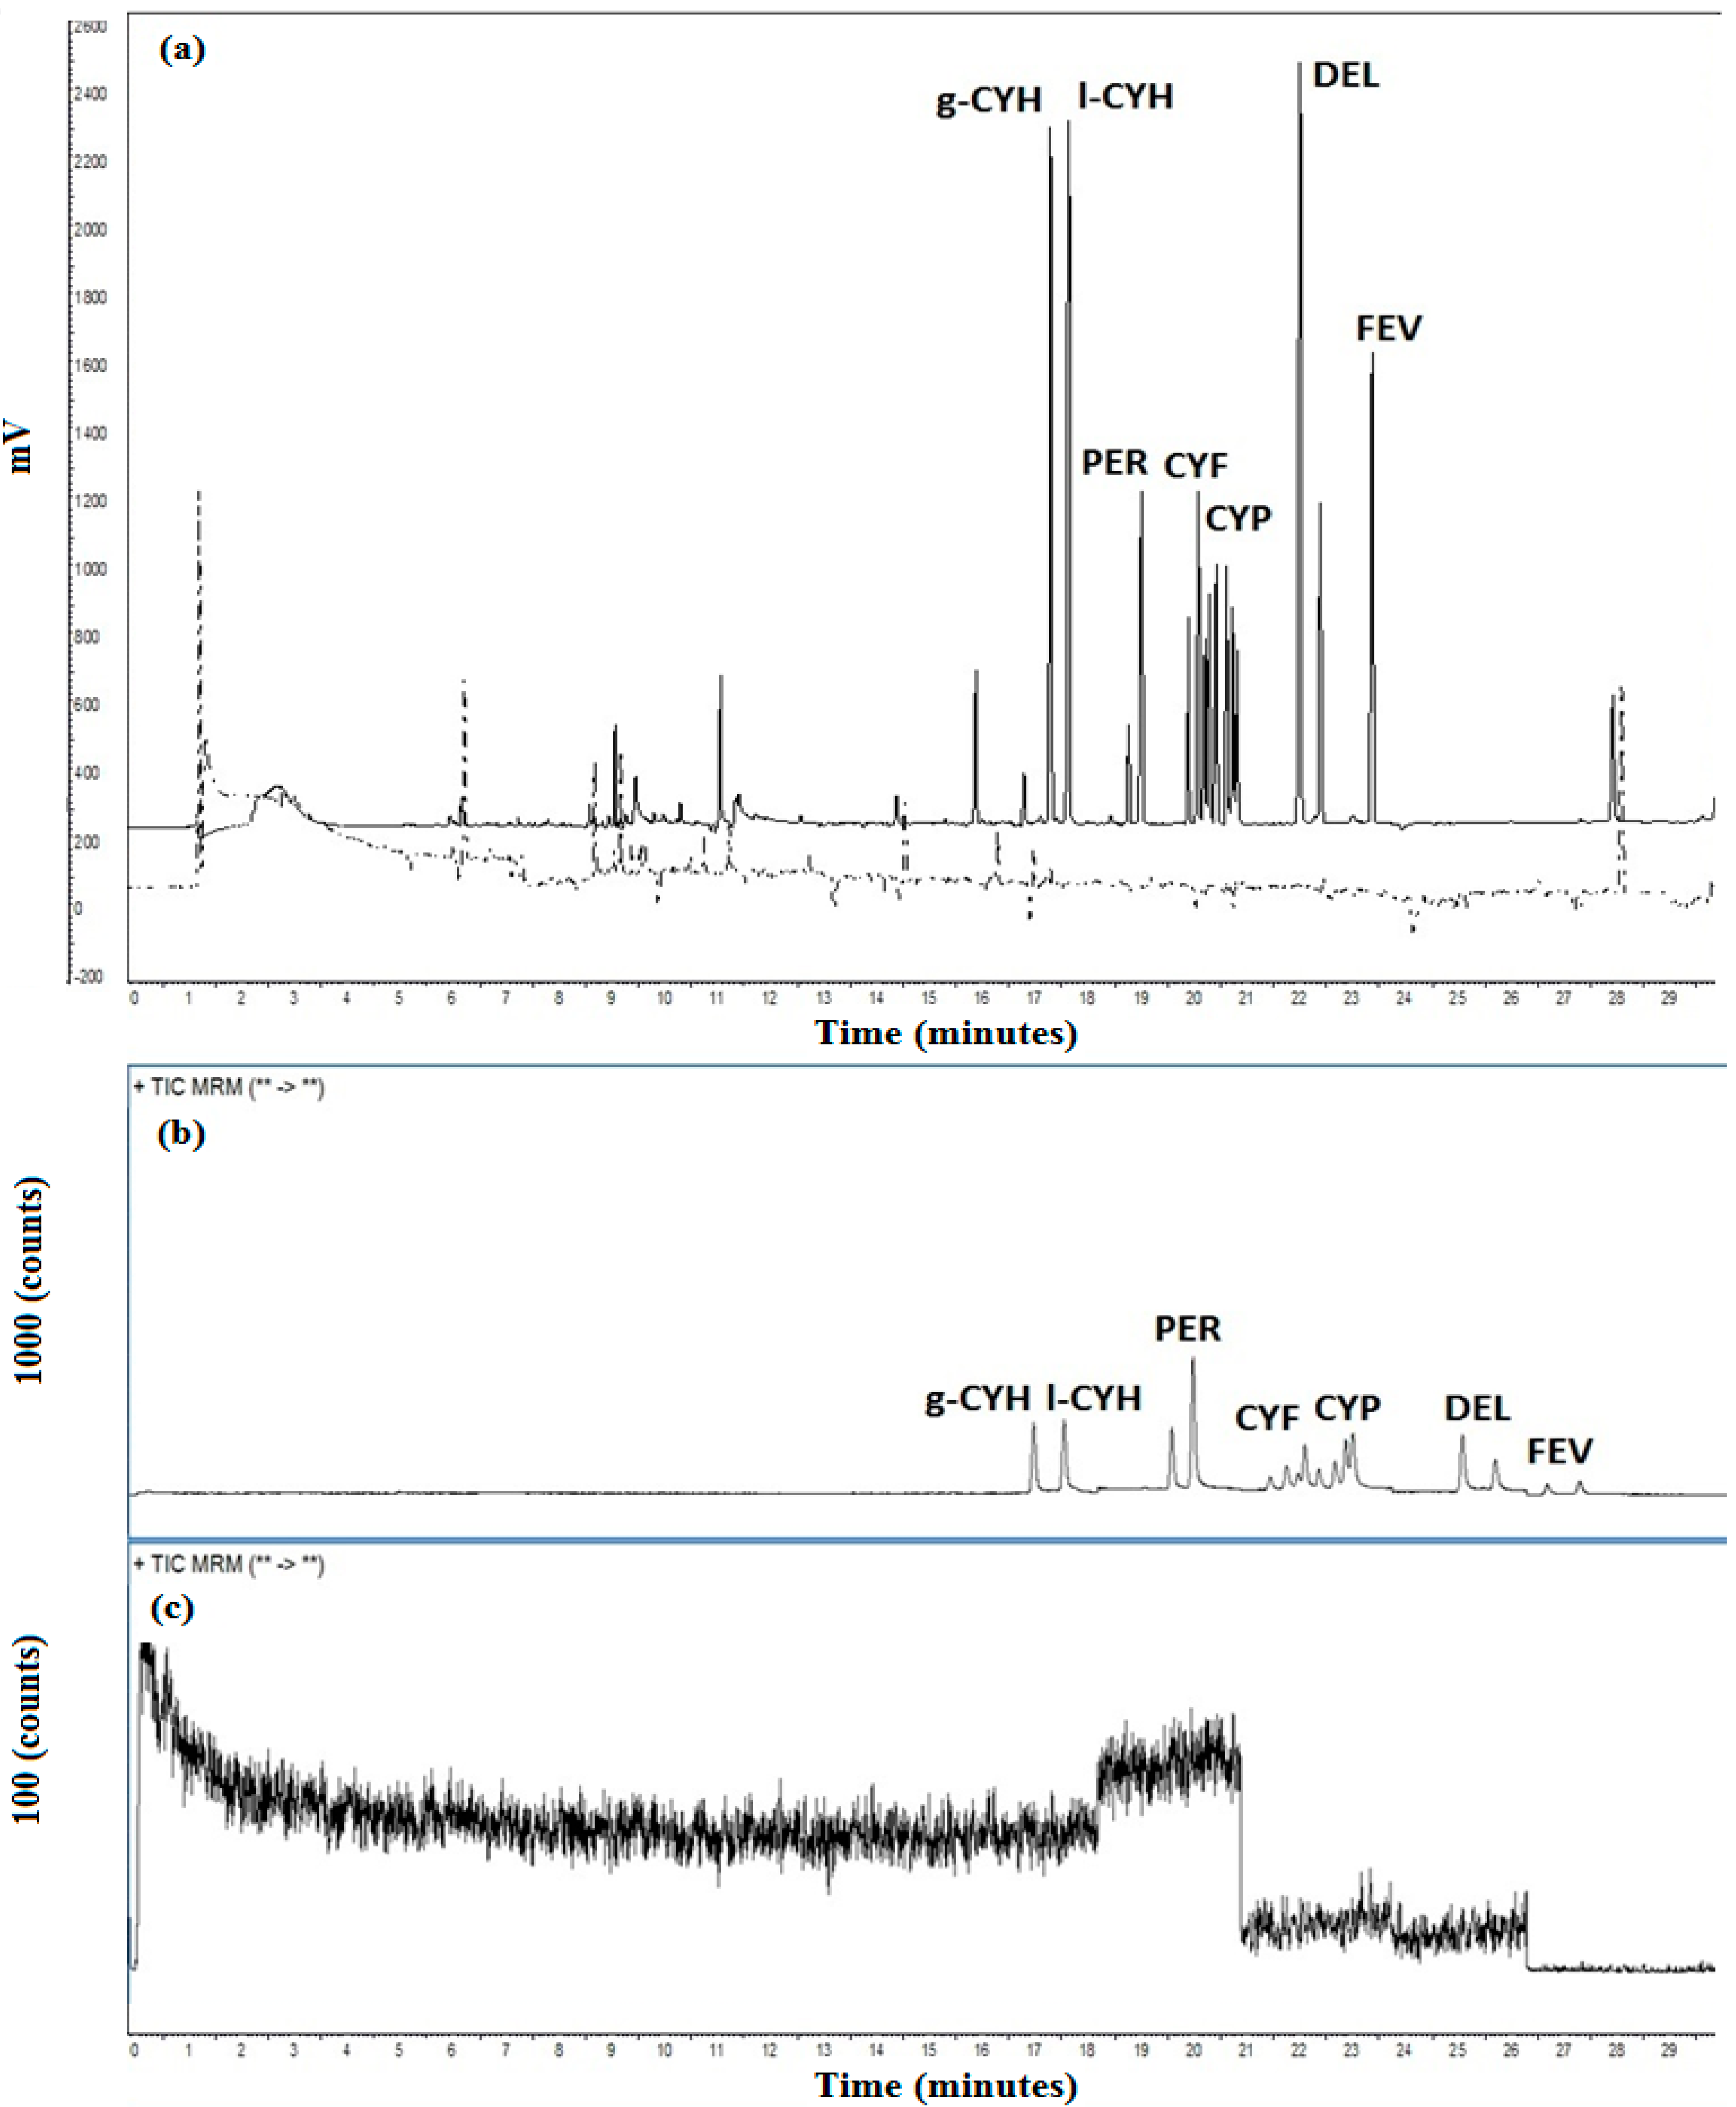
2.2. Chromatographic Analysis
GC-ECD analysis was achieved using a GC Trace Ultra (Thermo®) gas chromatograph equipped with a split/splitless injection system (used in splitless mode), autosampler AI 3000® and a 63Ni ECD source. For separation of PYR, several capillary columns were tested: 14% cyanopropyl-phenyl-methylpolysiloxane (OV-1701, Ohio Valley, 30 m × 0.53 mm × 0.5 μm film thickness), 100% dimethylpolysiloxane (ZB1, Phenomenex, 30 m × 0.25 mm × 0.25 μm film thickness), 5% phenyl-methyl-polysiloxane (OV-5, Ohio Valley, 15.0 m × 0.25 mm × 0.1 μm film thickness) and 5% phenyl-95% dimethyl polisiloxane (ZB5, Phenomenex, 30 m × 0.25 mm × 0.10 μm film thickness). The temperature program for these columns were the same: 100 °C (1 min) to 250 °C at 20 °C·min−1, to 260 °C (3 min) at 5 °C·min−1 and to 330 °C (5 min) at 20 °C·min−1. The injector and detector temperature were 240 °C and 340 °C, respectively. Helium was used as carrier gas with the flow of 1.2 mL·min−1 and N2 as make-up gas (30 mL·min−1). The injection volume was 3.0 μL in splitless mode for all standards and samples. This technique was used for both extraction method evaluation and, after method validation, for real sample analysis.
Analysis by GC-MS/MS was performed in an Agilent 7000 gas chromatograph (Agilent, Santa Clara, CA, USA) coupled to a mass spectrometry detector in tandem mode. Samples were introduce into GC using an auto sampler 7890 A with pulsed splitless mode with temperature program 70 °C at 0.1 min, 400 °C·min−1 until 240 °C and pulse of the 35 psi for 3 min; 3 μL. Mass spectrometry analysis was carried out through multiple reaction mode (MRM) monitoring 2 transitions (qualitative and quantitative). Chromatographic column was a DB-5ms (30 m × 0.25 mm × 0.25 μm film thickness). Helium was used as carrier gas with the flow of 1.2 mL·min−1 and N2 was used as collision gas. This technique was used for real sample analysis after method validation.
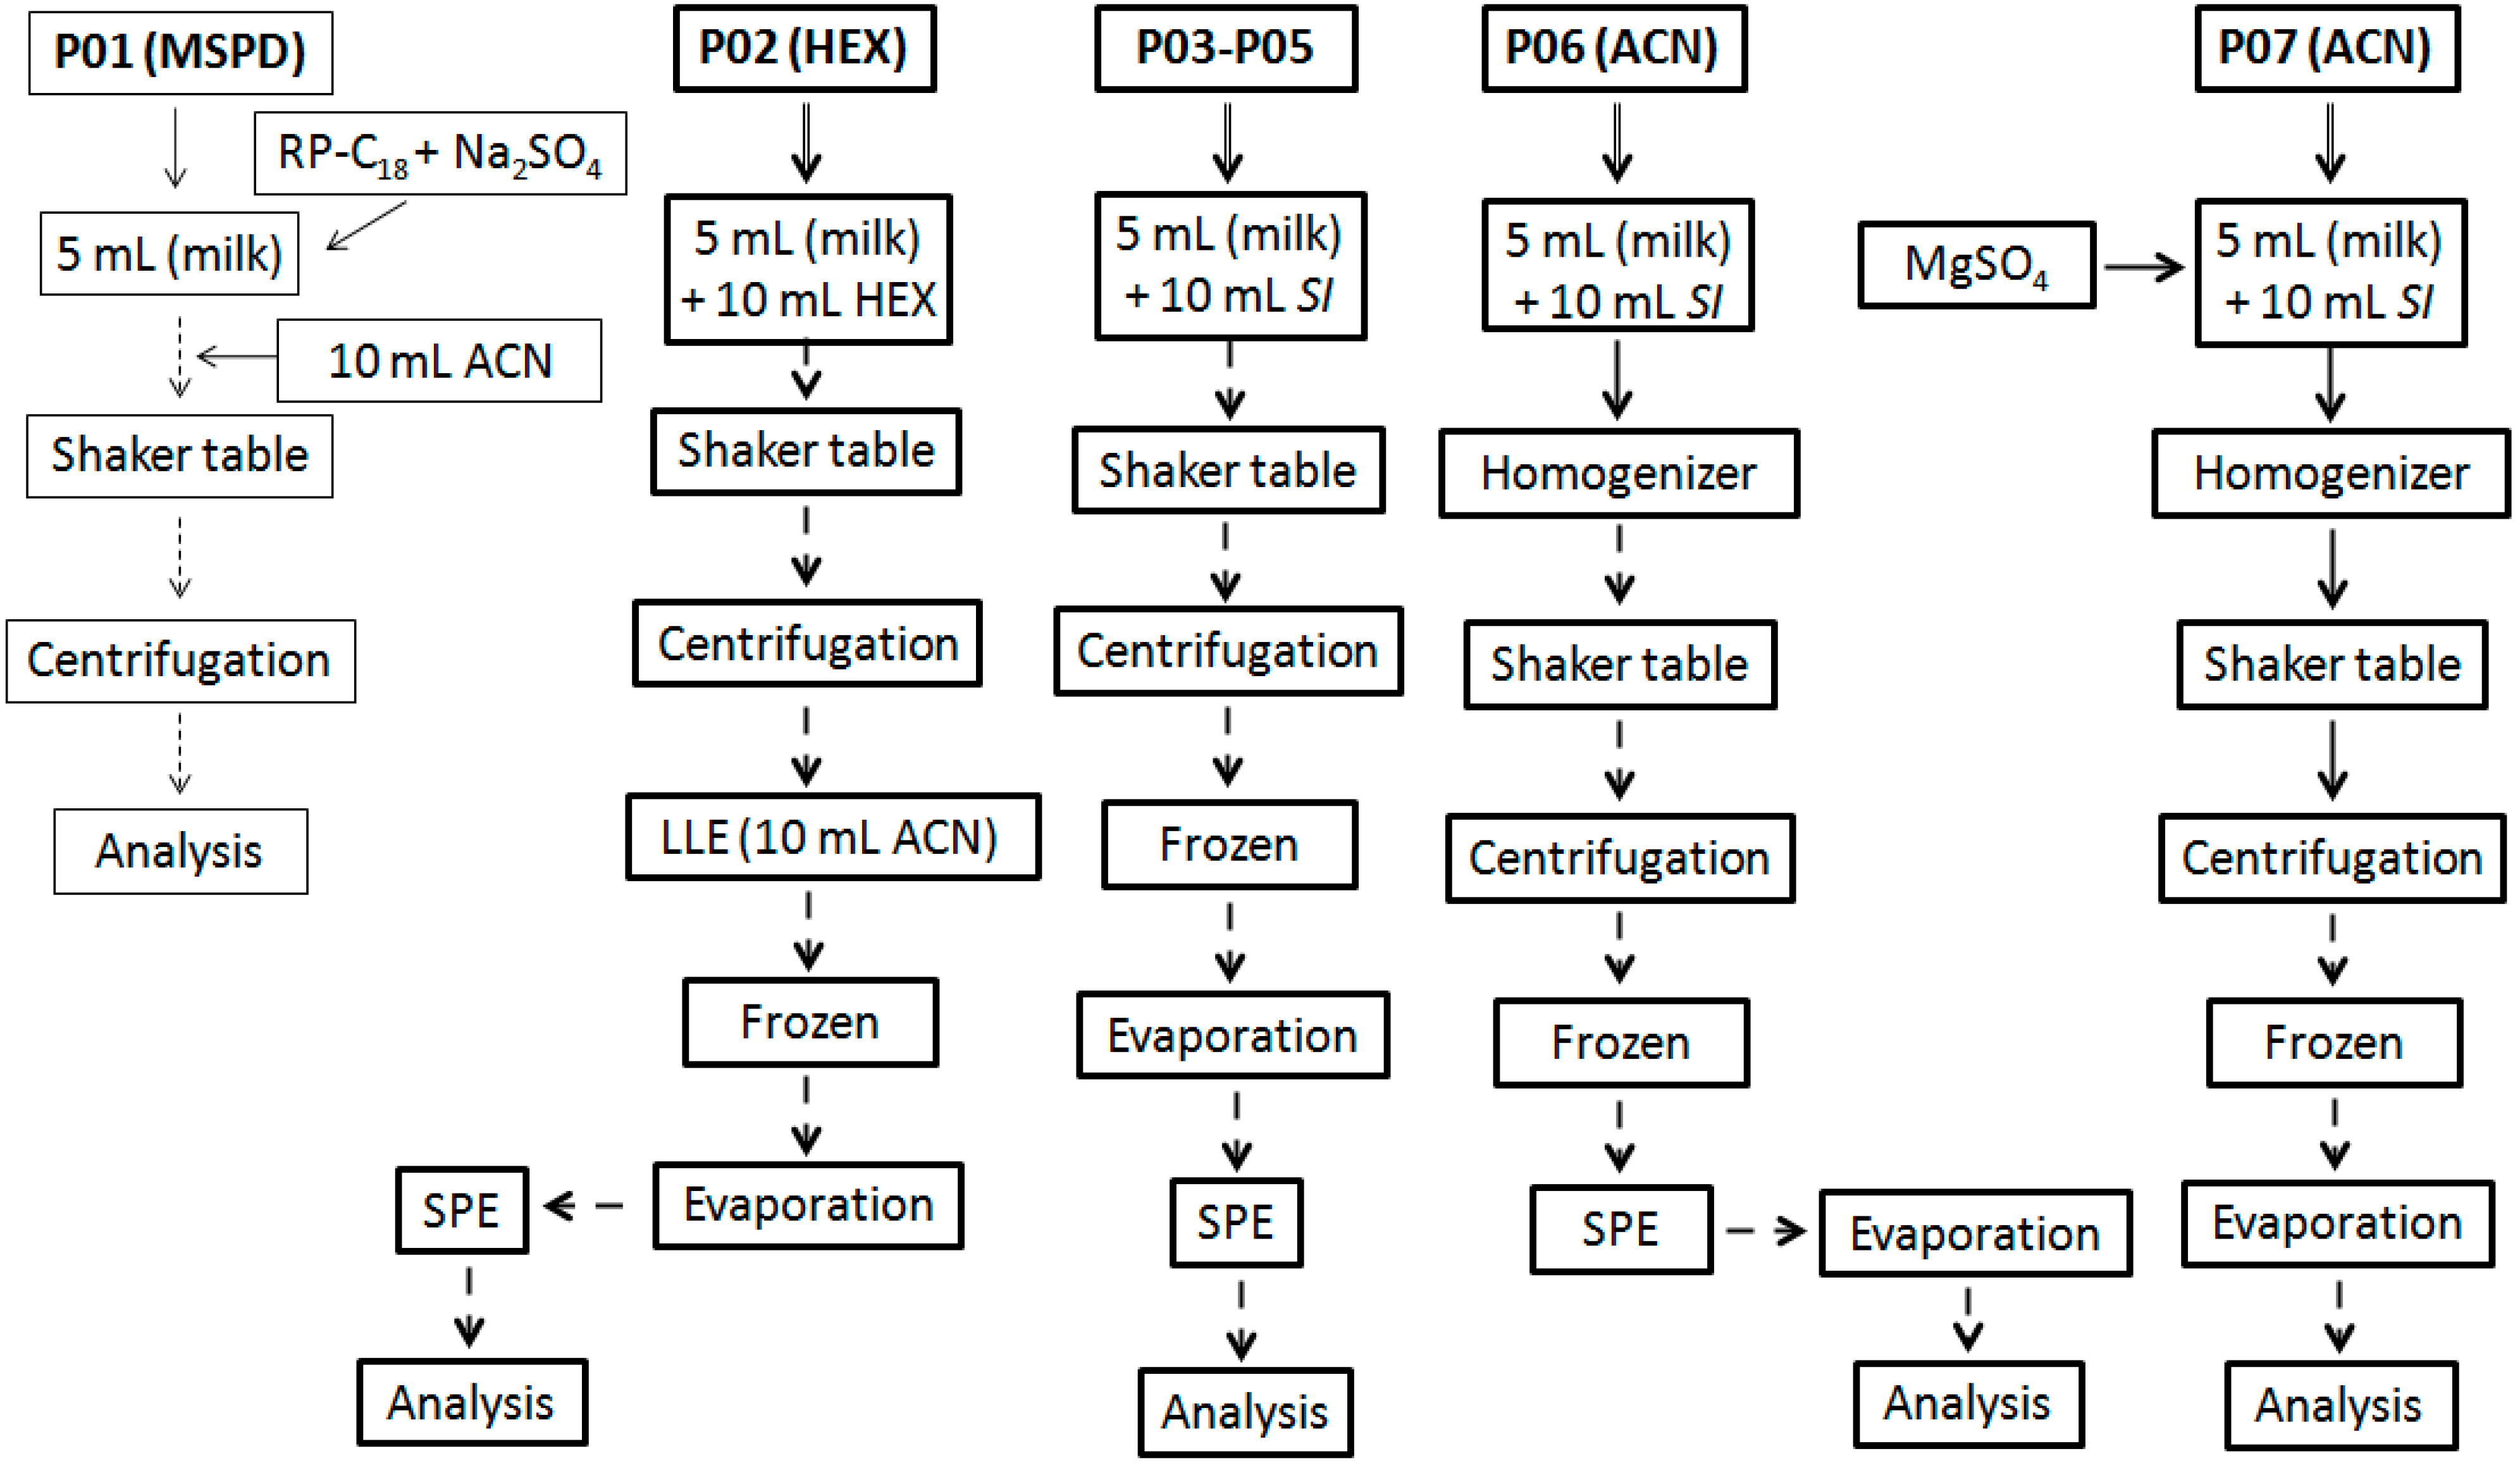
2.3. Extraction Methodologies
Different procedures, named as
protocol (
P; numbered from 1 to 7), were used and evaluated in terms of extraction and cleanup efficiency. The workflow summary is showed in the
Figure 2 (P01 to P07). They were carried out on six replicates per protocol in batches composed by blank samples spiked with all PYR analytes at maximum residue level (MRL) defined in NRCP 2013 [
23,
24]. Extraction efficiency was verified in terms of recovery (
RE; percentage) by comparison between tissue standard (
TS; samples spiked after extraction procedure, in a matrix-matched approach) and samples spiked with PYR pool before extraction (standard addition method). Additionally, clean-up efficiency was evaluated in terms of remaining co-extractive material (CoE) determined by gravimetry, weighting the sample tube before the introduction of the extract and after the full evaporation of the extract solvent and by spectrophotometric measurements (505 nm, Analisa
® assay kit for triglycerides quantification), measuring the absorbance intensity of the extract introduced on a spectrophotometer. The protocols used in the present study are briefly described thereupon.
Figure 2.
Summary of the procedures evaluated for sample preparation.
Figure 2.
Summary of the procedures evaluated for sample preparation.
P01 was based on MSPD approach (Lichroprep®, RP-C18, Merck) using a sample volume (SV) of 5 mL, which was subsequently added with 2 g of RP-C18 plus 2 g of Na2SO4, homogenized in vortex for 1 min and stabilized by 1 h under continuous stirring in a shaker. Then, 10 mL of ACN was added to the mixture in order to produce analyte extraction. This mixture was homogenized for 2 min and centrifuged (15 min, 4000 g, 0 °C). The supernatant was transferred for a new tube, evaporated to dryness under N2 flow, at 40 °C, and reconstituted with 1.0 mL of ACN.
P02 was based on liquid-liquid extraction (LLE) with purification at low temperature (LLE-LTP). For P02, hexane was used as starting solvent (SI), adding 10 mL to a tube containing milk and homogenizing the mixture in a horizontal table (180 rpm, 30 min). This mixture was subsequently centrifuged and the supernatant was transferred to the new tube and stored in the freezer (−20 °C for 12 h). When raw milk was used as sample, an additional step of LLE with ACN (10 mL) was necessary before the frozen step in order to remove less lipophilic interfering compounds. After 12 h, the clean liquid phase was passed through a glass column containing Na2SO4 (2.0 g), transferred to a new tube and evaporated to dryness (40 °C) under N2 flow. The residual content was reconstituted to 1.0 mL with hexane and washed with a mixture of hexane: ethyl acetate (v/v; 98:2) through a silica SPE cartridge. Eluate was evaporated to dryness (40 °C) under N2 flow, reconstituted to 300 μL (ACN) and analyzed by GC. The protocols P03-P05 employed the same workflow just changing the SI for acetone, ethyl acetate, and ACN (P03, P04 and P05, respectively).
The P06, after solvent addition, a high-speed homogenizer (Ultra-Turrax®; 5 s, 4000 rpm) was used as additional operation but maintaining the same others steps used in P02–P05. Extraction with P07 followed the same workflow that P06, but before high-speed homogenizer step, MgSO4 was added, which dismissed the subsequent use of SPE.
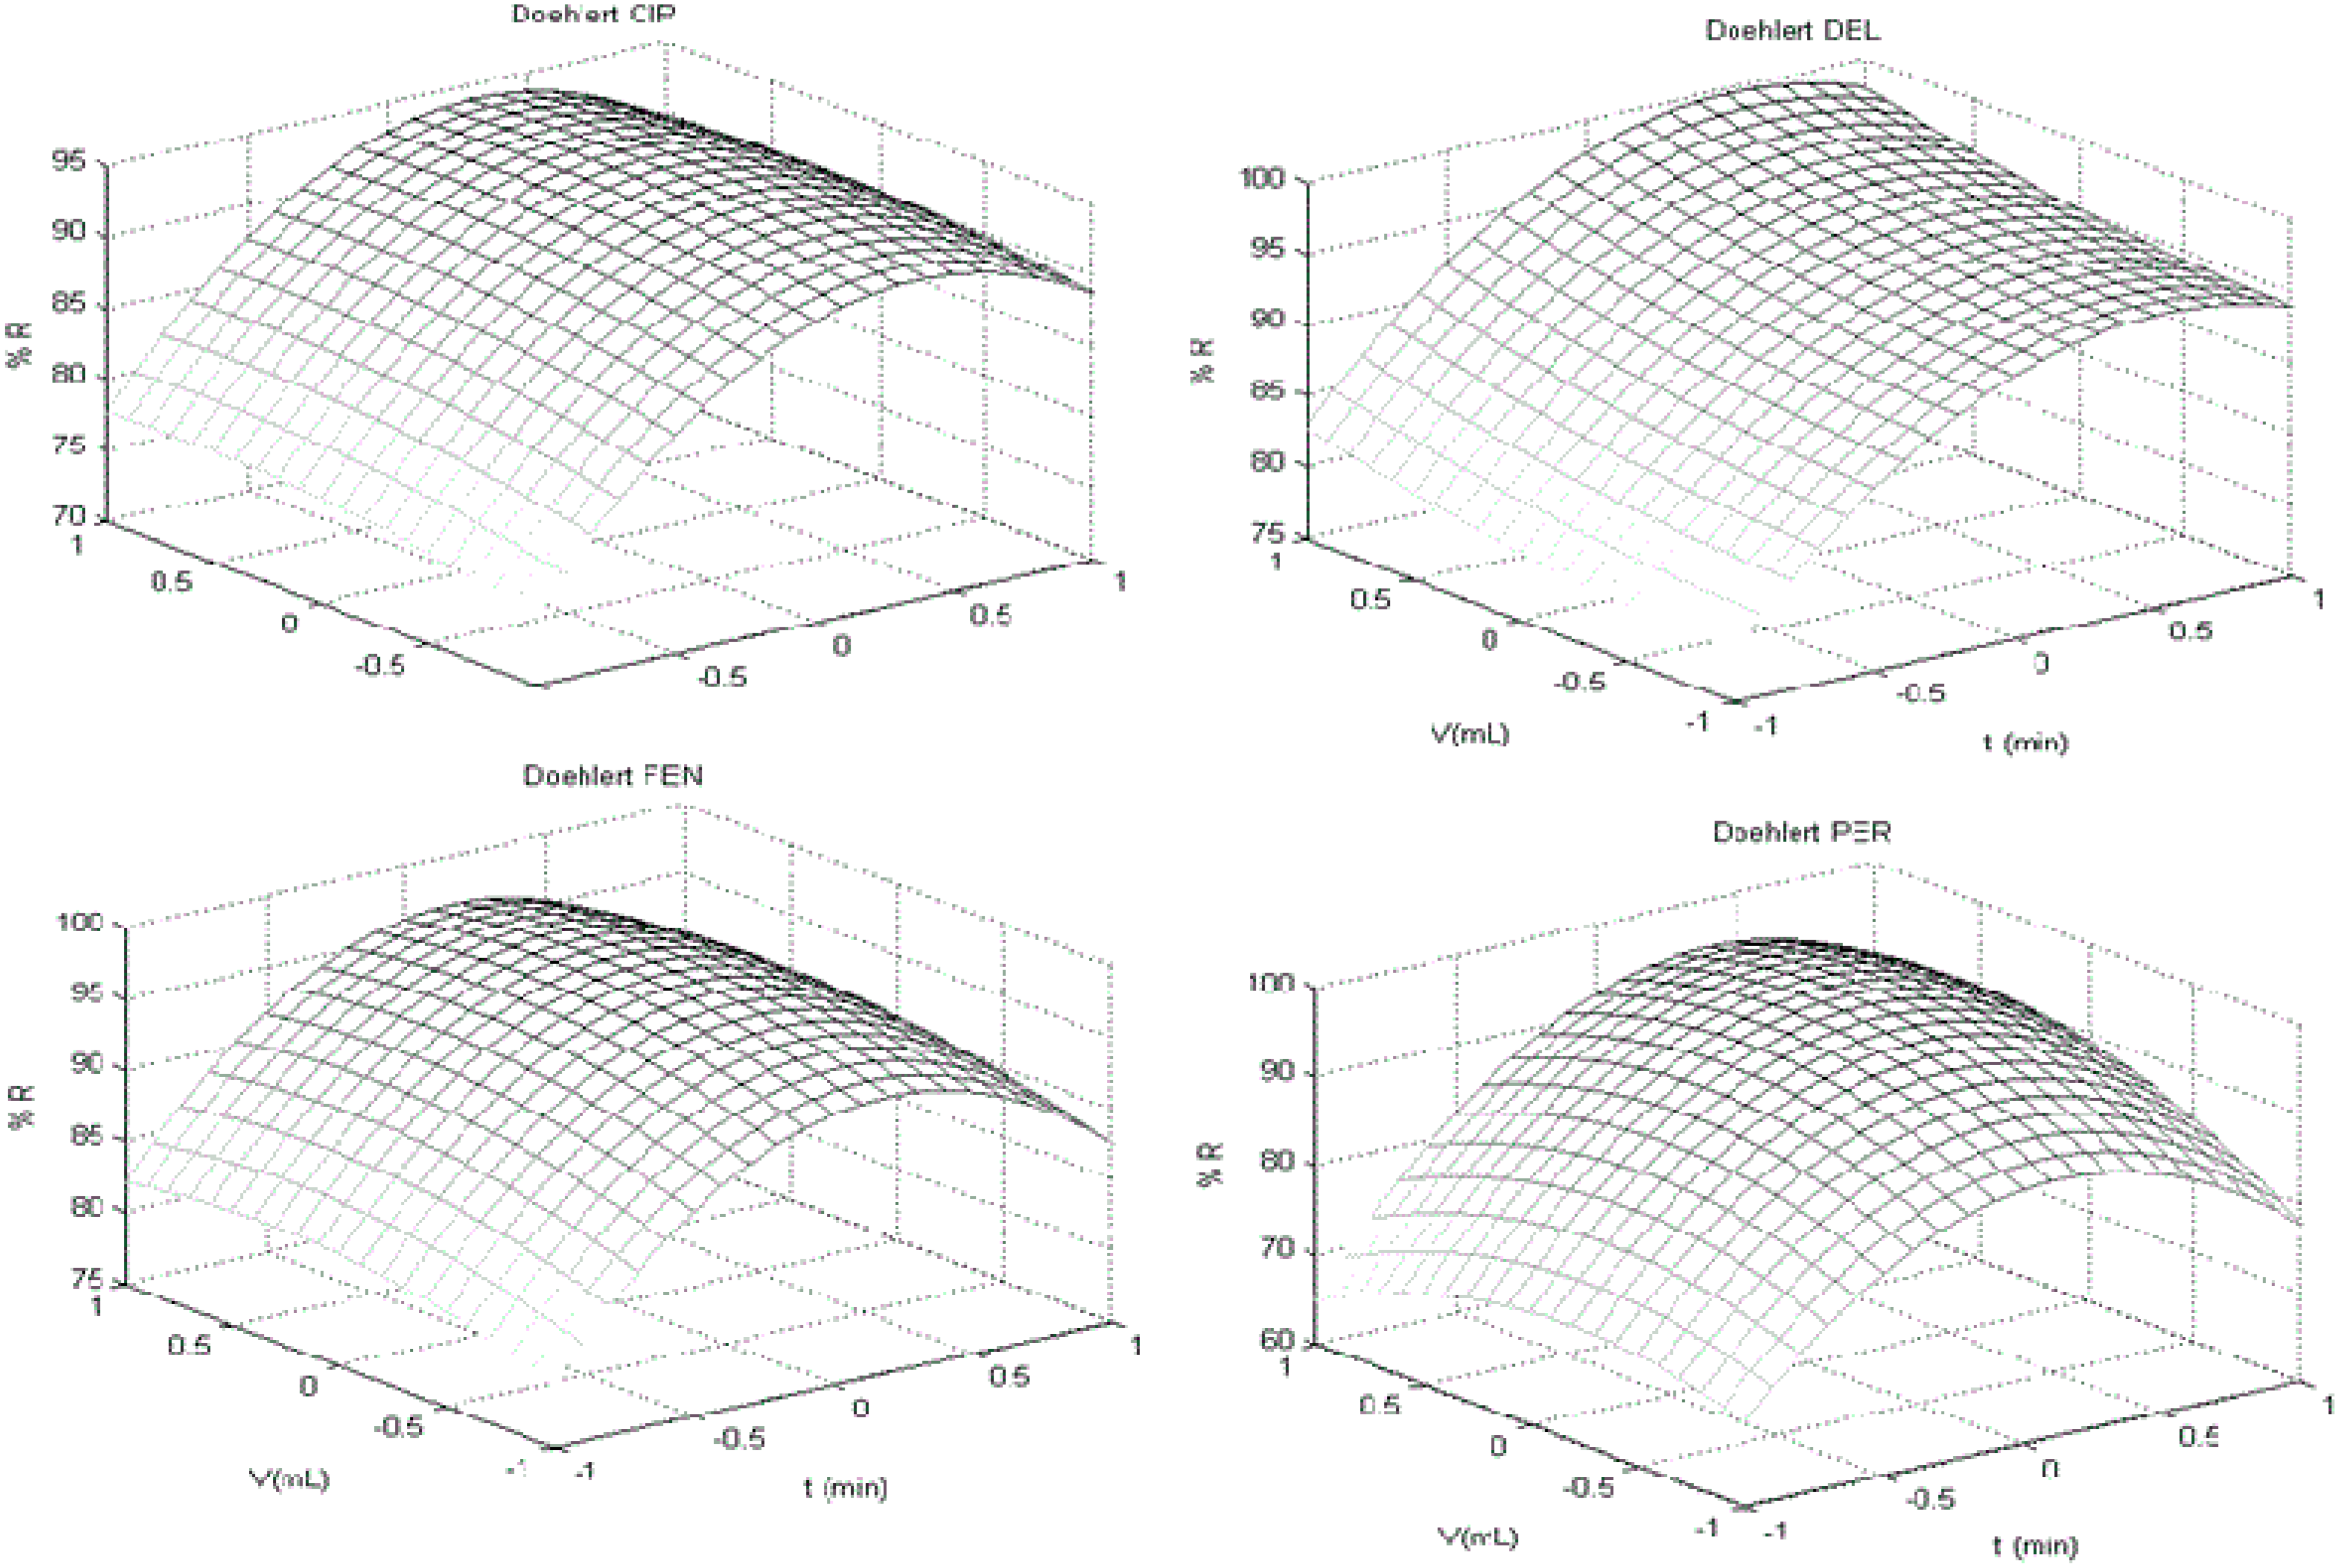
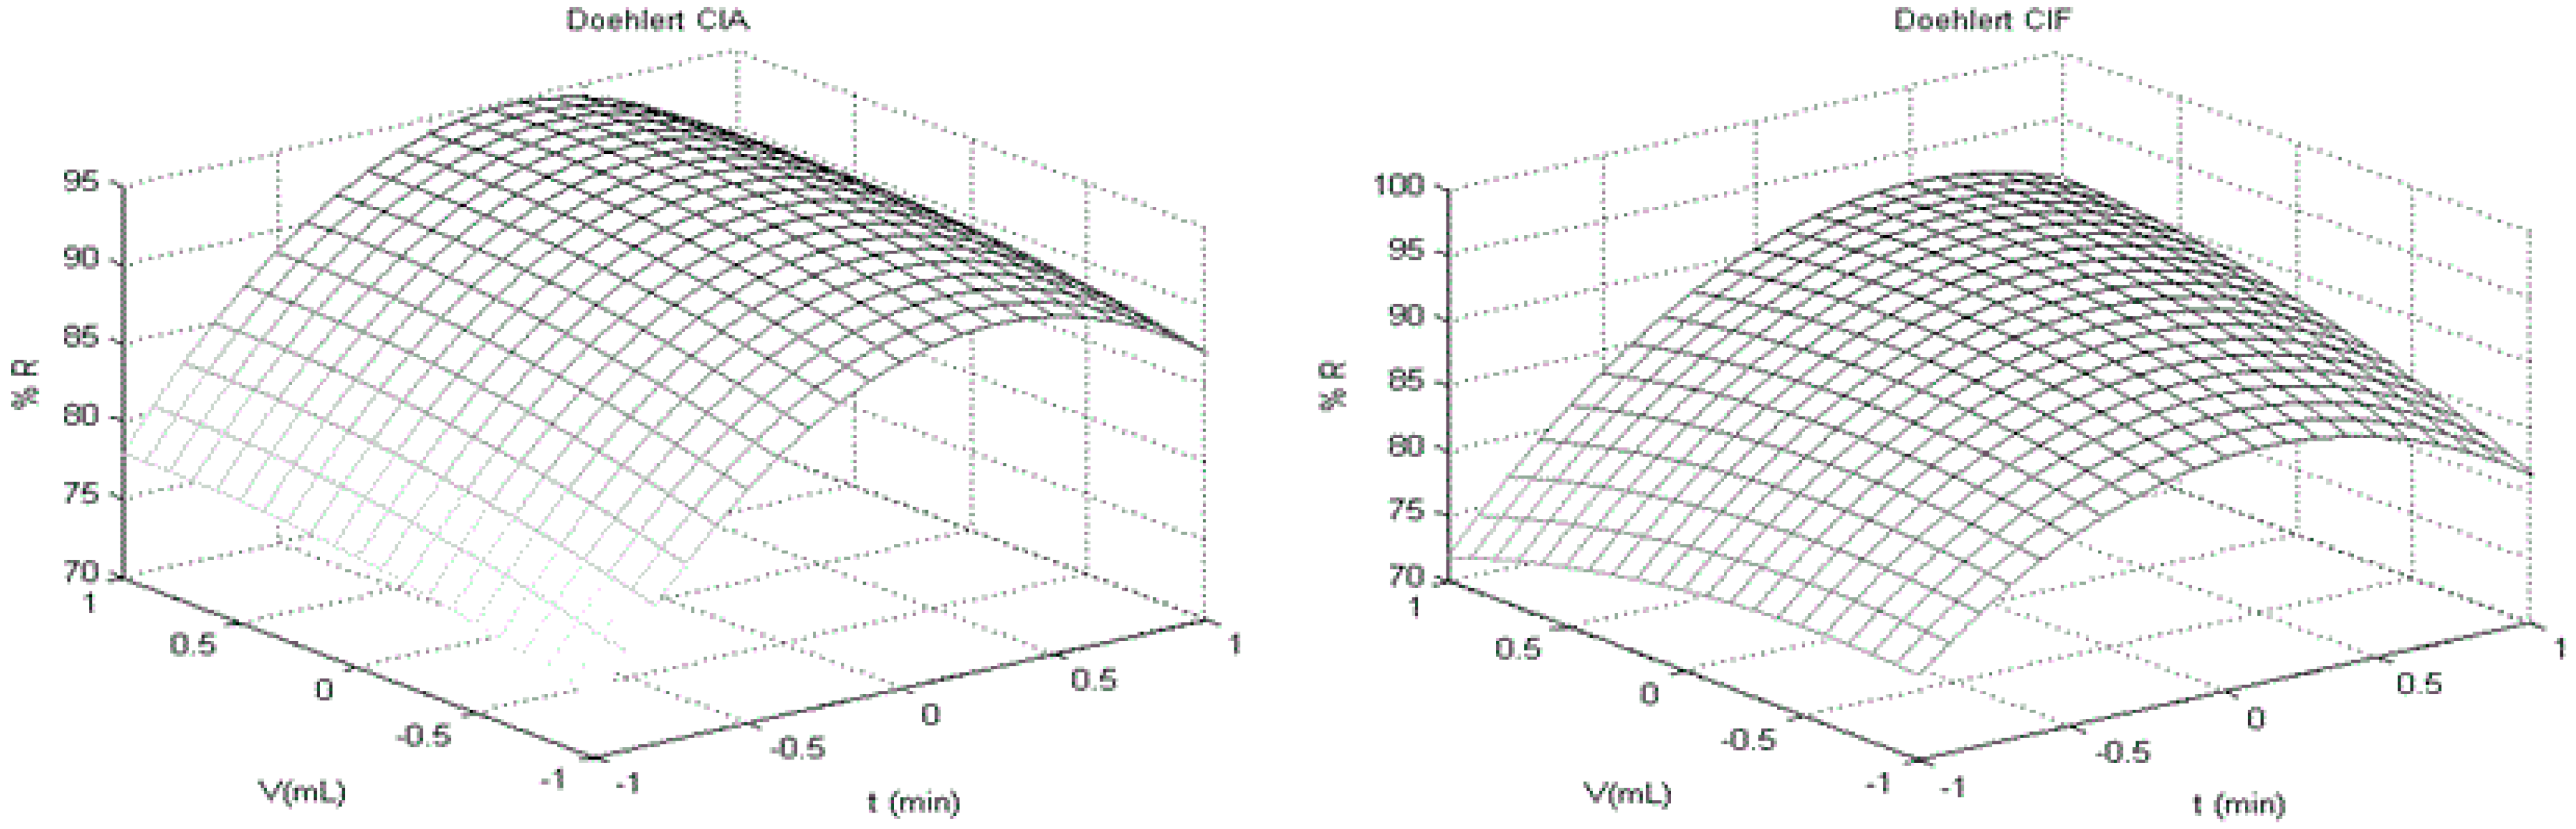
2.4. Experimental Optimization
The protocol that showed the best results for recovery in initial screening was optimized using a Doehlert design. This kind of multivariate strategy use a number of experiments (N) defined by the equation N = k
2 + k + 1, where k is the number of factors (variables) involved in the study [
19,
20]. Least squares were carried out to generate first and second degree polynomials. The adjustment was evaluated by variance analysis (regression, lack-of-fit, residual, pure error) and
t-test for individual coefficients and respective interactions. Visual inspection of response surface was performed to find a stationary ridge, a simple maximum/minimum, a saddle point (minimax) or a simple maximum (first order polynomial), when applicable.
For each surface obtained, one variable was fixed in its optimum response (maximum recovery) and applied to next surface returning for the first to compare factors levels and optimum response. When a factor was not considered significant, a central point (level 0 of experimental design) was chosen to practical criteria of robustness [
23,
24]. Thus, the optimal conditions for extraction were evaluated using a three-level factorial design with a central point. Procedure P07 was chosen to be optimized using agitation-time (
t; minutes), ACN extraction volume (
V; mL) and homogenization time (Ultra-turrax
®;
H; seconds) as variables to build Doehlert design. The response evaluated was recovery (R%) for each analyte. The design with all variables and respective codes are showed in
Table 2. The number of experiments carried out was 15 (three replicates at central point to appropriate number of degree of freedom). A Doehlert design (Doehlert 1.0) developed at Laboratório de Quimiometria Teórica e Aplicada of UNICAMP/Brazil and MATLAB R2012a (Mathworks
®, Natick, MA, USA) were used for chemometric analysis.
Table 2.
Doehlert matrix for the variables used in sample preparation optimization.
Table 2.
Doehlert matrix for the variables used in sample preparation optimization.
| Experiment a | Coded Values b | Planned Values c |
|---|
| t | V | H | Agitation Time (min) | ACN (mL) | Homogenization Time (s) |
|---|
| 1 | 1 | 0 | 0 | 30 | 10.5 | 10.0 |
| 2 | 0.5 | 0.866 | 0 | 25 | 13.5 | 10.0 |
| 3 | 0.5 | 0.289 | 0.817 | 25 | 11.5 | 14.4 |
| 4 | −1 | 0 | 0 | 10 | 10.5 | 10.0 |
| 5 | −0.5 | −0.866 | 0 | 15 | 7.5 | 10.0 |
| 6 | −0.5 | −0.289 | −0.817 | 15 | 9.5 | 5.6 |
| 7 | 0.5 | −0.866 | 0 | 25 | 7.5 | 10.0 |
| 8 | 0.5 | −0.289 | −0.817 | 25 | 9.5 | 5.6 |
| 9 | −0,5 | 0.866 | 0 | 15 | 13.5 | 10.0 |
| 10 | 0 | 0.577 | −0.817 | 20 | 12.5 | 5.6 |
| 11 | −0.5 | 0.289 | 0.817 | 15 | 11.5 | 14.4 |
| 12 | 0 | −0.577 | 0.817 | 20 | 8.5 | 14.4 |
| 13 | 0 | 0 | 0 | 20 | 10.5 | 10.0 |
| 14 | 0 | 0 | 0 | 20 | 10.5 | 10.0 |
| 15 | 0 | 0 | 0 | 20 | 10.5 | 10.0 |
2.5. Validation Procedure
The best conditions found by Doehlert design for P07 were used to perform method validation. Validation level (VL) used for all pyrethoids was 25 μg·mL−1 based on the lower MRL for PYR described in NRCP 2013 (currently, for gamma and lambda-cyhalothrin).
Linearity, matrix effect, limit of quantification (LOQ), specificity, precision and trueness were carried out according to the European Commission guidelines [
26]. Linearity was performed studying the regression significance and the linearity deviation of the matrix-matched calibration curves by analysis of variance, considering a
p < 0.05 as significant. Additionally, the limit of detection was calculated by LOD ¼ 3.3 s/S, and the limit of quantification was calculated by LOQ ¼ 10 s/S, in which “s” was the standard deviation of the linear coefficient and “S” was the slope of the calibration curves. Analyte confirmation using GC-MS/MS was performed based on the ion ratio criteria in which the relative intensity of two transitions for each analyte shall correspond to those of the calibration standard, associated with analyte retention time and it was performed based on time-retention carried out in different columns 5% phenyl–methylpolysiloxane (OV-5, Ohio Valley, 15.0 m × 0.25 mm × 0.1 μm film thickness) and 5% phenyl-95% dimethyl polysiloxane (ZB5, Phenomenex, 30 m × 0.25 mm × 0.10 μm film thickness).
Selectivity and specificity were evaluated analyzing twenty different blank milk samples (fourteen raw milk samples, seven pasteurized milk) with and without addition of analytes, and analyzing samples spiked with the standard solutions at concentrations corresponding to VL. Method precision was calculated in terms of intra- and inter-day precision, expressed as coefficient of variation (CV%) and trueness in terms of average recovery for spike levels using three batches of eighteen blank samples spiked at 0.5, 1.0 and 1.5 × VL, prepared in three different days and analyzed independently.


