Article

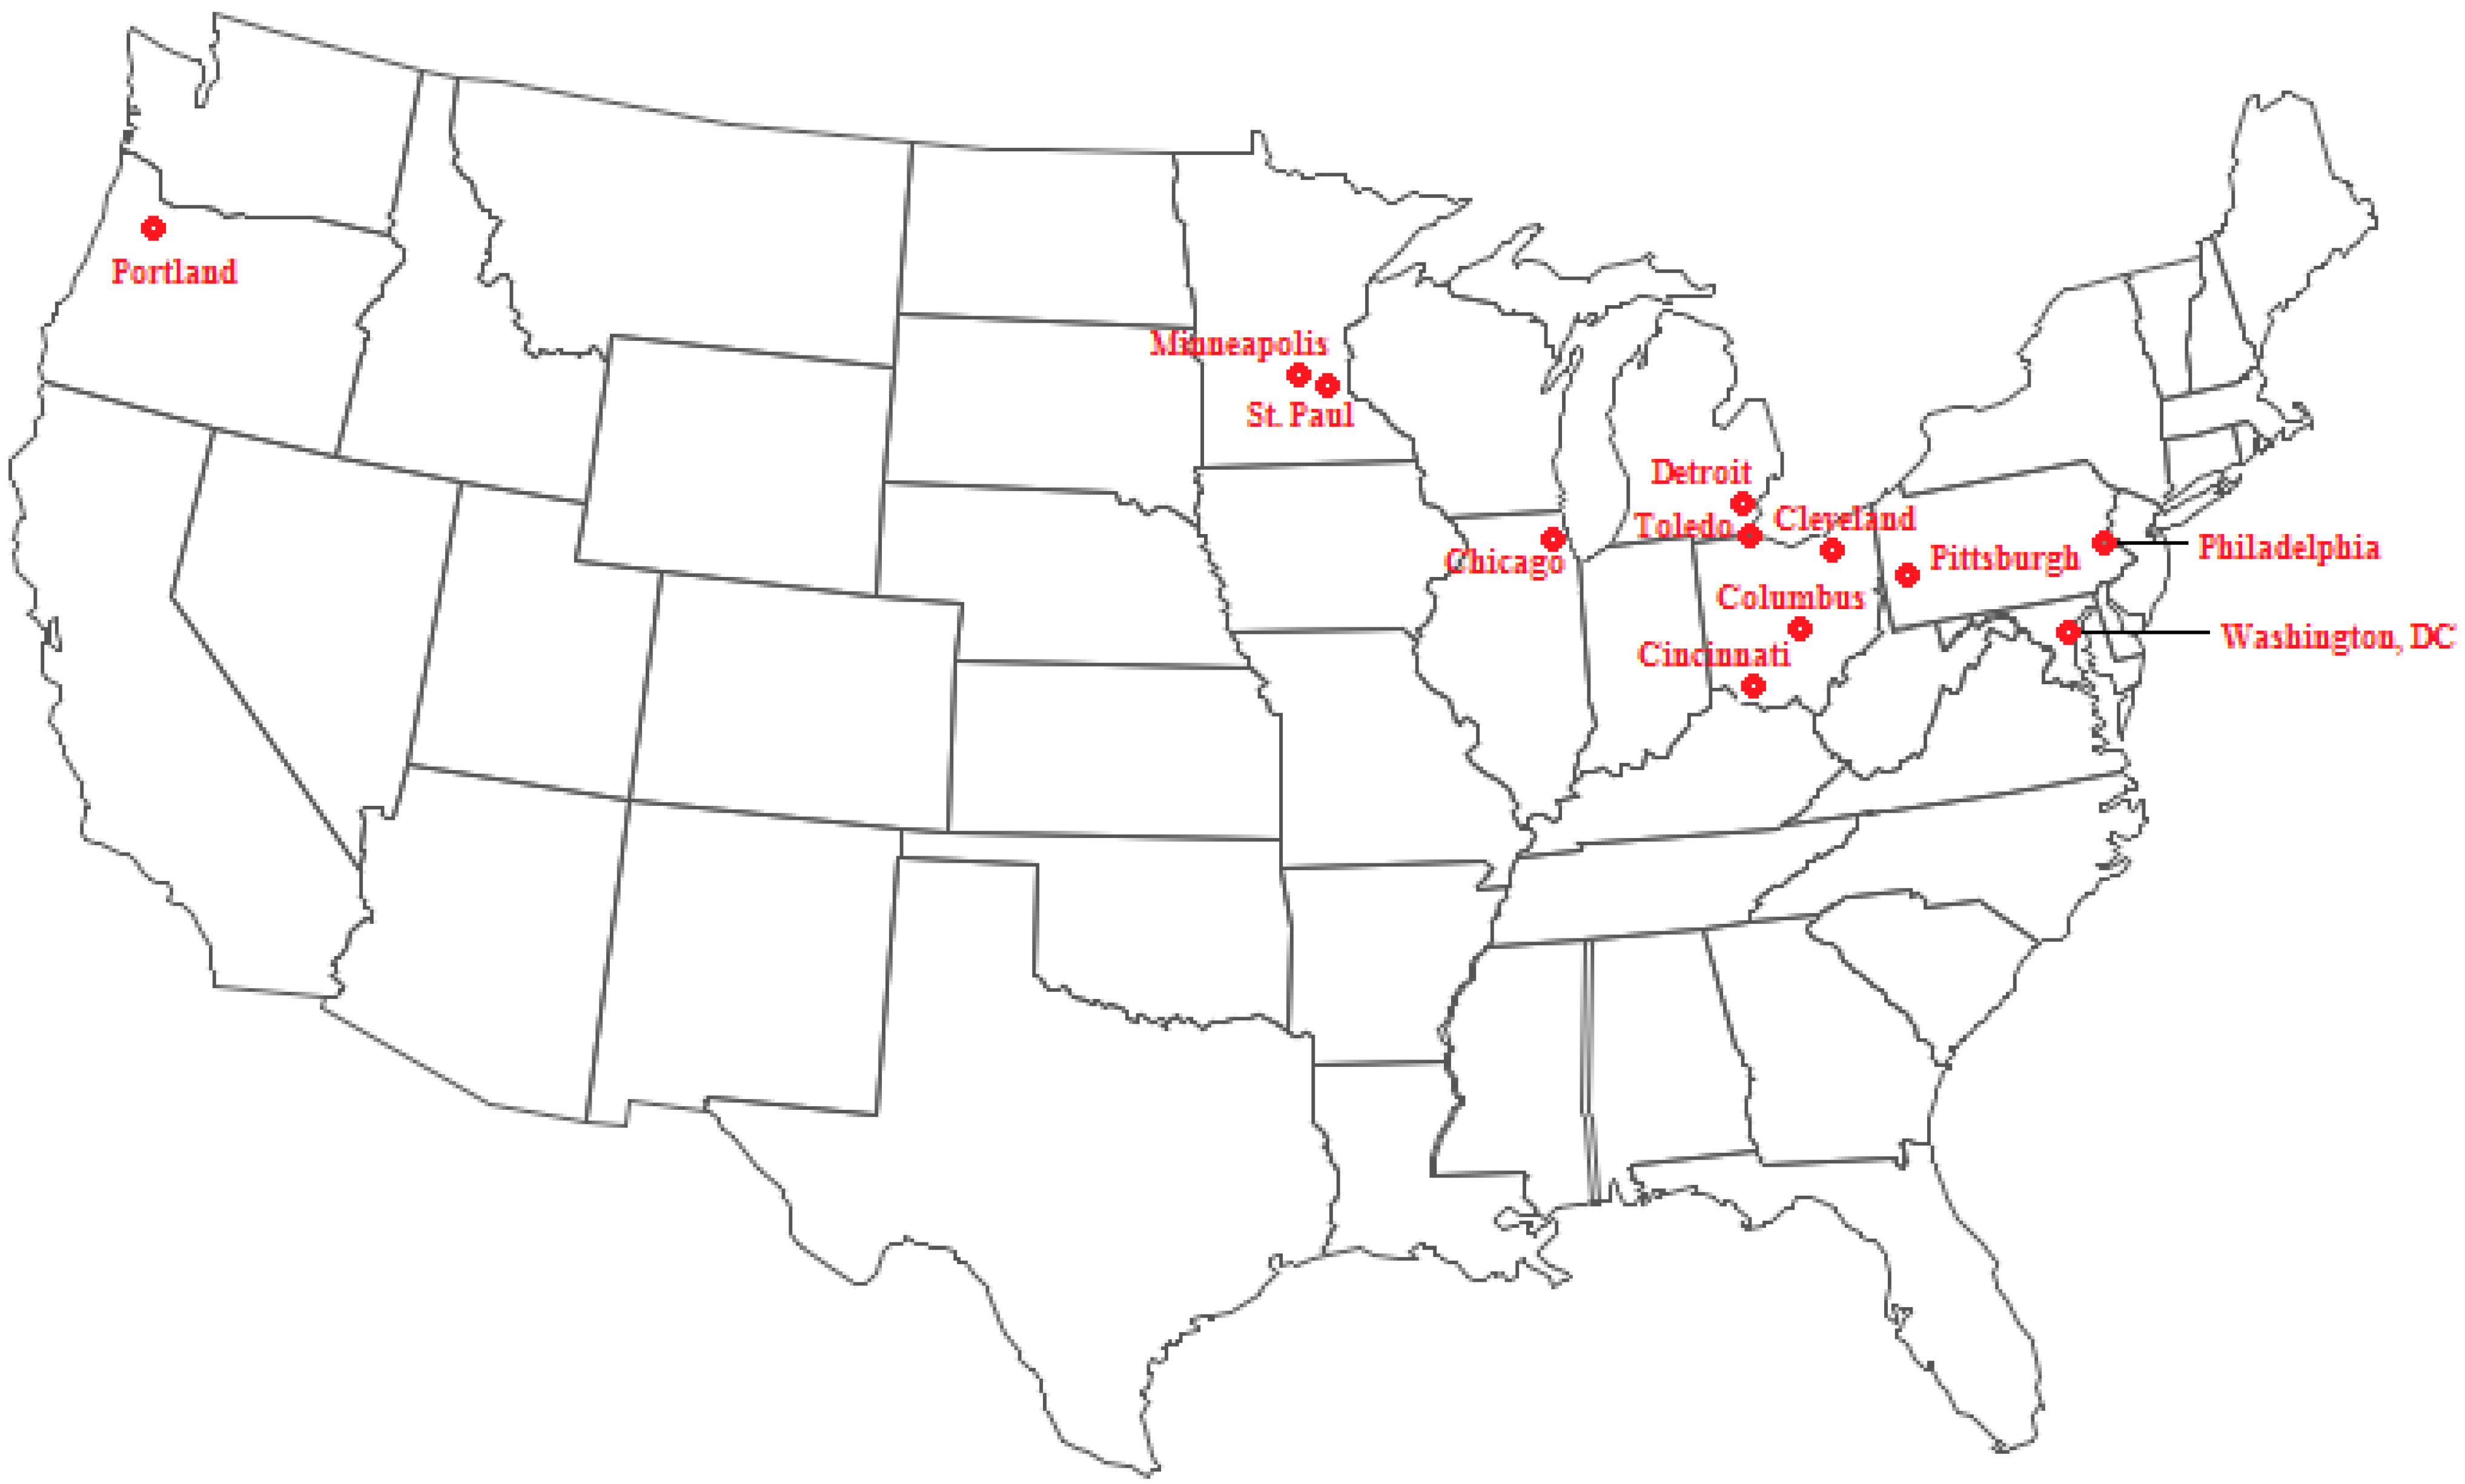
Heat-Related Mortality in a Warming Climate: Projections for 12 U.S. Cities

by
Elisaveta P. Petkova
1,*,
Daniel A. Bader
2,
G. Brooke Anderson
3,
Radley M. Horton
2,
Kim Knowlton
4,5 and
Patrick L. Kinney
4,*
1
National Center for Disaster Preparedness, Earth Institute, Columbia University, Suite 303, 215 W. 125th Street, New York, NY 10027, USA
2
Center for Climate Systems Research, Columbia University, 2880 Broadway, New York, NY 10025, USA
3
Department of Environmental & Radiological Health Sciences, Colorado State University, 350 W. Lake Street, Fort Collins, CO 80523, USA
4
Department of Environmental Health Sciences, Mailman School of Public Health, Columbia University, 722 West 168th St., New York, NY 10032, USA
5
Natural Resources Defense Council, 40 W. 20th Street, New York, NY 10011, USA
*
Authors to whom correspondence should be addressed.
Int. J. Environ. Res. Public Health 2014, 11(11), 11371-11383; https://doi.org/10.3390/ijerph111111371
Submission received: 16 September 2014 / Revised: 20 October 2014 / Accepted: 27 October 2014 / Published: 31 October 2014
(This article belongs to the Special Issue Extreme Weather-Related Morbidity and Mortality: Risks and Responses)

Abstract

:
Heat is among the deadliest weather-related phenomena in the United States, and the number of heat-related deaths may increase under a changing climate, particularly in urban areas. Regional adaptation planning is unfortunately often limited by the lack of quantitative information on potential future health responses. This study presents an assessment of the future impacts of climate change on heat-related mortality in 12 cities using 16 global climate models, driven by two scenarios of greenhouse gas emissions. Although the magnitude of the projected heat effects was found to differ across time, cities, climate models and greenhouse pollution emissions scenarios, climate change was projected to result in increases in heat-related fatalities over time throughout the 21st century in all of the 12 cities included in this study. The increase was more substantial under the high emission pathway, highlighting the potential benefits to public health of reducing greenhouse gas emissions. Nearly 200,000 heat-related deaths are projected to occur in the 12 cities by the end of the century due to climate warming, over 22,000 of which could be avoided if we follow a low GHG emission pathway. The presented estimates can be of value to local decision makers and stakeholders interested in developing strategies to reduce these impacts and building climate change resilience.

1. Introduction

Heat is among the deadliest weather-related phenomena in the United States, killing more Americans in a typical year than floods, lightning and storms combined [1]. Global average temperatures have already increased by about 1.5 degrees F over the past 100 years [2] and could rise by an additional 2 degrees F by mid-century due to climate change [2,3]. As a result, the number of heat-related deaths may increase, particularly in urban areas where the mortality risk is exacerbated due to the high concentration of susceptible populations, as well as the enhancement of temperatures due to the urban heat island effect. Preparing for and preventing heat-related health problems is an increasing priority for public officials in cities across the country.
A growing number of studies have projected future heat-related mortality due to climate change in recent years [4,5,6,7,8,9,10,11,12,13,14,15], most of them predicting substantial increases. Projections of heat-related mortality may be of value to local stakeholders and decision makers as they start to consider the health impacts of climate change in long-term planning and policy. Regional adaptation planning is unfortunately often limited by the lack of quantitative information on potential future health responses.
The goal of the present analysis was to assess and report on future heat-related health risks in multiple US cities, potentially leading to improved understanding of weather and climate vulnerability in the health sector, and more informed risk management and adaptation decisions. Twelve northern US cities with populations over 250,000 were selected for evaluation because of their potential for vulnerability to future heat-related fatality risks under a changing climate. Downscaled temperature projections from 16 global climate models driven by two scenarios of greenhouse gas emissions were used to calculate heat-related premature fatalities in the 2020s, 2050s and 2080s. The presented estimates may be of value in developing strategies for reducing the future impacts of heat and building climate change resilience.

2. Data and Methods

Daily non-accidental mortality counts were obtained from an extended version of the National Morbidity, Mortality, and Air Pollution Study data set for 1987–2005 [16] for the 12 cities (mapped in Figure 1): Washington, DC, Chicago, IL, Detroit, MI, Minneapolis/St. Paul, MN, Cincinnati, OH, Cleveland, OH, Columbus, OH, Toledo, OH, Portland, OR, Philadelphia, PA, Pittsburgh, PA. Weather data were obtained from the National Climatic Data Center, Global Historical Climatology Network (NOAA NCDC GHCND) [17].
Figure 1. Cities analyzed in the present study.
Ijerph 11 11371 g001
First, non-linear exposure-response functions relating daily risk of mortality to mean temperatures were fit for each city. The functions were generated using the dlnm package in R [18]. The exposure variable was the average of temperatures on lag days 0 and 1:
log(µt) = α + f(T) + δD + f(H) + f(L)
where:
  • µt Daily count of mortality in the community for all non-accidental causes
  • α Model intercept
  • f(T) The basis used to model lag 0, 1 temperature using a natural cubic spline, 3 degrees of freedom (df)
  • δ Vector of coefficients for day of week
  • D Day of week for day t
  • f(H) Function of mean dew point temperature on day t (adjusted for daily mean temperature), modeled as a natural cubic spline, 3 degrees of freedom (df)
  • f(L) Function of time, modeled as a natural cubic spline with 7 df/year (used to model long-term and seasonal trends)
Next, temperature projections for each of the 12 cities noted above were obtained from 16 climate models and 2 Intergovernmental Panel on Climate Change (IPCC) greenhouse gas emissions scenarios (A2 and B1). The IPCC Special Report on Emissions Scenarios (SRES) represent a range of possible future pathways of carbon dioxide and other greenhouse pollutant emissions [19]. The A2 emissions scenario features high greenhouse gas concentrations by the end of the 21st century, with emissions growing throughout the entire century [20]. In contrast, the B1 emissions scenario includes societal changes that first reduces greenhouse gas emissions growth and before mid-century lead to emissions reductions, resulting in stabilization of greenhouse gas concentrations. Here the high (A2) and a low (B1) emission scenarios estimate an upper and lower bound for future heat-related mortality in the twelve cities. The global climate models are summarized in Table 1 below.
Table 1. Global-scale climate models for which downscaled data were used in the present study.
Climate Model AcronymInstitutionGCM Resolution (Degrees Latitude × Longitude)
BCCRBjerknes Center for Climate Research 1.9 × 1.9
CCCMACanadian Center for Climate Modeling and Analysis , Canada2.8 × 2.8
CNRMNational Weather Research Center, METEO-FRANCE, France2.8 × 2.8
CSIROCSIRO Atmospheric Research, Australia1.9 × 1.9
GFDL1 (CM2.0)Geophysical Fluid Dynamics Laboratory, USA2.0 × 2.5
GFDL2 (CM2.1)Geophysical Fluid Dynamics Laboratory, USA2.0 × 2.5
GISSNASA Goddard Institute for Space Studies4.0 × 5.0
INMCMInstitute for Numerical Mathematics, Russia4.0 × 5.0
IPSLPierre Simon Laplace Institute, France2.5 × 3.75
MIROCFrontier Research Center for Global Change, Japan2.8 × 2.8
MIUBMeteorological Institute of the University of Bonn, Germany3.75 × 3.75
MPIMax Planck Institute for Meteorology, Germany1.9 × 1.9
MRIMeteorological Research Institute, Japan2.8 × 2.8
NCAR CCSMNational Center for Atmospheric Research, USA1.4 × 1.4
NCAR PCMNational Center for Atmospheric Research, USA2.8 × 2.8
UKMOHadley Center for Climate Prediction, Met Office, UK2.5 × 3.75
Model projections were obtained for three future time slices, the 2020s, 2050s, and 2080s, as well as the baseline period of the 1980s as described in detail previously [21]. The modeled/future temperature data were derived from the Bias Corrected Spatial Disaggregated (BCSD) data set at 1/8 degree spatial resolution of Maurer et al. [22] and the observed National Oceanic and Atmospheric Administration, National Climatic Data Center, Global Historical Climatology Network (NOAA NCDC GHCND) historical data [17] was used for the base period (1970–1999). Each time slice represents a 30-year average of model outputs (e.g., the 2050s is actually 2040 to 2069), in order to minimize the influence of unpredictable interannual and decadal variability.
To calculate climate change-related increases in future temperatures in each city, the average of each calendar month’s 30 monthly values (using the BCSD dataset) for the future time periods were compared to the model results for the 1980s (1970–1999) baseline period. Mean temperature change projections are calculated as the difference between each model’s future simulation and the same model’s baseline simulation. Monthly changes through time from each of the 16 GCMs and two emissions scenarios were then applied to the observed daily station data from the 1980s to generate 32 time series of projected future “daily data”. This is a somewhat simplified approach to projections of extreme events, since it does not allow for possible changes in the patterns of climate variability through time. However, because changes in variability for most climate hazards are considered highly uncertain, the approach provides an initial evaluation of how extreme events may change in the future [21,23].
After deriving city-specific exposure-response functions and temperature projections, we calculated the daily relative risks for the 2020s, 2050s and 2080s by applying the city-specific exposure-response functions to modeled temperatures (from the 16 models and two scenarios) for those decades. Mortality was computed only on days when mean temperature was 60 °F (15.6 °C) or above, consistent with the modeling approach used previously [16].
We calculated heat-related daily deaths for both the baseline and the three future periods in each city, using a formula adapted from Annenberg and colleagues [24]:
Δ M o r t a l i t y = Y 0 × ( R R 1 R R ) × P O P
where:
  • ΔMortality Daily heat-related additional premature deaths
  • Y0  Daily mortality rate (per 100,000 population)
  • POP  City population (divided by 100,000)
  • RR  City-specific exposure-response function
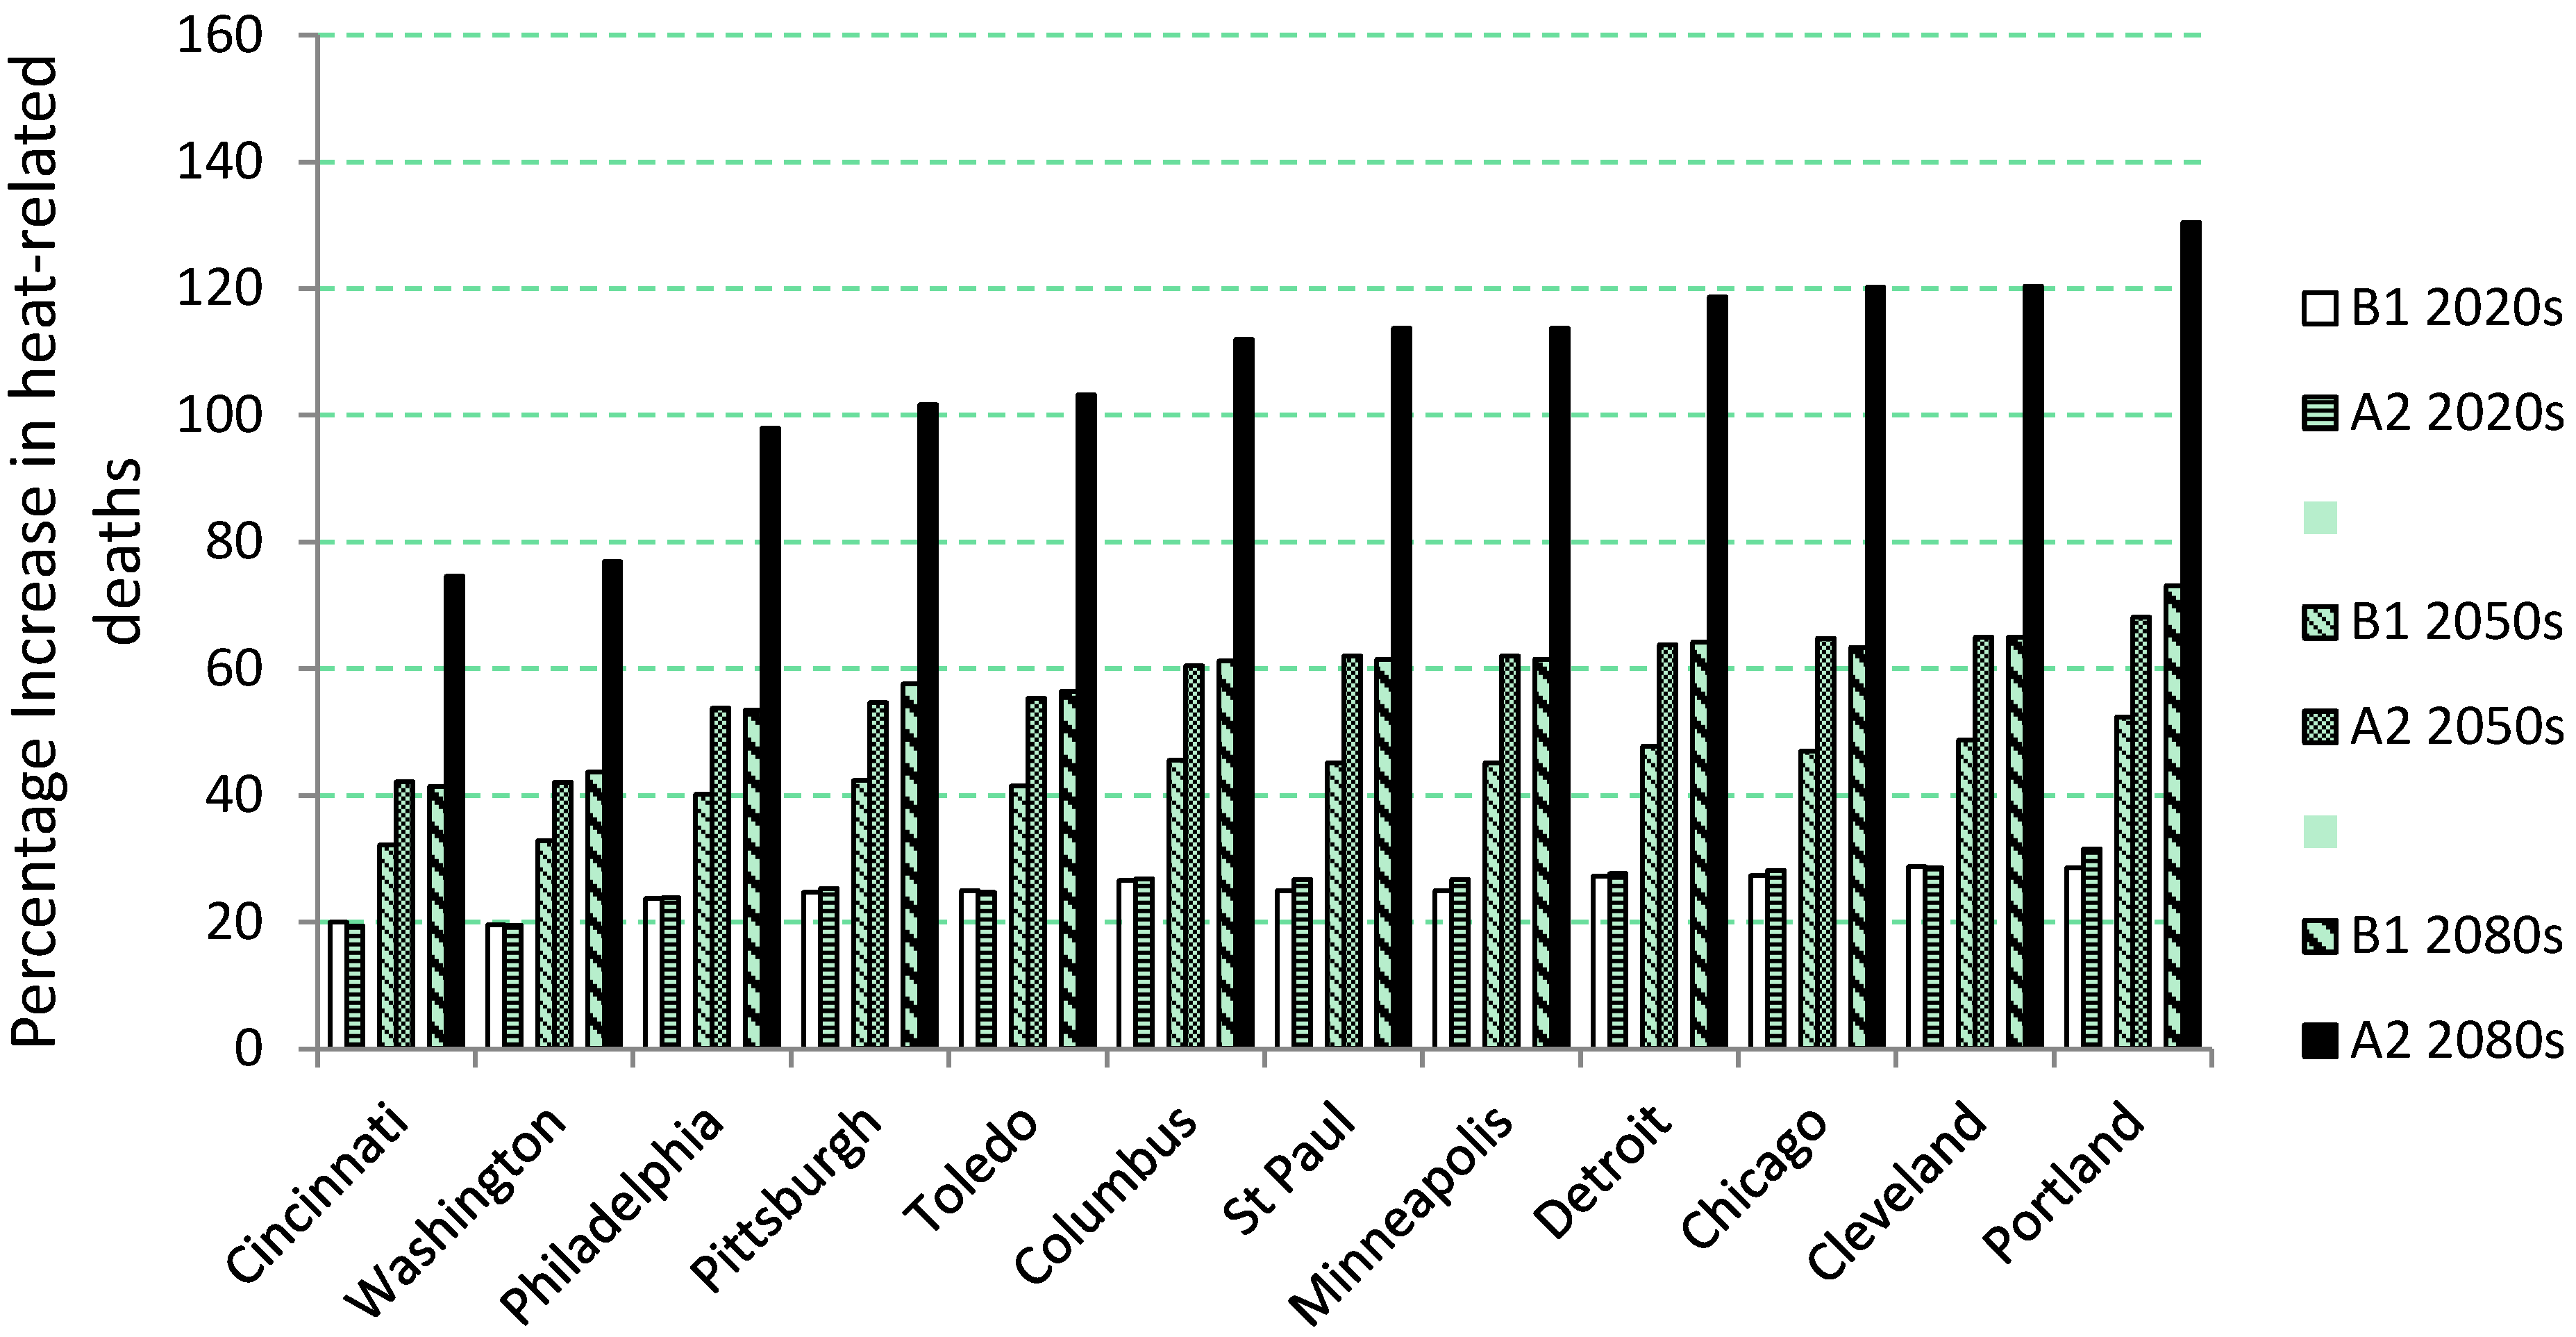
To focus on and isolate the climate effect, we kept other key inputs to the calculation constant in future decades. For example, we assumed constant population and mortality rates for the baseline and future periods. Population data for the thirteen cities was obtained from the 2010 U.S. Census (USDOC) [25]. The constant population assumption is a conservative one since many cities are projected to grow in the future, and have greater numbers of elderly, vulnerable people. Since city-specific mortality rates are not easily available for all cities, we used county-level mortality rates for the calculation. Future mortality rates could change due to changing patterns of obesity, heart disease or other factors. Counts of the numbers of deaths from all causes, and among all age groups, for 2010 for residents of each of the twelve counties in which the cities are located was obtained from the Centers for Disease Control and Prevention’s WONDER database (USCDC) [26].
Finally, for each city, we calculated the total number of heat-related deaths for the 30 year period centered on the 1980s using observed temperatures, and for the 2020s, 2050s, 2080s based on each of the sixteen climate models and the A2 and B1 greenhouse gas emissions scenarios. We also computed the relative percent change in deaths from baseline to each of the future time periods, attributable to the increase in daily heat under a changing climate.

3. Results

City populations and county-specific mortality rates are presented in Table 2.
Table 2. City populations and county-specific mortality rates.
CityStateCountyCity Population (2010)County Population (2010)County-Specific Crude Mortality Rate per 100,000 (2010)
ChicagoILCook County2,707,1205,194,675747.0
CincinnatiOHHamilton County296,943802,374939.3
ClevelandOHCuyahoga County396,8151,280,1221046.0
ColumbusOHFranklin County787,0331,163,414733.0
DetroitMIWayne County713,7771,820,584986.3
MinneapolisMNHennepin County387,7531,152,425673.6
PhiladelphiaPAPhiladelphia County1,526,0061,526,006920.6
PittsburghPAAllegheny County305,7041,223,3481101.8
PortlandORMultnomah County593,820735,334712.3
St. PaulMNRamsey County288,448508,640752.8
ToledoOHLucas County287,208441,815947.5
WashingtonDCDistrict of Columbia601,723601,723776.4
Projected warming is similar across the cities (the one exception is Portland, Oregon, which due in large part to the climatic influence of the Pacific Ocean, is projected to experience approximately 1 °C less warming than the other cities by the 2080s), especially in the 2020s and 2050s. The median projected warming (relative to the baseline) is about 1 °C by the 2020s, 2 °C by the 2050s, and 3.5 °C by the 2080s. However, by the 2080s there is broad spread across the models, ranging from a best case scenario of around 2 °C of warming to a worst case scenario of around 4.5 °C.
Summaries of annual heat-related deaths under a changing climate are presented for each city in Table 3. The first column lists the annual number of deaths during the baseline period, the 1980s. For the baseline period, city-specific exposure-response functions were used along with the historical weather data to calculate heat-related deaths. For each future decade, the 2020s, 2050s, and 2080s, respectively, the number of median heat-related deaths is calculated across the 16 global climate models (GCMs) and reported separately for the low emissions (B1) and high emissions (A2) scenarios. In addition, the annual number of excess heat-related deaths above the 1980s baseline is presented for each scenario during the three future time periods. For instance, there were 113 heat-related deaths in Washington, DC annually during the 1980s baseline period. During the 2020s, according to the B1 scenario, there would be around 136 heat-related deaths, or 23 deaths in excess of the 1980s baseline, while according to the A2 scenario, there would be 138 heat-related deaths or 25 deaths in excess of the 1980s baseline. By the 2080s, according to the B1 scenario, there would be around 163 heat-related deaths, or 49 deaths in excess of the 1980s baseline, while according to the A2 scenario, there would be 207 heat-related deaths, or 93 deaths in excess of the 1980s baseline. The central estimate of expected heat-related deaths in each city was rounded to the nearest whole number.
Table 3. Median number of expected heat-related annual deaths in the 2020s, 2050s and 2080s, and excess heat-related premature deaths compared to the 1980s. Median number of expected heat-related annual deaths is calculated across the 16 global climate models (GCMs) and shown separately for the low emissions (B1) and high emissions (A2) scenarios.
City1980s2010-2039 (2020s)2040-2069(2050s)2070-2099(2080s)
Low emissions ScenarioHigh emissions ScenarioLow emissions ScenarioHigh emissions ScenarioLow emissions ScenarioHigh emissions Scenario
(B1)(A2)(B1)(A2)(B1)(A2)
Number of deathsDeaths in excess of the 1980s baselineNumber of deathsDeaths in excess of the 1980s baselineNumber of deathsDeaths in excess of the 1980s baselineNumber of deathsDeaths in excess of the 1980s baselineNumber of deathsDeaths in excess of the 1980s baselineNumber of deathsDeaths in excess of the 1980s baseline
Chicago2573216433577369112423166419161566308
Cincinnati141731731942162062511
Cleveland41531155136019692868279351
Columbus617615781786259938993813069
Detroit1161483215236168521856918771250134
Minneapolis232963073411381537144926
Philadelphia278334563456737597416138415137526248
Pittsburgh263373483712431743175630
Portland62801881199230103411044214280
St. Paul19245256289321331114122
Toledo263483593912441843176034
Washington113136231382515238166521634920793
Percent change in heat-related deaths for a typical year during the 2020s, 2050s and 2080s compared to the 1980s baseline for each of the twelve cities are presented graphically in Figure 2. Again, the percentage change is based on the number of median heat-related deaths calculated across the 16 global climate models (GCMs) and B1 and A2 scenarios. For instance, in Washington, DC, the average percentage increase in the number of deaths during the 2020s would be 19.5% according to the B1 scenario and 19.6% according to the A2 scenario. By the 2080s, an increase of 43.7% and 76.9% was projected for the same location according to the B1 and A2 scenarios, respectively.
Figure 2. Percentage increase in heat-related deaths during 2020s, 2050s and 2080s compared to the 1980s baseline period for the twelve cities. Calculated across the 16 global climate models (GCMs) used in this study and displayed separately for the low emissions (B1) and high emissions (A2) scenarios.
Ijerph 11 11371 g002
All cities were projected to have substantial increases in heat-related fatalities in future decades, with increasing impacts over time, and for the A2 vs. B1 emissions scenario. Already by the 2020s, most cities showed increases in the 20% to 30% range. By the 2050s, deaths could increase by as much as 50% to 70% for some cities. Even higher impacts could be seen by the 2080s.
Cumulative heat-related deaths, computed by adding up the number of annual heat-related deaths which could result from each of the two emissions pathways, are presented in Table 4. Cumulative deaths may be a useful measure for decision makers for several reasons. First, calculating cumulative deaths over time provides a long term quantitative assessment of the impacts of heat. In Table 4, this has been done for 3 periods for each city, from the beginning of the baseline period to the end of each time slice, 1970–2039, 1970–2069 and 1970–2099, respectively. In Washington, DC, for example, 8757 cumulative heat-related deaths were calculated to occur until 2039 under the B1 and 8861 under the A2 scenario. By 2099, the number of cumulative heat-related deaths expected in Washington, DC, according to the B1 and A2 scenarios, was 18,184 and 20,050, respectively. The second useful application of cumulative deaths is in estimating the extra burden of mortality due to the higher emission scenario, A2 vs. the lower emissions scenario, B1. This estimate is provided in the last column of Table 4. For Washington, DC alone, the A2 emissions pathway was estimated to result in 1866 extra deaths by the end of the century.
Table 4. Cumulative median heat-related premature deaths by the end of each future decade, 1970–2039, 1970–2069 and 1970–2099. Calculated as a sum of annual median heat-related deaths since the beginning of the baseline period. Annual heat-related deaths between 2000 and 2009 were interpolated.
CityCumulative Deaths Extra Deaths from High Emissions Scenario Relative to Low Emissions Scenario (1970–2099)
1970 to 20391970 to 20691970 to 2099
Low Emissions Scenario (B1)High Emissions Scenario (A2)Low Emissions Scenario (B1)High Emissions Scenario (A2)Low Emissions Scenario (B1)High Emissions Scenario (A2)
Chicago20,33420,86931,40933,56543,97150,5306559
Cincinnati109811171664174222772507229
Cleveland3309338851105457715782381081
Columbus479248947384785810,35811,7681410
Detroit9271943814,32514,98019,93922,4902551
Minneapolis182618572835299939374474537
Philadelphia21,46421,91432,70634,38945,14450,1645021
Pittsburgh206321003187338444665060594
Portland496850187725811010,85412,3741520
St. Paul151815442357249332733719446
Toledo209721443252347645565274718
Washington8757886113,30413,84018,18420,0501866

4. Discussion and Conclusions

We carried out an assessment of the potential impacts of climate change on heat-related mortality in 12 cities using 16 global climate models, driven by two scenarios of greenhouse gas emissions. The presented estimates can be of value to local decision makers and stakeholders interested in developing strategies to reduce these impacts and building climate change resilience.
Our analyses indicate that climate change may result in substantial increases in heat-related fatalities in all of the twelve cities included in this study. The magnitude of the projected increase differed across time, cities, climate models and greenhouse pollution emissions scenarios. In general, climate change was projected to result in increasing heat-related deaths over time throughout the 21st century, and more so under the high emission pathway. Our findings also highlight the potential public health benefits that could result from the lower greenhouse gas emissions scenario pathway at the city level. By the end of the century, the potential number of excess deaths due to the higher greenhouse gas concentration A2 scenario versus the reduced-emissions B1, calculated from the beginning of the baseline period, ranged from 131 in Portland, ME to 6559 in Chicago. There were a total of 22,553 estimated deaths across the 12 cities that could potentially be avoided by reducing greenhouse gas emissions.
Projecting future heat impacts on mortality required a range of assumptions. Factors such as city-specific temperature-mortality response functions, as well as underlying mortality rates and population assumptions all impact projections. In the present analysis, we isolated the climate change effect by holding these factors constant across time. This approach has important limitations. First, assuming that population in each city will remain constant at the 2010 Census level may lead to underestimation of future impacts in regions where urbanization continues throughout the century. Since population size is the main driver of inter-city differences in projected heat-related deaths, differences may get even bigger, and the absolute numbers larger, as urban populations increase. Mortality rates are also unlikely to remain constant in the coming decades if the average life-expectancy and the overall resilience of the population to temperature extremes continue to increase. On the other hand, social inequalities may persist and the proportion of elderly, vulnerable people, most susceptible to heat-related deaths is likely to increase in the future. Another limitation of the study is that we did not model population adaptation to heat, which has been documented in a number of studies [27,28,29,30,31] and which may result in our results overestimating mortality impacts. Also it is important to note that we did not account for cold-related mortality, which, by decreasing in the future, could balance some of the heat-related effects we projected. A recent study suggests that this could reduce slightly the future impact of climate-related warming [14]. Nonetheless, these assumptions allowed the estimation of potential heat-related mortality impacts due to climate change in each city, which can be of value in supporting local efforts to reduce heat-related vulnerability.
Despite the uncertainties in the change and interplay of the various population-level variables, future greenhouse gas emissions will have a measurable influence on future heat-related mortality. For instance, although the number of excess heat-related deaths projected under the low-emission (B1) and high-emission (A2) scenarios will likely be comparable during the 2020s, nearly twice as many deaths may occur annually by the 2080s under the high-emission compared to the low-emission scenario. Therefore, in addition to more direct health benefits associated with improved air quality, reducing greenhouse gas emissions can have a substantial impact on reducing future heat-related mortality in all of the twelve cities.

Acknowledgments

Support for this study was provided by the Natural Resources Defense Council (NRDC), the Consortium for Climate Risk in the Urban Northeast (award NA10OAR4310212 from the NOAA RISA program) (Patrick Kinney, Elisaveta Petkova, Radley Horton and Daniel Bader), NIEHS Center grant ES009089 (Elisaveta Petkova and Patrick Kinney), and NIEHS grants K99ES022631 and R21ES020152 (G. Brooke Anderson).

Author Contributions

Patrick Kinney, Elisaveta Petkova, Kim Knowlton collaborated on the structure of the manuscript. Elisaveta Petkova worked on the analysis and interpretation of findings and developed the initial manuscript draft. G. Brooke Anderson derived the temperature-mortality exposure-response functions and contributed to the writing of the manuscript. Daniel Bader prepared the climate projections used for the research and downloaded and processed all the data used for the future climate scenarios. Daniel Bader also helped write the text describing the climate projections methodology and reviewed the rest of the manuscript. Radley Horton oversaw the climate portion of the analysis, and contributed to the writing of the manuscript. All co-authors worked to develop the information to describe this study, revise the manuscript and approve the final draft.

Conflicts of Interest

The authors declare no conflict of interest.

References

  1. Berko, J.; Ingram, D.D.; Saha, S.; Parker, J.D. Deaths Attributed to Heat, Cold, and other Weather Events in the United States, 2006–2010, National Health Statistics Reports; U.S. Department of Health and Human Services: Hyattsville, MD, USA, 2014. [Google Scholar]
  2. Hartmann, D.L.; Klein Tank, A.M.G.; Rusticucci, M.; Alexander, L.V.; Brönnimann, S.; Charabi, Y.; Dentener, F.J.; Dlugokencky, E.J.; Easterling, D.R.; Kaplan, A. Observations: Atmosphere and surface. In Climate Change 2013: The Physical Science Basis. Contribution of Working Group I to the Fifth Assessment Report of the Intergovernmental Panel on Climate Change; Stocker, T.F., Qin, D., Plattner, G.-K., Tignor, M., Allen, S.K., Boschung, J., Nauels, A., Xia, Y., Bex, V., Midgley, P.M., Eds.; Cambridge University Press: Cambridge, UK, 2013. [Google Scholar]
  3. Collins, M.; Knutti, R.; Arblaster, J.; Dufresne, J.-L.; Fichefet, T.; Friedlingstein, P.; Gao, X.; Gutowski, W.J.; Johns, T.; Krinner, G.; et al. Long-term climate change: Projections, commitments and irreversibility. In Climate Change 2013: The Physical Science Basis. Contribution of Working Group I to the Fifth Assessment Report of the Intergovernmental Panel on Climate Change; Stocker, T.F., Qin, D., Plattner, G.-K., Tignor, M., Allen, S.K., Boschung, J., Nauels, A., Xia, Y., Bex, V., Midgley, P.M., Eds.; Cambridge University Press: Cambridge, UK, 2013. [Google Scholar]
  4. Baccini, M.; Biggeri, A.; Accetta, G.; Kosatsky, T.; Katsouyanni, K.; Analitis, A.; Anderson, H.R.; Bisanti, L.; D’Ippoliti, D.; Danova, J.; et al. Heat effects on mortality in 15 European cities. Epidemiology 2008, 19, 711–719. [Google Scholar]
  5. Dessai, S. Heat stress and mortality in Lisbon Part II. An assessment of the potential impacts of climate change. Int. J. Biometeorol. 2003, 48, 37–44. [Google Scholar]
  6. Gosling, S.N.; McGregor, G.R.; Lowe, J.A. Climate change and heat-related mortality in six cities Part 2: Climate model evaluation and projected impacts from changes in the mean and variability of temperature with climate change. Int. J. Biometeorol. 2009, 53, 31–51. [Google Scholar] [CrossRef] [PubMed]
  7. Hayhoe, K.; Cayan, D.; Field, C.B.; Frumhoff, P.C.; Maurer, E.P.; Miller, N.L.; Moser, S.C.; Schneider, S.H.; Cahill, K.N.; Cleland, E.E.; et al. Emissions pathways, climate change, and impacts on California. Proc. Natl. Acad. Sci. USA 2004, 101, 12422–12427. [Google Scholar] [CrossRef]
  8. Hayhoe, K.; Sheridan, S.; Kalkstein, L.; Greene, S. Climate change, heat waves, and mortality projections for Chicago. J. Great Lakes Res. 2010, 36 (Suppl 2), 65–73. [Google Scholar] [CrossRef]
  9. Jackson, J.E.; Yost, M.; Karr, C.; Fitzpatrick, C.; Lamb, B.; Chung, S.; Chen, J.; Avise, J.; Rosenblatt, R.; Fenske, R. Public health impacts of climate change in Washington State: Projected mortality risks due to heat events and air pollution. Clim. Change 2010, 102, 159–186. [Google Scholar] [CrossRef]
  10. Knowlton, K.; Lynn, B.; Goldberg, R.A.; Rosenzweig, C.; Hogrefe, C.; Rosenthal, J.K.; Kinney, P.L. Projecting heat-related mortality impacts under a changing climate in the New York City region. Am. J. Public Health 2007, 97, 2028–2034. [Google Scholar] [CrossRef] [PubMed]
  11. Peng, R.D.; Bobb, J.F.; Tebaldi, C.; McDaniel, L.; Bell, M.L.; Dominici, F. Toward a quantitative estimate of future heat wave mortality under global climate change. Environ. Health Perspect. 2011, 119, 701–706. [Google Scholar] [CrossRef] [PubMed]
  12. Sheridan, S.; Allen, M.; Lee, C.; Kalkstein, L. Future heat vulnerability in California, Part II: Projecting future heat-related mortality. Clim. Change 2012, 115, 311–326. [Google Scholar] [CrossRef]
  13. Ostro, B.; Barrera-Gomez, J.; Ballester, J.; Basagana, X.; Sunyer, J. The impact of future summer temperature on public health in Barcelona and Catalonia, Spain. Int. J. Biometeorol. 2012, 56, 1135–1144. [Google Scholar] [CrossRef] [PubMed]
  14. Li, T.; Horton, R.M.; Kinney, P.L. Projections of seasonal patterns in temperature-related deaths for Manhattan, New York. Nature Clim. Change 2013, 3, 717–721. [Google Scholar] [CrossRef]
  15. Petkova, E.P.; Horton, R.M.; Bader, D.A.; Kinney, P.L. Projected heat-related mortality in the US urban northeast. Int. J. Environ. Res. Public Health 2013, 10, 6734–6747. [Google Scholar] [CrossRef] [PubMed]
  16. Anderson, B.G.; Bell, M.L. Weather-related mortality: How heat, cold, and heat waves affect mortality in the United States. Epidemiology 2009, 20, 205–213. [Google Scholar] [CrossRef] [PubMed]
  17. Lawrimore, J.H.; Menne, M.J.; Gleason, B.E.; Williams, C.N.; Wuertz, D.B.; Vose, R.S.; Rennie, J. An overview of the Global Historical Climatology Network monthly mean temperature data set, version 3. J. Geophys. Res. 2011, 116. [Google Scholar] [CrossRef]
  18. Gasparrini, A. Distributed lag linear and non-linear models in R: The package DLNM. J. Stat. Softw. 2011, 43, 1–20. [Google Scholar] [PubMed]
  19. Nakicenovic, N.; Alcamo, J.; Davis, G.; de Vries, B.; Fenhann, J.; Gaffin, S.; Gregory, K.; Grübler, A.; Jung, T.Y.; Kram, T.; et al. Special Report on Emissions Scenarios: A Special Report of Working Group III of the Intergovernmental Panel on Climate Change; IPCC: Geneva, Switzerland, 2000; pp. 1–599. [Google Scholar]
  20. Le Quere, C.; Raupach, M.R.; Canadell, J.G.; Marland, G.; Bopp, L.; Ciais, P.; Conway, T.J.; Doney, S.C.; Feely, R.A.; Foster, P.N.; et al. Trends in the sources and sinks of carbon dioxide. Nat. Geosci. 2009, 2, 831–836. [Google Scholar]
  21. Horton, R.M.; Gornitz, V.; Bader, D.A.; Ruane, A.C.; Goldberg, R.; Rosenzweig, C. Climate hazard assessment for stakeholder adaptation planning in New York city. J. Appl. Meteorol. Climatol. 2011, 50, 2247–2266. [Google Scholar] [CrossRef]
  22. Maurer, E.P.; Brekke, L.; Pruitt, T.; Duffy, P.B. Fine-resolution climate projections enhance regional climate change impact studies. EOS Trans. Am. Geophys. Union 2007, 88. [Google Scholar] [CrossRef]
  23. Horton, R.; Rosenzweig, C.; Gornitz, V.; Bader, D.; O’Grady, M. Climate risk information. Ann. NY Acad. Sci. 2010, 1196, 147–228. [Google Scholar] [CrossRef] [PubMed]
  24. Anenberg, S.C.; Horowitz, L.W.; Tong, D.Q.; West, J.J. An estimate of the global burden of anthropogenic ozone and fine particulate matter on premature human mortality using atmospheric modeling. Environ. Health Perspect. 2010, 118, 1189–1195. [Google Scholar] [CrossRef] [PubMed]
  25. U.S. Census 2010. U.S. Department of Commerce (USDOC). 2010. Available online: http://www.census.gov/2010census/ (accessed on 9 July 2014).
  26. U.S. Centers for Disease Control and Prevention (USCDC); National Center for Health Statistics. Compressed Mortality File 1999–2011 on CDC WONDER Online Database. Available online: http://wonder.cdc.gov/cmf-icd10.html (accessed on 15 January 2013).
  27. Davis, R.E.; Knappenberger, P.C.; Michaels, P.J.; Novicoff, W.M. Changing heat-related mortality in the United States. Environ. Health Perspect. 2003, 111, 1712–1719. [Google Scholar] [CrossRef] [PubMed]
  28. Carson, C.; Hajat, S.; Armstrong, B.; Wilkinson, P. Declining vulnerability to temperature-related mortality in London over the 20th century. Am. J. Epidemiol. 2006, 164, 77–84. [Google Scholar] [CrossRef] [PubMed]
  29. Astrom, D.O.; Forsberg, B.; Edvinsson, S.; Rocklov, J. Acute fatal effects of short-lasting extreme temperatures in Stockholm, Sweden: Evidence across a century of change. Epidemiology 2013, 24, 820–829. [Google Scholar] [CrossRef] [PubMed]
  30. Bobb, J.F.; Peng, R.D.; Bell, M.L.; Dominici, F. Heat-related mortality and adaptation to heat in the United States. Environ. Health Perspect. 2014, 8. [Google Scholar] [CrossRef]
  31. Petkova, E.P.; Gasparrini, A.; Kinney, P.L. Heat and mortality in New York City since the beginning of the 20th century. Epidemiology 2014, 25, 554–560. [Google Scholar] [CrossRef] [PubMed]

