Synergistic Cytotoxicity of Renieramycin M and Doxorubicin in MCF-7 Breast Cancer Cells

 , , ,
, , ,
Abstract
: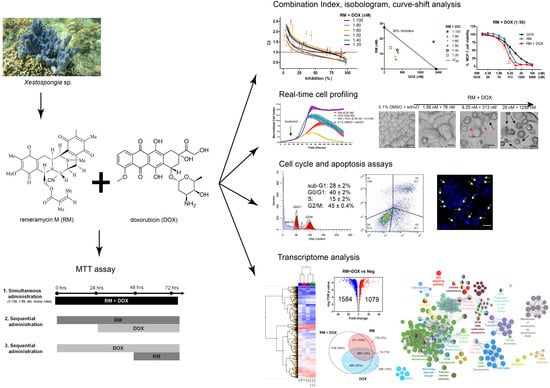
1. Introduction
2. Results
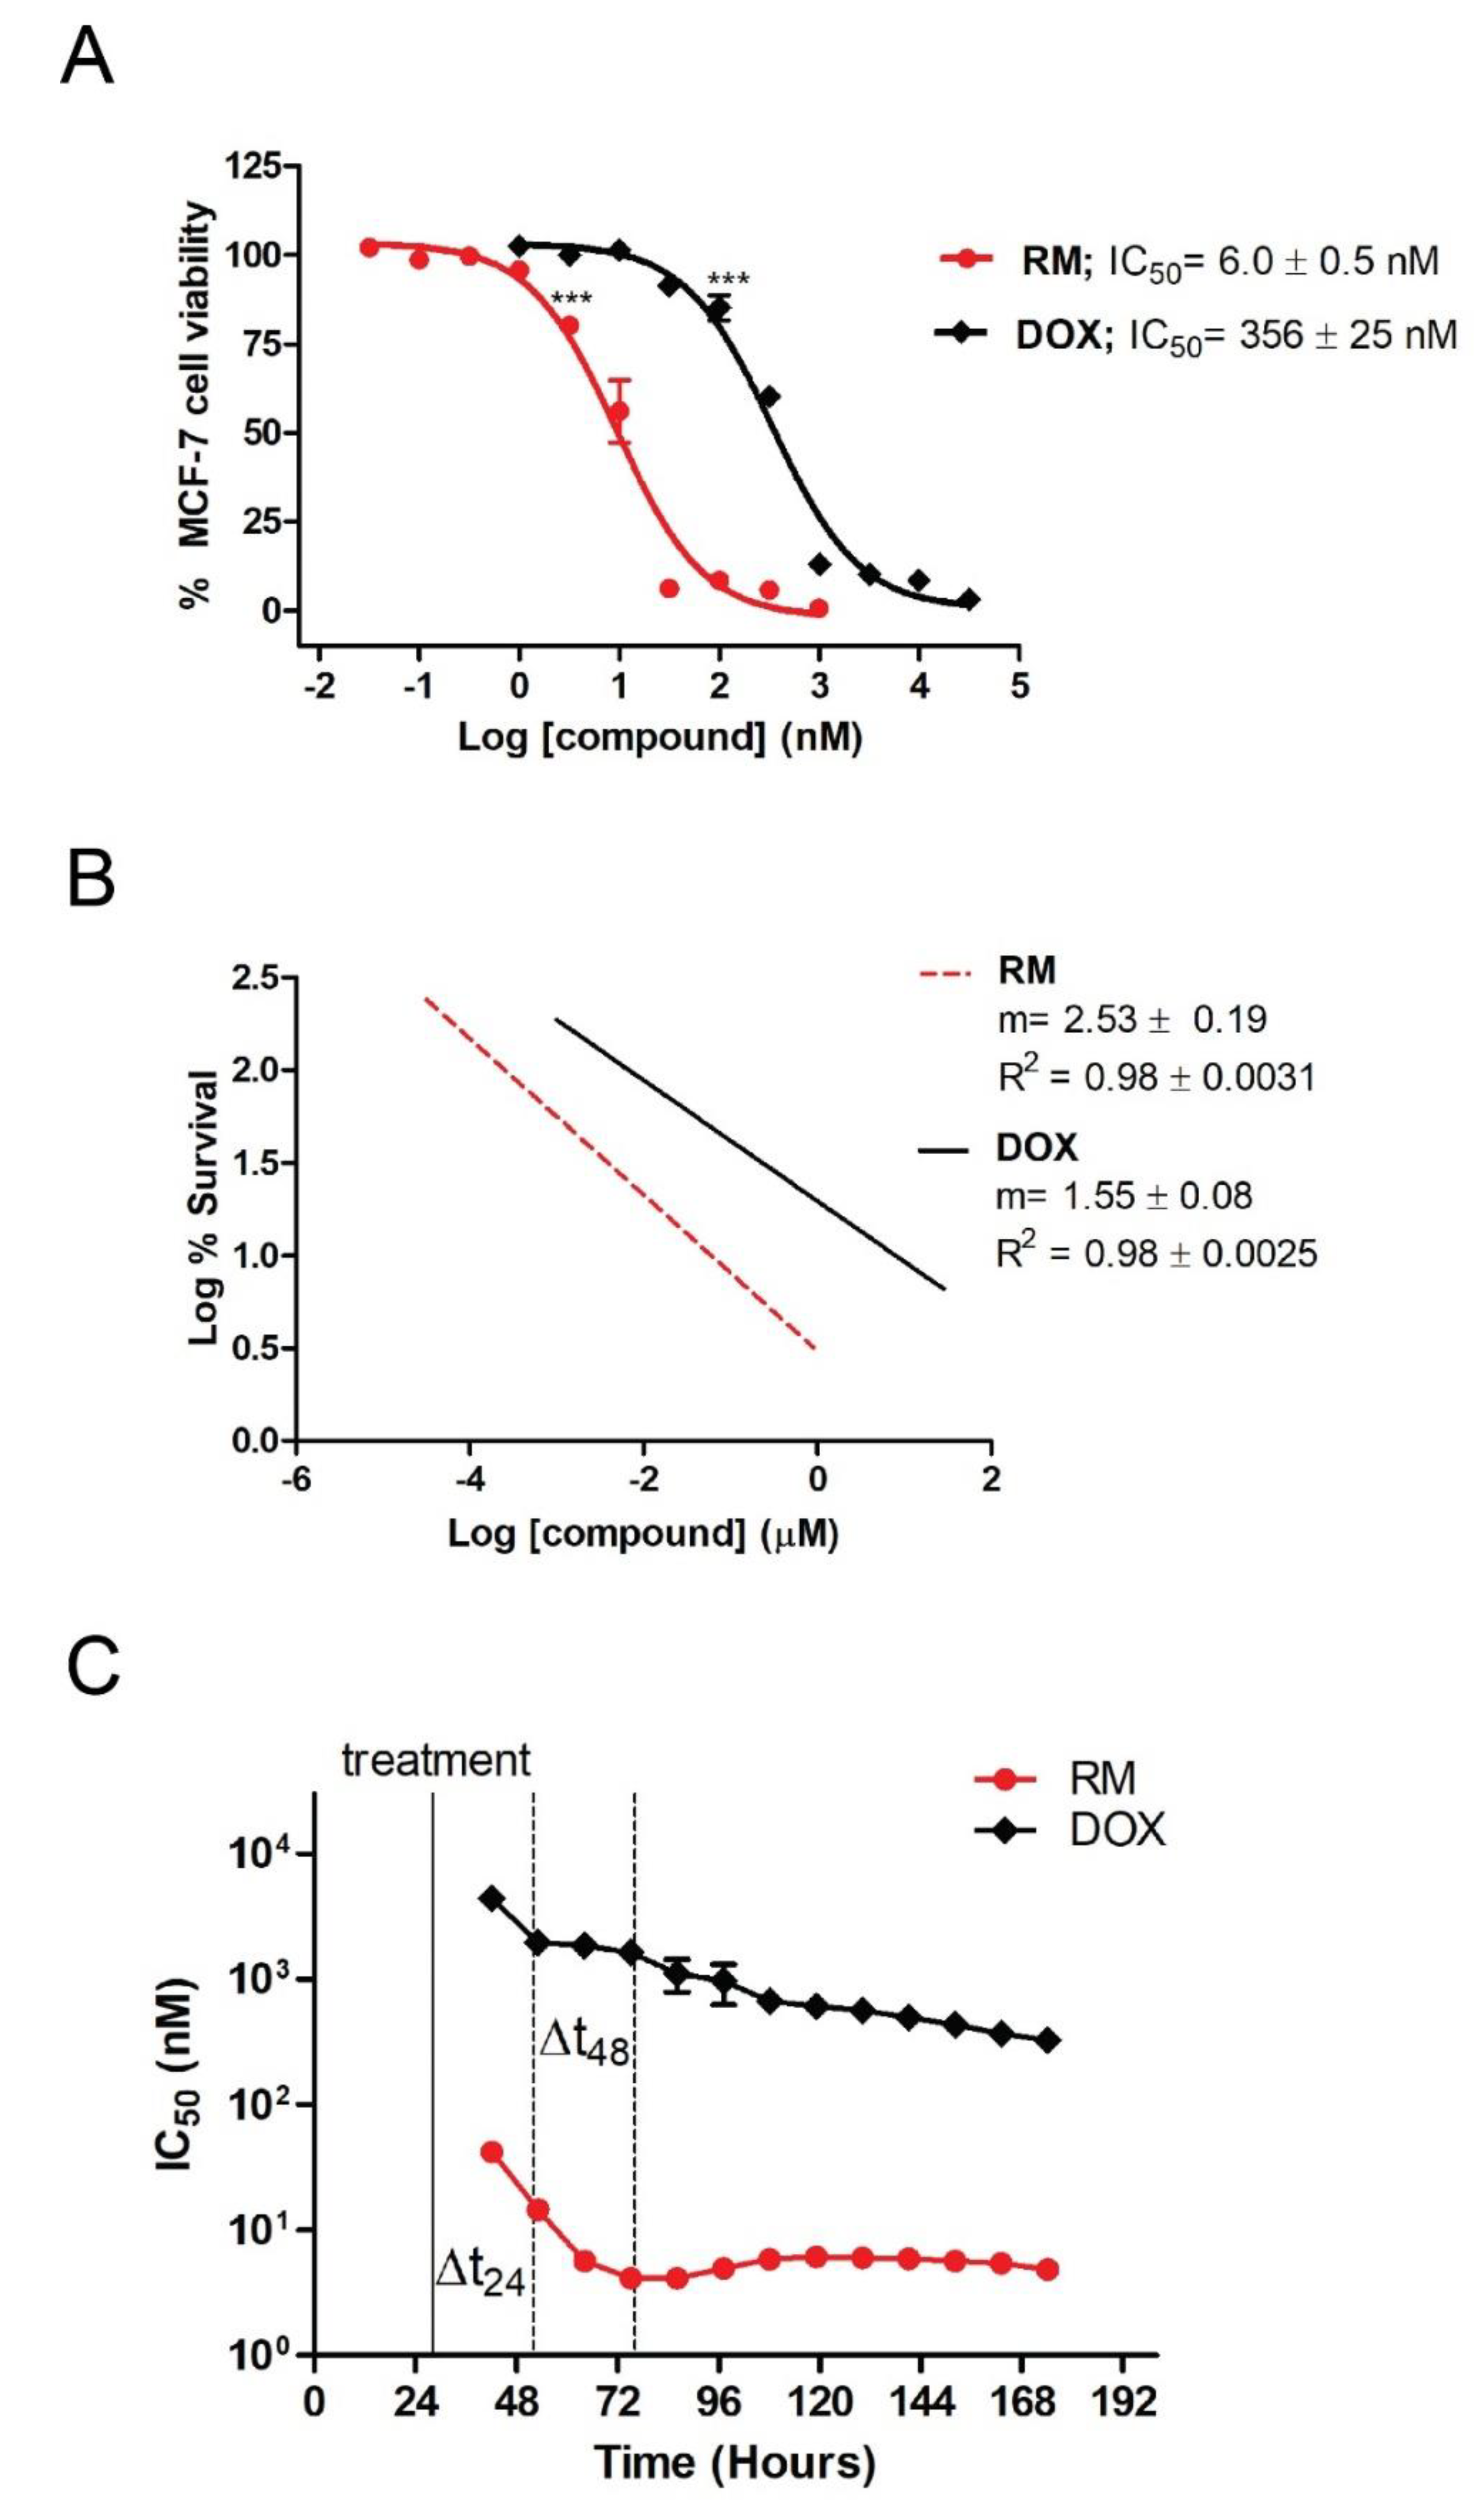
2.1. RM Is More Potent Than DOX in MCF-7 Cells
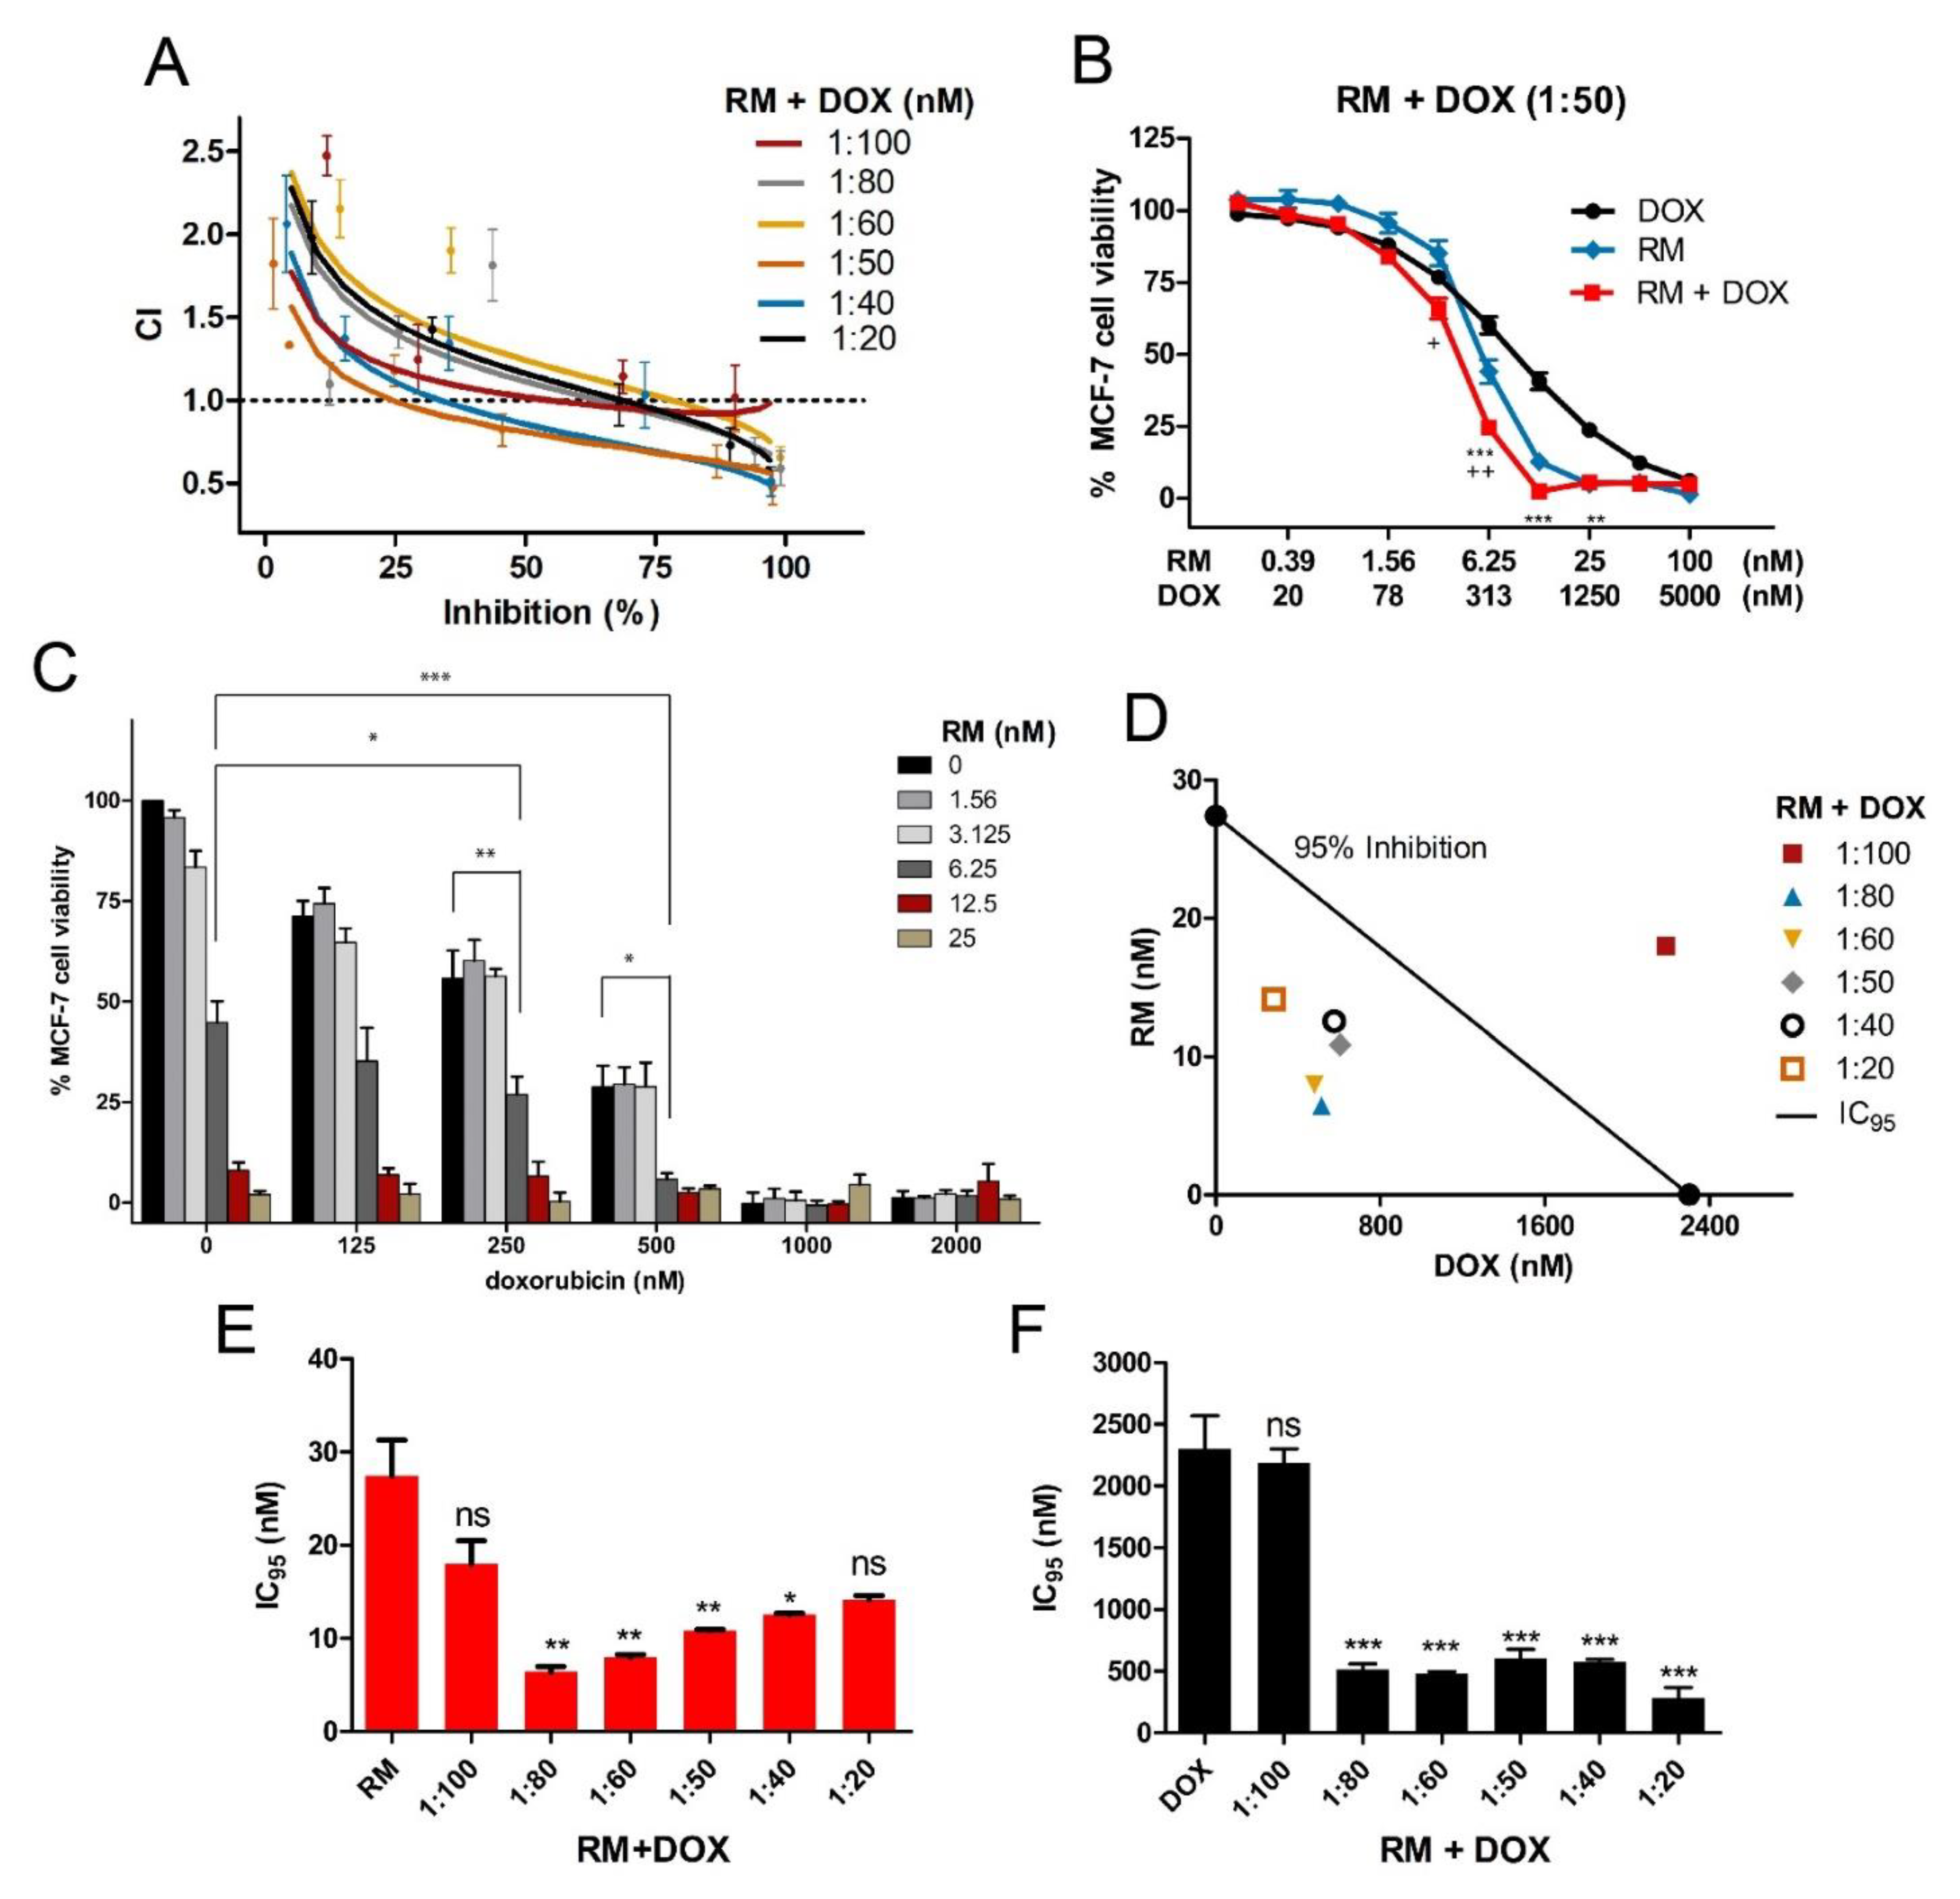
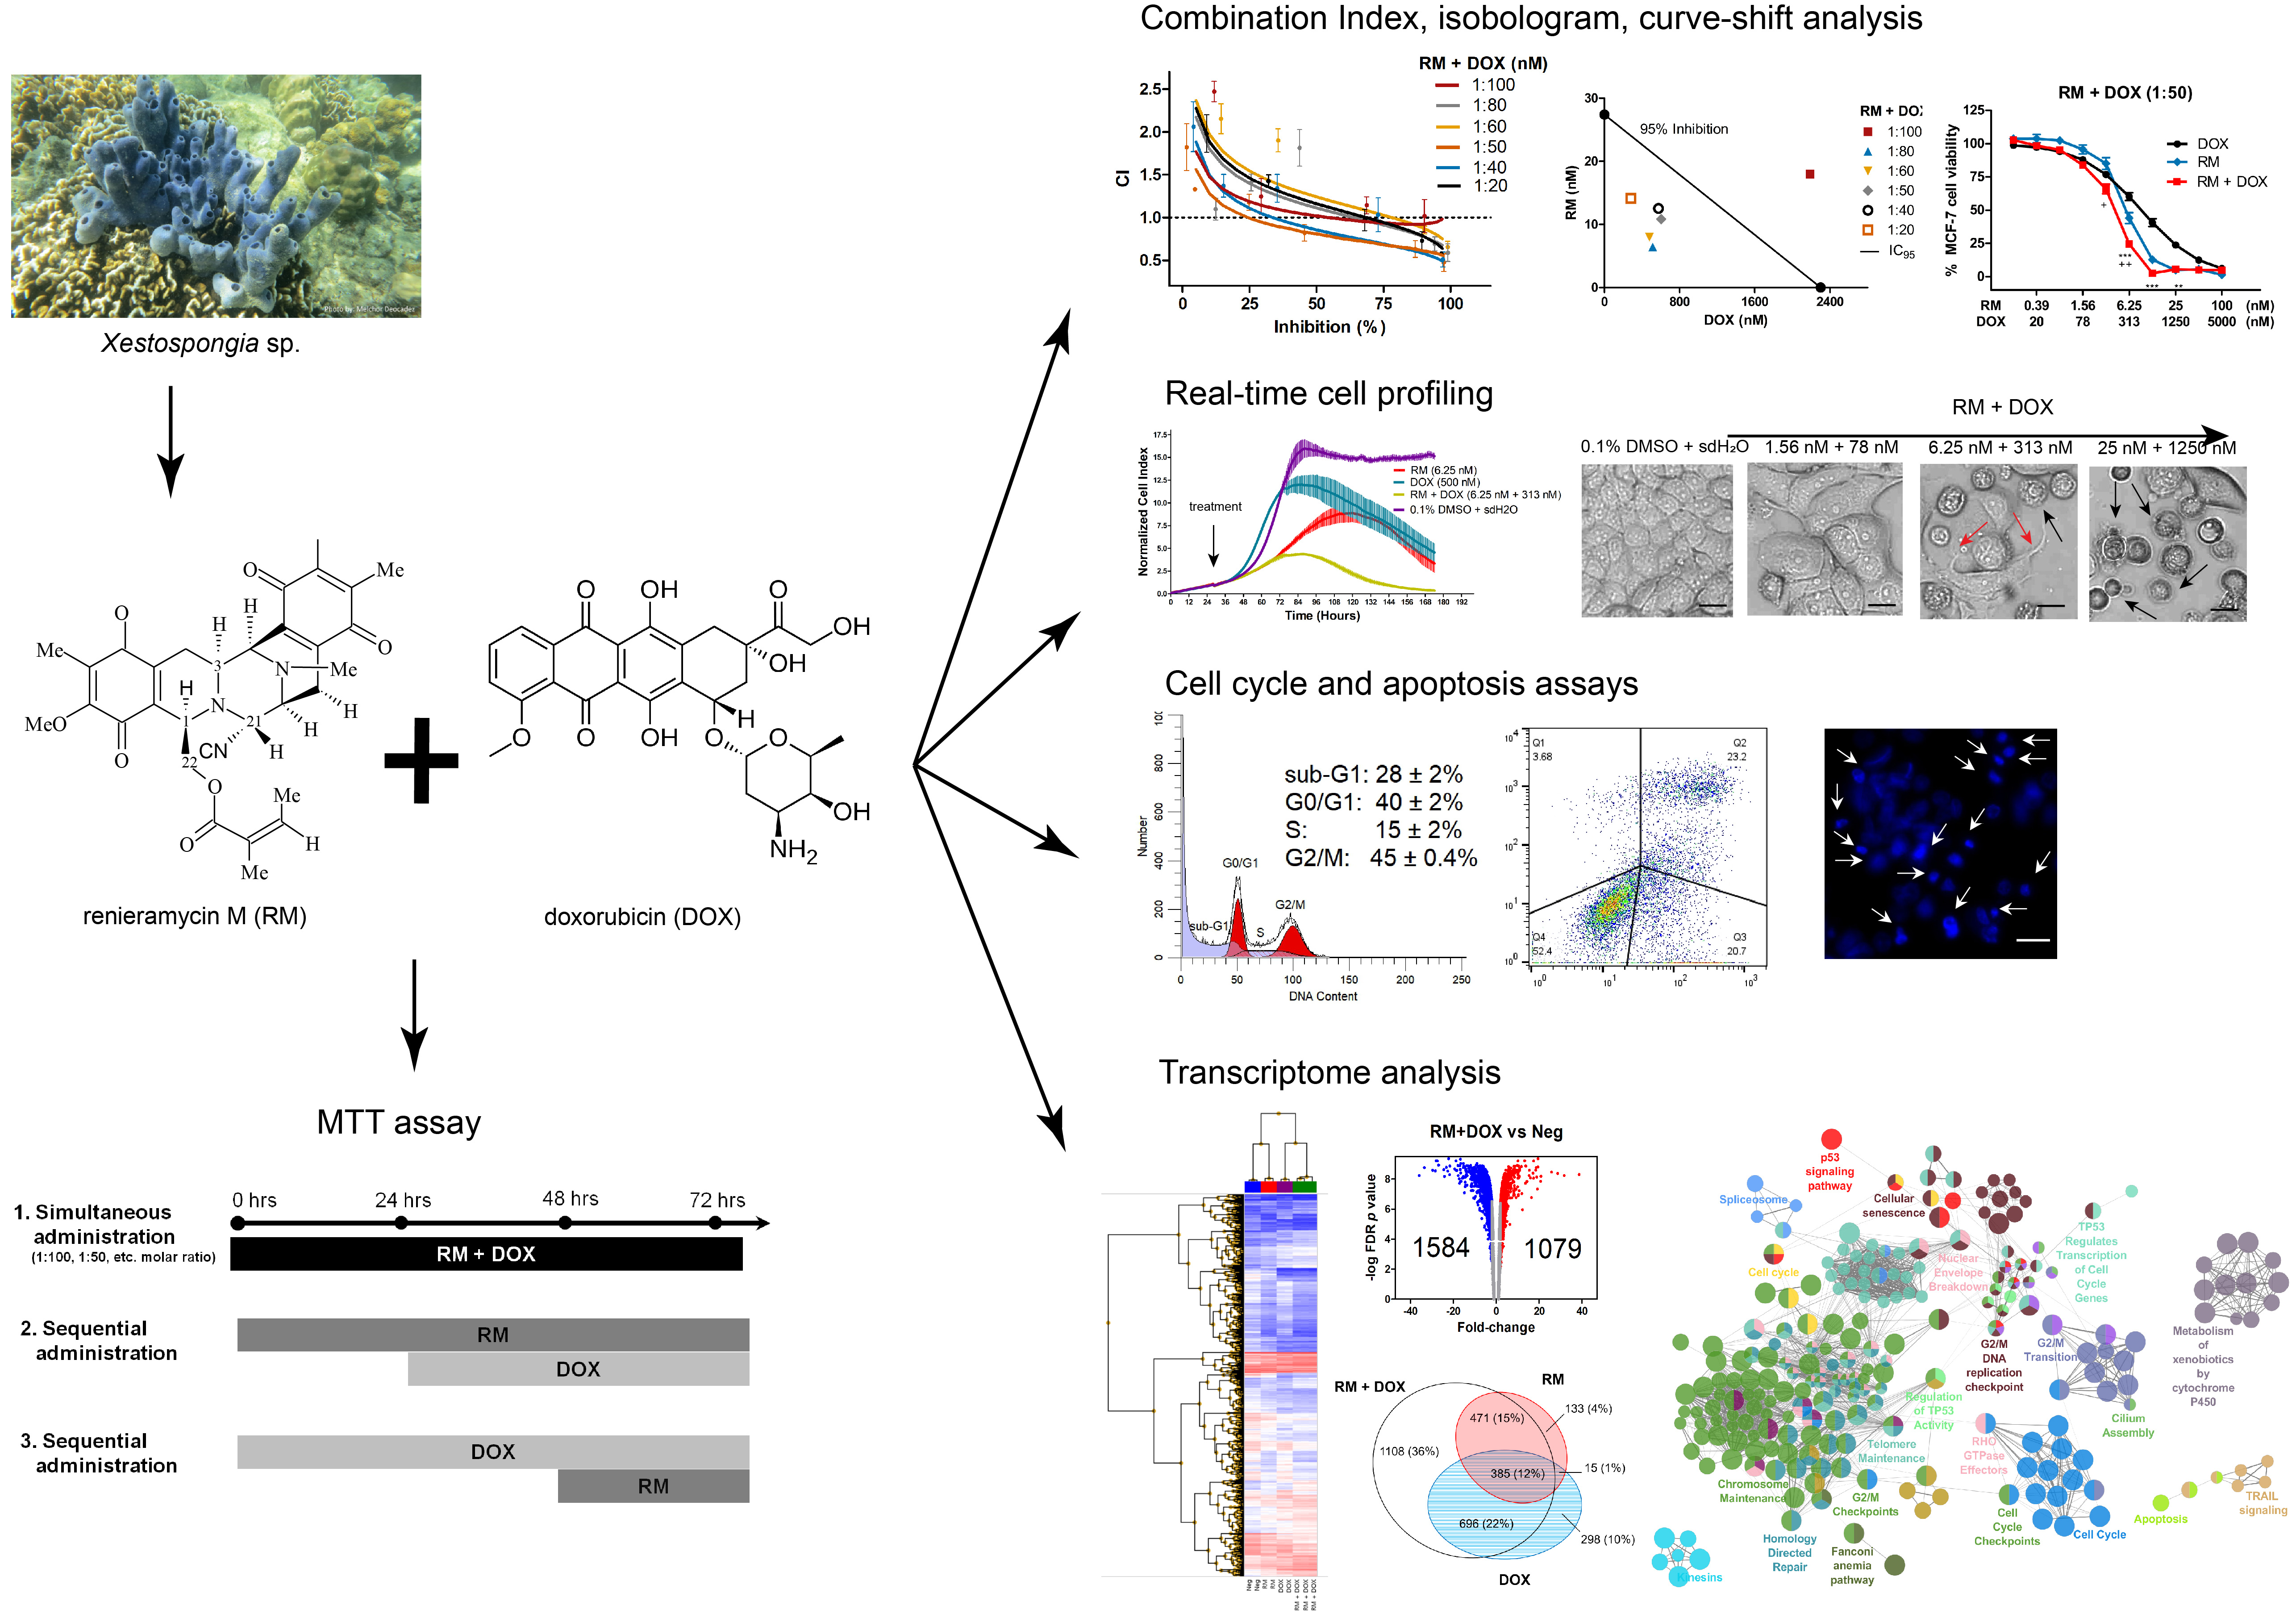
2.2. RM Synergizes with DOX at Different Combination Ratios When Administered Simultaneously, But Not Sequentially in MCF-7 Cells
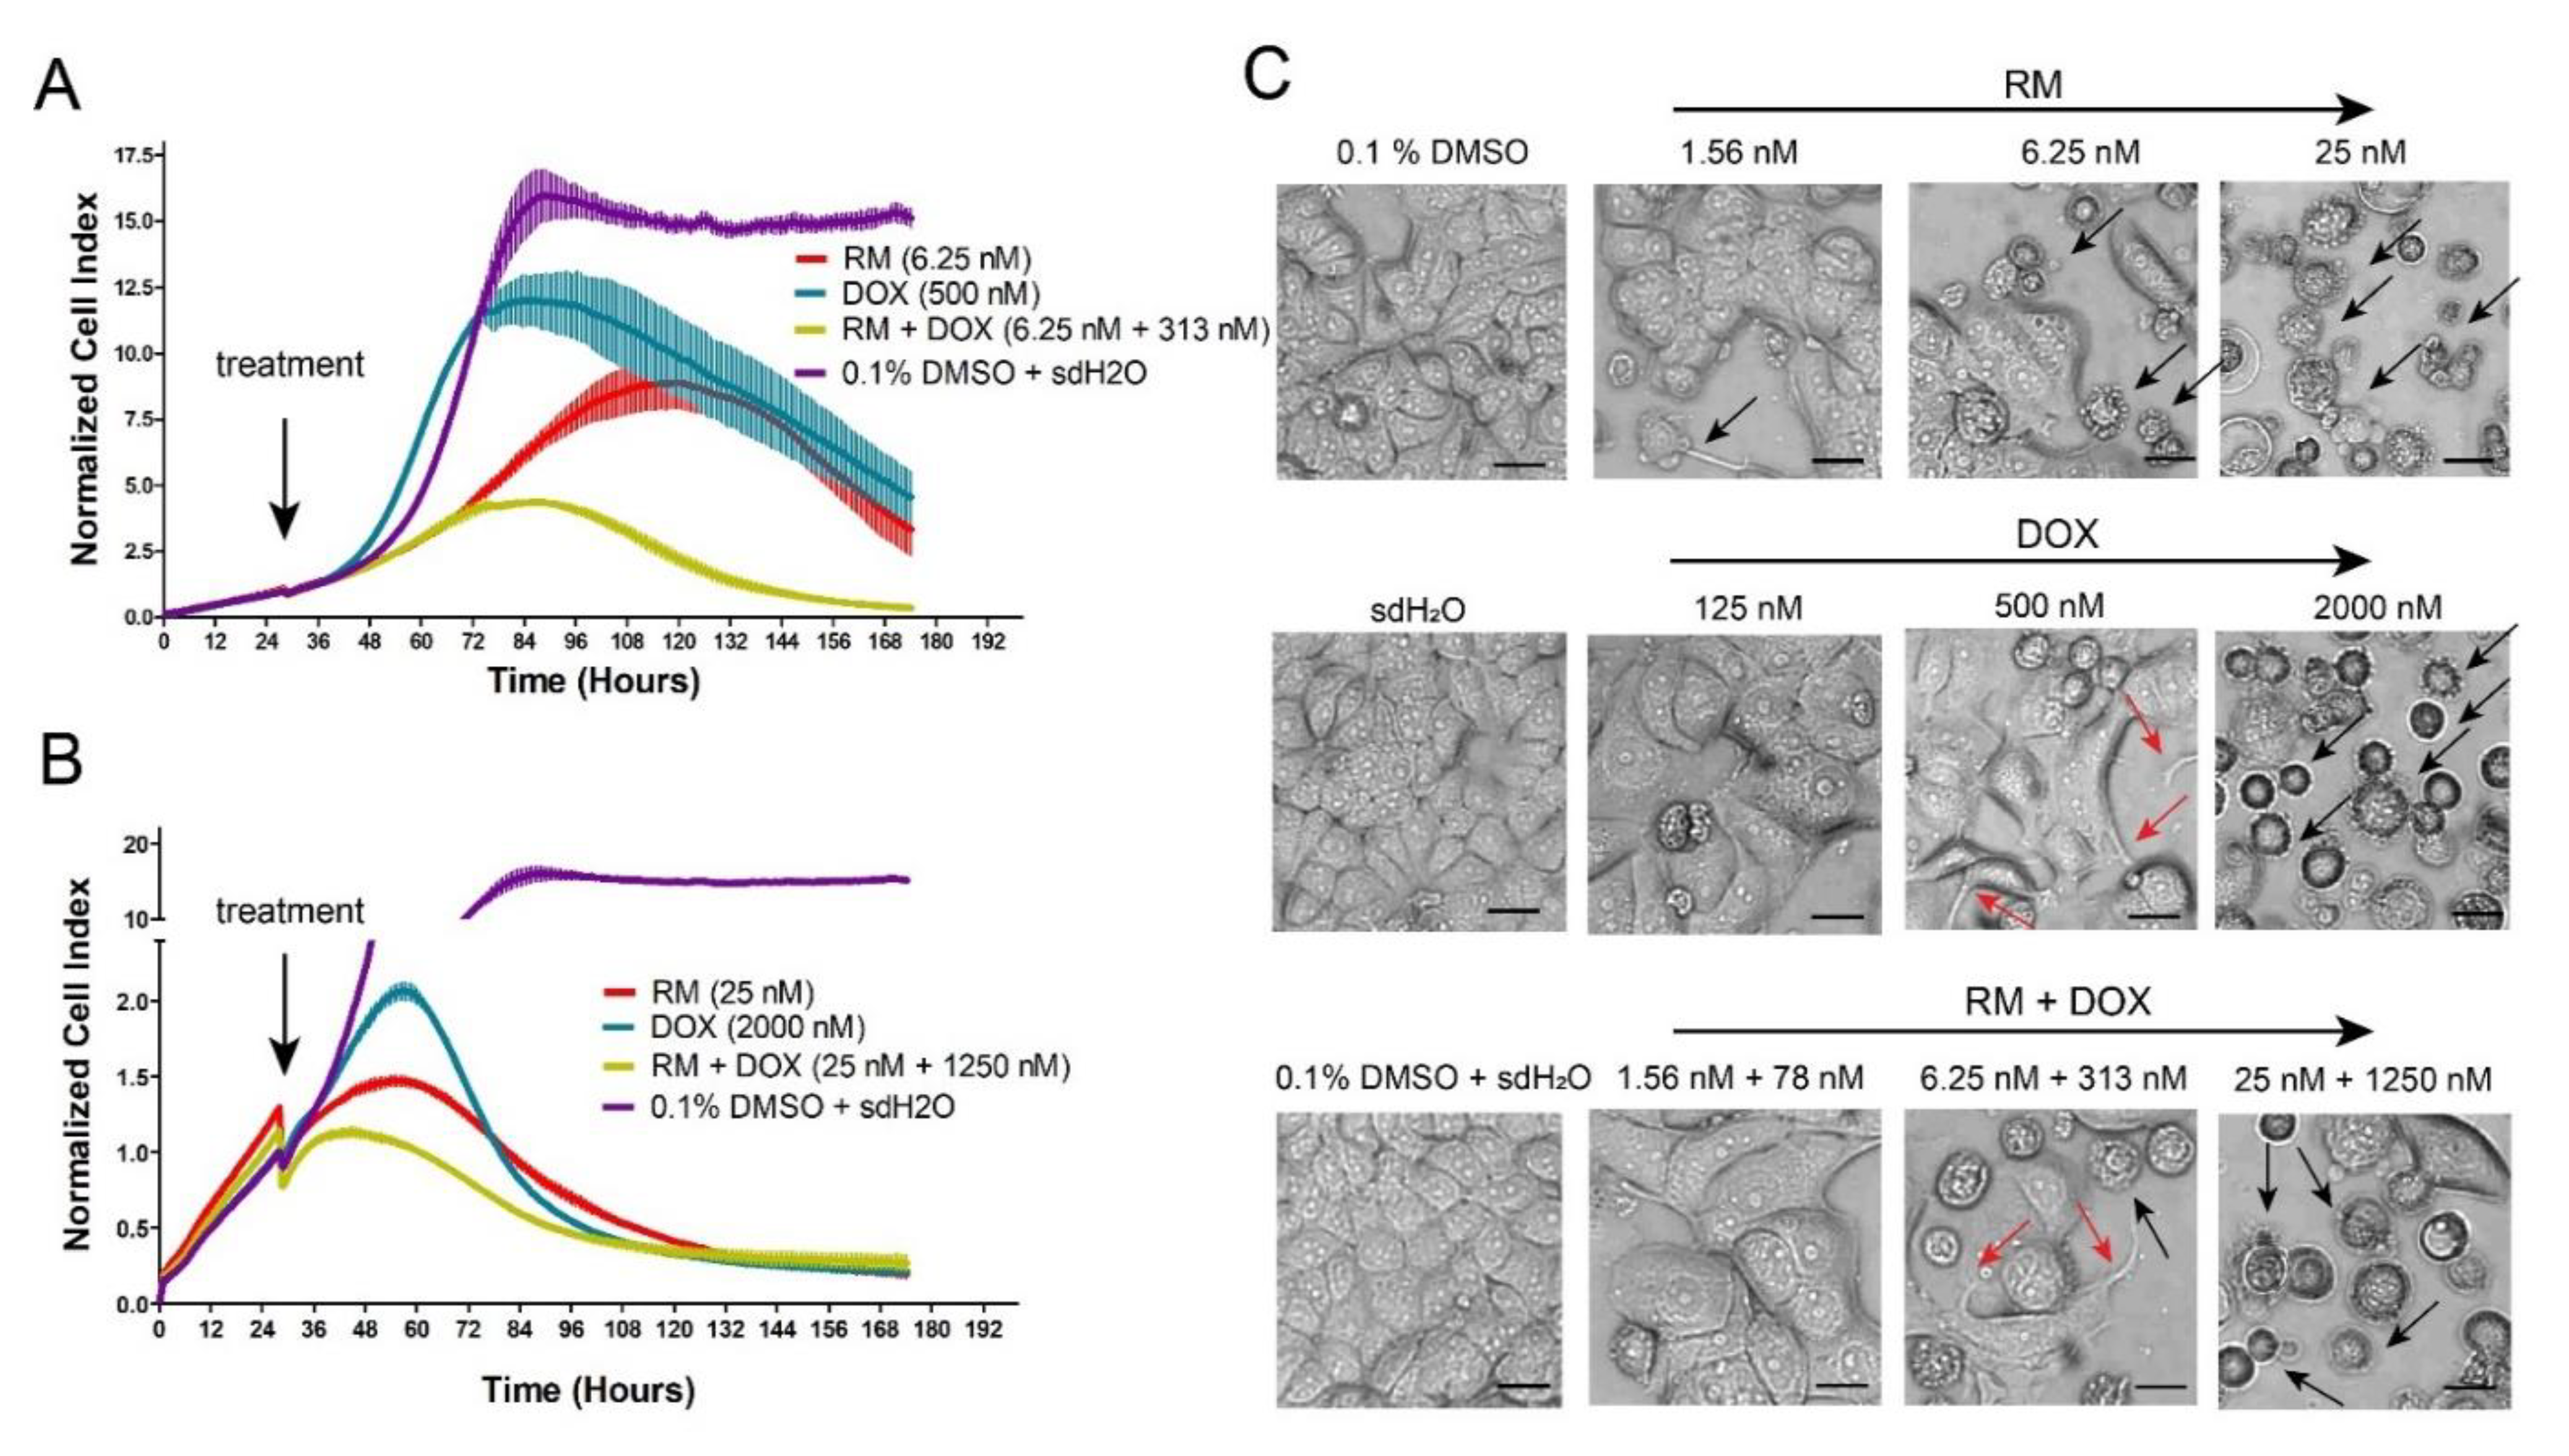
2.3. Combination of RM and DOX Displays Similar Profile with DNA-Damaging Agents with Accelerated and Increased Cytotoxicity
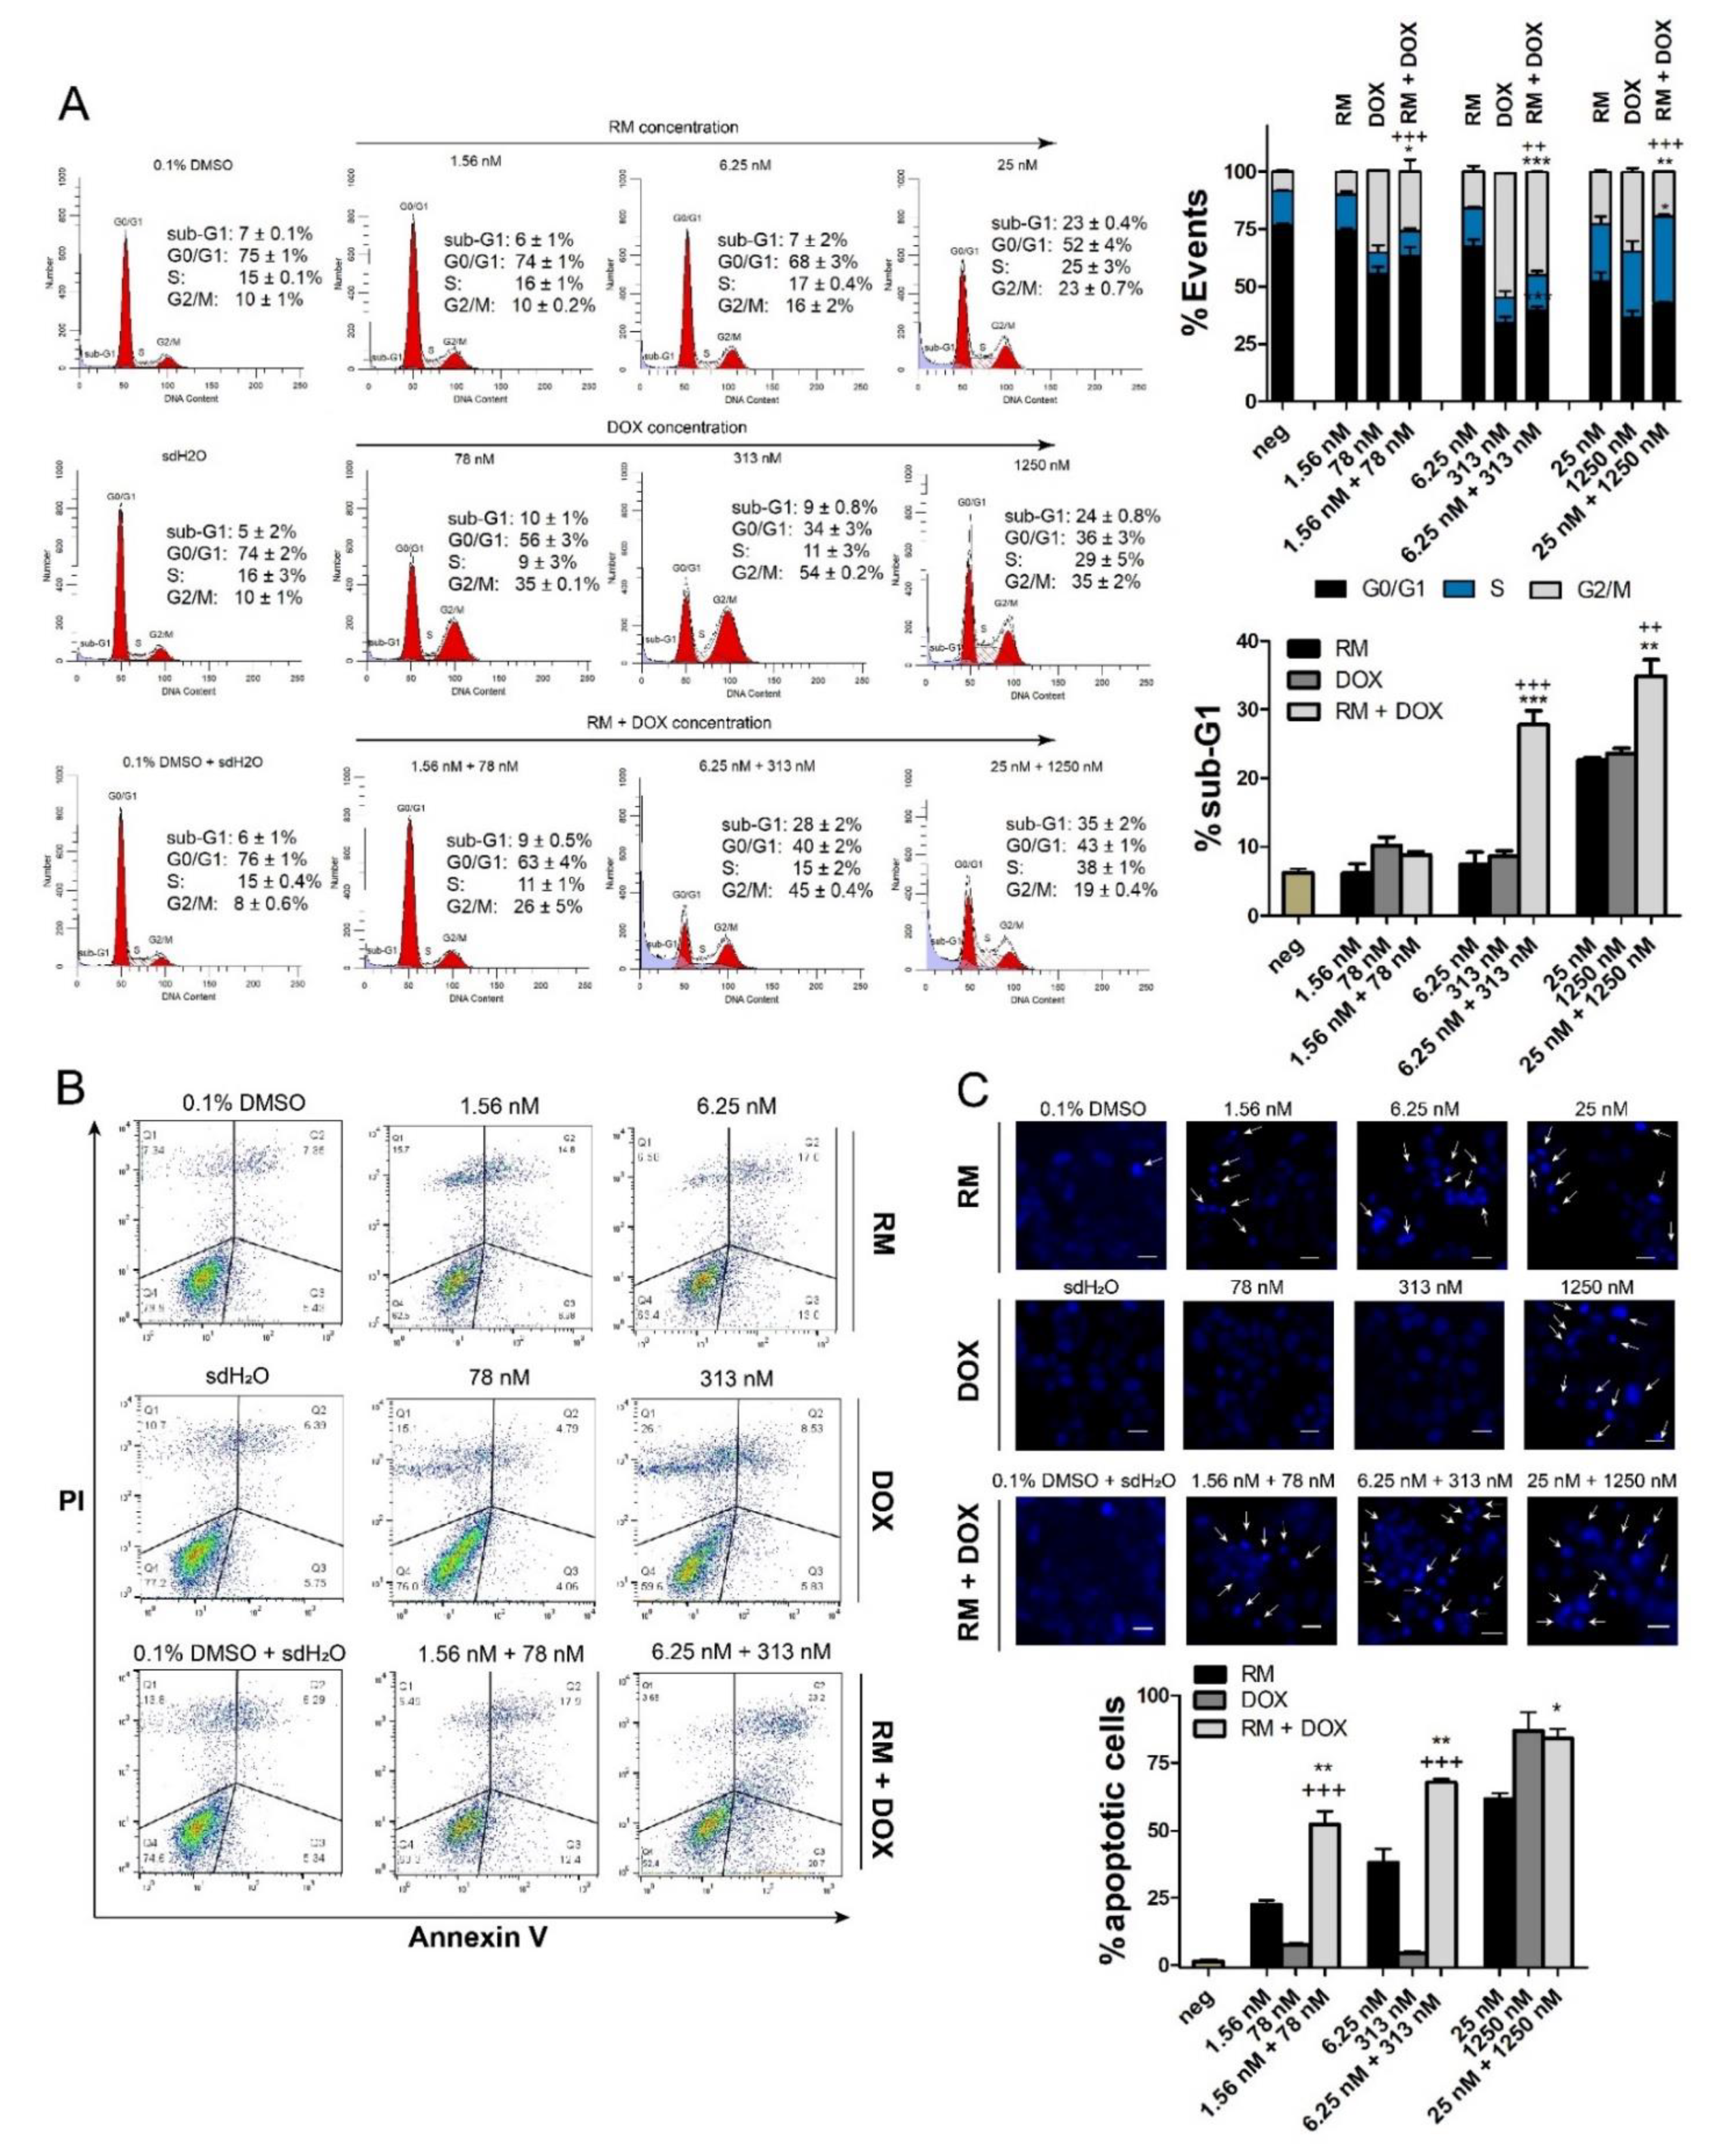
2.4. Combination of RM and DOX Increases Apoptosis
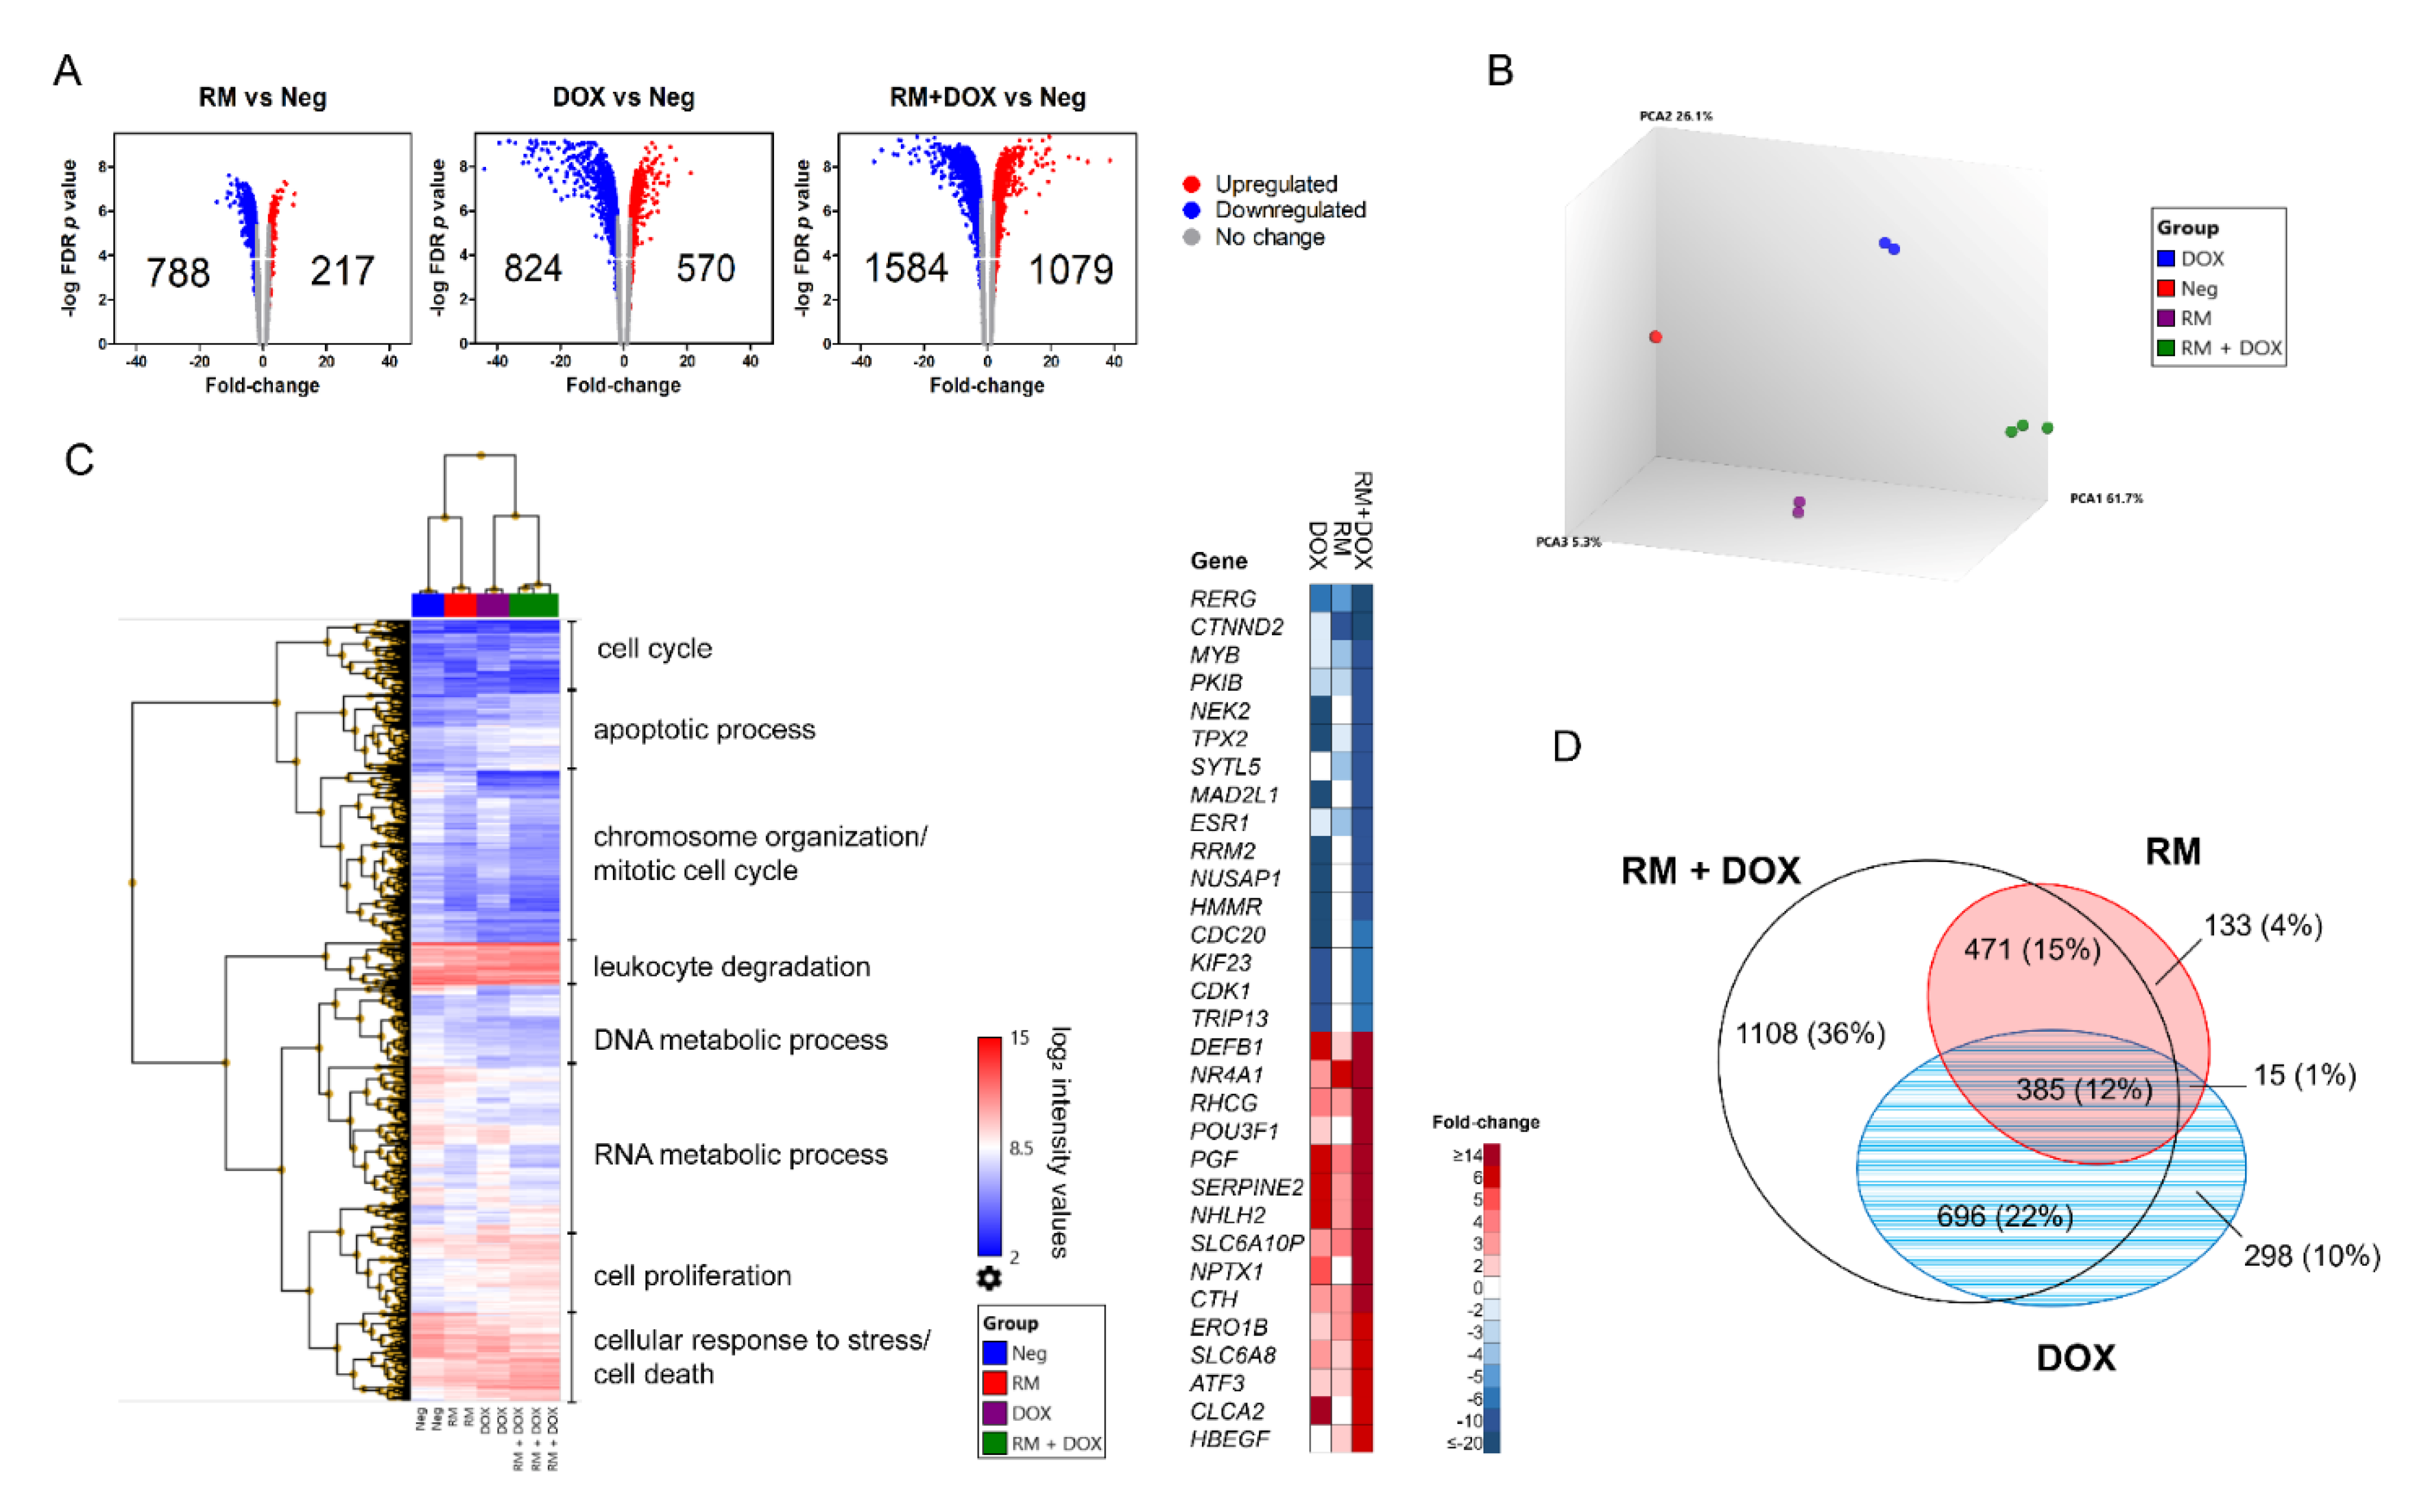
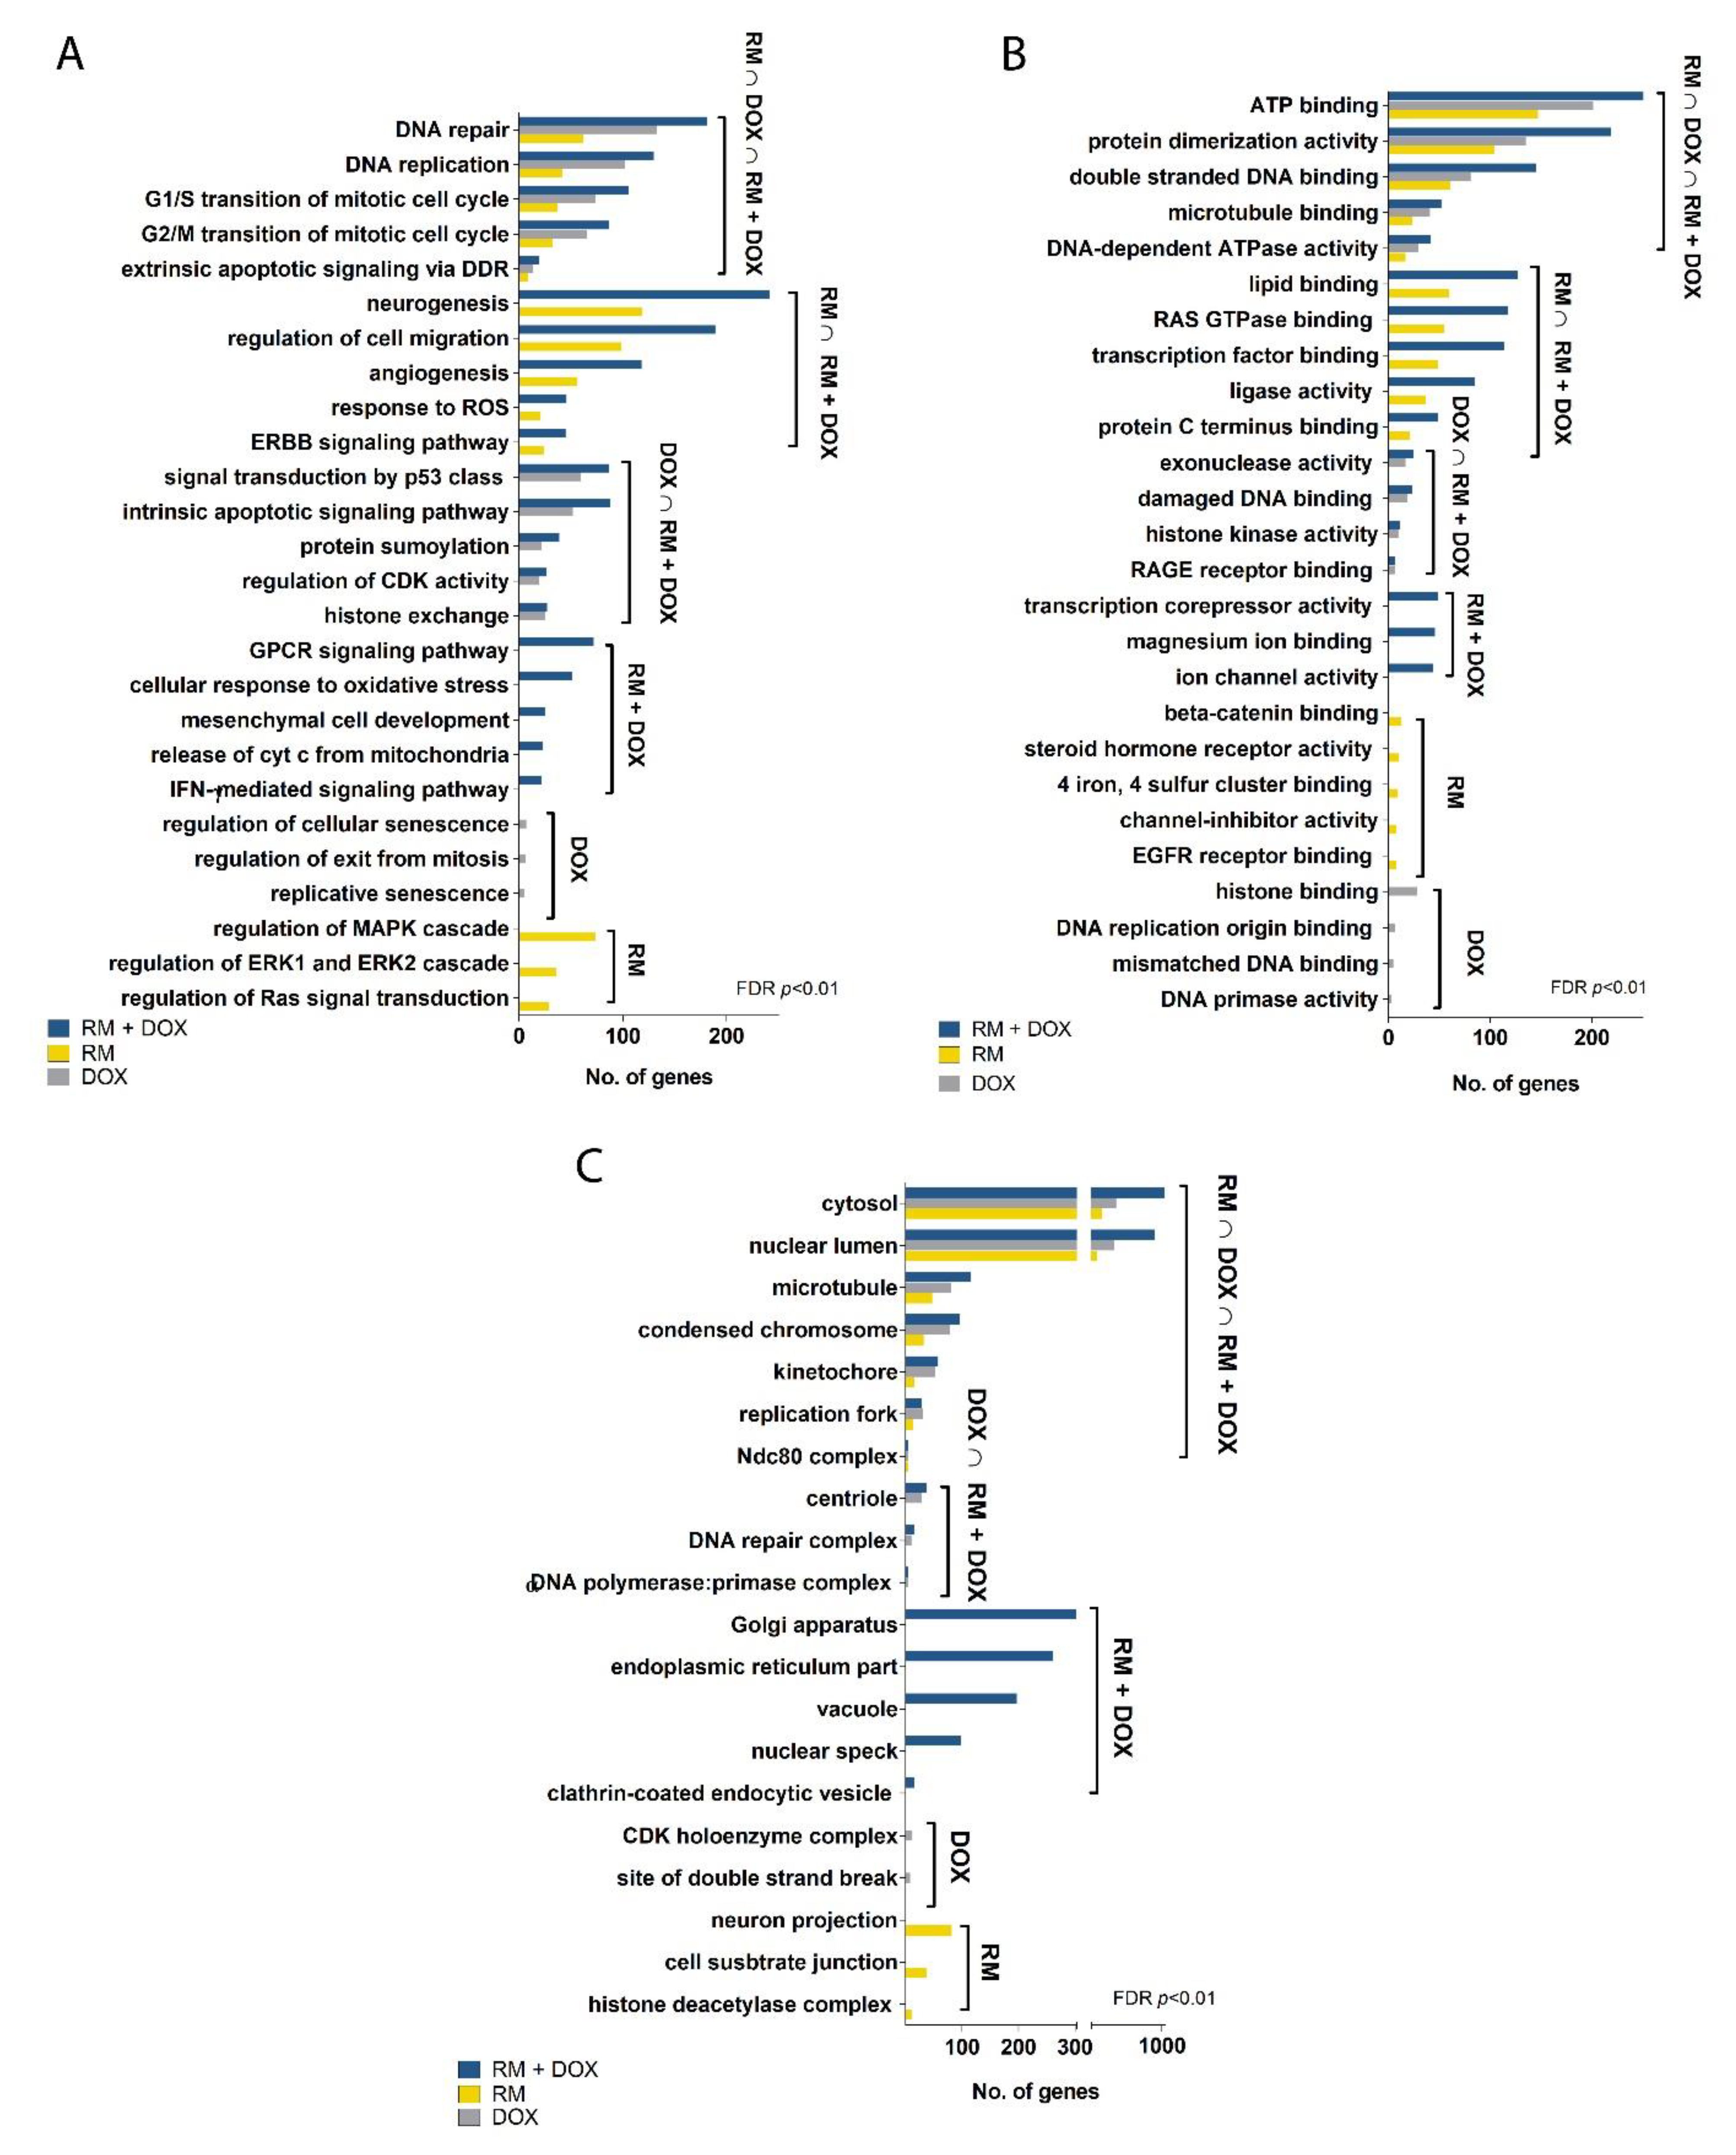
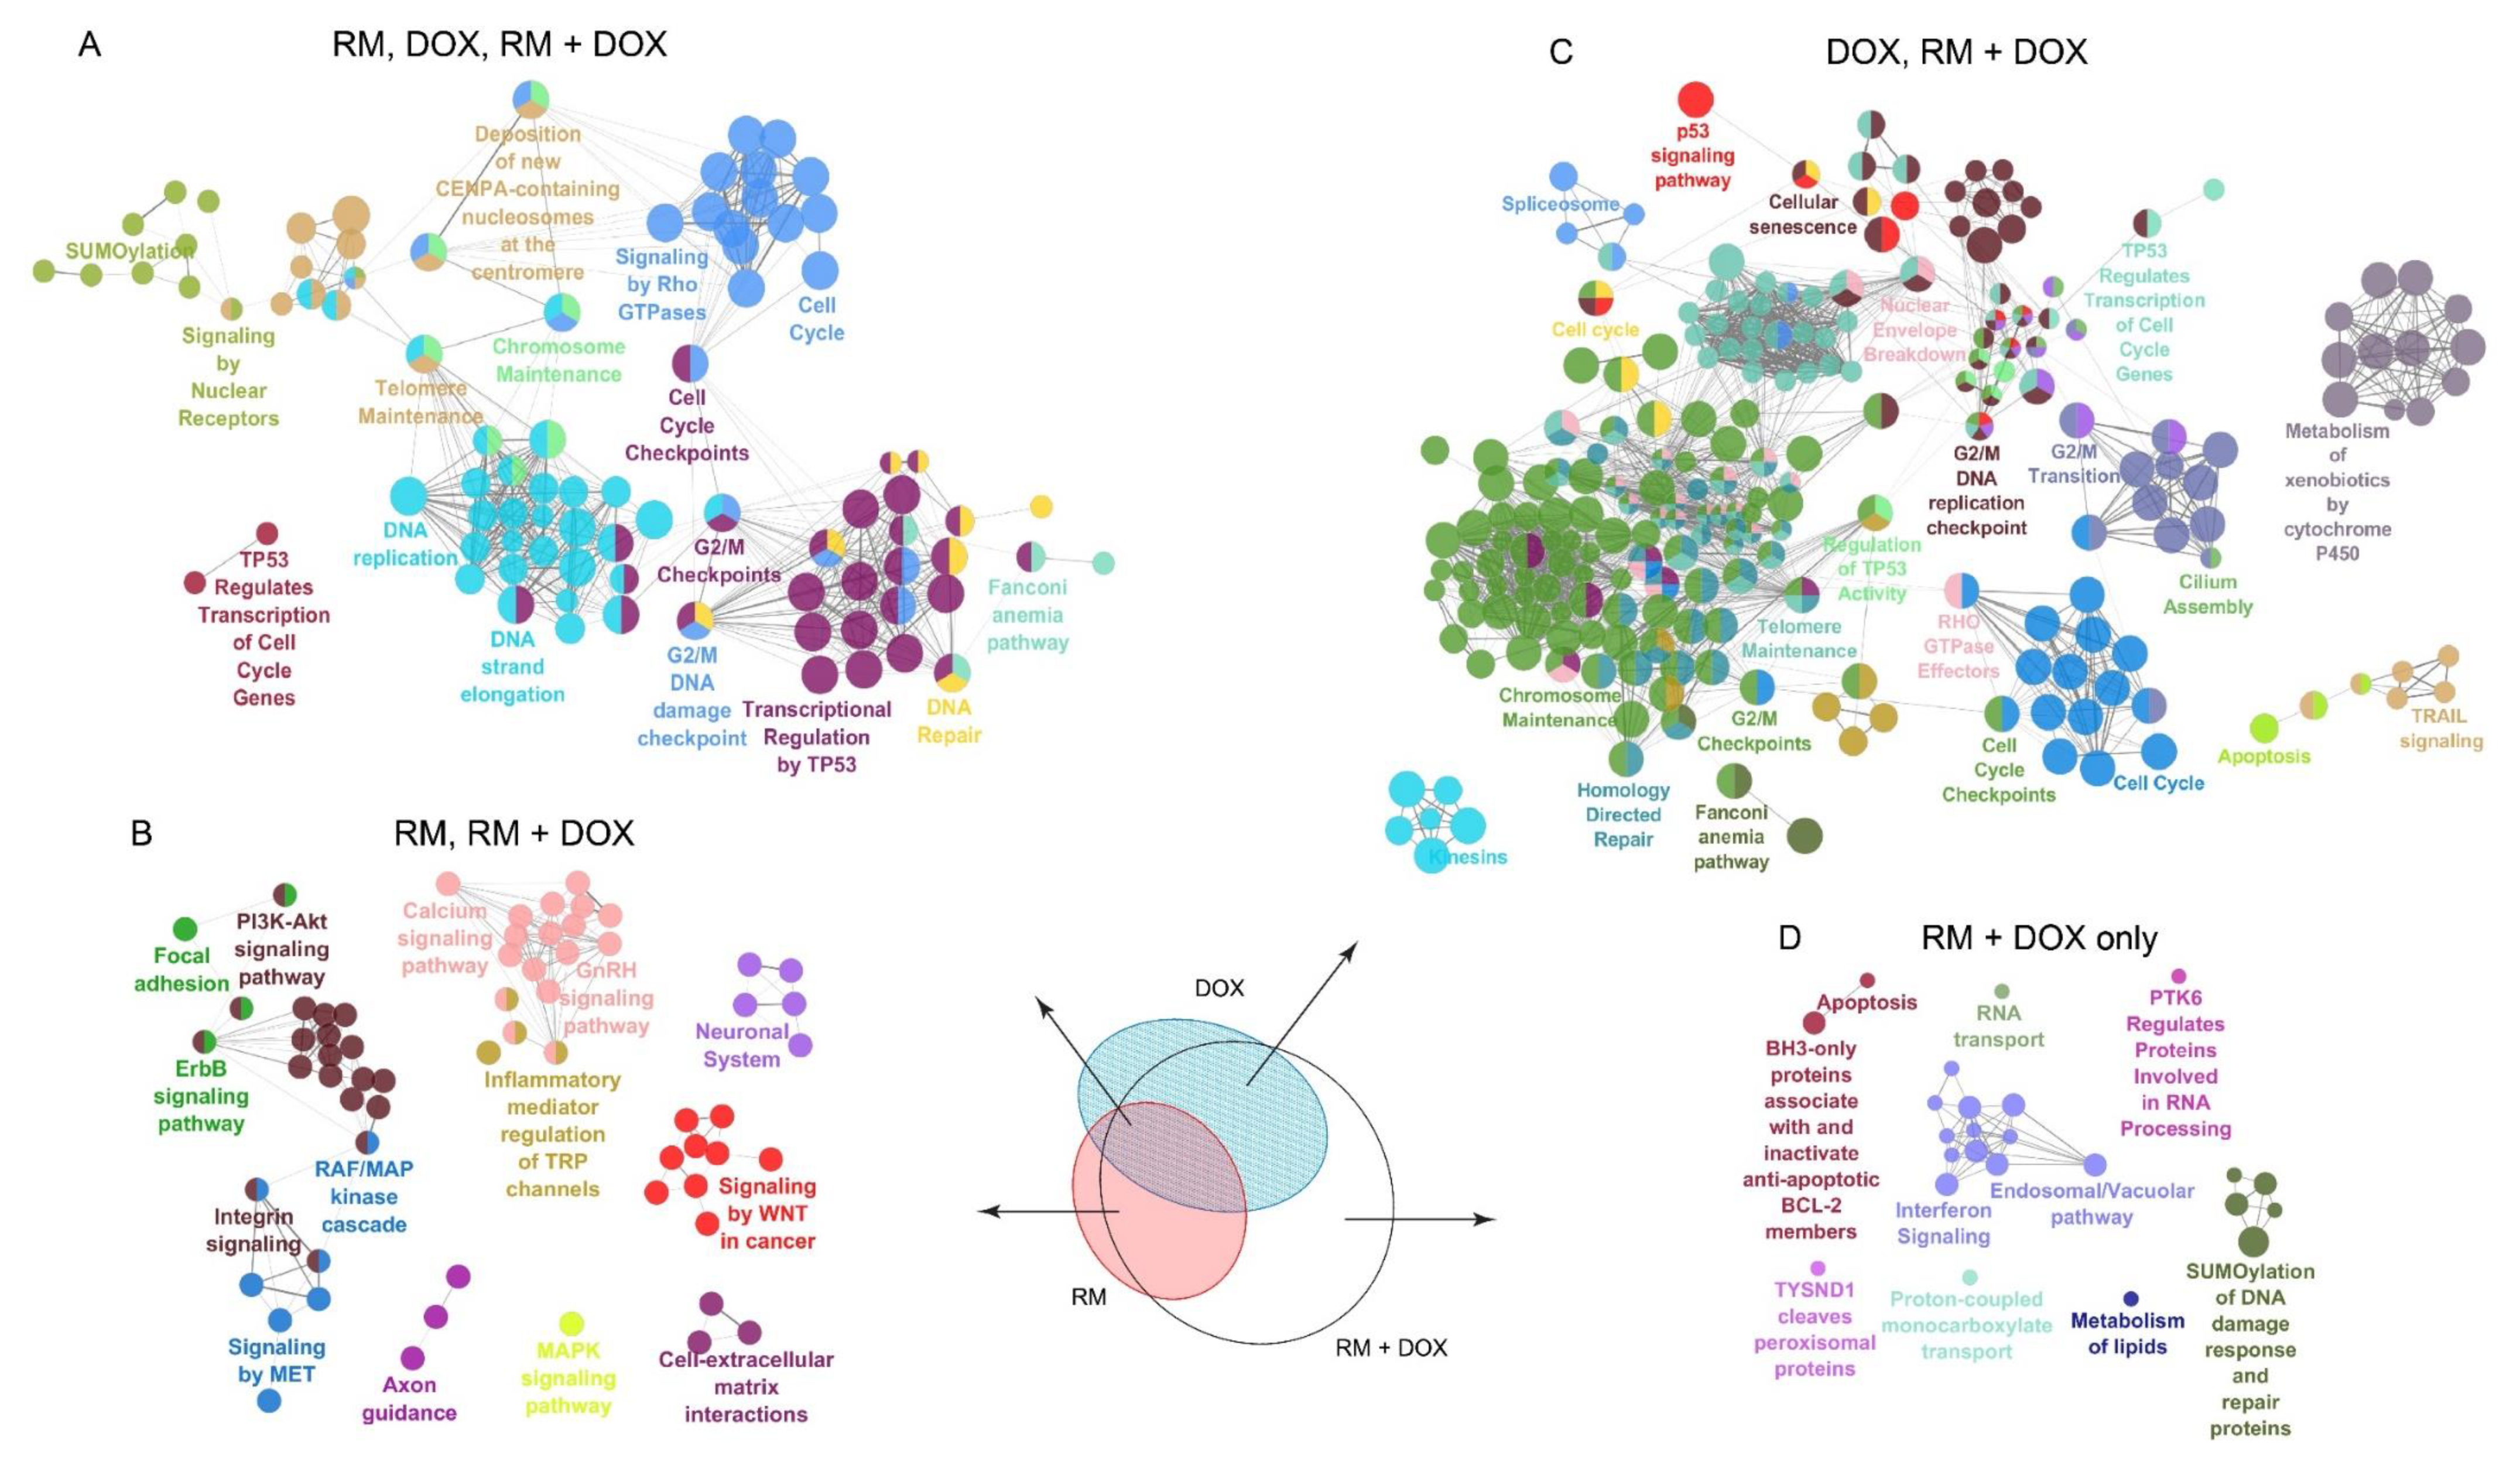
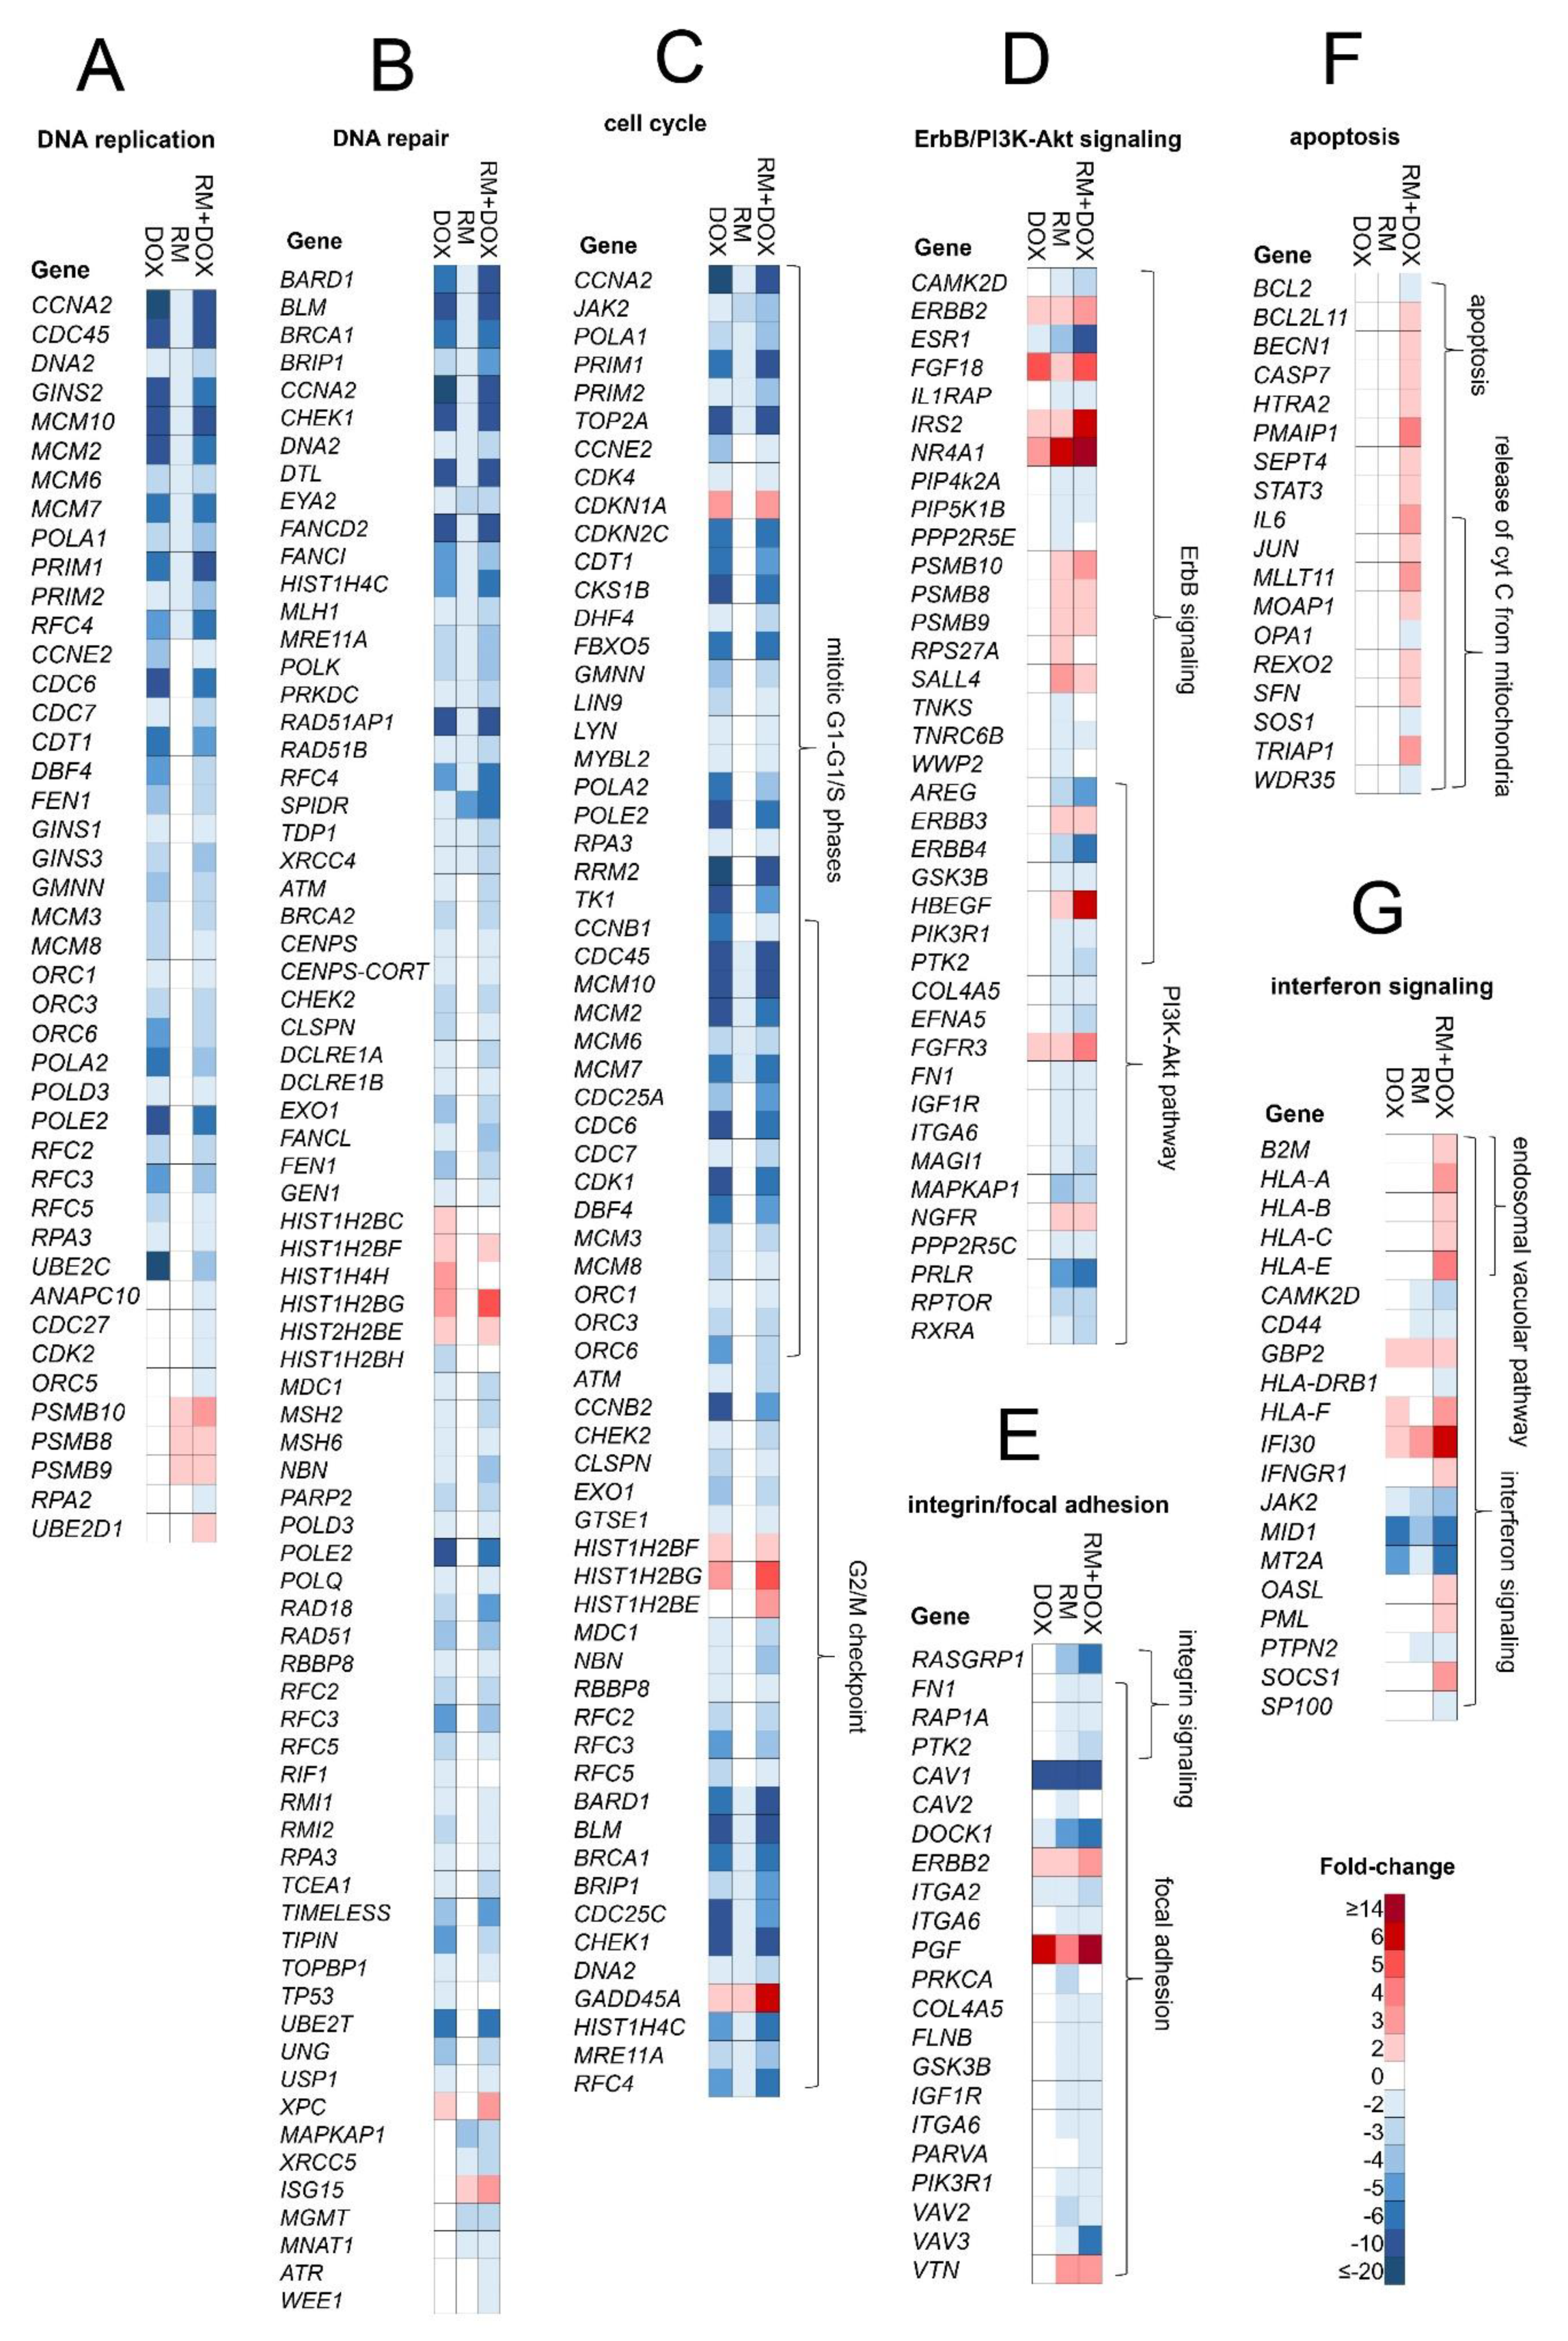
2.5. Combination of RM and DOX Shows Signature Gene Expression Profile Unique from the Single Drug Treatments
2.5.1. DNA Replication
2.5.2. DNA Repair
2.5.3. Cell Cycle
2.5.4. ErbB/PI3K-Akt Signaling
2.5.5. Apoptosis and Interferon Signaling
3. Discussion
4. Materials and Methods
4.1. Chemicals
4.2. Cell Culture
4.3. MTT Cytotoxicity Assay
4.4. Real-Time Monitoring of Cytotoxicity
4.5. Cell Cycle Analysis
4.6. Evaluation of Sequential or Simultaneous Administration of RM and DOX
4.7. Hoechst 33342 Nuclei Staining
4.8. Annexin V/PI Flow Cytometry
4.9. Microarray-Based Transcriptome Analysis
4.10. Statistical Analysis
5. Patents
Supplementary Materials
Author Contributions
Funding
Acknowledgments
Conflicts of Interest
References
- NCCN Clinical Practice Guidelines in Oncology (NCCN Guidelines®) Breast Cancer. 2014. Available online: https://www.nccn.org/professionals/physician_gls/pdf/breast.pdf (accessed on 7 August 2019).
- Charupant, K.; Suwanborirux, K.; Daikuhara, N.; Yokoya, M.; Ushijima-Sugano, R.; Kawai, T.; Owa, T.; Saito, N. Microarray-based transcriptional profiling of renieramycin M and jorunnamycin C, isolated from Thai marine organisms. Mar. Drugs 2009, 7, 483–494. [Google Scholar] [CrossRef] [PubMed]
- Charupant, K.; Daikuhara, N.; Saito, E.; Amnuoypol, S.; Suwanborirux, K.; Owa, T.; Saito, N. Chemistry of renieramycins. Part 8: Synthesis and cytotoxicity evaluation of renieramycin M-jorunnamycin A analogues. Bioorg. Med. Chem. 2009, 17, 4548–4558. [Google Scholar] [CrossRef] [PubMed]
- Charupant, K.; Suwanborirux, K.; Amnuoypol, S.; Saito, E.; Kubo, A.; Saito, N. Jorunnamycins A-C, new stabilized renieramycin-type bistetrahydroisoquinolines isolated from the Thai nudibranch Jorunna funebris. Chem. Pharm. Bull. (Tokyo) 2007, 55, 81–86. [Google Scholar] [CrossRef] [PubMed]
- Amnuoypol, S.; Suwanborirux, K.; Pummangura, S.; Kubo, A.; Tanaka, C.; Saito, N. Chemistry of renieramycins. Part 5. Structure elucidation of renieramycin-type derivatives O, Q, R, and S from thai marine sponge Xestospongia species pretreated with potassium cyanide. J. Nat. Prod. 2004, 67, 1023–1028. [Google Scholar] [CrossRef] [PubMed]
- Saito, N.; Tanaka, C.; Koizumi, Y.; Suwanborirux, K.; Amnuoypol, S.; Pummangura, S.; Kubo, A. Chemistry of renieramycins. Part 6: Transformation of renieramycin M into jorumycin and renieramycin J including oxidative degradation products, mimosamycin, renierone, and renierol acetate. Tetrahedron 2004, 60, 3873–3881. [Google Scholar] [CrossRef]
- Suwanborirux, K.; Amnuoypol, S.; Plubrukarn, A.; Pummangura, S.; Kubo, A.; Tanaka, C.; Saito, N. Chemistry of renieramycins. Part 3.(1) isolation and structure of stabilized renieramycin type derivatives possessing antitumor activity from Thai sponge Xestospongia species, pretreated with potassium cyanide. J. Nat. Prod. 2003, 66, 1441–1446. [Google Scholar] [CrossRef] [PubMed]
- Halim, H.; Chunhacha, P.; Suwanborirux, K.; Chanvorachote, P. Anticancer and antimetastatic activities of Renieramycin M, a marine tetrahydroisoquinoline alkaloid, in human non-small cell lung cancer cells. Anticancer Res. 2011, 31, 193–201. [Google Scholar] [PubMed]
- Tabunoki, H.; Saito, N.; Suwanborirux, K.; Charupant, K.; Satoh, J.-I. Molecular network profiling of U373MG human glioblastoma cells following induction of apoptosis by novel marine-derived anti-cancer 1,2,3,4-tetrahydroisoquinoline alkaloids. Cancer Cell Int. 2012, 12, 14. [Google Scholar] [CrossRef] [PubMed]
- Takahashi, N.; Li, W.; Banerjee, D.; Guan, Y.; Wada-Takahashi, Y.; Brennan, M.F.; Chou, T.; Scotto, K.W.; Bertino, J.R. Sequence-dependent synergistic cytotoxicity of ecteinascidin-743 and paclitaxel in human breast cancer cell lines in vitro and in vivo. Cancer Res. 2002, 62, 6909–6915. [Google Scholar] [PubMed]
- Takahashi, N.; Li, W.W.; Banerjee, D.; Scotto, K.W.; Bertino, J.R. Sequence-dependent enhancement of cytotoxicity produced by ecteinascidin 743 (ET-743) with doxorubicin or paclitaxel in soft tissue sarcoma cells. Clin. Cancer Res. 2001, 7, 3251–3257. [Google Scholar] [PubMed]
- Chou, T.-C.; Martin, N. CompuSyn For Drug Combinations and For General Dose-Effect Analysis, And User’s Guide A Computer Program for Quantitation of Synergism and Antagonism in Drug Combinations, and the Determination of IC50, ED50, and LD50 Values; ComboSyn, Inc.: Paramus, NJ, USA, 2005; Available online: http://www.combosyn.com/feature.html (accessed on 7 August 2019).
- Chou, T.-C. Theoretical Basis, Experimental Design, and Computerized Simulation of Synergism and Antagonism in Drug Combination Studies. Pharmacol. Rev. 2006, 58, 621–681. [Google Scholar] [CrossRef] [PubMed]
- Porrata, L.F.; Adjei, A.A. The pharmacologic basis of high dose chemotherapy with haematopoietic stem cell support for solid tumours. Br. J. Cancer 2001, 85, 484–489. [Google Scholar] [CrossRef] [PubMed]
- Chou, T.C.; Otter, G.M.; Sirotnak, F.M. Schedule-dependent synergism of taxol or taxotere with edatrexate against human breast cancer cells in vitro. Cancer Chemother. Pharmacol. 1996, 37, 222–228. [Google Scholar] [CrossRef] [PubMed]
- Xing, J.Z.; Zhu, L.; Jackson, J.A.; Gabos, S.; Sun, X.-J.; Wang, X.-B.; Xu, X. Dynamic monitoring of cytotoxicity on microelectronic sensors. Chem. Res. Toxicol. 2005, 18, 154–161. [Google Scholar] [CrossRef] [PubMed]
- Abassi, Y.A.; Xi, B.; Zhang, W.; Ye, P.; Kirstein, S.L.; Gaylord, M.R.; Feinstein, S.C.; Wang, X.; Xu, X. Kinetic cell-based morphological screening: prediction of mechanism of compound action and off-target effects. Chem. Biol. 2009, 16, 712–723. [Google Scholar] [CrossRef] [PubMed]
- Atienzar, F.; Gerets, H.; Tilmant, K.; Toussaint, G.; Dhalluin, S. Evaluation of Impedance-Based Label-Free Technology as a Tool for Pharmacology and Toxicology Investigations. Biosensors 2013, 3, 132–156. [Google Scholar] [CrossRef] [PubMed]
- Petrova, N.V.; Velichko, A.K.; Razin, S.V.; Kantidze, O.L. Small molecule compounds that induce cellular senescence. Aging Cell 2016, 15, 999–1017. [Google Scholar] [CrossRef] [PubMed] [Green Version]
- Focaccetti, C.; Bruno, A.; Magnani, E.; Bartolini, D.; Principi, E.; Dallaglio, K.; Bucci, E.O.; Finzi, G.; Sessa, F.; Noonan, D.M.; et al. Effects of 5-fluorouracil on morphology, cell cycle, proliferation, apoptosis, autophagy and ROS production in endothelial cells and cardiomyocytes. PLoS ONE 2015, 10, e0115686. [Google Scholar] [CrossRef] [PubMed]
- Dabrowska, M.; Skoneczny, M.; Rode, W. Functional gene expression profile underlying methotrexate-induced senescence in human colon cancer cells. Tumor Biol. 2011, 32, 965–976. [Google Scholar] [CrossRef] [Green Version]
- Eom, Y.-W.; Kim, M.A.; Park, S.S.; Goo, M.J.; Kwon, H.J.; Sohn, S.; Kim, W.-H.; Yoon, G.; Choi, K.S. Two distinct modes of cell death induced by doxorubicin: Apoptosis and cell death through mitotic catastrophe accompanied by senescence-like phenotype. Oncogene 2005, 24, 4765–4777. [Google Scholar] [CrossRef]
- Dimri, G.P.; Lee, X.; Basile, G.; Acosta, M.; Scott, G.; Roskelley, C.; Medrano, E.E.; Linskens, M.; Rubelj, I.; Pereira-Smith, O. A biomarker that identifies senescent human cells in culture and in aging skin in vivo. Proc. Natl. Acad. Sci. USA 1995, 92, 9363–9367. [Google Scholar] [CrossRef] [PubMed]
- Hernández-Vargas, H.; Ballestar, E.; Carmona-Saez, P.; von Kobbe, C.; Bañón-Rodríguez, I.; Esteller, M.; Moreno-Bueno, G.; Palacios, J. Transcriptional profiling of MCF7 breast cancer cells in response to 5-Fluorouracil: relationship with cell cycle changes and apoptosis, and identification of novel targets of p53. Int. J. Cancer 2006, 119, 1164–1175. [Google Scholar] [CrossRef]
- Jänicke, R.U.; Sprengart, M.L.; Wati, M.R.; Porter, A.G. Caspase-3 Is Required for DNA Fragmentation and Morphological Changes Associated with Apoptosis. J. Biol. Chem. 1998, 273, 9357–9360. [Google Scholar] [CrossRef] [PubMed] [Green Version]
- Shi, W.; Feng, Z.; Zhang, J.; Gonzalez-Suarez, I.; Vanderwaal, R.P.; Wu, X.; Powell, S.N.; Roti Roti, J.L.; Gonzalo, S.; Zhang, J. The role of RPA2 phosphorylation in homologous recombination in response to replication arrest. Carcinogenesis 2010, 31, 994–1002. [Google Scholar] [CrossRef] [PubMed] [Green Version]
- Farmer, H.; McCabe, H.; Lord, C.J.; Tutt, A.H.J.; Johnson, D.A.; Richardson, T.B.; Santarosa, M.; Dillon, K.J.; Hickson, I.; Knights, C.; et al. Targeting the DNA repair defect in BRCA mutant cells as a therapeutic strategy. Nature 2005, 434, 917–921. [Google Scholar] [CrossRef] [PubMed]
- Bryant, H.E.; Schultz, N.; Thomas, H.D.; Parker, K.M.; Flower, D.; Lopez, E.; Kyle, S.; Meuth, M.; Curtin, N.J.; Helleday, T. Specific killing of BRCA2-deficient tumours with inhibitors of poly(ADP-ribose) polymerase. Nature 2005, 434, 913–917. [Google Scholar] [CrossRef] [PubMed]
- Marechal, A.; Zou, L. DNA Damage Sensing by the ATM and ATR Kinases. Cold Spring Harb. Perspect. Biol. 2013, 5, 12716. [Google Scholar] [CrossRef] [PubMed]
- Symington, L.S.; Gautier, J. Double-strand break end resection and repair pathway choice. Annu. Rev. Genet. 2011, 45, 247–271. [Google Scholar] [CrossRef] [PubMed]
- Jazayeri, A.; Falck, J.; Lukas, C.; Bartek, J.; Smith, G.C.M.; Lukas, J.; Jackson, S.P. ATM- and cell cycle-dependent regulation of ATR in response to DNA double-strand breaks. Nat. Cell Biol. 2006, 8, 37–45. [Google Scholar] [CrossRef]
- Sartori, A.A.; Lukas, C.; Coates, J.; Mistrik, M.; Fu, S.; Bartek, J.; Baer, R.; Lukas, J.; Jackson, S.P. Human CtIP promotes DNA end resection. Nature 2007, 450, 509–514. [Google Scholar] [CrossRef] [Green Version]
- Tomimatsu, N.; Mukherjee, B.; Deland, K.; Kurimasa, A.; Bolderson, E.; Khanna, K.K.; Burma, S. Exo1 plays a major role in DNA end resection in humans and influences double-strand break repair and damage signaling decisions. DNA Repair (Amst). 2012, 11, 441–448. [Google Scholar] [CrossRef] [PubMed] [Green Version]
- Karanja, K.K.; Cox, S.W.; Duxin, J.P.; Stewart, S.A.; Campbell, J.L. DNA2 and EXO1 in replication-coupled, homology-directed repair and in the interplay between HDR and the FA/BRCA network. Cell Cycle 2012, 11, 3983–3996. [Google Scholar] [CrossRef] [PubMed] [Green Version]
- Hsieh, R.W.; Kuo, A.H.; Scheeren, F.A.; Zarnegar, M.A.; Sikandar, S.S.; Antony, J.; Heitink, L.S.; Periyakoil, D.; Dirbas, M.; Jadhav, A.; et al. CDK19 is a Regulator of Triple-Negative Breast Cancer Growth. bioRxiv 2018. [Google Scholar] [CrossRef]
- McDermott, M.S.J.; Chumanevich, A.A.; Lim, C.; Liang, J.; Chen, M.; Altilia, S.; Oliver, D.; Rae, J.M.; Shtutman, M.; Kiaris, H.; et al. Inhibition of CDK8 mediator kinase suppresses estrogen dependent transcription and the growth of estrogen receptor positive breast cancer. Oncotarget 2017, 8, 12558–12575. [Google Scholar] [CrossRef] [PubMed] [Green Version]
- Cheun-Arom, T.; Chanvorachote, P.; Sirimangkalakitti, N.; Chuanasa, T.; Saito, N.; Abe, I.; Suwanborirux, K. Replacement of a quinone by a 5-O-acetylhydroquinone abolishes the accidental necrosis inducing effect while preserving the apoptosis-inducing effect of renieramycin M on lung cancer cells. J. Nat. Prod. 2013, 76, 1468–1474. [Google Scholar] [CrossRef] [PubMed]
- Ivy, S.P.; de Bono, J.; Kohn, E.C. The ‘Pushmi-Pullyu’ of DNA REPAIR: Clinical Synthetic Lethality. Trends Cancer 2016, 2, 646–656. [Google Scholar] [CrossRef]
- Newman, D.J.; Cragg, G.M. Marine-sourced anti-cancer and cancer pain control agents in clinical and late preclinical development. Mar. Drugs 2014, 12, 255–278. [Google Scholar] [CrossRef]
- Frederick, C.A.; Williams, L.D.; Ughetto, G.; van der Marel, G.A.; van Boom, H.J.; Rich, A.; Wang, A.H.J. Structural Comparison of Anticancer Drug-DNA Complexes: Adriamycin and Daunomycin. Biochemistry 1990, 29, 2538–2549. [Google Scholar] [CrossRef]
- Pommier, Y.; Leo, E.; Zhang, H.; Marchand, C. Review DNA Topoisomerases and Their Poisoning by Anticancer and Antibacterial Drugs. Chem. Biol. 2010, 17, 421–433. [Google Scholar] [CrossRef]
- D’Incalci, M.; Galmarini, C.M. A review of trabectedin (ET-743): A unique mechanism of action. Mol. Cancer Ther. 2010, 9, 2157–2163. [Google Scholar] [CrossRef]
- David-Cordonnier, M.-H.; Gajate, C.; Olmea, O.; Laine, W.; de la Iglesia-Vicente, J.; Perez, C.; Cuevas, C.; Otero, G.; Manzanares, I.; Bailly, C.; et al. DNA and non-DNA targets in the mechanism of action of the antitumor drug trabectedin. Chem. Biol. 2005, 12, 1201–1210. [Google Scholar] [CrossRef] [PubMed]
- Scott, J.D.; Williams, R.M. Chemistry and biology of the tetrahydroisoquinoline antitumor antibiotics. Chem. Rev. 2002, 102, 1669–1730. [Google Scholar] [CrossRef] [PubMed]
- Lown, J.W.; Joshua, A.V.; Lee, J.S. Molecular mechanisms of binding and single-strand scission of deoxyribonucleic acid by the antitumor antibiotics saframycins A and C. Biochemistry 1982, 21, 419–428. [Google Scholar] [CrossRef] [PubMed]
- Hill, G.C.; Remers, W.A. Computer simulation of the binding of saframycin A to d (GATGCATC)2. J. Med. Chem. 1991, 34, 1990–1998. [Google Scholar] [CrossRef] [PubMed]
- Moore, B.M.; Seaman, F.C.; Wheelhouse, R.T.; Hurley, L.H. Mechanism for the catalytic activation of ecteinascidin 743 and its subsequent alkylation of guanine N2. J. Am. Chem. Soc. 1998, 120, 2490–2491. [Google Scholar] [CrossRef]
- Plowright, A.T.; Schaus, S.E.; Myers, A.G. Transcriptional response pathways in a yeast strain sensitive to saframycin A and a more potent analog: Evidence for a common basis of activity. Chem. Biol. 2002, 9, 607–618. [Google Scholar] [CrossRef]
- Xing, C.; LaPorte, J.R.; Barbay, J.K.; Myers, A.G. Identification of GAPDH as a protein target of the saframycin antiproliferative agents. Proc. Natl. Acad. Sci. USA 2004, 101, 5862–5866. [Google Scholar] [CrossRef] [PubMed] [Green Version]
- Brandl, M.B.; Pasquier, E.; Li, F.; Beck, D.; Zhang, S.; Zhao, H.; Kavallaris, M.; Wong, S.T.C. Computational analysis of image-based drug profiling predicts synergistic drug combinations: Applications in triple-negative breast cancer. Mol. Oncol. 2014, 8, 1548–1560. [Google Scholar] [CrossRef]
- Pritchard, J.R.; Bruno, P.M.; Gilbert, L.A.; Capron, K.L.; Lauffenburger, D.A.; Hemann, M.T. Defining principles of combination drug mechanisms of action. Proc. Natl. Acad. Sci. USA 2013, 110, E170–E179. [Google Scholar] [CrossRef]
- Jia, J.; Zhu, F.; Ma, X.; Cao, Z.; Cao, Z.W.; Li, Y.; Li, Y.X.; Chen, Y.Z. Mechanisms of drug combinations: interaction and network perspectives. Nat. Rev. Drug Discov. 2009, 8, 111–128. [Google Scholar] [CrossRef]
- Bonadonna, G.; Zucali, R.; Monfardini, S.; De Lena, M.; Uslenghi, C. Combination chemotherapy of Hodgkin’s disease with adriamycin, bleomycin, vinblastine, and imidazole carboxamide versus MOPP. Cancer 1975, 36, 252–259. [Google Scholar] [CrossRef]
- Miller, M.L.; Molinelli, E.J.; Nair, J.S.; Sheikh, T.; Samy, R.; Jing, X.; He, Q.; Korkut, A.; Crago, A.M.; Singer, S.; et al. Drug synergy screen and network modeling in dedifferentiated liposarcoma identifies CDK4 and IGF1R as synergistic drug targets. Sci. Signal. 2013, 6, 85. [Google Scholar] [CrossRef] [PubMed]
- Jung, K.-A.; Choi, B.-H.; Kwak, M.-K. The c-MET/PI3K signaling is associated with cancer resistance to doxorubicin and photodynamic therapy by elevating BCRP/ABCG2 expression. Mol. Pharmacol. 2015, 87, 465–476. [Google Scholar] [CrossRef] [PubMed]
- Mitra, S.K.; Hanson, D.A.; Schlaepfer, D.D. Focal adhesion kinase: In command and control of cell motility. Nat. Rev. Mol. Cell Biol. 2005, 6, 56–68. [Google Scholar] [CrossRef] [PubMed]
- Knopfová, L.; Biglieri, E.; Volodko, N.; Masařík, M.; Hermanová, M.; Garzón, J.F.G.; Dúcka, M.; Kučírková, T.; Souček, K.; Šmarda, J.; et al. Transcription factor c-Myb inhibits breast cancer lung metastasis by suppression of tumor cell seeding. Oncogene 2018, 37, 1020–1030. [Google Scholar] [CrossRef] [PubMed]
- Liu, Y.; Zhao, H. Predicting synergistic effects between compounds through their structural similarity and effects on transcriptomes. Bioinformatics 2016, 32, 3782–3789. [Google Scholar] [CrossRef] [PubMed] [Green Version]
- Beck, A.; Goetsch, L.; Dumontet, C.; Corvaïa, N. Strategies and challenges for the next generation of antibody-drug conjugates. Nat. Rev. Drug Discov. 2017, 16, 315–337. [Google Scholar] [CrossRef] [PubMed]
- Mayer, L.D.; Janoff, A.S. Optimizing combination chemotherapy by controlling drug ratios. Mol. Interv. 2007, 7, 216–223. [Google Scholar] [CrossRef]
- Mayer, L.D.; Harasym, T.O.; Tardi, P.G.; Harasym, N.L.; Shew, C.R.; Johnstone, S.A.; Ramsay, E.C.; Bally, M.B.; Janoff, A.S. Ratiometric dosing of anticancer drug combinations: controlling drug ratios after systemic administration regulates therapeutic activity in tumor-bearing mice. Mol. Cancer Ther. 2006, 5, 1854–1863. [Google Scholar] [CrossRef] [PubMed]
- Batist, G.; Gelmon, K.A.; Chi, K.N.; Miller, W.H.; Chia, S.K.L.; Mayer, L.D.; Swenson, C.E.; Janoff, A.S.; Louie, A.C. Safety, pharmacokinetics, and efficacy of CPX-1 liposome injection in patients with advanced solid tumors. Clin. Cancer Res. 2009, 15, 692–700. [Google Scholar] [CrossRef]
- Mosmann, T. Rapid colorimetric assay for cellular growth and survival: application to proliferation and cytotoxicity assays. J. Immunol. Methods 1983, 65, 55–63. [Google Scholar] [CrossRef]
- Riccardi, C.; Nicoletti, I. Analysis of apoptosis by propidium iodide staining and flow cytometry. Nat. Protoc. 2006, 1, 1458–1461. [Google Scholar] [CrossRef] [PubMed]
- Trahtemberg, U.; Atallah, M.; Krispin, A.; Verbovetski, I.; Mevorach, D. Calcium, leukocyte cell death and the use of annexin V: Fatal encounters. Apoptosis 2007, 12, 1769–1780. [Google Scholar] [CrossRef] [PubMed]
- Bindea, G.; Mlecnik, B.; Hackl, H.; Charoentong, P.; Tosolini, M.; Kirilovsky, A.; Fridman, W.-H.; Pagès, F.; Trajanoski, Z.; Galon, J. ClueGO: A Cytoscape plug-in to decipher functionally grouped gene ontology and pathway annotation networks. Bioinformatics 2009, 25, 1091–1093. [Google Scholar] [CrossRef]
- Subramanian, A.; Tamayo, P.; Mootha, V.K.; Mukherjee, S.; Ebert, B.L.; Gillette, M.A.; Paulovich, A.; Pomeroy, S.L.; Golub, T.R.; Lander, E.S.; et al. Gene set enrichment analysis: a knowledge-based approach for interpreting genome-wide expression profiles. Proc. Natl. Acad. Sci. USA. 2005, 102, 15545–15550. [Google Scholar] [CrossRef] [PubMed]
- Binns, D.; Dimmer, E.; Huntley, R.; Barrell, D.; O’Donovan, C.; Apweiler, R. QuickGO: A web-based tool for Gene Ontology searching. Bioinformatics 2009, 25, 3045–3046. [Google Scholar] [CrossRef] [PubMed]
- Fabregat, A.; Jupe, S.; Matthews, L.; Sidiropoulos, K.; Gillespie, M.; Garapati, P.; Haw, R.; Jassal, B.; Korninger, F.; May, B.; et al. The Reactome Pathway Knowledgebase. Nucleic Acids Res. 2018, 46, D649–D655. [Google Scholar] [CrossRef] [PubMed]
- Kanehisa, M.; Goto, S. KEGG: kyoto encyclopedia of genes and genomes. Nucleic Acids Res. 2000, 28, 27–30. [Google Scholar] [CrossRef]
- Carbon, S.; Dietze, H.; Lewis, S.E.; Mungall, C.J.; Munoz-Torres, M.C.; Basu, S.; Chisholm, R.L.; Dodson, R.J.; Fey, P.; Thomas, P.D.; et al. Expansion of the gene ontology knowledgebase and resources: The gene ontology consortium. Nucleic Acids Res. 2017, 45, D331–D338. [Google Scholar]
- Ashburner, M.; Ball, C.A.; Blake, J.A.; Botstein, D.; Butler, H.; Cherry, J.M.; Davis, A.P.; Dolinski, K.; Dwight, S.S.; Eppig, J.T.; et al. Gene ontology: Tool for the unification of biology. The Gene Ontology Consortium. Nat. Genet. 2000, 25, 25–29. [Google Scholar] [CrossRef]
- Mi, H.; Huang, X.; Muruganujan, A.; Tang, H.; Mills, C.; Kang, D.; Thomas, P.D. PANTHER version 11: Expanded annotation data from Gene Ontology and Reactome pathways, and data analysis tool enhancements. Nucleic Acids Res. 2017, 45, D183–D189. [Google Scholar] [CrossRef] [PubMed]
- Micallef, L.; Rodgers, P. euler APE: Drawing area-proportional 3-Venn diagrams using ellipses. PLoS ONE 2014, 9. [Google Scholar] [CrossRef] [PubMed]

| Drug Combination | Combination Ratio (nM) | n | CI values at | |||
|---|---|---|---|---|---|---|
| IC50 | IC75 | IC90 | IC95 | |||
| RM + DOX | 1:100 | 5 | 0.956 ± 0.064 | 0.886 ± 0.047 | 0.884 ± 0.111 | 0.917 ± 0.156 |
| RM + DOX | 1:80 | 3 | 1.111 ± 0.093 | 0.913 ± 0.047 | 0.777 ± 0.056 | 0.712 ± 0.085 |
| RM + DOX | 1:60 | 3 | 1.202 ± 0.115 | 1.011 ± 0.075 | 0.877 ± 0.054 | 0.810 ± 0.065 |
| RM + DOX | 1:50 | 5 | 0.806 ± 0.069 | 0.685 ± 0.044 | 0.609 ± 0.036 | 0.575 ± 0.041 |
| RM + DOX | 1:40 | 3 | 0.856 ± 0.041 | 0.691 ± 0.048 | 0.580 ± 0.061 | 0.524 ± 0.071 |
| RM + DOX | 1:20 | 3 | 1.160 ± 0.075 | 0.942 ± 0.047 | 0.780 ± 0.033 | 0.692 ± 0.032 |
| RM → DOX | 1:100 | 6 | 2.372 ± 0.220 | 1.601 ± 0.156 | 1.105 ± 0.121 | 0.870 ± 0.105 |
| RM → DOX | 1:20 | 4 | 1.414 ± 0.094 | 1.173 ± 0.087 | 1.004 ± 0.132 | 0.918 ± 0.162 |
| DOX → RM | 100:1 | 5 | 1.622 ± 0.221 | 1.545 ± 0.209 | 1.557 ± 0.311 | 1.620 ± 0.427 |
| DOX → RM | 20:1 | 3 | 2.543 ± 0.429 | 2.273 ± 0.288 | 2.074 ± 0.263 | 1.974 ± 0.319 |
© 2019 by the authors. Licensee MDPI, Basel, Switzerland. This article is an open access article distributed under the terms and conditions of the Creative Commons Attribution (CC BY) license (http://creativecommons.org/licenses/by/4.0/).
Share and Cite
Tun, J.O.; Salvador-Reyes, L.A.; Velarde, M.C.; Saito, N.; Suwanborirux, K.; Concepcion, G.P. Synergistic Cytotoxicity of Renieramycin M and Doxorubicin in MCF-7 Breast Cancer Cells. Mar. Drugs 2019, 17, 536. https://doi.org/10.3390/md17090536
Tun JO, Salvador-Reyes LA, Velarde MC, Saito N, Suwanborirux K, Concepcion GP. Synergistic Cytotoxicity of Renieramycin M and Doxorubicin in MCF-7 Breast Cancer Cells. Marine Drugs. 2019; 17(9):536. https://doi.org/10.3390/md17090536
Chicago/Turabian StyleTun, Jortan O., Lilibeth A. Salvador-Reyes, Michael C. Velarde, Naoki Saito, Khanit Suwanborirux, and Gisela P. Concepcion. 2019. "Synergistic Cytotoxicity of Renieramycin M and Doxorubicin in MCF-7 Breast Cancer Cells" Marine Drugs 17, no. 9: 536. https://doi.org/10.3390/md17090536