Twenty-Nine New Limonoids with Skeletal Diversity from the Mangrove Plant, Xylocarpus moluccensis


1
Marine Drugs Research Center, College of Pharmacy, Jinan University, 601 Huangpu Avenue West, Guangzhou 510632, China
2
School of Pharmaceutical Sciences, Southern Medical University, 1838 Guangzhou Avenue North, Guangzhou 510515, China
*
Authors to whom correspondence should be addressed.
†
These authors contributed equally.
Mar. Drugs 2018, 16(1), 38; https://doi.org/10.3390/md16010038
Submission received: 11 December 2017
/
Revised: 10 January 2018
/
Accepted: 17 January 2018
/
Published: 19 January 2018
(This article belongs to the Special Issue Bioactive Compounds from Mangroves and Their-Associated Microbes)
Abstract
:Twenty-nine new limonoids—named xylomolins A1–A7, B1–B2, C1–C2, D–F, G1–G5, H–I, J1–J2, K1–K2, L1–L2, and M–N, were isolated from the seeds of the mangrove plant, Xylocarpus moluccensis. Compounds 1–13 are mexicanolides with one double bond or two conjugated double bonds, while 14 belongs to a small group of mexicanolides with an oxygen bridge between C1 and C8. Compounds 15–19 are khayanolides containing a Δ8,14 double bond, whereas 20 and 21 are rare khayanolides containing a Δ14,15 double bond and Δ8,9, Δ14,15 conjugated double bonds, respectively. Compounds 22 and 23 are unusual limonoids possessing a (Z)-bicyclo[5.2.1]dec-3-en-8-one motif, while 24 and 25 are 30-ketophragmalins with Δ8,9, Δ14,15 conjugated double bonds. Compounds 26 and 27 are phragmalin 8,9,30-ortho esters, whereas 28 and 29 are azadirone and andirobin derivatives, respectively. The structures of these compounds, including absolute configurations of 15–19, 21–23, and 26, were established by HRESIMS, extensive 1D and 2D NMR investigations, and the comparison of experimental electronic circular dichroism (ECD) spectra. The absolute configuration of 1 was unequivocally established by single-crystal X-ray diffraction analysis, obtained with Cu Kα radiation. The diverse cyclization patterns of 1–29 reveal the strong flexibility of skeletal plasticity in the limonoid biosynthesis of X. moluccensis. Compound 23 exhibited weak antitumor activity against human triple-negative breast MD-MBA-231 cancer cells with an IC50 value of 37.7 μM. Anti-HIV activities of 1, 3, 8, 10, 11, 14, 20, 23–25, and 27 were tested in vitro. However, no compounds showed potent inhibitory activity.
Keywords:
mangrove; Xylocarpus moluccensis; limonoid; xylomolins; skeletal diversity; antitumor; anti-HIV1. Introduction
Limonoids are highly oxidized tetranortriterpenoids from a biosynthetic precursor with a 4,4,8-trimethyl-17-furanylsteroid skeleton. This group of natural products has attracted considerable attention because of its abundance, fascinating structural diversity, and various biological activities [1,2,3,4]. Xylocarpus is a well-known genus of mangrove plants which has been found to produce various types of limonoids with a broad range of bioactivities, such as insect antifeedant, antitumor, neuroprotective, gastroprotective, and antidepressant-like activities [5,6,7,8,9,10,11]. X. moluccensis, a true mangrove tree, is mainly distributed in Bangladesh, India, Indochina, Malesia, and tropical Australia. Previous chemical investigations of X. moluccensis resulted in the isolation of more than 100 limonoids with diverse carbon skeletons, such as mexicanolide, phragmalin, gedunin, andirobin, and khayanolide compounds [12,13,14,15,16,17,18]. Limonoids with diverse skeletons from X. moluccensis revealed structural plasticity in the limonoid biosynthesis of this mangrove species. This inference drove us to obtain and identify more novel and bioactive limonoids from this mangrove plant.
Further investigation of the seeds of X. moluccensis afforded fourteen mexicanolides (1–14), seven khayanolides (15–21), two unusual limonoids with a (Z)-bicyclo[5.2.1]dec-3-en-8-one substructure (22, 23), two 30-ketophragmalins (24, 25), two phragmalin 8,9,30-ortho esters (26, 27), an azadirone derivative (28), and an andirobin derivative (29) (Figure 1). Herein, we report the isolation, structural identification, antitumor, and anti-HIV activities of these new limonoids.
2. Results and Discussion
In this paper, 16 compounds (viz. 1, 3–6, 8, 9, 12–14, 20, 21, 24, 26, 27, and 29) were obtained from seeds of the Thai X. moluccensis, whereas 13 compounds (viz. 2, 7, 10, 11, 15–19, 22, 23, 25, and 28) were isolated from those of the Indian X. moluccensis.
Compound 1 was obtained as a colorless crystal. The molecular formula of 1 was established from the positive HRESIMS ion peak at m/z 615.2785 (calcd. for [M + H]+, 615.2800) to be C33H42O11, implying thirteen degrees of unsaturation. According to the 1H and 13C NMR spectroscopic data (Table 1 and Table 2), five elements of unsaturation were due to four ester groups, a keto carbonyl function, and three carbon-carbon double bonds; thus, the molecule was pentacyclic. The 1H and 13C NMR spectroscopic data (Table 1 and Table 2) showed the presence of a β-substituted furan ring [δH 7.52 br d (J = 0.8 Hz H-21), 6.45 br d (J = 1.2 Hz H-22), 7.44 t (J = 1.6 Hz H-23)], four tertiary methyl groups (δH 1.27 s H3-19, 1.04 s H3-29, 1.05 s H3-18, 0.84 s H3-28), a methoxy (δH 3.73 s H3-31), and a keto function (δC 216.7 qC), indicating a mexicanolide-type limonoid for 1.
The NMR spectroscopic data of 1 (Table 1 and Table 2) were similar to those of khayalenoid H [19], except for the replacement of the 3-O-acetyl group in khayalenoid H by an isobutyryloxy group [δH 2.64 m 1H, 1.22 d (J = 7.2 Hz 3H), 1.24 d (J = 7.2 Hz 3H); δC 175.9 qC, 34.5 CH, 19.9 CH3, 18.4 CH3] in 1. The presence of the isobutyryloxy group was corroborated by 1H-1H COSY correlations between H3-34/H-33 and H3-35/H-33. The significant HMBC correlation from H-3 (δH 4.97 s) to the carbonyl carbon (δC 175.9 qC) of the isobutyryloxy group placed it at C-3 (Figure 2a).
The relative configuration of 1 was established by diagnostic NOE interactions (Figure 2b). Those between H-17/H-11β, H-17/H-12β, H-17/H-5, and H-5/H3-28 revealed their cofacial relationship, and were arbitrarily assigned as the β-oriented H-17 and H-5. NOE interactions between H-9/H-12α, H-9/H3-19, H3-18/H-12α, H-3/H3-29, and 2-OH/H3-29 assigned the α-orientation for H-9, H3-18, H3-19, H-3, and 2-OH.
In order to establish the absolute configuration of 1, single-crystal X-ray diffraction analysis with Cu Kα radiation (Flack parameter of −0.06 (10), Flack x of −0.14 (11), and Hooft y of −0.04 (3); suitable crystals of 1 were obtained from acetone/methanol (1:2) at room temperature) was employed, which unequivocally assigned the absolute configuration of 1 as 2R,3S,5S,6R,9S,10R,13R,17R. The computer-generated perspective drawing of the X-ray structure of 1 is shown in Figure 3. Therefore, the absolute configuration of 1 named xylomolin A1 was assigned as shown (Figure 2a).
Compound 2 was obtained as an amorphous white powder. The molecular formula was determined to be C30H38O10 by the negative HRESIMS ion peak at m/z 593.2143 (calcd. for [M + Cl]−, 593.2159). The NMR spectroscopic data of 2 resembled those of 1 (Table 1 and Table 2), except for the replacement of the 3-O-isobutyryl moiety and the 6-O-acetyl group in 1 by a 3-O-propionyl moiety (δH 2.45 m 1H, 2.43 m 1H, 1.20 t (J = 7.6 Hz 3H); δC 173.3 qC, 28.0 CH2, 9.4 CH3) and a 6-OH group in 2, respectively. The presence of a 3-O-propionyl moiety was confirmed by 1H-1H COSY correlations between H3-34/H2-33 and HMBC cross-peaks between H3-34/C-33, H3-34/C-32, H2-33/C-32, and H-3/C-32. The relative configuration of 2 (except for that of C-6) was determined to be the same as that of 1 by NOE interactions between H-17/H-15β, H-15β/H-30β, H-17/H-12β, H-17/H-11β, H-11β/H-5, H-17/H-5, and H-5/H3-28, and those between H-9/H3-19, H3-19/H3-29, H3-29/H-3, and H3-18/H-15α. Thus, the structure of 2—named xylomolin A2—was assigned as shown in Figure 1.
Compound 3 gave the molecular formula C32H42O11 as established by the HRESIMS ion peak at m/z 625.2620 (calcd. for [M + Na]+, 625.2619). The NMR spectroscopic data of 3 (Table 1 and Table 2) were similar to those of moluccensin S [20], except for the presence of an additional 30-OH group, which was supported by the downshifted C-30 signal (δC 73.0 CH in 3, whereas δC 44.6 CH2 in moluccensin S) and HMBC correlations from the proton of 30-OH to C-30, C-2, and C-8. NOE interactions between H-17/H-12β, H-17/H-11β, H-5/H-12β, H-5/H-17, H-5/H3-28, and H-5/H-30 revealed the β-orientation for H-5, H-17, H-30, and H3-28, and the corresponding 30α-OH. Similarly, those between H-3/2-OH, H3-29/2-OH, H-9/H3-19, H3-29/H3-19, and H3-18/H-11α assigned the α-orientation for H-3, H-9, H3-18, H3-19, H3-29, and 2-OH. Thus, the structure of 3—named xylomolin A3—was determined to be 30α-hydroxy-moluccensin S.
Compound 4 provided the molecular formula of C34H44O13 as determined from the positive HRESIMS ion peak at m/z 683.2675 (calcd. for [M + Na]+, 683.2674). The 1H and 13C NMR spectroscopic data of 4 resembled those of 3 (Table 1 and Table 2), the difference being the presence of a 15-OH function (δH 3.66 br s) and a 6-acetoxy group (δH 2.18 s 3H; δC 169.8 qC, 21.0 CH3) in 4. The existence of a 15-OH function was corroborated by the downshifted C-15 signal (δC 65.4 CH in 4, whereas δC 32.8 CH2 in 3) and HMBC correlations from the proton of 15-OH to C-14, C-15, and C-16. The HMBC correlation from H-6 to the carbonyl carbon (C-37) of the acetoxy group placed it at C-6. The relative configuration of 4 (except that of C-15) was assigned as the same as that of 3 on the basis of NOE interactions. Those between H-17/H-15 and H-5/H-30 assigned the β-oriented H-15 and H-30, and the corresponding 15α-OH group. Consequently, the structure of 4—named xylomolin A4—was identified as 15α-hydroxy-6-acetoxy-xylomolin A3.
The molecular formula of 5 was determined to be C31H38O12 by the positive HRESIMS ion peak at m/z 625.2252 (calcd. for [M + Na]+, 625.2255). The 1H and 13C NMR spectroscopic data of 5 (Table 1 and Table 2) were closely related to those of khayalenoid H, the difference being the existence of a 30-OH function, which was supported by the downshifted C-30 signal (δC 72.9 CH in 5, whereas δC 44.4 CH2 in khayalenoid H). HMBC correlations from the proton of 30-OH (δH 2.67 br s) to C-30 and C-8 demonstrated the above deduction. The NOE interaction between H-5/H-30 assigned the β-oriented H-30 and the corresponding 30α-OH. Thus, the structure of 5—named xylomolin A5—was assigned as 30α-hydroxy-khayalenoid H.
Compound 6 was isolated as a white and amorphous powder. Its molecular formula was determined to be C31H38O11 from the positive HRESIMS ion peak at m/z 609.2311 (calcd. for [M + Na]+, 609.2306). The 1H and 13C NMR spectroscopic data of 6 (Table 1 and Table 2) closely resembled those of khayalenoid H [19], except for the replacement of the 2-OH function and the 6-O-acetyl group in khayalenoid H by a 2-O-acetyl (δH 2.13 s 3H; δC 169.1 qC, 21.8 CH3) and a 6-OH group (δH 2.80 br s) in 6, respectively. HMBC correlations from the proton of the 6-OH group to C-5, C-6,and C-7 placed it at C-6. The presence of the 2-O-acetyl group in 6 was corroborated by the downshifted C-2 in 6 (δC 86.5 qC in 6, whereas δC 77.9 qC in khayalenoid H). HMBC correlations from H2-30 and H-3 to C-2 confirmed the above deduction. The relative configuration of 6 was determined to be the same as that of khayalenoid H based on diagnostic NOE interactions between H-17/H-15β, H-17/H-12β, H-17/H-5, and H-5/H3-28 and those between H-9/H3-19, H3-19/H3-29, and H3-18/H-15α. Therefore, the structure of 6—named xylomolin A6—was determined to be 2-O-acetyl-6-O-deacetyl-khayalenoid H.
The molecular formula of 7 was determined to be C31H38O10 by the positive HRESIMS ion peak at m/z 593.2358 (calcd. for [M + Na]+, 593.2357). The 1H and 13C NMR spectroscopic data of 7 (Table 1 and Table 2) were closely related to those of 6, except for the absence of the 6-OH group, which was corroborated by the upshifted CH2-6 signal (δH 2.32 dd (J = 16.5, 1.6 Hz), 2.42 dd (J = 16.5, 10.7 Hz), δC 33.3) in 7. 1H-1H COSY correlations between H2-6/H-5 and HMBC cross-peaks from H2-6 and C-5 and C-7 confirmed the above result. The analysis of diagnostic NOE interactions revealed that 7 possessed the same relative configuration as that of 6. Therefore, the structure of 7—named xylomolin A7—was assigned as 6-dehydroxy-xylomolin A6.
Compound 8 was isolated as a white and amorphous powder. It had a molecular formula of C31H36O11 as deduced from the positive HRESIMS ion peak at m/z 607.2151 (calcd. for [M + Na]+, 607.2150). The 1H and 13C NMR spectroscopic data of 8 (Table 3 and Table 4) were similar to those of heytrijunolide E [21] with Δ8,9 and Δ14,15 conjugated double bonds, except for the absence of the 15-OH group and the presence of an acetoxy group at C-3 in 8. The absence of the 15-OH group was confirmed by the upshifted C-15 signal (δC 111.6 qC in 8, whereas δC 134.7 qC in heytrijunolide E) and HMBC correlations between H-15/C-14, H-15/C-16, H-15/C-8, and H-15/C-13. The HMBC correlation from H-3 (δH 5.51 s) to the carbonyl carbon (δC 170.2 qC) of the acetoxy group placed it at C-3. The relative configuration of 8 was established to be the same as that of heytrijunolide E based on diagnostic NOE interactions between H3-28/H-5, H-5/H-11β, H-12β/H-17, H3-29/H-3, H-12α/H3-18, and H-11α/H3-19. Therefore, the structure of 8—named xylomolin B1—was assigned as 15-dehydroxy-3β-acetoxy-heytrijunolide E.
Compound 9 provided the molecular formula C29H34O9 as established by the positive HRESIMS ion peak at m/z 527.2273 (calcd. for [M + H]+, 527.2276). The 1H and 13C NMR spectroscopic data of 9 (Table 3 and Table 4) were similar to those of heytrijunolide E [21], the difference being the absence of the 2-OH and 15-OH groups in 9, which was corroborated by the upshifted C-15 (δC 110.6 CH in 9, whereas δC 134.7 qC in heytrijunolide E) and C-2 (δC 50.5 CH in 9, whereas δC 78.2 qC in heytrijunolide E) signals. A proton (δH 3.02 t (J = 6.0 Hz)) exhibiting 1H-1H COSY correlations to H-3 and H-30 and HMBC cross-peaks to C-1, C-3, C-4, and C-30 was assigned as H-2. The existence of H-15 (δH 5.89 s) was further confirmed by its HMBC correlations to C-8, C-13, C-14, and C-16. The relative configuration of 9 was determined to be the same as that of heytrijunolide E based on diagnostic NOE interactions between H3-28/H-5, H-5/H-11β, H-12β/H-17, H3-29/H-3, H-12α/H3-18, and H-11α/H3-19. Thus, the structure of 9—named xylomolin B2—was assigned as 2,15-dedihydroxy-heytrijunolide E.
Compound 10 had a molecular formula of C29H34O10 as determined from the positive HRESIMS ion peak at m/z 543.2238 (calcd. for [M + H]+, 543.2230). The NMR data of 10 (Table 3 and Table 4) closely resembled those of moluccensin U [20], except for the replacement of the 3-O-(2-methyl)butyryl group in moluccensin U by an acetoxy group (δH 2.22 s 3H; δC 169.9 qC, 20.7 CH3) in 10. The significant HMBC cross-peak from H-3 (δH 4.83 s) to the carbonyl carbon of the above acetoxy group placed it at C-3. NOE interactions between H-11β/H-17, H-12β/H-17, H-11β/H-5, H-5/H3-28, H-9/H3-18, H-9/H3-19, and H3-29/H-3 revealed the same relative configuration of 10 as that of moluccensin U. Therefore, the structure of 10—named xylomolin C1—was assigned as 3-O-acetyl-3-de(2-methyl) butyryloxy-moluccensin U.
Compound 11 afforded the molecular formula C32H40O9 as established by the positive HRESIMS ion peak at m/z 591.2570 (calcd. for [M + Na]+, 591.2565). The 1H and 13C NMR spectroscopic data of 11 (Table 3 and Table 4) closely resembled those of swietmanin G [22], the difference being the replacement of the 3-isobutyryloxy group in swietmanin G by a 2-methylbutyryloxy group (δH 2.57 m 1H, 1.61 m 1H, 1.81 m 1H, 1.04 t (J = 7.2 Hz 3H), 1.25 d (J = 6.8 Hz 3H); δC 176.0 qC, 41.4 CH, 26.9 CH2, 11.9 CH3, 17.0 CH3) in 11. The deduction was confirmed by 1H-1H COSY correlations between H3-36/H-33, H3-35/H2-34, and H2-34/H-33, and HMBC correlations between H-3/C-32, H3-35/C-34, H3-35/C-33, H3-36/C-33, H3-36/C-32, and H3-36/C-34. NOE interactions between H-12β/H-17, H-17/H-11β, H-5/H-11β, H-5/H3-28, H-9/H3-18, H-9/H3-19, and H3-29/H-3 assigned the α-orientation for H-9, H3-18, H3-19, and H-3. Thus, the structure of 11—named xylomolin C2—was assigned as 3-O-(2-methyl)butyryl-3-deisobutyryloxy-swietmanin G.
Compound 12 had the molecular formula C32H42O11 as determined from the positive HRESIMS ion peak at m/z 625.2612 (calcd. for [M + Na]+, 625.2619). The 1H and 13C NMR spectroscopic data of 12 (Table 3 and Table 4) were similar to those of moluccensin U [20], except for the absence of the Δ8,30 double bond and the presence of an 8-OH group. This finding was verified by the upshifted C-8 (δC 71.3 qC) and C-30 (δC 45.9 CH2) signals as compared with those (δC 134.5 qC and 133.6 CH) of moluccensin U, respectively. The presence of the 8-OH group was confirmed by HMBC correlations from its proton to C-8, C-9, and C-30. NOE interactions between 8-OH/H-9 and 8-OH/H3-18 assigned the α-orientation for the 8-OH group. The relative configuration of 12 (except that of C-8) was established to be identical to that of moluccensin U based on diagnostic NOE interactions between H-12β/H-17, H-5/H3-28, H-9/H3-19, and H3-29/H-3. Thus, the structure of 12—named xylomolin D—was assigned as 8,30-dihydrogen-8α-hydroxy-moluccensin U.
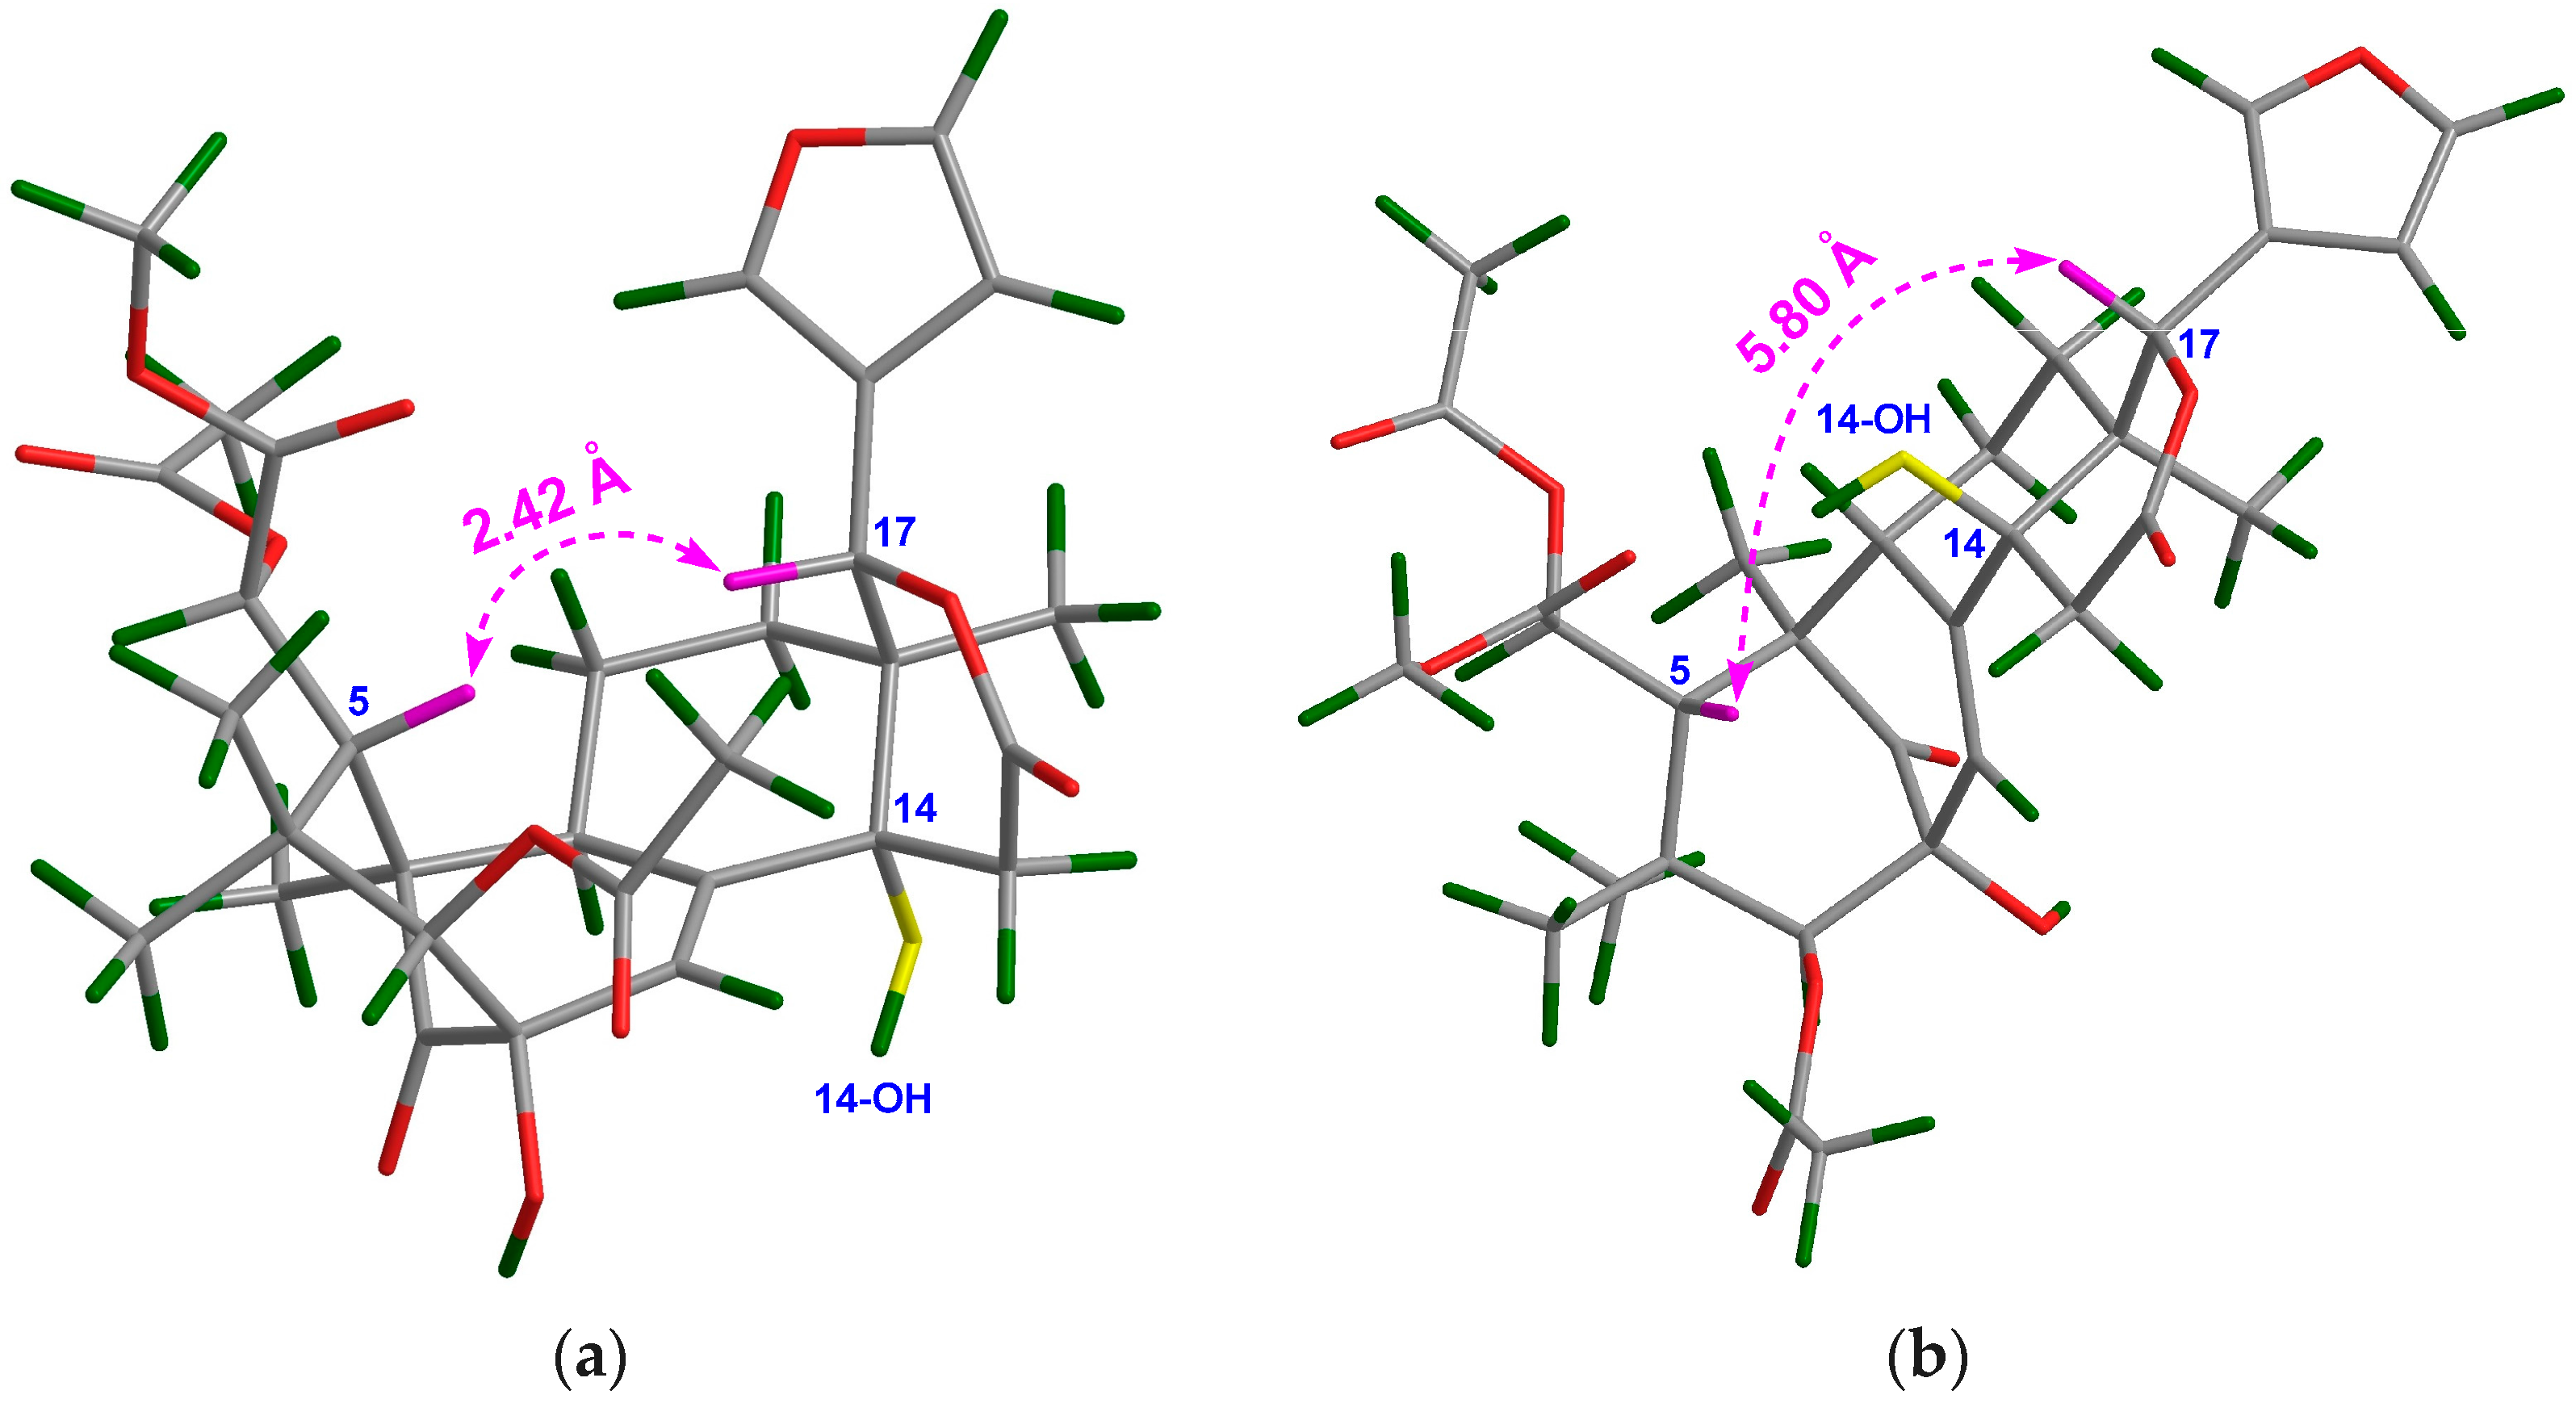
Compound 13 was obtained as an amorphous white power. The molecular formula was determined to be C31H38O12 by the positive HRESIMS ion peak at m/z 625.2250 (calcd. for [M + Na]+, 625.2255). The 1H and 13C NMR spectroscopic data of 13 (Table 3 and Table 4) were similar to those of 8, except for the replacement of Δ8,9 and Δ14,15 conjugated double bonds in 8 by a Δ8,30 double bond (δC 138.8 qC C-8, 130.2 CH C-30) in 13, and the presence of an additional 14-OH group. HMBC correlations between H2-15/C-14, H2-15/C-16, H2-15/C-13, H-30/C-14, H-30/C-9, and H-9/C-8 demonstrated the above deduction. In order to establish the relative configuration of the 14-OH group in 13, two possible 3D structures with a 14α-OH and 14β-OH groups, respectively, were simulated by using the ChemBio3D software (Figure 4). When the 14-OH group occupies α-orientation, the space distance between H-5/H-17 is around 2.4 Å (Figure 4a), implying the presence of a strong NOE interaction between these protons. On the contrary, when the 14-OH group occupies the β-orientation, the space distance between H-5/H-17 is around 5.8 Å (Figure 4b), indicating the absence of a NOE interaction between these protons. Quite evidently, the NOE interaction between H-5/H-17 could be utilized as an effective criterion to resolve the relative configuration of the 14-OH group. Thus, the orientation of the 14-OH group in 13 was assigned as α based on the strong NOE interaction between H-5/H-17. Furthermore, the relative configuration of the whole molecule of 13 (except that of C-14) was determined to be the same as that of 8 on the basis of NOE interactions between H3-28/H-5, H-5/H-11β, H-12β/H-17, H3-29/H-3, H-12α/H3-18, and H-11α/H3-19. Thus, the structure of 13—named xylomolin E—was assigned as depicted.
Compounds 2–13 are analogues of 1. From the point of view of biogenetic origins, these mexicanolides should possess the same absolute configurations of carbon skeletons as that of 1. The absolute sterostructures of 2–13 are shown as in Figure 1.
The molecular formula of 14 was determined to be C33H42O13 by the positive HRESIMS ion peak at m/z 669.2521 (calcd. for [M + Na]+, 669.2518). The NMR spectroscopic data of 14 (Table 3 and Table 4) were similar to those of xylorumphiin H [23], being a mexicanolide containing a C1-O-C8 bridge, except for the presence of an additional Δ14,15 double bond (δH 6.08 s 1H; δC 158.3 qC, 118.4 CH) and an additional 6-OH function (δH 2.93 s) in 14. The existence of the Δ14,15 double bond was corroborated by HMBC correlations between H3-18/C-14, H-15/C-8, and H-15/C-16. The downshifted C-6 signal (δC 71.7 CH in 14, whereas δC 32.3 CH2 in xylorumphiin H), along with HMBC cross-peaks from H-6 to C-5 and C-7, supported the location of a hydroxy group at C-6. Similar NOE interactions of 14 as those of xylorumphiin H suggested that both mexicanolides possessed the same relative configuration. Thus, the structure of 14—named xylomolin F—was assigned as 6-hydroxy-14,15-dedihydrogen-xylorumphiin H.
The molecular formula of 15 was established by the positive HRESIMS ion peak at m/z 587.2494 (calcd. for [M + H]+, 587.2492) to be C31H38O11, implying thirteen degrees of unsaturation. According to the NMR spectroscopic data of 15 (Table 5 and Table 6), seven elements of unsaturation were due to three carbon-carbon double bonds, one carbonyl group, and three ester functionalities; thus, 15 should be hexacyclic. The NMR spectroscopic data of 15 resembled those of thaixylomolin L [18], being a khayanolide isolated from seeds of the Thai X. moluccensis, except for the presence of an additional 6-OH group in 15. Strong 3J HMBC correlations from H2-29 to C-30 further confirmed a khayanolide for 15 instead of a phragmalin, which should exhibit weak 4J HMBC correlations between H2-29/C-30. HMBC cross-peaks from an active proton (δH 2.91 d (J = 3.4 Hz)) to C-5 (δC 45.4, CH), C-6 (δC 72.0, CH), and C-7 (δC 175.3, qC) (Figure 5a) revealed the existence of a 6-OH group in 15.
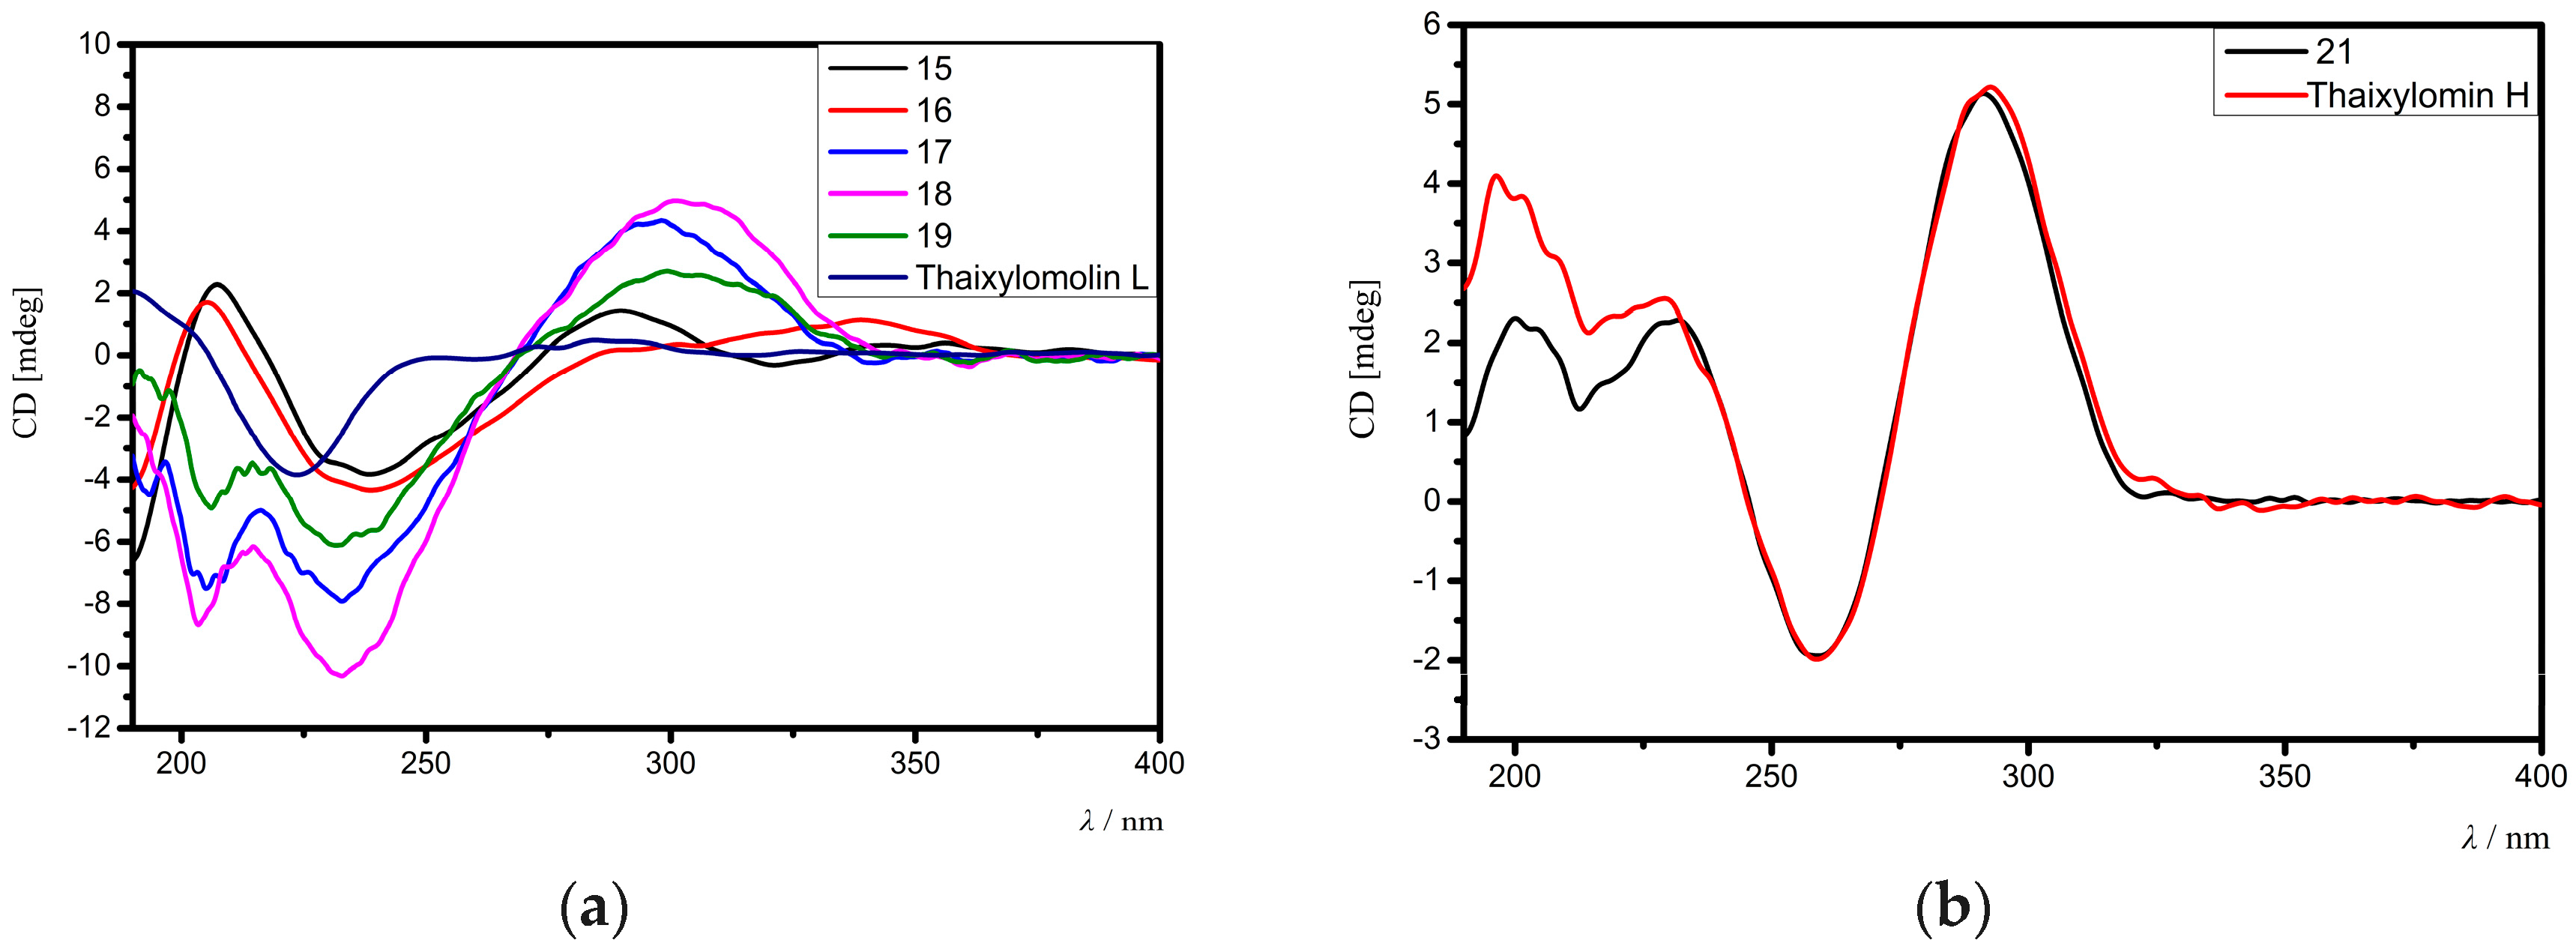
The relative configuration of 15 was assigned by analysis of NOE interactions (Figure 5b). Those between H-17/H-12β, H-17/H-15β, H-17/H-11β, and H-11β/H-5 revealed their cofacial relationship and were assigned as β-oriented. In turn, NOE interactions between H3-18/H-15α, H-9/H3-19, H3-19/1-OH, and H-34/Hpro-R-29 indicated the α-orientation for H-9, H3-18, H3-19, 1-OH, and 30-OEt. The NOE interaction between H-3/Hpro-R-29 established the 3α-H and the corresponding 3β-acetoxy function. Therefore, the relative configuration of 15 was determined. Comparison of the electronic circular dichroism (ECD) spectrum of 15 with that of thaixylomolin L [18] showed that 15 had the same 1R,3S,4R,5S,9R,10S,13R,17R,30S-absolute configuration as that of thaixylomolin L (Figure 6a). Thus, the structure of 15—named xylomolin G1—was assigned as depicted.
Compound 16 had a molecular formula of C33H42O11 as determined from the positive HRESIMS ion peak at m/z 615.2809 (calcd. for [M + H]+, 615.2805). The NMR spectroscopic data of 16 (Table 5 and Table 6) were closely related to those of 15, the difference being the replacement of 3-acetoxy group in 15 by an isobutyryloxy group (δH 2.57 m, 1.20 d (J = 7.2 Hz), 1.22 d (J = 7.2 Hz); δC 176.0 qC, 33.8 CH, 19.0 CH3, 19.1 CH3) in 16. The presence of the above isobutyryloxy group was further supported by 1H-1H COSY correlations between H3-34/H-33 and H3-35/H-33, and HMBC correlations between H-33/C-32, H3-34/C-32, and H3-35/C-32. The significant HMBC cross-peak from H-3 to the carbonyl carbon (C-32) of the isobutyryloxy group confirmed its location at C-3. NOE interactions between H-17/H-12β, H-17/H-15β, H-17/H-11β, H-11β/H-5, H-17/H-5, H-5/H3-28, H-3/Hpro-R-29, H-15α/H3-18, H3-18/H-9, H-9/H3-19, and 1-OH/H-9 indicated the same relative configuration of 16 as that of 15. Comparison of the ECD spectrum of 16 with that of thaixylomolin L concluded that 16 had the same 1R,3S,4R,5S,9R,10S,13R,17R,30S-absolute configuration as that of thaixylomolin L (Figure 6a). Thus, the structure of 16—named xylomolin G2—was assigned as 3-O-isobutyryl-3-deacetoxy-xylomolin G1.
Compound 17 was isolated as an amorphous yellow solid. Its molecular formula was determined to be C29H34O10 by the positive HRESIMS ion peak at m/z 543.2246 (calcd. for [M + H]+, 543.2230). The similarities between the NMR spectroscopic data of 17 (Table 5 and Table 6) and 15 revealed their close structural resemblance, except for the absence of the ethoxyl group at C-30, which was confirmed by the upshifted C-30 signal (δC 63.0 CH in 17, whereas δC 92.2 qC in 15) and HMBC cross-peaks between H-30/C-1, H-30/C-2, H-30/C-8, and H-30/C-10. The relative configuration of 17 was determined to be identical to that of 15 by analysis of NOE interactions. Comparison of ECD spectra of 17 and 15 concluded that both compounds had the same 1R,3S,4R,5S,9R,10S,13R,17R,30S-absolute configuration (Figure 6a). Thus, the structure of 17—named xylomolin G3—was assigned as 30-deethoxyl-xylomolin G1.
Compound 18 provided the molecular formula C31H38O9 as established by the positive HRESIMS ion peak at m/z 555.2593 (calcd. for [M + H]+, 555.2594). The NMR spectroscopic data of 18 (Table 5 and Table 6) were similar to those of 15, the difference being the absence of the 30-ethoxyl group and the 6-OH function in 18. The upshifted C-30 (δC 63.4 CH in 18, whereas δC 92.2 qC in 15) and C-6 (δC 34.2 CH2 in 18, whereas δC 72.1 CH in 15) signals and HMBC cross-peaks between H-30/C-1, H-30/C-2, H-30/C-8, H-30/C-10, H-6/C-5, and H-6/C-7 supported the above deduction. The relative and absolute configurations of 18 were determined to be the same as that of 15 by analysis of their NOE interactions and ECD spectra (Figure 6a). Thus, the structure of 18—named xylomolin G4—was concluded to be 30-deethoxyl-6-dehydroxy-xylomolin G1.
Compound 19 gave the molecular formula C32H40O9 as determined from the positive HRESIMS ion peak at m/z 569.2753 (calcd. for [M + H]+, 569.2751). The NMR data of 19 (Table 5 and Table 6) were closely related to those of 18, except for the replacement of the 3-isobutyryloxy group in 18 by a 2-methylbutyryloxy group (δH 2.47 m 1H, 1.73 m 1H, 1.52 m 1H, 0.94 t (J = 7.2 Hz 3H), 1.19 d (J = 7.2 Hz 3H); δC 176.0 qC, 40.8 CH, 26.7 CH2, 11.5 CH3, 16.5 CH3) in 19. The presence of the 2-methylbutyryloxy group was supported by the 1H-1H COSY correlations between H-33/H-34, H-33/H3-36, and H-34/H3-35 and HMBC cross-peaks between H-33/C-32, H2-34/C-32, H3-36/C-32, H3-36/C-34, and H3-35/C-33. The significant HMBC cross-peak from H-3 to the carbonyl carbon (C-32) of the above 2-methylbutyryloxy group assigned its location at C-3. The relative and absolute configurations of 19 were determined to be the same as those of 18 by analysis of their NOE interactions and ECD spectra (Figure 6a). Thus, the structure of 19—named xylomolin G5—was assigned as 3-O-(2-methyl)butyryl-3-deisobutyryloxy-xylomolin G4.
Compound 20 was isolated as an amorphous white powder. Its molecular formula was determined to be C33H40O13 by the positive HRESIMS ion peak at m/z 667.2359 (calcd. for [M + Na]+, 667.2361). The NMR spectroscopic data of 20 (Table 5 and Table 6) resembled those of 15, except for the presence of an additional 8-OH group (δH 5.00 s) and the replacement of the Δ8,14 double bond, 1-OH function, and 30-ethoxyl group in 15 by a Δ14,15 double bond (δH 5.72 br s H-15; δC 160.0 qC C-14, 120.2 CH C-15), a 1-O-isobutyryl moiety (δH 2.55 m H-35, 1.11 d (J = 7.2 Hz H3-36), 1.10 d (J = 7.2 Hz H3-37); δC 176.0 qC C-34, 35.1 CH C-35, 19.4 CH3 C-36, 19.3 CH3 C-37), and a 30-OH group (δH 4.87 s) in 20, respectively (Table 5 and Table 6, recorded in CDCl3). HMBC correlations between H-15/C-14, H-15/C-16, H-15/C-13, H-15/C-8, 8-OH/C-8, and 30-OH/C-30 confirmed the presence of a Δ14,15 double bond and the existence of two hydroxy groups at C-8 and C-30, respectively. The presence of the isobutyryloxy group was supported by 1H-1H COSY cross-peaks between H-35/H3-36 and H-35/H3-37 and HMBC correlations between H-35/C-34, H3-36/C-34, and H3-37/C-34. Its location at C-1 was corroborated by the downshifted C-1 signal (δC 92.6 qC in 20, whereas δC 84.5 qC in 15). The relative configuration of 20 was established by NOE interactions, in which those between H-17/H-12β, H-12β/H-5, H-5/H3-28 assigned the β-orientation for H-17, H-5, H3-28, whereas those between H-11α/H3-18, H3-18/8-OH, 8-OH/H-9, Hpro-R-29/H-3, H-9/H3-19, and H-3/30-OH concluded the α-orientation for H3-18, 8-OH, H-9, H-3, H3-19, and 30-OH. Thus, the structure of 20—named xylomolin H—was assigned as depicted.
Compound 21 afforded the molecular formula C32H38O11 as deduced from the positive HRESIMS ion peak at m/z 621.2304 (calcd. for [M + Na]+, 621.2306). The NMR spectroscopic data of 21 (Table 5 and Table 6) were similar to those of thaixylomolin H [18], except for the presence of an additional 6-OH group (δH 3.19 s) and the replacement of the 2-acetoxy group by a 2-methylbutyryloxy moiety (δH 2.42 m 1H, 1.73 m 1H, 1.48 m 1H, 0.97 t (J = 7.6 Hz 3H), 1.22 d (J = 7.2 Hz 3H); δC 176.0 qC, 41.3 CH, 26.5 CH2, 11.7 CH3, 17.2 CH3) in 21. The presence of the 6-OH group was supported by the downshifted C-6 signal (δC 71.0 CH in 21, whereas δC 31.6 CH2 in thaixylomolin H), the 1H-1H COSY cross-peak between H-5/H-6, and HMBC correlations between H-6/C-5 and H-6/C-7. The existence of the 2-methylbutyryloxy group was corroborated by 1H-1H COSY cross-peaks between H-33/H3-36, H-33/H-34, and H2-34/H3-35 and HMBC correlations between H-33/C-32, H-34/C-32, H3-36/C-32, H-33/C-34, H3-36/C-34, H3-35/C-34, H-34/C-33, H3-35/C-33, and H3-36/C-33. The significant HMBC correlation from H-2 to the carbonyl carbon (C-32) of the 2-methylbutyryloxy group placed it at C-2. NOE interactions between H-17/H-12β, H-11α/H3-19, H-11α/H3-18, H-11β/H-5, H-5/H3-28, H3-19/1-OH, Hpro-R-29/H-2, and H-2/30-OH assigned the β-orientation for H-17, H3-28, and H-5, and the α-orientation for H-2, H3-18, H3-19, 30-OH, and 1-OH. The ECD spectrum of 21 was identical to that of thaixylomolin H (Figure 6b), concluding that 21 had the same 1R,2R,4R,5R,10S,13R,17R,30R-absolute configuration as that of thaixylomolin H. Thus, the structure of 21—named xylomolin I—was identified as 6-hydroxy-2-O-(2-methyl)butyryl-2-deacetoxy-thaixylomolin H.
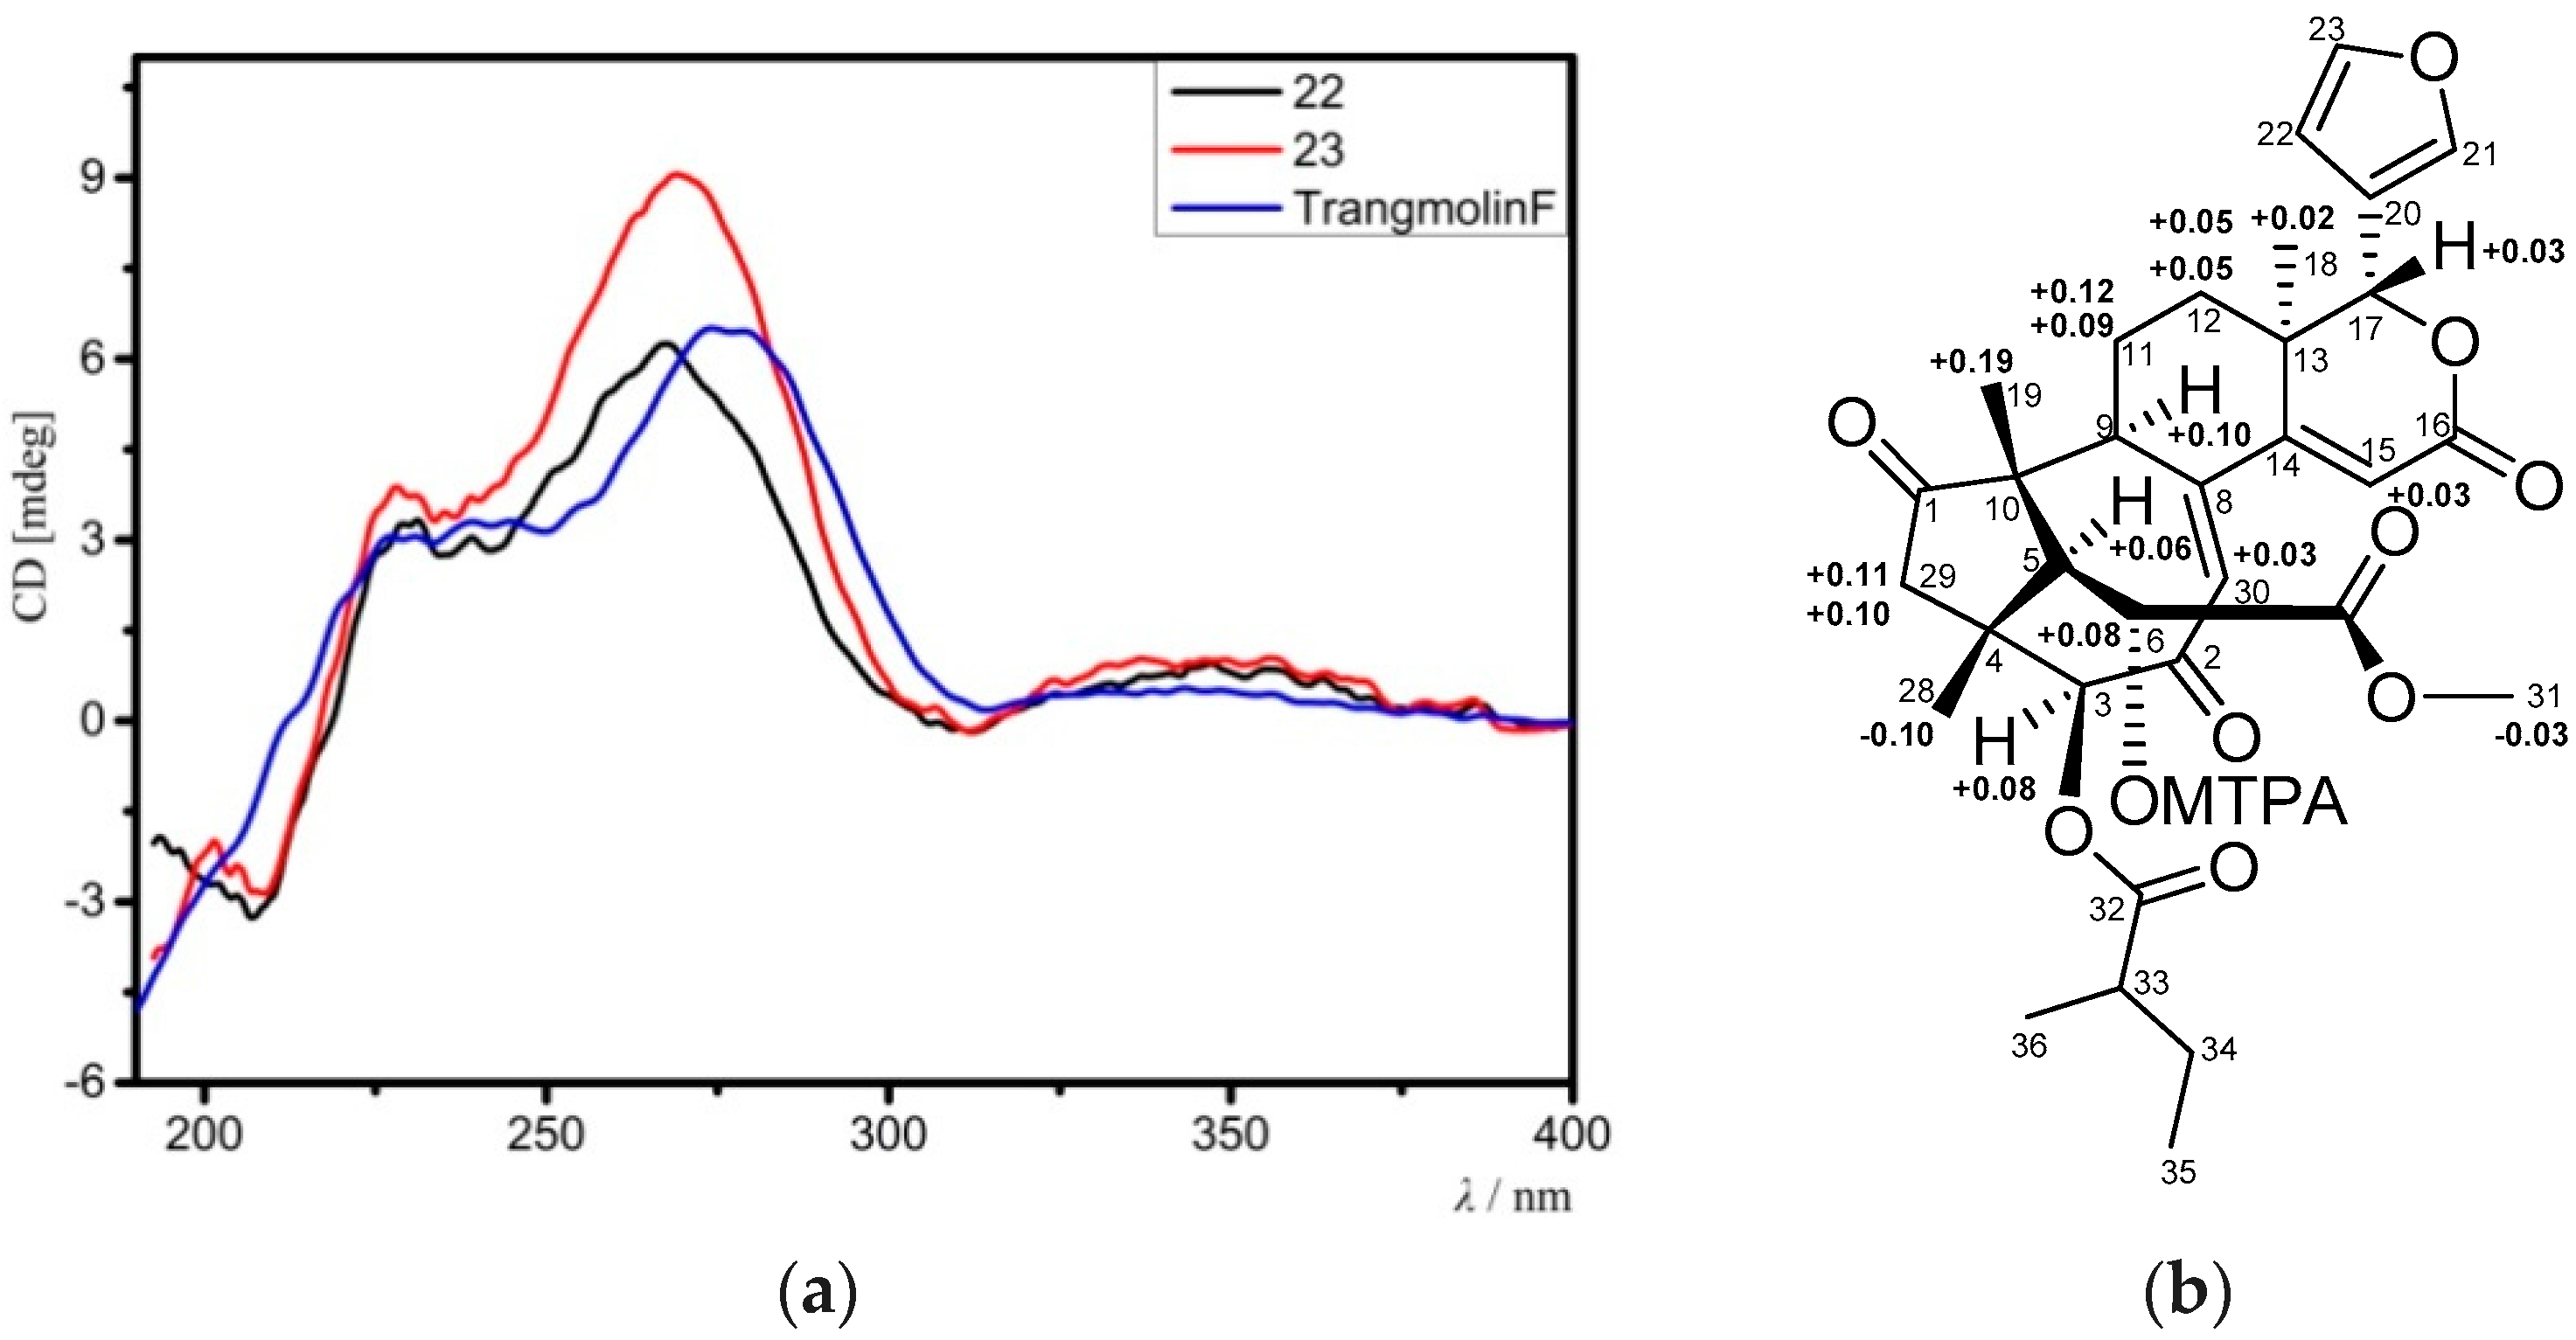
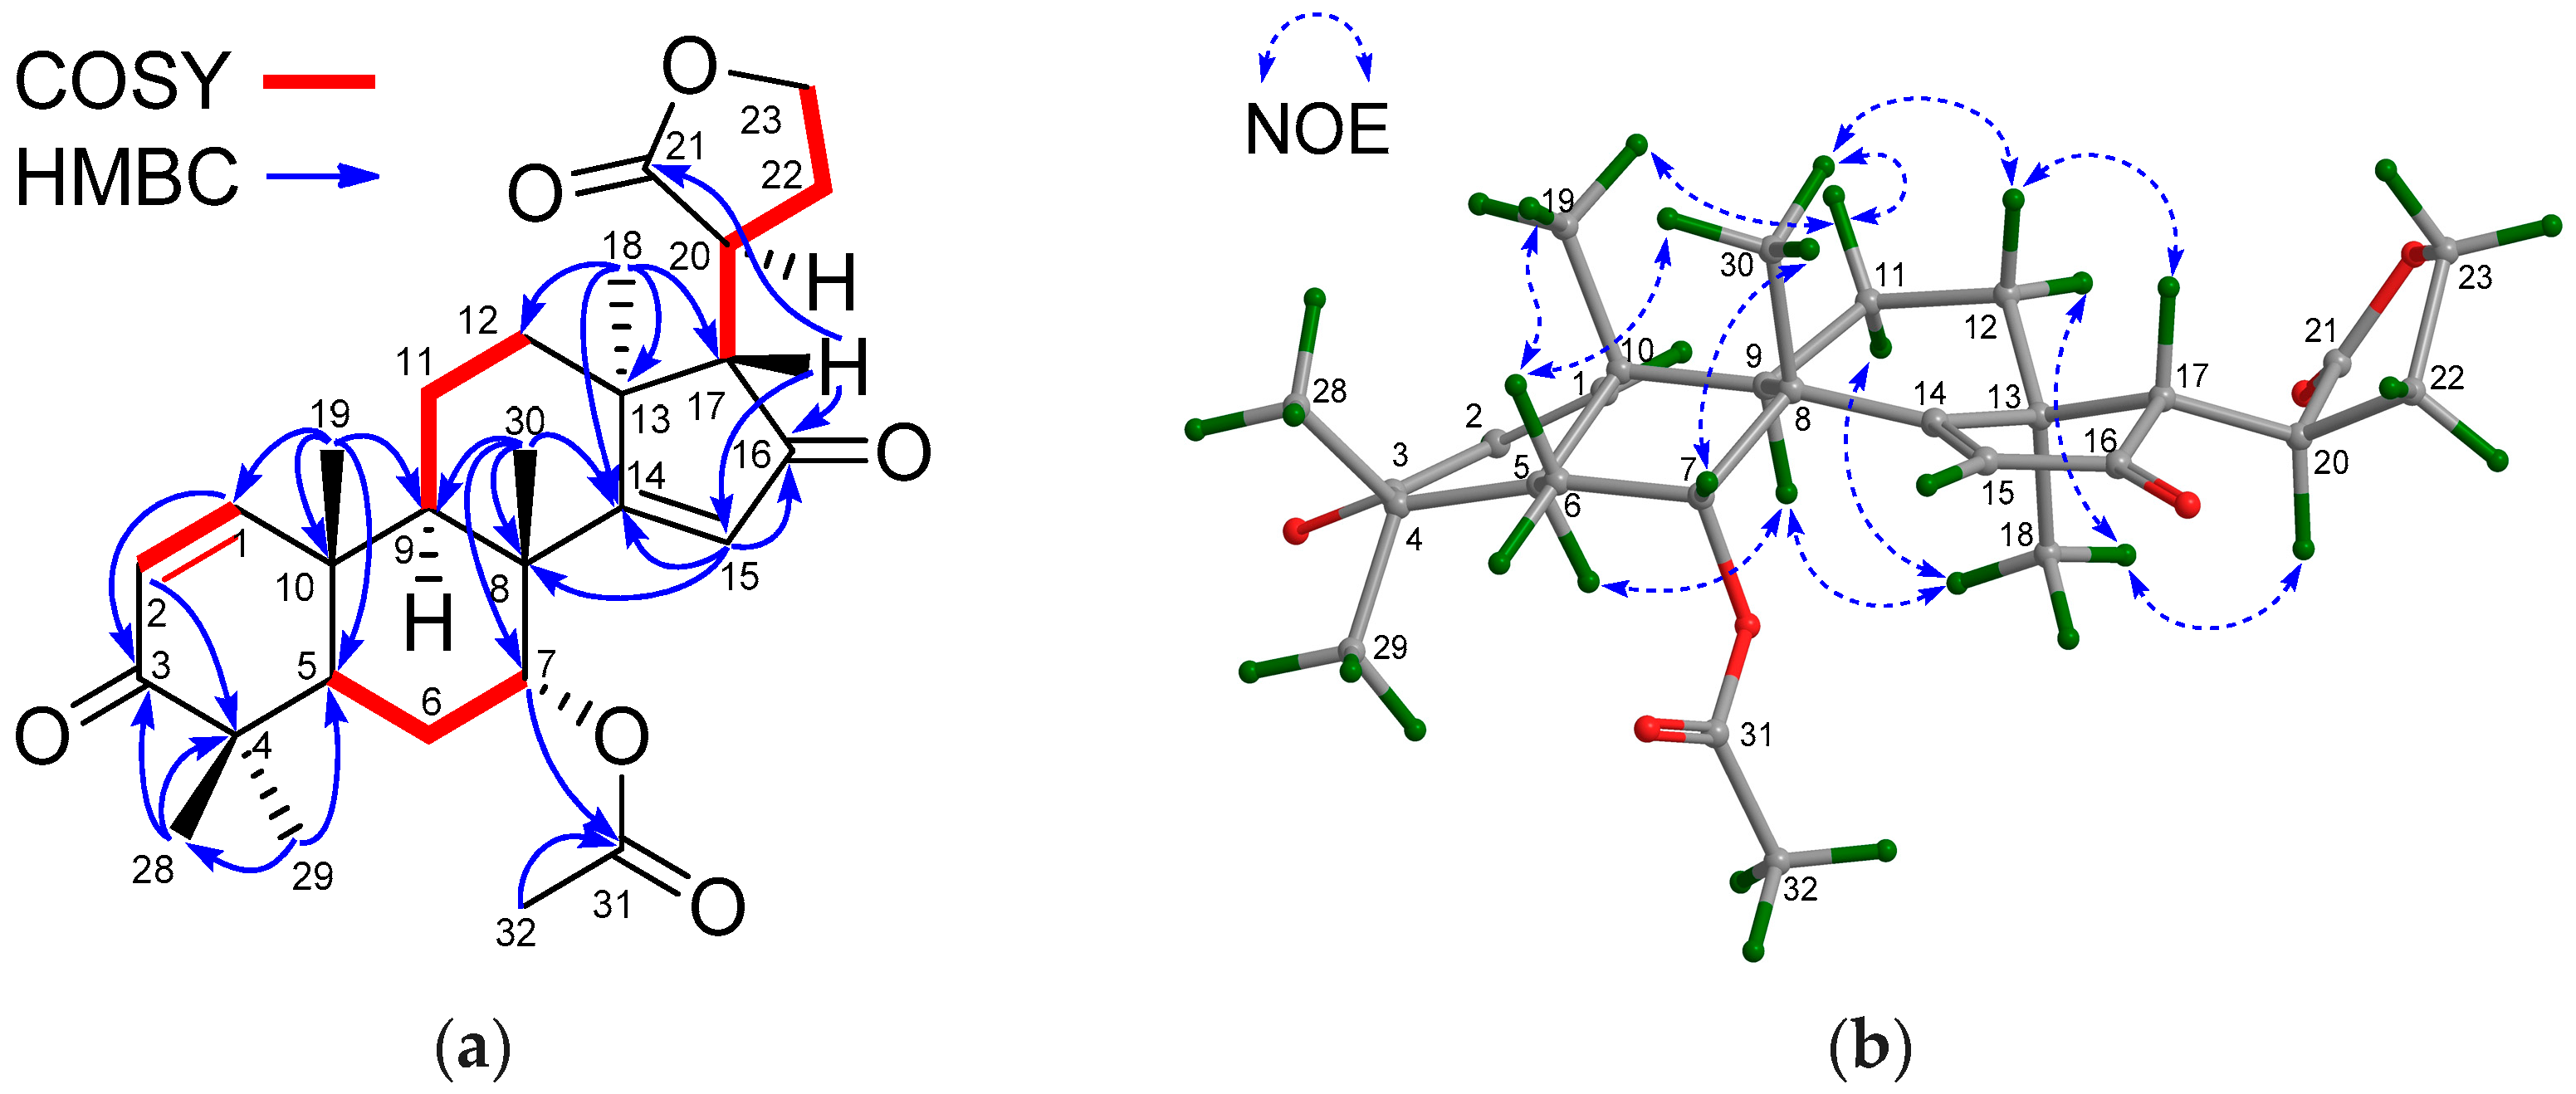
Compound 22 had the molecular formula C29H32O10 as determined from the positive HRESIMS ion peak at m/z 541.2077 (calcd. for [M + H]+, 541.2074). The similarities between the NMR spectroscopic data of 22 (Table 7 and Table 8) and those of trangmolin F [16], containing a (Z)-bicyclo[5.2.1]dec-3-en-8-one substructure, revealed their close structural resemblance. However, the 3-O-isobutyryl function in trangmolin F was replaced by an acetoxy group (δH 2.17 s 3H; δC 170.4 qC, 20.6 CH3) in 22, being unambiguously confirmed by HMBC cross-peaks between H-3/C-32 and H3-33/C-32 (Figure 7a). The relative configuration of 22 was assigned by NOE interactions (Figure 7b). Those between H-17/H-12β, H-12β/H3-19, and H3-19/H-5 revealed their cofacial relationship and were determined as β-oriented, whereas those between H-3/H-9, Hpro-R-29/H-3, and H-12α/H3-18 indicated the α-orientation for H-3, H-9, and H3-18, and the corresponding 3β-acetoxy function. The ECD spectrum of 22 was nicely matched with that of trangmolin F (Figure 8a), concluding that the absolute configuration of 22 was the same as that of trangmolin F. Thus, the structure of 22—named xylomolin J1—was assigned as 3-O-acetyl-3-deisobutyryloxy-trangmolin F.
Compound 23 provided the molecular formula of C32H38O10 as established by the positive HRESIMS ion peak at m/z 583.2548 (calcd. for [M + H]+, 583.2543). The NMR spectroscopic data of 23 (Table 7 and Table 8) resembled those of 22, except for the replacement of the 3-acetoxy group in 22 by a 2-methylbutyryloxy moiety (δH 2.51 m 1H, 1.53 m 1H, 1.74 m 1H, 0.96 t (J = 7.2 Hz, 3H), 1.18 d (J = 7.2 Hz, 3H); δC 176.2 qC, 40.7 CH, 26.6 CH2, 11.5 CH3, 16.4 CH3) in 23. The presence of the 2-methylbutyryloxy group was further evidenced by 1H-1H COSY cross-peaks between H-33/H3-36, H-33/H2-34, and H2-34/H3-35 and HMBC correlations between H-33/C-32, H-34/C-32, and H3-36/C-32. The HMBC correlation from H-3 to the carbonyl carbon (C-32) of the above 2-methylbutyryloxy group placed it at C-3. The relative configuration of 23 was confirmed to be the same as that of 22 by analysis of NOE interactions. Comparison of ECD spectra of compounds 23, 22, and trangmolin F (Figure 8a) revealed that these compounds had the same absolute configuration. The absolute configuration of C-6 was further determined by the modified Mosher α-methoxy-α-(trifluoromethyl)phenylacetyl (MTPA) ester method [24]. The ∆δ values of H-5, H3-19, and H3-29 were positive, while that of H3-31 was negative (Figure 8b). This regular arrangement concluded the R-absolute configuration for C-6. Finally, the absolute configuration of 23—named xylomolin J2—was unequivocally established as 3S,4R,5S,6R,9S,10R,13R,17R.
Compound 24 had the molecular formula C32H38O11 as determined from the positive HRESIMS ion peak at m/z 621.2306 (calcd. for [M + Na]+, 621.2306). The NMR spectroscopic data of 24 (Table 7 and Table 8) were similar to those of moluccensin I [25], except for the presence of an additional 6-OH group (δH 3.12 br s) and the replacement of the 1-O-isobutyryl group in moluccensin I by a 1-OH function (δH 2.81 s) in 24. The downshifted C-6 signal (δC 71.5 CH in 24, whereas δC 33.2 CH2 in moluccensin I) and HMBC correlations from the active proton (δH 3.12 br s) to C-5, C-6, and C-7 revealed the presence of the 6-OH group (Figure 9a). The existence of the 1-OH function was confirmed by the upshifted C-1 signal (δC 85.8 qC in 24, whereas δC 90.8 qC in moluccensin I) and strong HMBC cross-peaks from the active proton (δH 2.81 s) to C-1, C-2, and C-10 (Figure 9a). The relative configuration of 24 was identified as the same as that of moluccensin I based on NOE interactions between H-17/H-12β, H-5/H-11β, H-5/H-28, H3-18/H-11α, H3-19/Hpro-S-29, H-3/Hpro-R-29, and 2-OH/Hpro-R-29 (Figure 9b). Therefore, the structure of 24—named xylomolin K1—was assigned as 6-hydroxy-1-O-deisobutyryl-moluccensin I.
Compound 25 provided the molecular formula C31H36O11 as determined from the positive HRESIMS ion peak at m/z 607.2164 (calcd. for [M + Na]+, 607.2150). The NMR spectroscopic data of 25 (Table 7 and Table 8) were similar to those of 24, except for the replacement of 3-O-(2-methyl)butyryl in 24 by an isobutyryloxy group (δH 2.45 m 1H, 1.11 d (J = 6.8 Hz, 3H), 1.11 d (J = 6.8 Hz, 3H); δC 174.8 qC, 34.2 CH, 18.8 CH3, 19.0 CH3) in 25. The HMBC correlation from H-3 to the carbonyl carbon (C-32) of the isobutyryloxy group placed it at C-3. The relative configuration of 25 was determined to be the same as that of 24 based on NOE interactions between H-17/H-12β, H-11β/H-5, H-5/H3-28, H-12α/H3-18, H3-18/H-11α, Hpro-R-29/H-3, and Hpro-S-29/H3-19. Thus, the structure of 25—named xylomolin K2—was identified as 3-O-isobutyryl-3-de(2-methyl)butyryloxy-xylomolin K1.
Compound 26 was obtained as an amorphous white powder. Its molecular formula was determined to be C33H38O14 by the positive HRESIMS ion peak at m/z 681.2149 (calcd. for [M + Na]+, 681.2154). The NMR spectroscopic data of 26 (Table 7 and Table 8) resembled those of 2-O-acetyl-2-dehydroxy-12-deacetylxyloccensin U [18], being a phragmalin 8,9,30-ortho ester isolated from X. moluccensis, except for the presence of an additional 6-OH group and the absence of the 12-OH group in 26. The presence of the 6-OH group was supported by the downshifted C-6 signal (δC 71.5 CH in 26, whereas δC 33.7 CH2 in 2-O-acetyl-2-dehydroxy-12-deacetylxyloccensin U), the 1H-1H COSY cross-peak between H-5/H-6 and HMBC correlations between H-6/C-5 and H-6/C-7. The upshifted C-12 signal (δC 29.5, CH2 in 26, whereas δC 66.6 CH in 2-O-acetyl-2-dehydroxy-12-deacetylxyloccensin U), 1H-1H COSY cross-peaks between H2-11/H2-12, and HMBC correlations between H3-18/C-12 (Figure 10a) confirmed the absence of the 12-OH group in 26. NOE correlations between H-17/H-12β, H-12β/H-5, H-17/H-5, H-5/H-30, H3-18/H-12α, H3-18/H-11α, H3-19/Hpro-S-29, and H-3/Hpro-R-29 revealed the same relative configuration of 26 as that of 2-O-acetyl-2-dehydroxy-12-deacetylxyloccensin U (Figure 10b). The ECD spectrum of 26 was nicely matched with that of 2-O-acetyl-2-dehydroxy-12-deacetylxyloccensin U (Figure 10c), revealing the same absolute configuration for the two compounds. Thus, the structure of 26—named xylomolin L1—was assigned as 6-hydroxy-12-dehydroxy-2-O-acetyl-2-dehydroxy-12-deacetylxyloccensin U.
The molecular formula of 27 was determined to be C34H40O13 by the positive HRESIMS ion peak at m/z 679.2374 (calcd. for [M + Na]+, 679.2361). The NMR spectroscopic data of 27 (Table 7 and Table 8) closely resembled those of swietephragmin G [26], being a phragmalin 8,9,30-ortho ester, except for the presence of an additional 12-OH group, which was supported by the downshifted C-12 signal (δC 66.5 CH in 27, whereas δC 29.2 CH2 in swietephragmin G), 1H-1H COSY cross-peaks between H2-11/H-12, and HMBC correlations between H3-18/C-12. The strong NOE interaction between H-17/H-12 assigned the β-oriented H-12 and the corresponding α-orientation for the 12-OH group. The NOE interaction between H3-37/H3-38 assigned the E configuration for the double bond of 3-tigloyloxy group. Therefore, the structure of 27—named xylomolin L2—was identified as 12α-hydroxy-swietephragmin G.
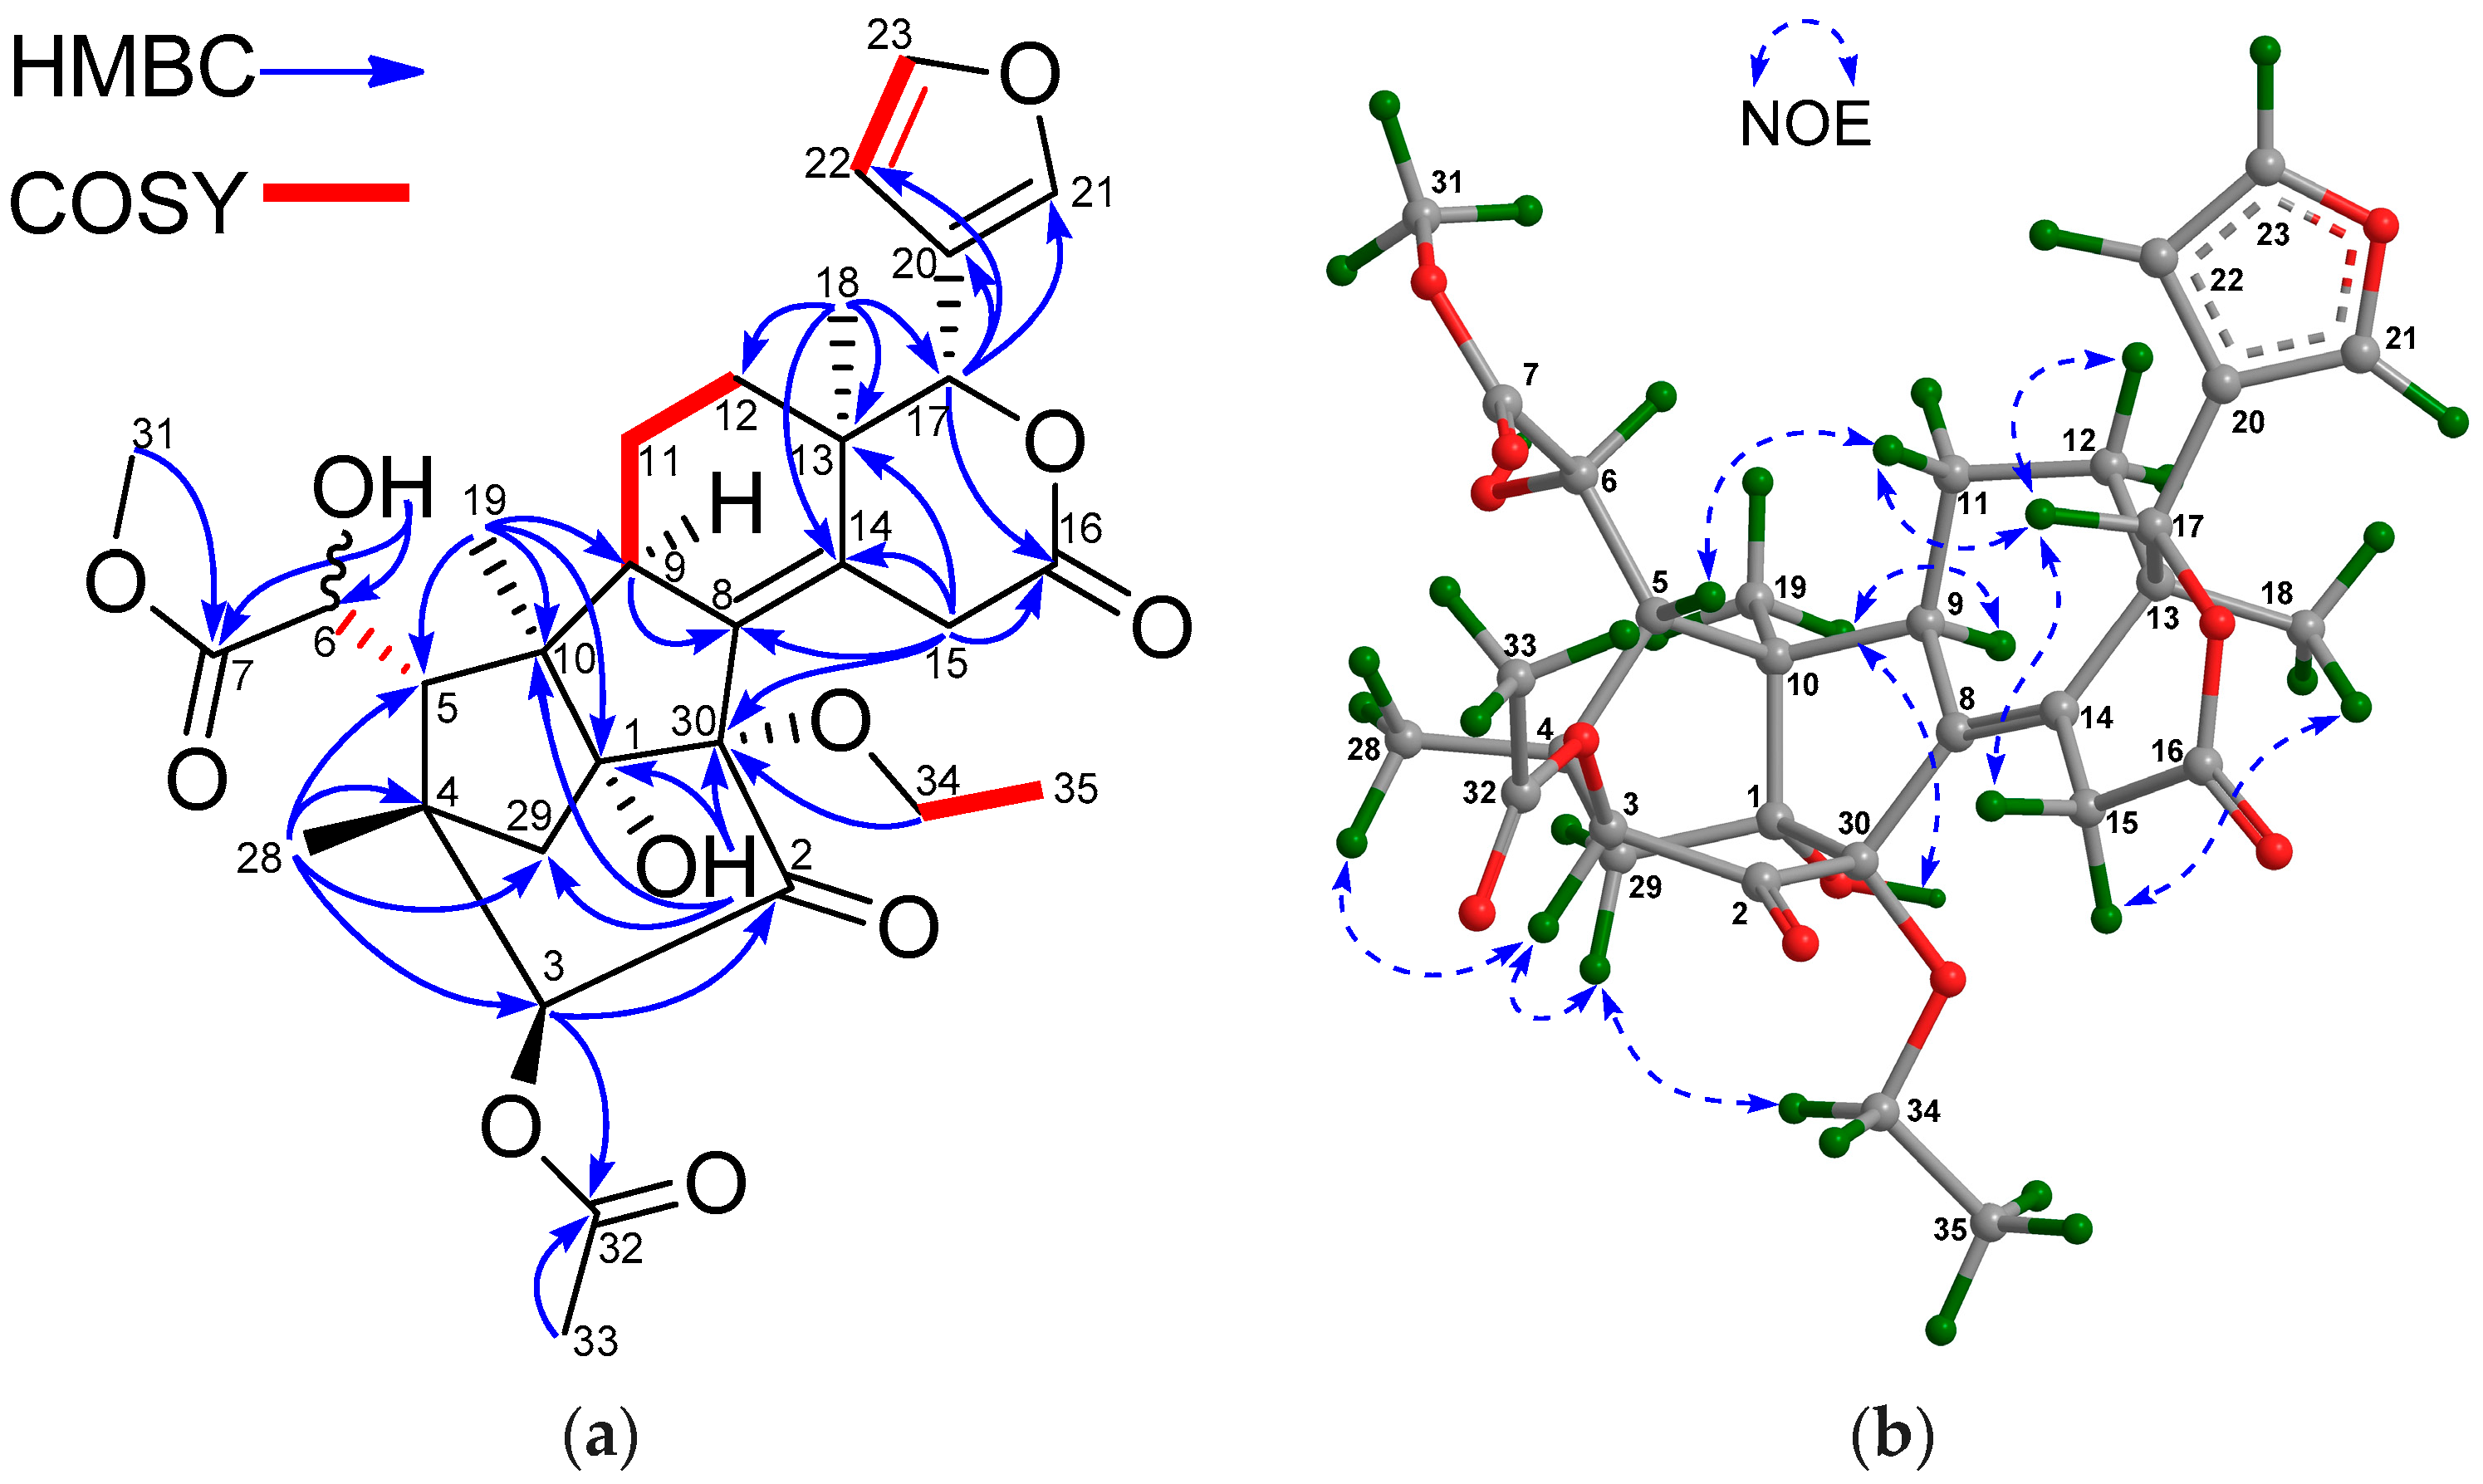
Compound 28 had the molecular formula C28H37O6 as determined from the positive HRESIMS ion peak at m/z 469.2603 (calcd. for [M + H]+, 469.2585). The NMR spectroscopic data of 28 (Table 7 and Table 8) were closely related to those of andirolide Q [27], except for the different positions of the ester carbonyl carbon of the C-17 attached five-membered γ-lactone ring, viz. C-21 in 28 instead of C-23 in andirolide Q. Significant 1H-1H COSY correlations between H-17/H-20, H-20/H2-22, H2-22/H2-23 and the HMBC correlation between H-17/C-21 confirmed the above deduction (Figure 11a). NOE interactions between H-17/H-12β, H-12β/H3-30, H3-30/H-7, H3-30/H-11β, H-11β/H3-19, and H3-18/H-11α, H3-18/H-12α, H3-18/H-20, H3-18/H-9, and H-9/H-5 indicated the β-orientation for H-7, H-17, H3-19, and H3-30, and the α-orientation for H-5, H-9, H3-18, and H-20 (Figure 11b). Hence, the relative configuration of 28—named xylomolin M—was assigned as depicted.
Compound 29 afforded the molecular formula C27H34O8 as deduced from the positive HRESIMS ion peak at m/z 509.2147 (calcd. for [M + Na]+, 509.2146). The NMR spectroscopic data of 29 (Table 7 and Table 8) closely resembled those of moluccensin O [25], except for the absence of the 21-OH group, which was corroborated by the upshifted C-21 signal (δc 72.4 CH2 in 29, δc 98.1 CH in moluccensin O) and HMBC correlations from H2-21 (δH 4.85 br d (J = 18.3 Hz), 5.03 dd (J = 18.3, 2.0 Hz)) to C-20 and C-22. The relative configuration of 29 was assigned as the same as that of moluccensin O based on NOE correlations. Thus, the structure of compound 29—named xylomolin N—was assigned as 21-dehydroxy-moluccensin O.
The antitumor activities of 1, 3, 8, 10, 11, 14–16, 20, 23, 25, and 27 were tested by the MTT cytotoxity assay against five human tumor cell lines, including human colorectal HCT-8 and HCT-8/T, human ovarian A2780 and A2780/T, and human breast MD-MBA-231 (Table S1) [28]. Cisplatin was used as the positive control. Compounds 11 and 23 showed weak activities against the tested cancer cell lines, whereas the other ten compounds were inactive at 100 μM. Compound 23 exhibited selective antitumor activity against human breast MD-MBA-231 cancer cells with an IC50 value of 37.7 μM.
Anti-HIV activities of 1, 3, 8, 10, 11, 14, 20, 23–25, and 27 were tested in vitro with the HIV-1 virus transfected 293 T cells [29]. At the concentration of 20 μM, 1, 11, 23, and 24 showed inhibitory rates of 17.49 ± 6.93%, 24.47 ± 5.04%, 14.77 ± 5.91%, and 14.34 ± 3.92%, respectively (Table S2). Efavirenz was used as the positive control with an inhibitory rate of 88.54 ± 0.45% at the same concentration.
3. Materials and Methods
3.1. General Methods
Optical rotations were recorded on a MCP500 modular circular polarimeter (Anton Paar Opto Tec GmbH, Seelze, Germany). UV spectra were obtained on a GENESYS 10S UV-Vis spectrophotometer (Thermo Fisher Scientific, Shanghai, China). HRESIMS were measured on a Bruker maXis ESI-QTOF mass spectrometer (Bruker Daltonics, Bremen, Germany). NMR spectra were recorded on a Bruker AV-400 spectrometer with TMS as the internal standard. Single-crystal X-ray diffraction analyses were made on an Agilent Xcalibur Atlas Gemini Ultra-diffractometer (Agilent Technologies, Santa Clara, CA, USA) with mirror monochromated CuKα radiation (λ = 1.54178 Å) at 150 K. Semi-preparative HPLC (Waters Corporation, Milford, MA, USA) was performed on a Waters 2535 pump equipped with a waters 2998 photodiode array detector and YMC C18 reverse-phased columns (250 mm × 10 mm i.d., 5 μm). For column chromatography, silica gel (100–200 mesh) (Qingdao Mar. Chem. Ind. Co. Ltd., Qingdao, China) and C18 reverse-phased silica gel (ODS-A-HG 12 nm, 50 µm, YMC Co. Ltd., Kyoto, Japan) were used. ECD spectra were measured on a Jasco J-810 spectropolarimeter (JASCO Corporation, Tokyo, Japan) in MeCN.
3.2. Plant Material
A batch of seeds of Xylocarpus moluccensis were collected at the mangrove swamp of Trang Province, Thailand, in June 2013, whereas another batch of seeds of the same mangrove plant were collected in Godavari estuary, Andhra Pradesh, India, in October 2009, respectively. The identification of the plant was performed by one of the authors (J.W.) and Mr. Tirumani Satyanandamurty (Government Degree College at Amadala Valasa, India). Voucher samples (No. ThaiXM-03 and No. IXM200901, respectively) were maintained in the Marine Drugs Research Center, College of Pharmacy, Jinan University.
3.3. Extraction and Isolation
The dried seeds (10.0 kg, ThaiXM-03) of X. moluccensis were extracted with 95% (v/v) EtOH at room temperature (5 × 20 L) to afford the EtOH extract (680.0 g), which was suspended in water and extracted with EtOAc. The resulting EtOAc extract (296.0 g) was chromatographed on silica gel column and eluted with CHCl3/MeOH (100:0 to 5:1) to yield 160 fractions.
Fractions 26–28 (31.6 g) were combined and further purified with an RP-18 column (acetone/H2O, 50:50 to 100:0) to afford 57 subfractions. Subfraction 23 was purified by preparative HPLC (YMC-Pack ODS-5-A, 250 mm × 10 mm i.d., MeOH/H2O, 50:50) to afford compound 1 (45.0 mg).
Fractions 29–40 (111.0 g) were combined and further purified with an RP-18 column (acetone/H2O, 50:50 to 100:0) to afford 360 subfractions. The combination of subfractions 90–95 was subjected to preparative HPLC (YMC-Pack ODS-5-A, 250 mm × 10 mm i.d., MeCN/H2O, 38:62) to give compound 8 (72 mg), along with five other subfractions (SFr.90-95-1 to SFr.90-95-5). Recrystallization of SFr.90-95-1 afforded compound 20 (15.3 mg). Further purification of SFr.90-95-2 with preparative HPLC (YMC-Pack ODS-5-A, 250 mm × 10 mm i.d., MeOH/MeCN/H2O, 10:40:50) yielded compounds 3 (7.1 mg), 5 (4.3 mg), 12 (37 mg), 13 (2.8 mg), and 21 (1.2 mg), whereas that of SFr.90-95-3 with preparative HPLC (YMC-Pack ODS-5-A, 250 mm × 10 mm i.d., MeOH/H2O, 60:40 or MeCN/H2O, 35:65) afforded compounds 6 (4.3 mg) and 9 (3.1 mg). SFr.90-95-4 was further purified with preparative HPLC (YMC-Pack ODS-5-A, 250 mm × 10 mm i.d., MeCN/H2O, 46:64) to afford compound 14 (57.0 mg). Subfractions 78–83 were combined and further purified by preparative HPLC (YMC-Pack ODS-5-A, 250 × 10 mm i.d., MeOH/H2O, 50:50) to give compounds 24 (3.5 mg), 26 (2.0 mg), 27 (7.0 mg), and 29 (2.5 mg).
Fractions 157–175 (14.5 g) were combined and further purified with an RP-18 column (acetone/H2O, 40:60 to 100:0) to afford 45 subfractions. Subfraction 27 was purified by preparative HPLC (YMC-Pack 250 mm × 10 mm i.d., MeCN/MeOH/H2O, 50:15:35) to afford compound 4 (1.2 mg).
The air-dried seeds (15.0 kg, IXM200901) were powdered and extracted with 95% (v/v) EtOH (5 × 20 L) at room temperature to afford the EtOH extract (1.1 kg), which was partitioned between EtOAc and water to afford the EtOAc portion (572.0 g). Then, 252.0 g of the EtOAc extract was further subjected to a silica gel column (105.0 cm × 9.5 cm i.d.) and eluted with a gradient mixture of CHCl3/MeOH (100:1 to 5:1) to afford 184 fractions.
Fractions 38–43 (26.0 g) were combined and further separated on an RP-18 column (64.0 cm × 6.3 cm i.d.), and eluted with a gradient mixture of acetone/H2O (40:60 to 100:0) to afford 74 subfractions.
Subfractions 12–16 (1.5 g) were combined and separated by preparative HPLC (YMC-Pack ODS-5-A, 250 mm × 10 mm i.d., MeCN/H2O, 36:64) to afford seven parts (SFr.12-16-1 to SFr.12-16-7). SFr.12-16-2 was further purified by preparative HPLC (YMC-Pack ODS-5-A, 250 mm × 10 mm i.d., MeOH/H2O, 49:51) to yield compounds 10 (49.3 mg) and 25 (25.7 mg). SFr.12-16-4 and SFr.12-16-5 were further purified by preparative HPLC (YMC-Pack ODS-5-A, 250 mm × 10 mm i.d., MeOH/H2O, 52:48) to afford compounds 15 (13 mg) and 22 (3.0 mg), respectively. SFr.12-16-6 was further subjected to preparative HPLC (MeOH/H2O, 51:49) to yield compound 2 (2.0 mg), whereas SFr.12-16-7 was further purified by preparative HPLC (MeOH/H2O, 60:40, subsequently with MeCN/H2O, 60:40, and then MeCN/MeOH/H2O, 60:20:20) to yield compound 28 (1.5 mg).
Preparative HPLC (YMC-Pack ODS-5-A, 250 mm × 10 mm i.d., MeOH/H2O, 58:42) was performed on subfraction 27 (2.9 g) to gain compound 16 (4.0 mg). Subfractions 32–35 (1.5 g) were combined and separated by preparative HPLC (YMC-Pack ODS-5-A, 250 mm × 10 mm i.d., MeCN/H2O, 55:45) to give four parts (SFr.32-35-1 to SFr.32-35-4). SFr.32-35-2 and SFr.32-35-3 were purified by preparative HPLC (MeOH/H2O, 65:35, MeOH/H2O, 60:40, respectively) to yield compounds 23 (27.0 mg) and 11 (27.5 mg), respectively, whereas recrystallization (acetone) of SFr.32-35-4 afforded compound 7 (23.8 mg).
Fractions 48–86 (43.9 g) were combined and further performed on an RP-18 column (46.7 cm × 6.4 cm i.d.), and eluted with a gradient mixture of MeCN/H2O (50:50 to 100:0), to afford 81 subfractions. Subfraction 4 (6.5 g) was purified by preparative HPLC (MeOH/H2O, 53:47) to yield compound 17 (5.5 mg). Subfractions 8–14 (10.4 g) were combined and further separated on an RP-18 column (62.0 cm × 6.5 cm i.d.) and eluted with a gradient mixture of acetone/H2O (50:50 to 100:0) to afford 37 subsubfractions, among which subsubfractions 12–15 (2.1 g) were combined and separated on the preparative HPLC (MeOH/MeCN/H2O, 50:15:35) to give compound 18 (2.1 mg). Subfraction 17 (1.78 g) was subjected to preparative HPLC (MeOH/H2O, 80:20) to yield compound 19 (1.2 mg).
Xylomolin A1 (1): Colorless crystal; −62.0 (c = 0.06, acetone); UV (MeCN) λmax (log ε) 199.7 (3.7) nm; ECD (c 0.41 mM, MeCN) λmax (Δε) 190.0 (−12.0), 289.6 (−2.2) nm; 1H and 13C NMR spectroscopic data see Table 1 and Table 2; HRESIMS m/z 615.2785 [M + H]+ (calcd. for C33H43O11, 615.2800).
Xylomolin A2 (2): White, amorphous powder; −74.7 (c 0.04, acetone); UV (MeCN) λmax (log ε) 194.0 (4.5), 279.0 (3.3) nm; 1H and 13C NMR spectroscopic data see Table 1 and Table 2; HRESIMS m/z 593.2143 [M + Cl]− (calcd. for C30H38O10Cl, 593.2159).
Xylomolin A3 (3): White, amorphous solid; −96.0 (c 0.05, acetone); UV (MeCN) λmax (log ε) 198.9 (3.9) nm; ECD (c 0.16 mM, MeCN) λmax (Δε) 191.0 (−14.5) nm; 1H and 13C NMR spectroscopic data see Table 1 and Table 2; HRESIMS m/z 625.2620 [M + Na]+ (calcd. for C32H42NaO11, 625.2619).
Xylomolin A4 (4): White, amorphous powder; −24.0 (c 0.08, acetone); UV (MeCN) λmax (log ε) 197.0 (3.9), 201.8 (3.8) nm; ECD (c 0.15 mM, MeCN) λmax (Δε) 190(−8.1), 200.4 (−5.0), 211.6 (−6.6) nm; 1H and 13C NMR spectroscopic data see Table 1 and Table 2; HRESIMS m/z 683.2675 [M + Na]+ (calcd. for C34H44NaO13, 683.2674).
Xylomolin A5 (5): White, amorphous powder; −52.0 (c 0.04, acetone); UV (MeCN) λmax (log ε) 201.0 (3.8) nm; ECD (c 0.16 mM, MeCN) λmax (Δε) 191.0 (−8.6) nm; 1H and 13C NMR spectroscopic data see Table 1 and Table 2; HRESIMS m/z 625.2252 [M + Na]+ (calcd. for C31H38NaO12, 625.2255).
Xylomolin A6 (6): White, amorphous powder; −216.0 (c 0.10, acetone); UV (MeCN) λmax (log ε) 197.8 (4.0) nm; ECD (c 0.16 mM, MeCN) λmax (Δε) 190.0 (−12.8), 216.4 (+1.5), 294.2 (−2.3) nm; 1H and 13C NMR spectroscopic data see Table 1 and Table 2; HRESIMS m/z 609.2311 [M + Na]+ (calcd. for C31H38NaO11, 609.2306).
Xylomolin A7 (7): White powder; −250.7 (c 0.08, acetone); UV (MeCN) λmax (log ε) 193.0 (4.5) nm; 1H and 13C NMR spectroscopic data see Table 1 and Table 2; HRESIMS m/z 593.2358 [M + Na]+ (calcd. for C31H38NaO10, 593.2357).
Xylomolin B1 (8): White, amorphous powder; +212.0 (c 0.08, acetone); UV (MeCN) λmax (log ε) 204.0 (3.9), 285.4 (4.0) nm; ECD (c 0.10 mM, MeCN) λmax (Δε) 252.1 (−1.6), 278.9 (+8.6) nm; 1H and 13C NMR spectroscopic data see Table 3 and Table 4; HRESIMS m/z 607.2151 [M + Na]+ (calcd. for C31H36NaO11, 607.2150).
Xylomolin B2 (9): White, amorphous solid; +137.0 (c 0.10, acetone); UV (MeCN) λmax (log ε) 207.2 (3.7), 285.2 (4.0) nm; ECD (c 0.19 mM, MeCN) λmax (Δε) 190.0 (+3.6), 213.7 (−1.1), 282.2 (+9.5) nm; 1H and 13C NMR spectroscopic data see Table 3 and Table 4; HRESIMS m/z 527.2273 [M + H]+ (calcd. for C29H35O9, 527.2276).
Xylomolin C1 (10): White, amorphous powder; +156.0 (c 0.07, acetone); UV (MeCN) λmax (log ε) 191.0 (4.3), 275 (4.1) nm; 1H and 13C NMR spectroscopic data see Table 3 and Table 4; HRESIMS m/z 543.2238) [M + H]+ (calcd. for C29H35O10, 543.2230).
Xylomolin C2 (11): White, amorphous powder; +125.7 (c 0.09, acetone); UV (MeCN) λmax (log ε) 194.0 (4.7), 277 (4.6) nm; 1H and 13C NMR spectroscopic data see Table 3 and Table 4; HRESIMS m/z 591.2570 [M + Na]+ (calcd. for C32H40NaO9, 591.2565).
Xylomolin D (12): White, amorphous powder; −34.0 (c 0.05, acetone); UV (MeCN) λmax (log ε) 208.2 (3.8) nm; ECD (c 0.16 mM, MeCN) λmax (Δε) 190.0 (−2.6), 217.5 (+13.7), 244.5 (−0.3), 261 (+ 1.5), 291.2 (−3.8) nm; 1H and 13C NMR spectroscopic data see Table 3 and Table 4; HRESIMS m/z 625.2612 [M + Na]+ (calcd. for C32H42NaO11, 625.2619).
Xylomolin E (13): White, amorphous powder; −68.0 (c 0.04, acetone); UV (MeCN) λmax (log ε) 207.2 (3.9) nm; ECD (c 0.15 mM, MeCN) λmax (Δε) 190.0 (−9.5), 213.7 (+2.5) nm; 1H and 13C NMR spectroscopic data see Table 3 and Table 4; HRESIMS m/z 625.2250 [M + Na]+ (calcd. for C31H38NaO12, 625.2255).
Xylomolin F (14): White, amorphous powder; +4.0 (c 0.03, acetone); UV (MeCN) λmax (log ε) 211.0 (4.1) nm; ECD (c 0.21 mM, MeCN) λmax (Δε) 192.0 (−7.1), 219.0 (+4.0), 265.0 (+3.2) nm; 1H and 13C NMR spectroscopic data see Table 3 and Table 4; HRESIMS m/z 669.2521 [M + Na]+ (calcd. for C33H42NaO13, 669.2518).
Xylomolin G1 (15): White, amorphous solid; −65.0 (c 0.1, acetone); UV (MeCN) λmax (log ε) 190.2 (4.20) nm; ECD (c 0.14 mM, MeCN) λmax (Δε) 207 (+2.3), 238 (−3.8), 290 (+1.4), 321 (−0.32), 344 (+0.32) nm; 1H and 13C NMR spectroscopic data see Table 5 and Table 6; HRESIMS m/z 587.2494 [M + H]+ (calcd. for C31H39O11, 587.2492).
Xylomolin G2 (16): White, amorphous solid; −72.0 (c 0.05,acetone); UV (MeCN) λmax (log ε) 190.2 (4.03); ECD (c 0.13 mM, MeCN) λmax (Δε) 205.0 (+1.7), 239.0 (−4.3), 302.0 (+0.34), 339.0 (+1.1) nm; 1H and 13C NMR spectroscopic data see Table 5 and Table 6; HRESIMS m/z 615.2809 [M + H]+ (calcd. for C33H43O11, 615.2805).
Xylomolin G3 (17): White, amorphous solid; −43.5 (c 0.04, acetone); UV (MeCN) λmax (log ε) 196.6 (4.03), 285.0 (2.93) nm; ECD (c 0.15 mM, MeCN) λmax (Δε) 193.0 (−4.5), 197.0 (−3.4), 205.0 (−7.5), 216.0 (−5.0), 233.0 (−7.9), 298 (+4.3) nm; 1H and13C NMR spectroscopic data see Table 5 and Table 6; HRESIMS m/z 543.2246 [M + H]+ (calcd. for C29H35O10, 543.2230).
Xylomolin G4 (18): White, amorphous solid; −44.0 (c 0.01,acetone); UV (MeCN) λmax (log ε) 196.6 (4.08) nm; ECD (c 0.18 mM, MeCN) λmax (Δε) 203.0 (−8.7), 215.0 (−6.2), 233.0 (−10.3), 301.0 (+5.0) nm; 1H and13C NMR spectroscopic data see Table 5 and Table 6; HRESIMS m/z 555.2593 [M + H]+ (calcd. for C31H39O9, 555.2594).
Xylomolin G5 (19): White, amorphous solid; −37.5 (c 0.024, acetone); UV (MeCN) λmax (log ε) 195.0 (4.27), 284.2 (2.86) nm; ECD (c 0.11 mM, MeCN) λmax (Δε) 195.0 (+ 0.70), 206.0 (−4.9), 214.0 (−3.5), 231.0 (−6.1), 299.0 (+2.7) nm; 1H and13C NMR spectroscopic data see Table 5 and Table 6; HRESIMS m/z 569.2753 [M + H]+ (calcd. for C32H41O9, 569.2751).
Xylomolin H (20): White, amorphous powder; +65.0 (c 0.06, acetone); UV (MeCN) λmax (log ε) 212.3 (4.0) nm; ECD (c 0.16 mM, MeCN) λmax (Δε) 223 (+10.9), 245 (+0.19),270 (+8.1) nm; 1H and 13C NMR spectroscopic data see Table 5 and Table 6; HRESIMS m/z 667.2359 [M + Na]+ (calcd. for C33H40NaO13, 667.2361).
Xylomolin I (21): Light yellow, amorphous gum; +129.0 (c 0.08, acetone); UV (MeCN) λmax (log ε) 208.4 (3.8), 287.6 (4.1) nm; ECD (c 0.17 mM, MeCN) λmax (Δε) 200.0 (+4.6), 213.0 (+2.3), 232.0 (+4.6), 259.0 (−3.9), 291.0 (+10.3) nm; 1H and 13C NMR spectroscopic data see Table 5 and Table 6; HRESIMS m/z 621.2304 [M + Na]+ (calcd. for C32H38NaO11, 621.2306)
Xylomolin J1 (22): White, amorphous powder; −135.0 (c 0.11, acetone); UV (MeCN) λmax (log ε) 197.0 (4.9), 213.4 (4.8), 260.8 (4.6) nm; ECD (c 0.039 mM, MeCN) λmax (Δε) 204.0 (−3.3), 229.0 (+3.3), 266.0 (+6.3), 310.0 (−0.19), 346.0 (+0.95) nm; 1H and 13C NMR spectroscopic data see Table 7 and Table 8; HRESIMS m/z 541.2077 [M + H]+ (calcd. for C29H33O10, 541.2074).
Xylomolin J2 (23): White, amorphous powder; +232.0 (c 0.1, acetone); UV (MeCN) λmax (log ε) 196.8 (5.2), 211.0 (5.1), 260.8 (5.0) nm; ECD (c 0.039 mM, MeCN) λmax (Δε) 190.0 (−3.9), 199.0 (−2.0), 206.0 (−2.9), 225.0 (+3.9), 267.0 (+9.1), 310.0 (−0.17), 335.0 (+1.0) nm; 1H and 13C NMR spectroscopic data see Table 7 and Table 8; HRESIMS m/z 583.2548 [M + H]+ (calcd. for C32H39O10, 583.2543).
Xylomolin K1 (24): White, amorphous powder; +98.0 (c 0.1, acetone); UV (MeCN) λmax (log ε) 194.0 (4.3), 271.0 (4.3) nm; ECD (c 0.33 mM, MeCN) λmax (Δε) 209.0 (+3.0), 211.0 (+2.9), 232.0 (+8.5), 275.0 (−2.8), 300.0 (+6.4) nm; 1H and 13C NMR spectroscopic data see Table 7 and Table 8; HRESIMS m/z 621.2306 [M + Na]+ (calcd. for C32H38NaO11, 621.2306).
Xylomolin K2 (25): White, amorphous powder; +120.4 (c 0.07, acetone); UV (MeCN) λmax (log ε) 191.0 (4.3), 272.0 (4.5) nm; 1H and 13C NMR spectroscopic data see Table 7 and Table 8; HRESIMS m/z 607.2164 [M + Na]+ (calcd. for C31H36NaO11, 607.2150).
Xylomolin L1 (26) : White, amorphous powder; +64.0 (c 0.09, acetone); UV (MeCN) λmax (log ε) 213.0 (4.0) nm; ECD (c 0.30 mM, MeCN) λmax (Δε) 220.0 (+12.5), 249.0 (+ 1.1), 270.0 (+ 0.8), 236.0 (+ 1.9) nm; 1H and 13C NMR spectroscopic data see Table 7 and Table 8; HRESIMS m/z 681.2149 [M + Na]+ (calcd. for C33H38NaO14, 681.2154).
Xylomolin L2 (27): White, amorphous powder; +42.0 (c 0.06, acetone); UV (MeCN) λmax (log ε) 214 (4.5) nm; ECD (c 0.15 mM, MeCN) λmax (Δε) 198.0 (+3.2), 213.0 (−3.6), 234.0 (+11.6) nm; 1H and 13C NMR spectroscopic data see Table 7 and Table 8; HRESIMS m/z 679.2374 [M + Na]+ (calcd. for C34H40NaO13, 679.2361).
Xylomolin M (28): White, amorphous powder; −252.0 (c 0.03, acetone); UV (MeCN) λmax 200.0 (4.0), 232 (4.1) nm; 1H and 13C NMR spectroscopic data see Table 7 and Table 8; HRESIMS m/z 469.2603 [M + H]+ (calcd. for C28H37O6, 469.2585).
Xylomolin N (29): White, amorphous powder; −17.0 (c 0.05, acetone); UV (MeCN) λmax (log ε) 196 (3.7), 211 (3.7) nm; ECD (c 0.21 mM, MeCN) λmax (Δε) 200.0 (−7.0), 224.0 (+2.1), 252.0 (−0.3) nm; 1H and 13C NMR spectroscopic data see Table 7 and Table 8; HRESIMS m/z 509.2147 [M + Na]+ (calcd. for C27H34NaO8, 509.2146).
3.4. X-ray Crystal Data for Xylomolin A1 (1)
Orthorhombic, C34H46O12 (C33H42O11·CH3OH), space group P2(1)2(1)2(1), a = 8.82730 (5) Å, b = 17.93740 (10) Å, c = 20.84108 (13) Å, α = 90°, β = 90°, γ = 90°, V = 3299.95 (3) Å3, Z = 4, Dcalcd. = 1.302 Mg/m3, μ = 0.816 mm−1. Crystal size: 0.40 × 0.40 × 0.28 mm3. 47,329 measured reflections, 5877 [Rint = 0.0378] independent reflections, 426 parameters, 0 restraints, F(000) = 1384.0, R1 = 0.0296, wR2 = 0.0773(all data), R1 = 0.0286, wR2 = 0.0763 [I > 2σ(I)], and goodness-of-fit (F2) = 1.065. The absolute structural parameter is −0.06(10), Flack x is −0.14(11), and Hooft y is −0.04(3).
CCDC-1590301 (1) contains the supplementary crystallographic data for this paper (excluding structure factors). These data are provided free of charge by The Cambridge Crystallographic Data Centre.
3.5. MTT Cytotoxicity Assay
Compounds 1, 3, 8, 10, 11, 14–16, 20, 23, 25, and 27 were evaluated by the MTT method for cytotoxicities against human colorectal HCT-8 and HCT-8/T, ovarian A2780 and A2780/T, and breast MD-MBA-231 cancer cell lines. All cell lines were cultured as adherent monolayers in flasks in DMEM culture medium with 10% fetal bovine serum, benzylpenicillin (50 kU/L), and streptomycin (50 mg/L) at 37 °C in a humidified atmosphere of 5% CO2. Cells were collected with trypsin and resuspended in a final concentration of 5 × 10⁴/mL. One hundred microliter aliquots for each cell suspension were distributed evenly into 96-well multiplates (number of cells per well is 5 × 10³). Different concentrations of the compounds were added into the designated wells. After 72 h, a 10 μL MTT solution (5 mg/mL) was added to each well, and the plate was further incubated for 4 h, allowing viable cells to reduce the yellow MTT into dark-blue formazan crystals which were dissolved in DMSO 100 μL. The absorbance in individual wells was determined at 490 nm by a microplate reader (Biotek, VT, USA) [28]. The concentrations required to inhibit the growth of cancer cells by 50% (IC50 values) were calculated from cytotoxicity curves by Bliss method. The positive control was cisplatin. The IC50 values of cisplatin in human colorectal HCT-8 and HCT-8/T, ovarian A2780 and A2780/T, and breast MD-MBA-231, were 15.43, 21.98, 8.54, 9.26, and 6.25 μM, respectively.
3.6. HIV-Inhibitory Bioassay
For the assay, 293 T cells (2 × 10⁵) were co-transfected with 0.6 μg of pNL-Luc-E−-Vpu− and 0.4 μg of vesicular stomatitis virus glycoprotein (VSV-G) expression vector pHIT/G. After 48 h, the VSV-G pseudotyped viral supernatant (HIV-1) was harvested by filtration through a 0.45-μm filter and the concentration of viral capsid protein was determined by p24 antigen capture ELISA (Biomerieux, Shanghai, China). SupT1 cells were exposed to VSV-G pseudotyped HIV-1 (multiplicity of infection (MOI) = 1) at 37 °C for 48 h in the absence or presence of the test compounds (1, 3, 8, 10, 11, 14, 20, 23–25, and 27). Efavirenz was used as the positive control. The inhibition rates were determined by using a firefly Luciferase Assay System (Promega, Madison, WI, USA) [29].
4. Conclusions
Twenty-nine new limonoids were isolated from the seeds of the mangrove plant, Xylocarpus moluccensis, collected in Thailand and India. The structures of these limonoids, including absolute configurations of ten compounds, viz. 1, 15–19, 21–23, and 26, were established by HRESIMS, extensive NMR investigations, single-crystal X-ray diffraction analysis conducted with Cu Kα radiation, and the comparison of experimental ECD spectra. Compounds 1–14 are mexicanolides, whereas 15–21 are khayanolides. Compounds 22 and 23 are unusual limonoids possessing a (Z)-bicyclo[5.2.1]dec-3-en-8-one motif, while 24 and 25 are 30-ketophragmalins. Compounds 26 and 27 are phragmalin 8,9,30-ortho esters, whereas 28 and 29 are azadirone and andirobin derivatives. These results demonstrate that X. moluccensis continues to be an abundant resource for the production of novel limonoids with structural diversity. Compound 23 exhibited selective antitumor activity against human triple-negative breast MD-MBA-231 cancer cells with an IC50 value of 37.7 μM, whereas compounds 1, 11, 23, and 24 showed inhibitory rates of 17.49 ± 6.93%, 24.47 ± 5.04%, 14.77 ± 5.91%, and 14.34 ± 3.92% against HIV-I virus, respectively, at the concentration of 20 μM.
Supplementary Materials
The following are available online at www.mdpi.com/1660-3397/16/1/38/s1. Table S1: Cytotoxic assay results for compounds against human cancer cells; Table S2: HIV-inhibitory bioassay results for tested compounds; Copies of HRESIMS of compounds 1–29, and 1D and 2D NMR spectra of compounds 1–29.
Acknowledgments
This work was financially supported by NSFC (U1501221, 31770377, 81661148049, and 81125022), the Pearl River S&T Nova Program of Guangzhou, China (201506010023), the Science and Technology Planning Project of Guangdong Province, China (2013B051000057), and the Fundamental Research Funds for the Central Universities, China (21617474). We thank Tirumani Satyanandamurty (Government Degree College at Amadala Valasa, India) and Patchara Pedpradab (Rajamangala University of Technology Srivijaya, Trang Province, Thailand) for providing the plant materials in this work.
Author Contributions
Li Shen and Jun Wu conceived and designed the experiments; Jianzhi Zhang, Wanshan Li, and Yiguo Dai performed the experiments and analyzed the data; Jianzhi Zhang and Wanshan Li wrote the draft; Li Shen and Jun Wu revised the paper. All authors have read and approved the manuscript.
Conflicts of Interest
The authors declare no conflict of interest.
References
- Tan, Q.G.; Luo, X.D. Meliaceous limonoids: Chemistry and biological activities. Chem. Rev. 2011, 111, 7437–7522. [Google Scholar] [CrossRef] [PubMed]
- Fang, X.; Di, Y.T.; Hao, X.J. The advances in the limonoid chemistry of the Meliaceae family. Curr. Org. Chem. 2011, 15, 1363–1391. [Google Scholar]
- Gualdani, R.; Cavalluzzi, M.M.; Lentini, G.; Habtemariam, S. The chemistry and pharmacology of citrus limonoids. Molecules 2016, 21, 1530. [Google Scholar] [CrossRef] [PubMed]
- Jolanta, P.; Jan, S.D.; Agata, K.; Stanislaw, L. Variability of biological activities of limonoids derived from plant sources. Mini-Rev. Org. Chem. 2014, 11, 269–279. [Google Scholar] [CrossRef]
- Ye, F.; Li, X.W.; Guo, Y.W. Recent progress on the mangrove plants: Chemistry and bioactivity. Curr. Org. Chem. 2016, 20, 1923–1942. [Google Scholar] [CrossRef]
- Wu, J.; Xiao, Q.; Xu, J.; Li, M.Y.; Pan, J.Y.; Yang, M.H. Natural Products from True Mangrove Flora: Source, Chemistry and Bioactivities. Nat. Prod. Rep. 2008, 25, 955–981. [Google Scholar] [CrossRef] [PubMed]
- Rajab, M.S.; Rugutt, J.K.; Fronczek, F.R.; Fischer, N.H. Structural Revision of Harrisonin and 12 β-Αcetoxyharrisonin, Two Limonoids from Harrisonia abyssinica. J. Nat. Prod. 1997, 60, 822–825. [Google Scholar] [CrossRef]
- Shen, L.R.; Dong, M.; Yin, B.W.; Guo, D.; Zhang, M.L.; Shi, Q.W.; Huo, C.H.; Kiyota, H.; Suzuki, N.; Cong, B. Xylomexicanins A and B, New Δ14,15-Mexicanolides from Seeds of the Chinese Mangrove Xylocarpus granatum. Z. Naturforschung C 2009, 64, 37–42. [Google Scholar] [CrossRef]
- Zhou, Z.F.; Kurtán, T.; Mándi, A.; Gu, Y.C.; Yao, L.G.; Xin, G.R.; Li, X.W. Novel and neuroprotective tetranortriterpenoids from Chinese mangrove Xylocarpus granatum Koenig. Sci. Rep. 2016, 6, 33908–33918. [Google Scholar] [CrossRef] [PubMed]
- Lakshmi, V.; Mishra, V.; Palit, G. A new gastroprotective effect of limonoid compounds xyloccensins X and Y from Xylocarpus moluccensis in rats. Nat. Prod. Bioprospect. 2014, 4, 277–283. [Google Scholar] [CrossRef] [PubMed]
- Yin, X.; Li, X.; Hao, Y.G.; Zhao, Y.W.; Zhou, J.H.; Shi, H.S. Xylocarpin H, a Limonoid of Xylocarpus granatum, Produces Antidepressant-Like Activities in Mice. J. Behav. Brain Sci. 2015, 5, 524–532. [Google Scholar] [CrossRef]
- Connolly, J.D.; Maclellan, M.; Okorie, D.A.; Taylor, D.A.H. Limonoids from Xylocarpus moluccensis (Lam.) M. Roem. J. Chem. Soc. Perkin Trans. 1 1976, 1993–1996. [Google Scholar] [CrossRef]
- Taylor, D.A.H. Limonoid extractives from Xylocarpus moluccensis. Phytochemistry 1983, 22, 1297–1299. [Google Scholar] [CrossRef]
- Mulholland, D.A.; Taylor, D.A.H. Limonoids from Australian members of the meliaceae. Phytochemistry 1992, 31, 4163–4166. [Google Scholar] [CrossRef]
- Li, W.S.; Wu, J.; Li, J.; Satyanandamurty, T.; Shen, L.; Bringmann, G. Krishnadimer A, an axially chiral non-biaryl natural product: Discovery and biomimetic synthesis. Org. Lett. 2017, 19, 182–185. [Google Scholar] [CrossRef] [PubMed]
- Li, W.S.; Shen, L.; Bruhn, T.; Pedpradab, P.; Wu, J.; Bringmann, G. Trangmolins A–F with an unprecedented structural plasticity of the rings A and B: New insight into limonoid biosynthesis. Chem. Eur. J. 2016, 22, 11719–11727. [Google Scholar] [CrossRef] [PubMed]
- Dai, Y.G.; Li, W.S.; Pedpradab, P.; Liu, J.J.; Wu, J.; Shen, L. Thaixylomolins O–R: Four new limonoids from the Trang mangrove, Xylocarpus moluccensis. RSC Adv. 2016, 6, 85978–85984. [Google Scholar] [CrossRef]
- Li, W.S.; Jiang, Z.P.; Shen, L.; Pedpradab, P.; Bruhn, T.; Wu, J.; Bringmann, G. Antiviral limonoids including khayanolides from the Trang mangrove plant Xylocarpus moluccensis. J. Nat. Prod. 2015, 78, 1570–1578. [Google Scholar] [CrossRef] [PubMed]
- Yuan, T.; Zhang, C.R.; Yang, S.P.; Yue, J.M. Limonoids and Triterpenoids from Khaya senegalensis. J. Nat. Prod. 2010, 73, 669–674. [Google Scholar] [CrossRef] [PubMed]
- Li, J.; Li, M.Y.; Feng, G.; Zhang, J.; Karonen, M.; Sinkkonen, J.; Satyanandamurty, T.; Wu, J. Moluccensins R-Y, Limonoids from the Seeds of a Mangrove, Xylocarpus moluccensis. J. Nat. Prod. 2012, 75, 1277–1283. [Google Scholar] [CrossRef] [PubMed]
- Yang, W.; Kong, L.M.; Li, S.F.; Li, Y.; Zhang, Y.; He, H.P.; Hao, X.J. Five new mexicanolide type limonoids from Heynea trijuga. Nat. Prod. Bioprospect. 2012, 2, 145–149. [Google Scholar] [CrossRef]
- Lin, B.D.; Yuan, T.; Zhang, C.R.; Dong, L.; Zhang, B.; Wu, Y.; Yue, J.M. Structurally Diverse Limonoids from the Fruits of Swietenia mahagoni. J. Nat. Prod. 2009, 72, 2084–2090. [Google Scholar] [CrossRef] [PubMed]
- Sarigaputi, C.; Sommit, D.; Teerawatananond, T.; Pudhom, K. Weakly anti-inflammatory limonoids from the seeds of Xylocarpus rumphii. J. Nat. Prod. 2014, 77, 2037–2043. [Google Scholar] [CrossRef] [PubMed]
- Ohtani, I.; Kusumi, T.; Kashman, Y.; Kakisawa, H. High-field FT NMR application of Mosher’s method. The absolute configurations of marine terpenoids. J. Am. Chem. Soc. 1991, 113, 4092–4096. [Google Scholar] [CrossRef]
- Wu, J.; Yang, S.X.; Li, M.Y.; Feng, G.; Pan, J.Y.; Xiao, Q.; Sinkkonen, J.; Satyanandamurty, T. Limonoids and Tirucallane Derivatives from the Seeds of a Krishna Mangrove, Xylocarpus moluccensis. J. Nat. Prod. 2010, 73, 644–649. [Google Scholar] [CrossRef] [PubMed]
- Abdelgaleil, S.A.; Doe, M.; Morimoto, Y.; Nakatani, M. Rings B,D-seco limonoids from the leaves of Swietenia mahogani. Phytochemistry 2006, 67, 452–458. [Google Scholar] [CrossRef] [PubMed]
- Sakamoto, A.; Tanaka, Y.; Tanaka, R. Andirolides Q-V from the flower of andiroba (Carapa guianensis, Meliaceae). Fitoterapia 2013, 90, 20–29. [Google Scholar] [CrossRef] [PubMed]
- Jiang, Q.W.; Cheng, K.J.; Mei, X.L.; Qiu, J.G.; Zhang, W.J.; Xue, Y.Q.; Qin, W.M.; Yang, Y.; Zheng, D.W.; Chen, Y.; et al. Synergistic anticancer effects of triptolide and celastrol, two main compounds from thunder god vine. Oncotarget 2015, 6, 32790–32804. [Google Scholar] [CrossRef] [PubMed]
- Zhang, Q.; Liu, Z.L.; Mi, Z.Y.; Li, X.Y.; Jia, P.P.; Zhou, J.M.; Yin, X.; You, X.F.; Yu, L.Y.; Guo, F.; et al. High-throughput assay to identify inhibitors of Vpu-mediated down-regulationof cell surface BST-2. Antivir. Res. 2011, 91, 321–329. [Google Scholar] [CrossRef] [PubMed]
Figure 1.
Structures of compounds 1–29.
Figure 2.
(a) Selected 1H-1H COSY and HMBC correlations for compound 1 (measured in CDCl3); (b) Diagnostic NOE interactions for compound 1 (measured in CDCl3, crystal structure of X-ray diffraction).
Figure 2.
(a) Selected 1H-1H COSY and HMBC correlations for compound 1 (measured in CDCl3); (b) Diagnostic NOE interactions for compound 1 (measured in CDCl3, crystal structure of X-ray diffraction).

Figure 3.
Oak Ridge Thermal-Ellipsoid Plot Program (ORTEP) illustration of the X-ray structure of compound 1. Ellipsoids are given at the 30% probability level.
Figure 3.
Oak Ridge Thermal-Ellipsoid Plot Program (ORTEP) illustration of the X-ray structure of compound 1. Ellipsoids are given at the 30% probability level.
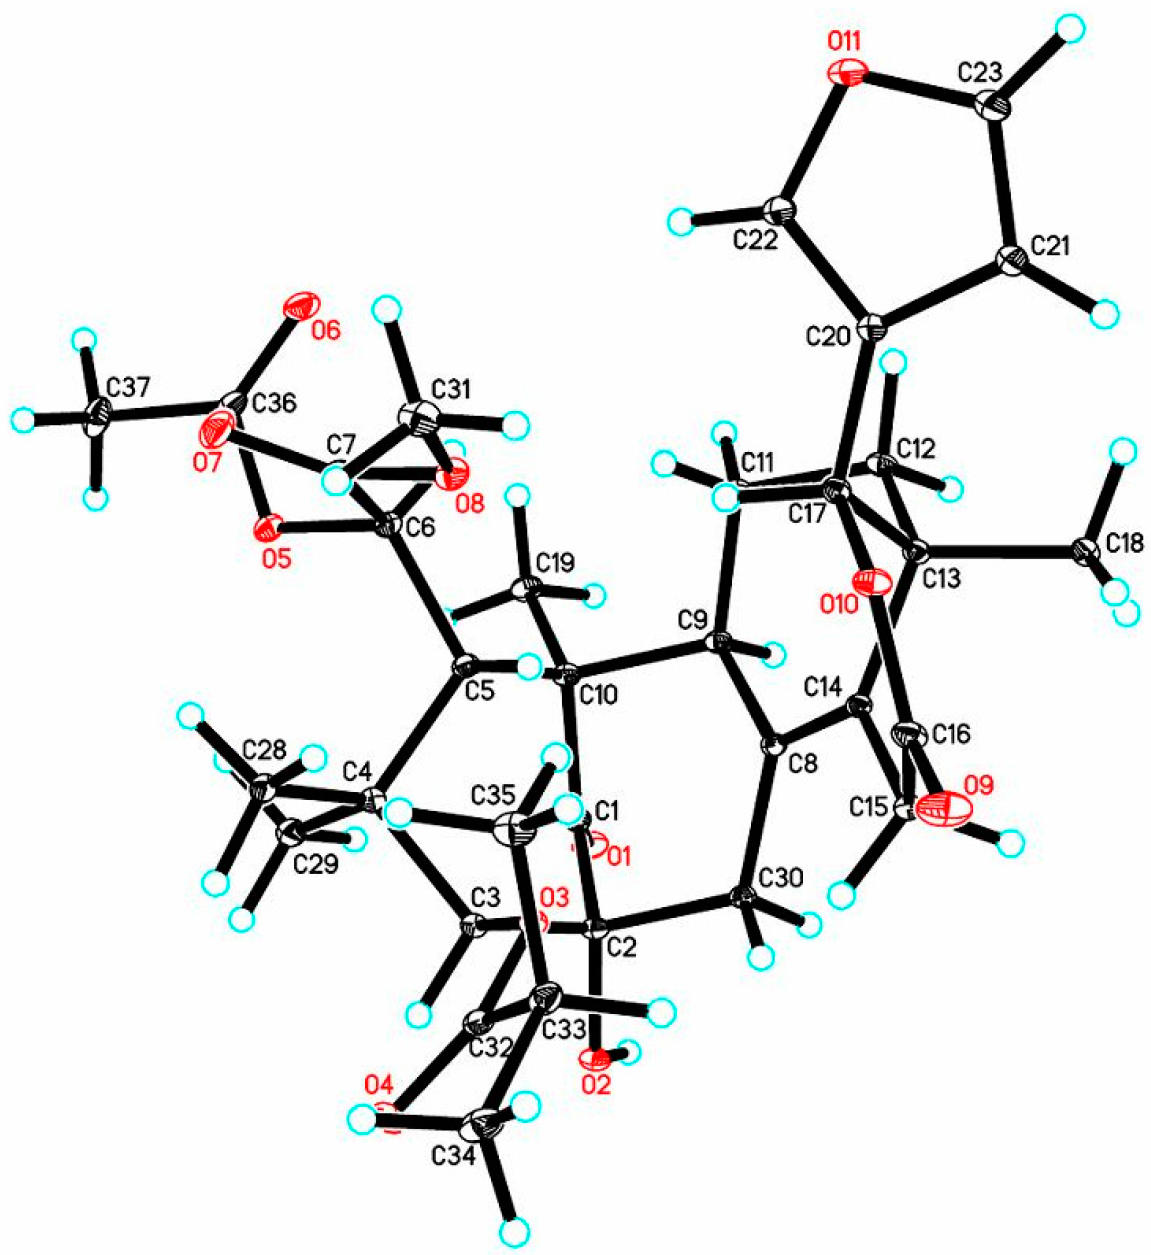
Figure 4.
Molecular Mechanics, Allinger Force Field version 2 (MM2)-optimized two possible 3D structures for compound 13. (a) The structure with a 14α-OH group; (b) The structure with a 14β-OH group.
Figure 4.
Molecular Mechanics, Allinger Force Field version 2 (MM2)-optimized two possible 3D structures for compound 13. (a) The structure with a 14α-OH group; (b) The structure with a 14β-OH group.

Figure 5.
(a) Selected 1H-1H COSY and HMBC correlations for compound 15 (measured in CDCl3); (b) Diagnostic NOE interactions for compound 15 (measured in CDCl3, MM2-optimized structure).
Figure 5.
(a) Selected 1H-1H COSY and HMBC correlations for compound 15 (measured in CDCl3); (b) Diagnostic NOE interactions for compound 15 (measured in CDCl3, MM2-optimized structure).

Figure 6.
(a) Comparison of the experimental electronic circular dichroism (ECD) spectra of compounds 15–19 with that of the known compound, thaixylomolin L, containing a Δ8,14 double bonds; (b) Comparison of the experimental ECD spectra of compound 21 with that of the known compound, thaixylomolin H, containing Δ8,9, Δ14,15 conjugated double bonds.

Figure 7.
(a) Selected 1H-1H COSY and HMBC correlations for compound 22 (measured in CDCl3); (b) Diagnostic NOE interactions for compound 22 (measured in CDCl3, MM2-optimized structure).
Figure 7.
(a) Selected 1H-1H COSY and HMBC correlations for compound 22 (measured in CDCl3); (b) Diagnostic NOE interactions for compound 22 (measured in CDCl3, MM2-optimized structure).
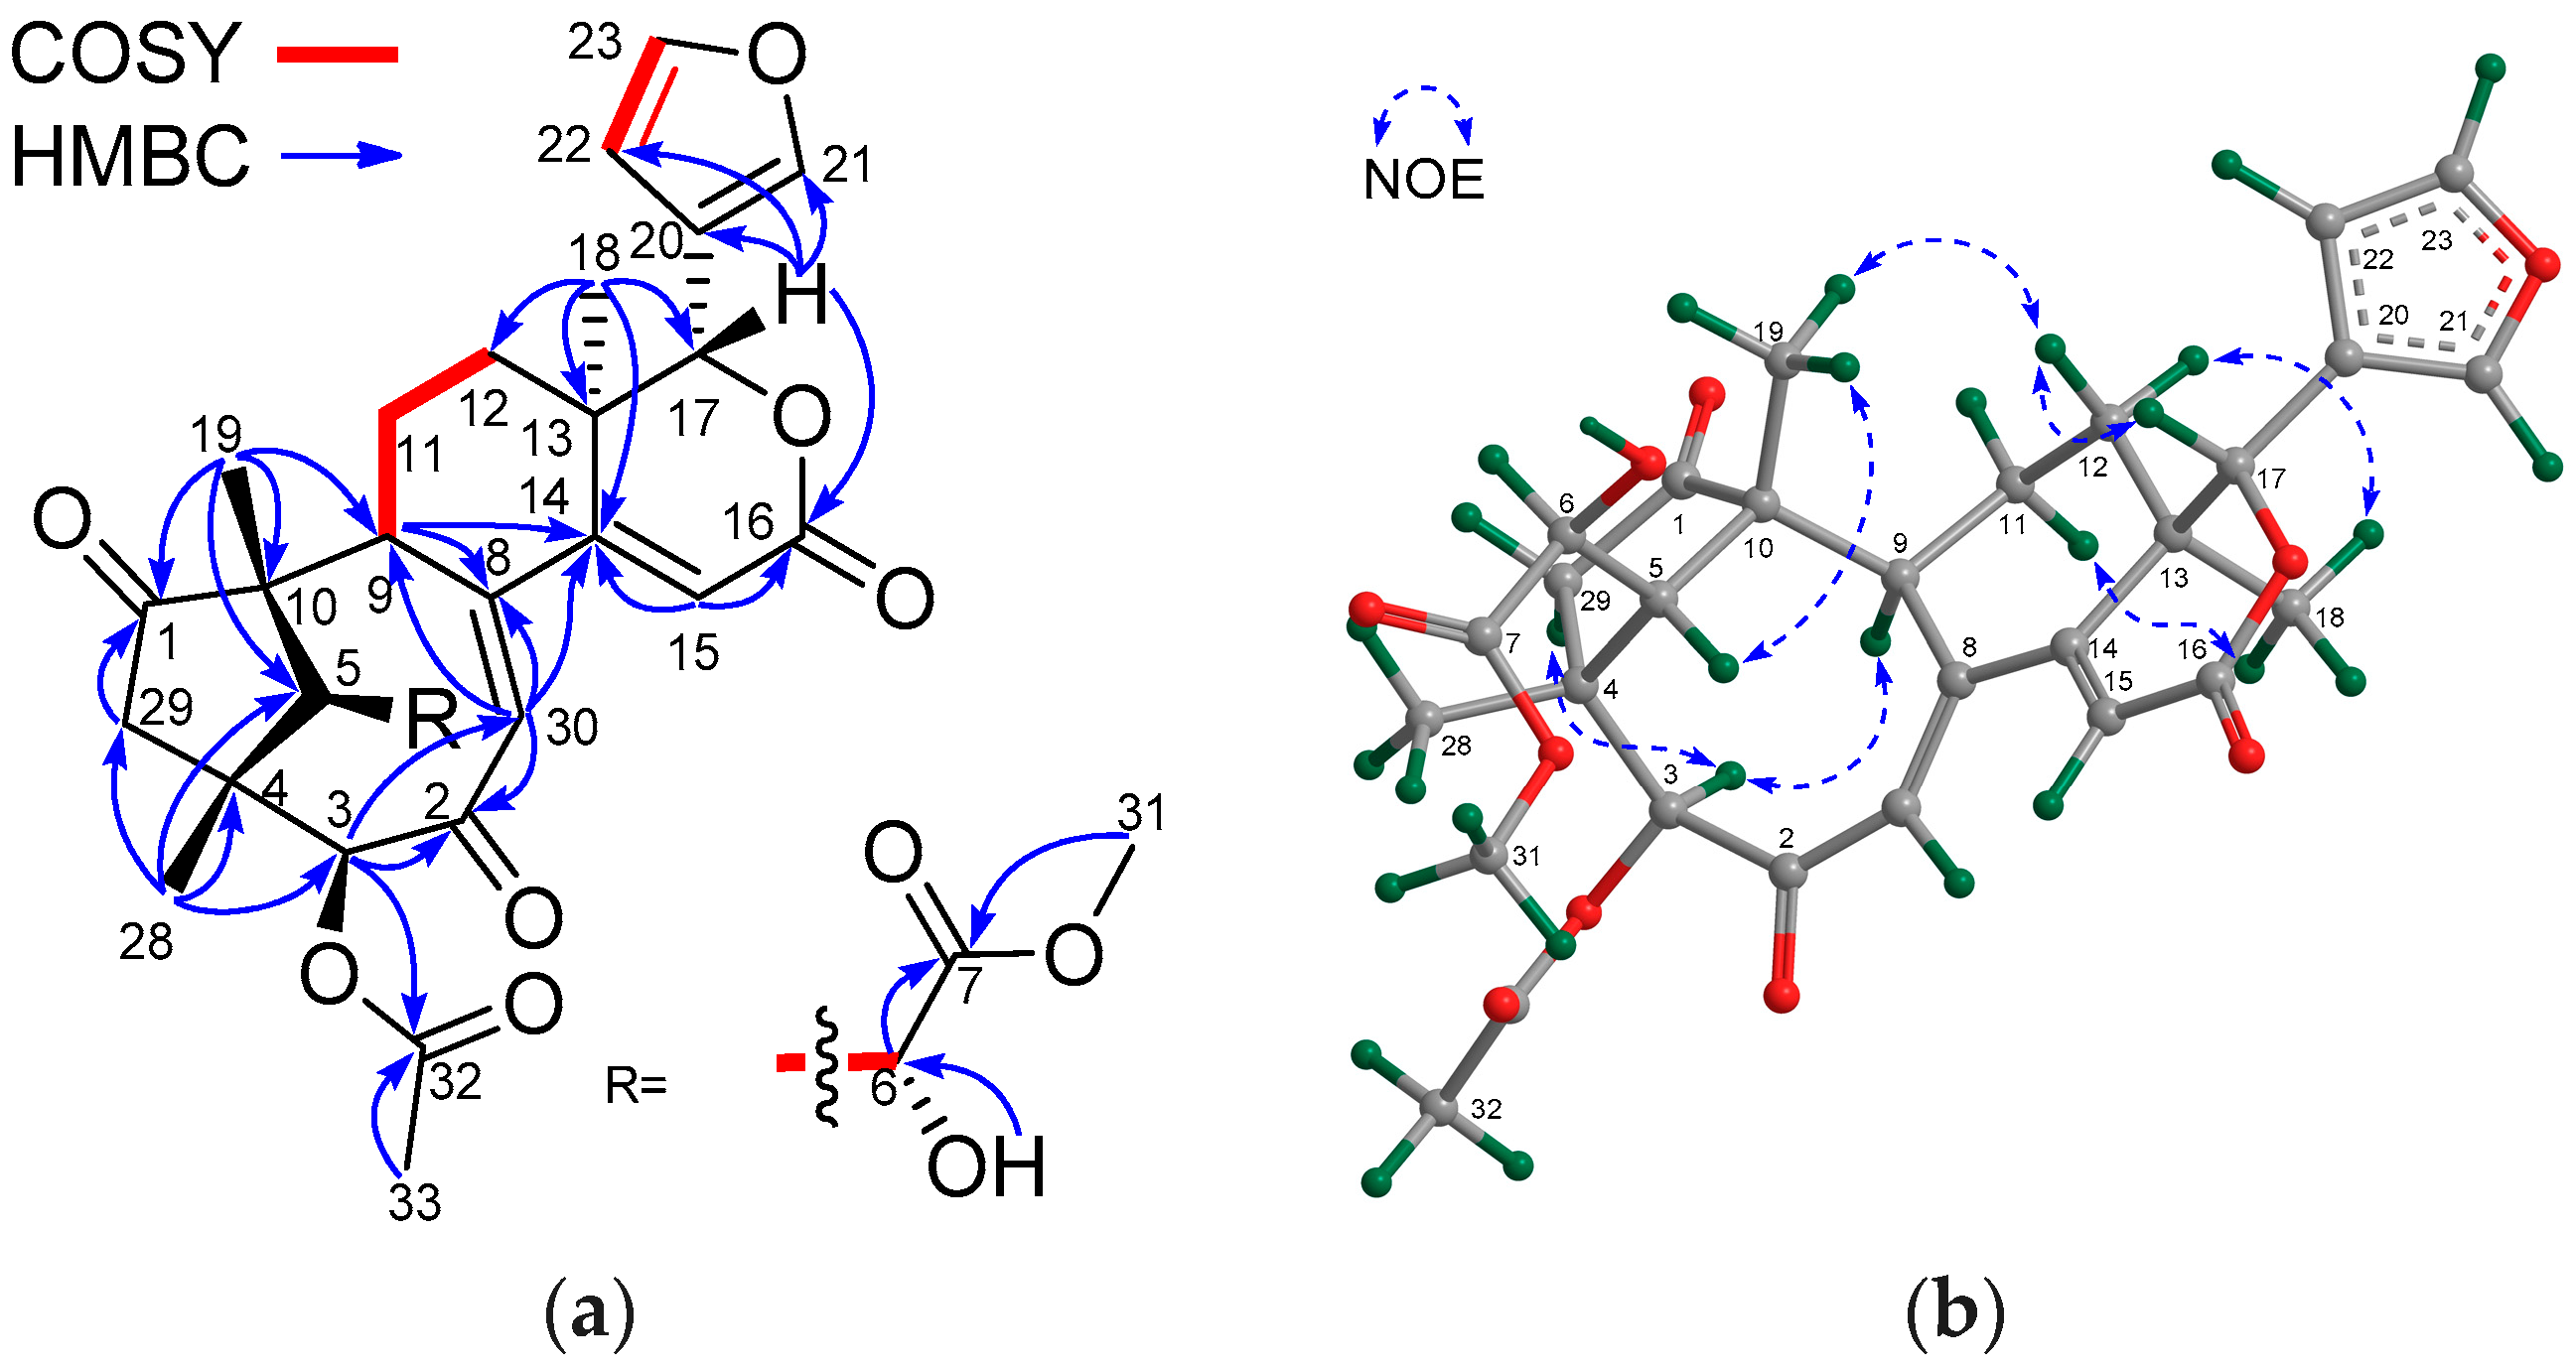
Figure 8.
(a) Comparison of the experimental ECD spectra of compounds 22, 23 with that of the known compound, trangmolin F; (b) Δδ values (Δδ [ppm] = [δS − δR]) obtained for the (6S) and (6R)-MTPA esters of 23. MTPA: α-methoxy-α-(trifluoromethyl)phenylacetyl.
Figure 8.
(a) Comparison of the experimental ECD spectra of compounds 22, 23 with that of the known compound, trangmolin F; (b) Δδ values (Δδ [ppm] = [δS − δR]) obtained for the (6S) and (6R)-MTPA esters of 23. MTPA: α-methoxy-α-(trifluoromethyl)phenylacetyl.

Figure 9.
(a) Selected 1H-1H COSY and HMBC correlations for compound 24 (measured in CDCl3); (b) Diagnostic NOE interactions for compound 24 (measured in CDCl3, MM2-optimized structure).
Figure 9.
(a) Selected 1H-1H COSY and HMBC correlations for compound 24 (measured in CDCl3); (b) Diagnostic NOE interactions for compound 24 (measured in CDCl3, MM2-optimized structure).
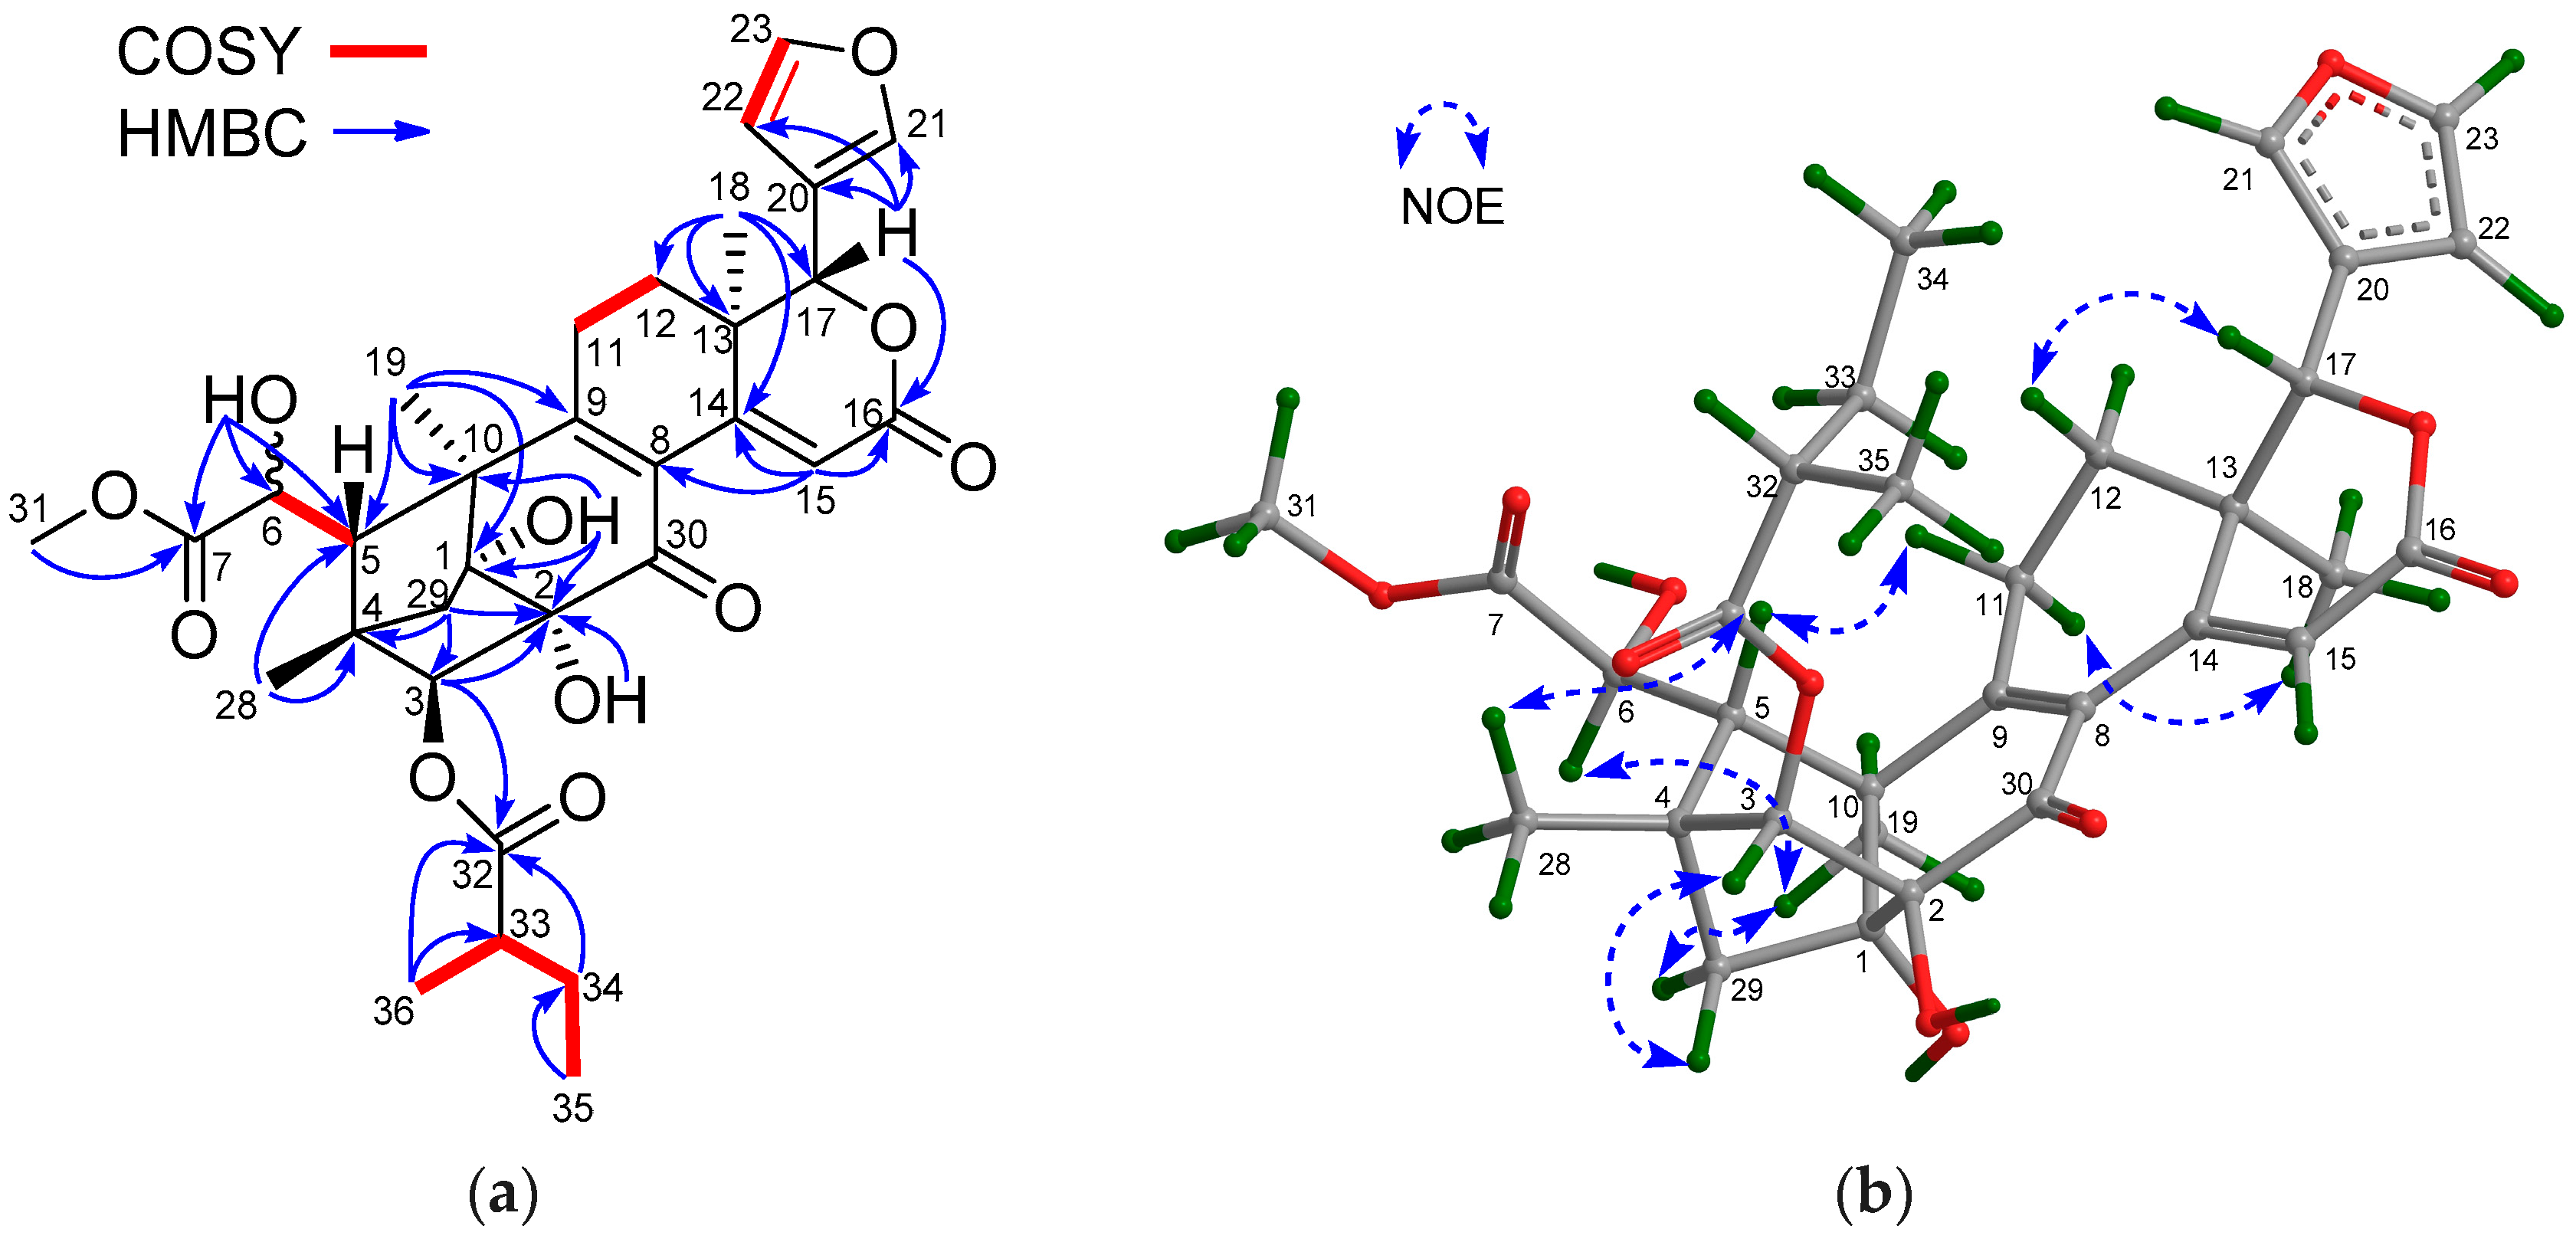
Figure 10.
(a) Selected 1H-1H COSY and HMBC correlations for compound 26 (measured in CDCl3); (b) Diagnostic NOE interactions for compound 26 (measured in CDCl3, MM2-optimized structure); (c) Comparison of the experimental ECD spectrum of compound 26 with that of the known compound, 2-O-acetyl-2-dehydroxy-12-deacetylxyloccensin U.
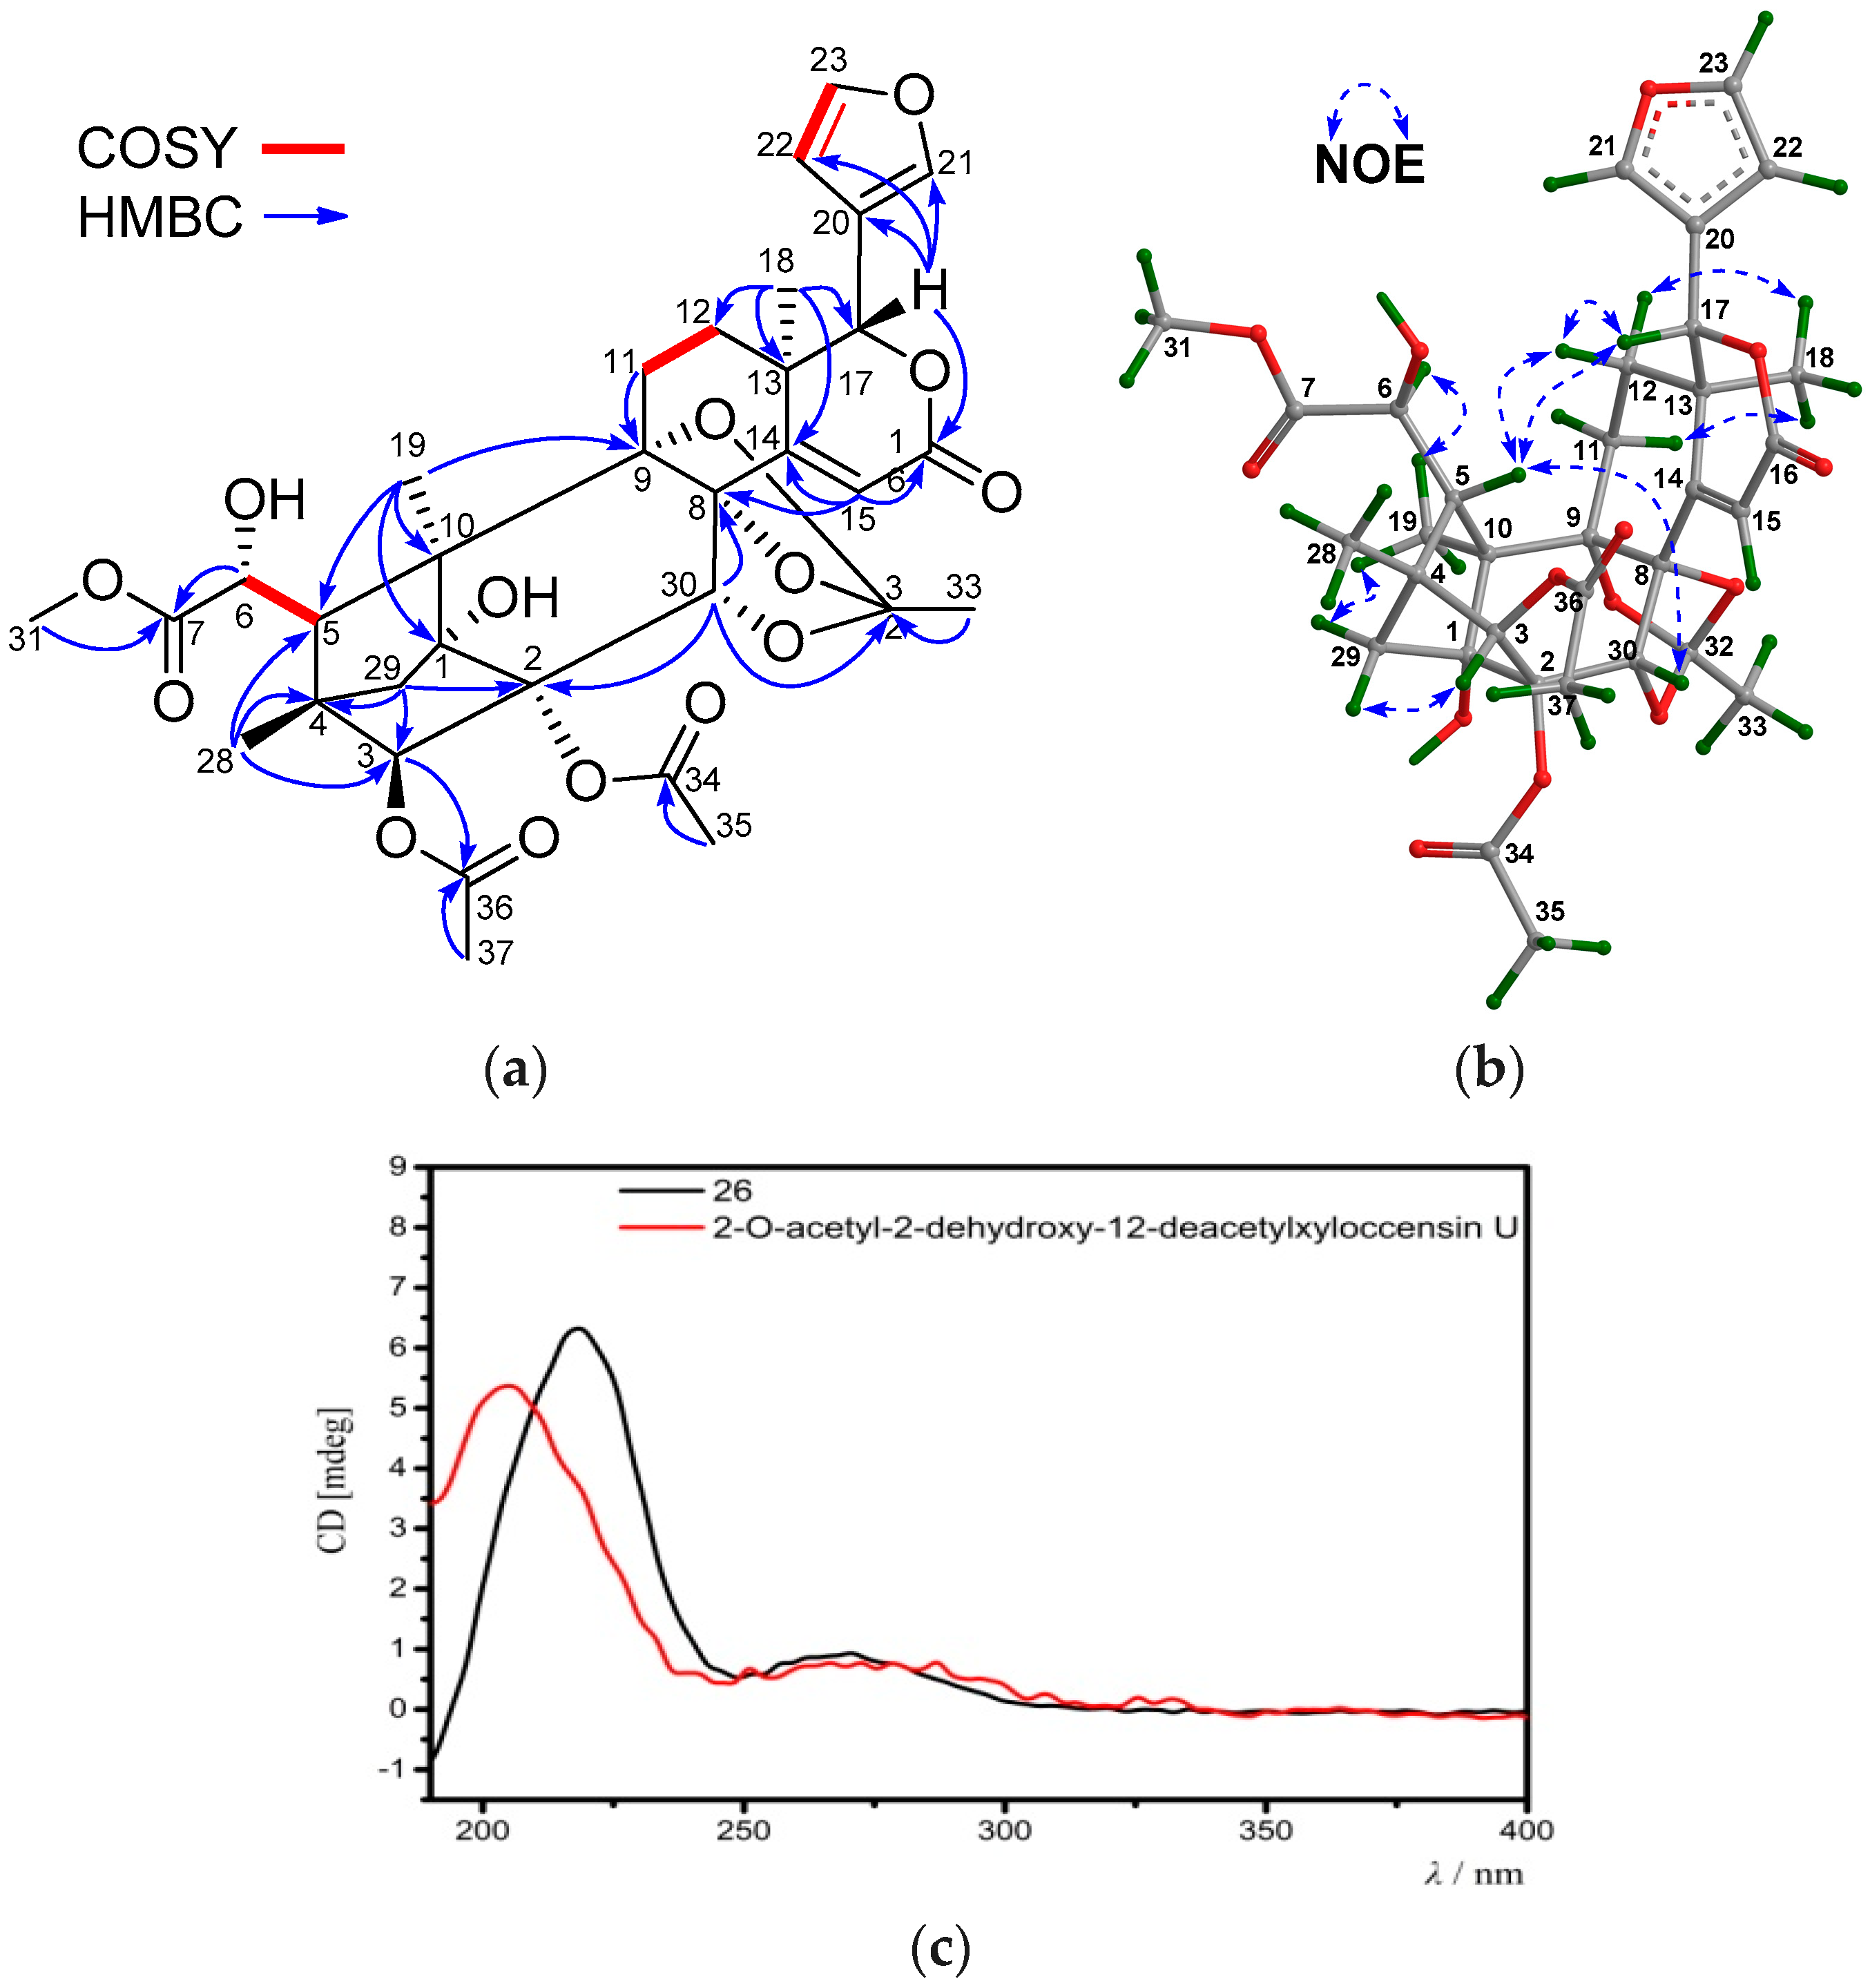
Figure 11.
(a) Selected 1H-1H COSY and HMBC correlations for compound 28 (measured in CDCl3); (b) Diagnostic NOE interactions for compound 28 (measured in CDCl3, MM2-optimized structure).
Figure 11.
(a) Selected 1H-1H COSY and HMBC correlations for compound 28 (measured in CDCl3); (b) Diagnostic NOE interactions for compound 28 (measured in CDCl3, MM2-optimized structure).


Table 1.
1H NMR spectroscopic data (400 MHz, in CDCl3) of compounds 1–7 (δ in ppm, J in Hz).
| Position | 1 | 2 | 3 | 4 | 5 | 6 | 7 |
|---|---|---|---|---|---|---|---|
| 3 | 4.97 s | 4.93 s | 5.04 s | 5.12 s | 5.06 s | 5.19 s | 5.52 s |
| 5 | 3.35 s | 3.13 s | 3.28 s | 3.47 s | 3.45 s | 3.09 s | 3.10 br d (10.8) |
| 6α | 5.47 s | 4.52 br s | 4.54 s | 5.44 s | 5.47 s | 4.52 s | 2.32 dd (16.5, 1.6) |
| 6β | 2.42 dd (16.5, 10.7) | ||||||
| 9 | 2.10 br s | 2.14 br s | 2.46 br s | 2.49 br d (6.0) | 2.42 br s | 2.17 br s | 2.08 m |
| 11α | 1.80 m | 1.84 m | 1.85 m | 1.84 m | 1.84 m | 1.82 m | 1.74 m |
| 11β | 1.92m | 1.84 m | 1.91 m | 1.99 m | 1.94 m | 1.82 1 | 1.81 m |
| 12β | 1.81 m | 1.72 m | 1.74 m | 1.86 m | 1.85 m | 1.71 m | 1.75 m |
| 12α | 1.18 m | 1.24 m | 1.23 m | 1.13 m | 1.22 m | 1.17 m | 1.13 m |
| 15α | 3.46 dt (20.8, 2.8) | 3.47 dt (20.8, 3.2) | 3.64 dd (20.8, 3.2) | 5.23 d (2.4) | 3.65 dd (20.8, 3.2) | 3.51 dt (20.8, 3.2) | 3.52 dt (20.8, 2.8) |
| 15β | 3.79 d (20.8) | 3.77 d (20.8) | 3.85 br d (20.8) | 3.81 br d (20.8) | 3.88 br d (20.8) | 3.88 d (20.8) | |
| 17 | 5.58 s | 5.53 s | 5.50 s | 5.50 s | 5.57 s | 5.56 s | 5.73 s |
| 18 | 1.05 s | 1.03 s | 1.09 s | 1.06 s | 1.12 s | 1.05 s | 1.09 s |
| 19 | 1.27 s | 1.52 s | 1.51 s | 1.26 s | 1.26 s | 1.49 s | 1.23 s |
| 21 | 7.52 br d (0.8) | 7.47 br d (0.8) | 7.50 br s | 7.59 t (0.8) | 7.57 br s | 7.47 br d (0.8) | 7.54 br s |
| 22 | 6.45 br d (1.2) | 6.41 br d (0.8) | 6.42 br d (1.2) | 6.50 br d (1.2) | 6.48 br d (1.2) | 6.41 br t (0.8) | 6.47 br d (1.2) |
| 23 | 7.44 t (1.6) | 7.43 t (1.6) | 7.44 t (1.6) | 7.45 t (1.6) | 7.44 t (1.6) | 7.43 t (1.6) | 7.42 br d (1.6) |
| 28 | 0.84 s | 0.78 s | 0.78 s | 0.82 s | 0.82 s | 0.79 s | 0.71 s |
| 29 | 1.04 s | 1.05 s | 1.06 s | 1.09 s | 1.05 s | 1.21 s | 0.97 s |
| 30β | 3.23 d (14.4) | 3.21 d (14.8) | 4.69 s | 5.00 s | 4.69 s | 3.72 d (14.4) | 3.47 d (14.8) |
| 30α | 1.79 1 | 1.78 m | 2.06 br d (14.4) | 2.07 1 | |||
| 7-OMe-31 | 3.73 s | 3.83 s | 3.83 br s | 3.75 s | 3.76 s | 3.84 s | 3.70 s |
| 3-OAcyl | |||||||
| 33 | 2.64 m | 2.45 m | 2.38 m | 2.27 m | 2.17 s | 2.20 s | 2.22 s |
| 2.43 m | |||||||
| 34 | 1.22 d (7.2) | 1.20 t (7.6) | 1.50 m | 1.49 m | 6-Acyl | 2-Acyl | 2-Acyl |
| 1.80 m | 1.80 m | ||||||
| 35 | 1.24 d (7.2) | 0.99 t (7.2) | 0.95 t (7.2) | 2.18 s | 2.13 s | 2.12 s | |
| 36 | 6-Acyl | 1.19 d (7.2) | 1.20 d (7.2) | ||||
| 37 | 2.19 s | 6-Acyl | |||||
| 38 | 2.18 s | ||||||
| 2-OH | 4.12 br s | 4.16 s | 4.62 s | 4.22 s | 4.57 br s | ||
| 6-OH | 2.80 br s | 2.85 s | 2.80 br s | ||||
| 15-OH | 3.66 br s | ||||||
| 30-OH | 2.77 br s | 2.58 br s | 2.67 br s |
1 Overlapped signals assigned by 1H-1H COSY, HSQC, and HMBC spectra without designating multiplicity.
Table 2.
13C NMR spectroscopic data (100 MHz, in CDCl3) of compounds 1–7 (δ in ppm).
| Position | 1 | 2 | 3 | 4 | 5 | 6 | 7 |
|---|---|---|---|---|---|---|---|
| 1 | 216.7 qC | 217.2 qC | 213.8 qC | 212.7 qC | 213.1 qC | 209.4 qC | 209.6 qC |
| 2 | 78.0 qC | 77.8 qC | 79.4 qC | 79.3 qC | 79.5 qC | 85.6 qC | 85.8 qC |
| 3 | 86.1 CH | 86.7 CH | 86.3 CH | 85.2 CH | 86.4 CH | 83.4 CH | 81.3 CH |
| 4 | 39.7 qC | 39.5 qC | 39.9 qC | 39.9 qC | 39.8 qC | 40.4 qC | 40.1 qC |
| 5 | 44.2 CH | 45.1 CH | 45.7 CH | 44.7 CH | 44.8 CH | 44.7 CH | 40.7 CH |
| 6 | 72.7 CH | 73.1 CH | 73.0 CH | 72.6 CH | 72.7 CH | 73.2 CH | 33.3 CH2 |
| 7 | 171.1 qC | 175.2 qC | 175.1 qC | 171.5 qC | 171.2 qC | 175.2 qC | 174.1 qC |
| 8 | 125.7 qC | 126.6 qC | 128.6 qC | 135.4 qC | 127.6 qC | 126.2 qC | 125.5 qC |
| 9 | 52.9 CH | 53.3 CH | 47.4 CH | 46.0 CH | 46.9 CH | 53.1 CH | 52.3 CH |
| 10 | 52.4 qC | 52.4 qC | 51.8 qC | 52.5 qC | 51.9 qC | 53.4 qC | 53.2 qC |
| 11 | 18.7 CH2 | 18.9 CH2 | 18.4 CH2 | 17.9 CH2 | 18.2 CH2 | 18.9 CH2 | 18.7 CH2 |
| 12 | 29.4 CH2 | 29.6 CH2 | 29.1 CH2 | 27.8 CH2 | 28.8 CH2 | 29.5 CH2 | 29.1 CH2 |
| 13 | 38.3 qC | 38.2 qC | 38.5 qC | 39.4 qC | 38.6 qC | 38.2 qC | 38.3 qC |
| 14 | 133.5 qC | 132.6 qC | 137.8 qC | 140.1 qC | 138.5 qC | 133.2 qC | 133.4 qC |
| 15 | 33.4 CH2 | 33.6 CH2 | 32.8 CH2 | 65.4 CH | 32.8 CH2 | 33.6 CH2 | 33.5 CH2 |
| 16 | 169.2 qC | 169.3 qC | 168.9 qC | 173.6 qC | 169.2 qC | 169.3 qC | 169.9 qC |
| 17 | 80.8 CH | 80.8 CH | 80.7 CH | 81.1 CH | 80.6 CH | 80.6 CH | 80.3 CH |
| 18 | 18.0 CH3 | 18.3 CH3 | 17.7 CH3 | 16.1 CH3 | 17.6 CH3 | 18.4 CH3 | 18.1 CH3 |
| 19 | 16.7 CH3 | 17.6 CH3 | 17.6 CH3 | 17.0 CH3 | 16.8 CH3 | 17.8 CH3 | 16.9 CH3 |
| 20 | 120.5 qC | 120.6 qC | 120.5 qC | 119.8 qC | 120.3 qC | 120.6 qC | 120.5 qC |
| 21 | 141.5 CH | 141.1 CH | 141.2 CH | 141.9 CH | 141.7 CH | 141.2 CH | 141.8 CH |
| 22 | 109.8 CH | 109.7 CH | 109.7 CH | 109.8 CH | 109.9 CH | 109.7 CH | 109.9 CH |
| 23 | 143.1 CH | 143.2 CH | 143.2 CH | 143.2 CH | 143.1 CH | 143.2 CH | 142.9 CH |
| 28 | 22.5 CH3 | 22.6 CH3 | 22.8 CH3 | 22.5 CH3 | 22.7 CH3 | 22.6 CH3 | 22.8 CH3 |
| 29 | 22.7 CH3 | 22.6 CH3 | 22.7 CH3 | 22.7 CH3 | 22.6 CH3 | 23.5 CH3 | 21.1 CH3 |
| 30 | 44.4 CH2 | 44.6 CH2 | 73.0 CH | 73.6 CH | 72.9 CH | 40.1 CH2 | 40.3 CH2 |
| 31 | 53.2 CH3 | 53.2 CH3 | 53.3 CH3 | 53.3 CH3 | 53.3 CH3 | 53.3 CH3 | 52.2 CH3 |
| 3-Acyl | 3-Acyl | 3-Acyl | 3-Acyl | 3-Acyl | 3-Acyl | 3-Acyl | |
| 32 | 175.9 qC | 173.3 qC | 175.5 qC | 175.3 qC | 169.7 qC | 169.6 qC | 169.6 qC |
| 33 | 34.5 CH | 28.0 CH2 | 41.2 CH | 41.8 CH | 21.2 CH3 | 21.2 CH3 | 21.3 CH3 |
| 6-Acyl | 2-Acyl | 2-Acyl | |||||
| 34 | 19.9 CH3 | 9.4 CH3 | 26.1 CH2 | 26.5 CH2 | 169.7 qC | 169.1 qC | 169.0 qC |
| 35 | 18.4 CH3 | 11.6 CH3 | 11.8 CH3 | 21.0 CH3 | 21.8 CH3 | 21.7 CH3 | |
| 36 | 17.5 CH3 | 17.5 CH3 | |||||
| 6-Acyl | 6-Acyl | ||||||
| 37 | 169.7 qC | 169.8 qC | |||||
| 38 | 21.0 CH3 | 21.0 CH3 |
Table 3.
1H NMR spectroscopic data (400 MHz) of compounds 8–14 (δ in ppm, J in Hz).
| Position | 8 1 | 9 1 | 10 1 | 11 1 | 12 2 | 13 1 | 14 1 |
|---|---|---|---|---|---|---|---|
| 2 | 3.02 t (6.0) | ||||||
| 3 | 5.51 s | 4.26 d (6.0) | 4.83 s | 4.99 s | 4.55 s | 4.76 s | 4.55 s |
| 5 | 2.98 s | 2.94 br s | 3.12 s | 3.20 dd (9.2, 3.2) | 3.22 s | 3.49 s | 2.67 s |
| 6 | 5.51 s | 5.47 s | 4.38 s | 2.32 m | 4.40 d (4.8) | 5.55 s | 4.20 br s |
| 2.35 m | |||||||
| 9 | 2.29 dt (12.4, 2.8) | 2.29 m | 1.71 t (13.2) | 2.81 m | 2.30 3 | ||
| 11α | 2.38 m | 2.35 m | 1.84 m | 1.77 m | 1.68 m | 1.78 m | 1.83 m |
| 11β | 2.38 3 | 2.35 3 | 1.38 qd (12.8, 4.4) | 1.56 m | 1.33 m | 2.18 m | 2.30 m |
| 12β | 1.46 m | 1.45 m | 2.00 m | 1.93 m | 1.85 d (14.0) | 1.44 m | 1.95 m |
| 12α | 1.65 m | 1.61 m | 1.24 td (13.6, 4.4) | 1.29 m | 1.19 m | 2.05 m | 1.41 m |
| 15α | 5.90 s | 5.89 s | 6.28 s | 6.32 s | 5.99 s | 2.93 d (18.0) | 6.08 s |
| 15β | 3.05 d (18.0) | ||||||
| 17 | 5.10 s | 5.09 s | 5.12 s | 5.16 s | 5.25 s | 5.61 s | 4.84 s |
| 18 | 1.01 s | 1.00 s | 1.06 s | 1.06 s | 1.16 s | 1.05 s | 1.24 s |
| 19 | 1.30 s | 1.17 s | 1.54 s | 1.28 s | 1.29 s | 1.28 s | 1.43 s |
| 21 | 7.50 br s | 7.49 br s | 7.52 br s | 7.51 br s | 7.85 br s | 7.76 br s | 7.48 br t (0.8) |
| 22 | 6.45 br d (1.2) | 6.45 br d (1.2) | 6.50 br d (1.2) | 6.49 br d (1.2) | 6.60 br d (1.2) | 6.48 br s | 6.42 br d (1.2) |
| 23 | 7.46 t (1.6) | 7.45 t (1.6) | 7.45 t (1.6) | 7.44 t (1.6) | 7.70 t (1.6) | 7.45 br s | 7.42 t (1.6) |
| 28 | 1.20 s | 1.17 s | 0.81 s | 0.74 s | 0.69 s | 0.92 s | 0.84 s |
| 29 | 1.01 s | 1.13 s | 1.09 s | 0.82 s | 1.04 s | 1.07 s | 1.59 s |
| 30β | 3.55 d (17.6) | 3.29 d (17.6) | 6.29 d (4.4) | 6.31 d (4.4) | 3.38 d (15.6) | 5.60 d (2.0) | 5.49 s |
| 30α | 2.42 br d (17.6) | 2.52 br d (17.6) | 2.31 d (15.6) | ||||
| 31 | 3.74 s | 3.75 s | 3.84 s | 3.69 s | 3.65 s | 3.73 s | 3.88 s |
| 3-Acyl | 6-Acyl | 3-Acyl | 3-Acyl | 3-Acyl | 3-Acyl | 3-Acyl | |
| 33 | 2.21 s | 2.07 s | 2.22 s | 2.57 m | 2.54 m | 2.11 s | 2.02 s |
| 34 | 6-Acyl | 1.61 m | 1.60 m | 6-Acyl | 30-Acyl | ||
| 1.81 m | 1.54 m | ||||||
| 35 | 2.11 s | 1.04 t (7.2) | 0.93 t (7.2) | 2.19 s | 2.59 m | ||
| 36 | 1.25 d (6.8) | 1.12 d (6.8) | 1.13 d (6.8) | ||||
| 37 | 1.17 d (6.8) | ||||||
| 1-OH | 4.55 3 | ||||||
| 2-OH | 4.07 br s | 5.08 s | 4.17 br s | 4.11 br s | |||
| 6-OH | 2.97 br s | 5.58 d (4.8) | 2.93 s | ||||
| 8-OH | 5.05 s |
1 Recorded in CDCl3; 2 Recorded in DMSO-d6; 3 Overlapped signals assigned by 1H-1H COSY, HSQC, and HMBC spectra without designating multiplicity.
Table 4.
13C NMR spectroscopic data (100 MHz) of compounds 8–14 (δ in ppm).
| Position | 8 1 | 9 1 | 10 1 | 11 1 | 12 2 | 13 1 | 14 1 |
|---|---|---|---|---|---|---|---|
| 1 | 211.1 qC | 212.5 qC | 212.0 qC | 212.7 qC | 215.9 qC | 213.9 qC | 108.4 qC |
| 2 | 76.9 qC | 50.5 CH | 77.5 qC | 77.4 qC | 76.2 qC | 76.9 qC | 81.1 qC |
| 3 | 81.6 CH | 76.7 CH | 87.2 CH | 85.5 CH | 86.5 CH | 85.8 CH | 85.6 CH |
| 4 | 39.6 qC | 39.7 qC | 39.9 qC | 39.7 qC | 39.5 qC | 39.4 qC | 38.8 qC |
| 5 | 55.0 CH | 55.4 CH | 44.8 CH | 40.8 CH | 44.6 CH | 44.8 CH | 44.6 CH |
| 6 | 69.8 CH | 70.2 CH | 72.0 CH | 32.7 CH2 | 71.2 CH | 72.4 CH | 71.7 CH |
| 7 | 170.6 qC | 170.9 qC | 175.5 qC | 173.5 qC | 175.7 qC | 171.0 qC | 175.9 qC |
| 8 | 126.1 qC | 127.1 qC | 134.7 qC | 134.1 qC | 71.3 qC | 138.8 qC | 80.0 qC |
| 9 | 148.4 qC | 150.3 qC | 55.3 CH | 53.8 CH | 61.6 CH | 53.3 CH | 51.5 CH |
| 10 | 51.9 qC | 51.2 qC | 53.2 qC | 52.6 qC | 48.4 qC | 49.8 qC | 43.1 qC |
| 11 | 22.3 CH2 | 22.2 CH2 | 22.5 CH2 | 21.5 CH2 | 20.7 CH2 | 20.3 CH2 | 15.6 CH2 |
| 12 | 29.7 CH2 | 29.7 CH2 | 33.3 CH2 | 32.4 CH2 | 32.5 CH2 | 28.3 CH2 | 25.2 CH2 |
| 13 | 36.8 qC | 36.8 qC | 37.6 qC | 37.5 qC | 37.8 qC | 41.0 qC | 38.8 qC |
| 14 | 156.4 qC | 157.4 qC | 160.7 qC | 160.0 qC | 168.3 qC | 72.9 qC | 158.3 qC |
| 15 | 111.6 CH | 110.6 CH | 113.4 CH | 113.2 CH | 114.6 CH2 | 38.9 CH2 | 118.4 CH |
| 16 | 165.2 qC | 165.7 qC | 164.8 qC | 164.6 qC | 164.3 qC | 168.4 qC | 163.1 qC |
| 17 | 80.6 CH | 80.7 CH | 79.7 CH | 79.7 CH | 78.5 CH | 77.2 CH | 81.4 CH |
| 18 | 16.2 CH3 | 16.1 CH3 | 22.5 CH3 | 21.9 CH3 | 22.6 CH3 | 15.7 CH3 | 19.5 CH3 |
| 19 | 18.2 CH3 | 18.3 CH3 | 16.2 CH3 | 15.6 CH3 | 18.5 CH3 | 15.7 CH3 | 22.1 CH3 |
| 20 | 119.8 qC | 119.9 qC | 120.0 qC | 120.1 qC | 120.0 qC | 120.1 qC | 119.9 qC |
| 21 | 141.2 CH | 141.2 CH | 141.4 CH | 141.5 CH | 142.3 CH | 141.7 CH | 141.3 CH |
| 22 | 109.9 CH | 110.0 CH | 110.2 CH | 110.2 CH | 110.6 CH | 109.8 CH | 109.9 CH |
| 23 | 143.2 CH | 143.1 CH | 143.3 CH | 143.2 CH | 143.2 CH | 143.1 CH | 143.0 CH |
| 28 | 26.3 CH3 | 25.6 CH3 | 21.4 CH3 | 21.5 CH3 | 21.7 CH3 | 22.0 CH3 | 24.0 CH3 |
| 29 | 28.0 CH3 | 28.3 CH3 | 23.0 CH3 | 20.8 CH3 | 24.8 CH3 | 22.1 CH3 | 24.5 CH3 |
| 30 | 39.2 CH2 | 28.8 CH2 | 133.5 CH | 133.0 CH | 45.9 CH2 | 130.2 CH | 74.9 CH |
| 31 | 53.0 CH3 | 52.8 CH3 | 53.4 CH3 | 52.1 CH3 | 52.0 CH3 | 53.4 CH3 | 53.4 CH3 |
| 3-Acyl | 6-Acyl | 3-Acyl | 3-Acyl | 3-Acyl | 3-Acyl | 3-Acyl | |
| 32 | 170.2 qC | 169.2 qC | 169.9 qC | 176.0 qC | 174.7 qC | 170.7 qC | 171.5 qC |
| 33 | 20.9 CH3 | 20.5 CH3 | 20.7 CH3 | 41.4 CH | 40.4 CH | 20.4 CH | 20.7 CH3 |
| 6-Acyl | 6-Acyl | 30-Acyl | |||||
| 34 | 169.1 qC | 26.9 CH2 | 26.4 CH | 169.6 qC | 176.0 qC | ||
| 35 | 20.5 CH3 | 11.9 CH3 | 11.2 CH3 | 21.0 CH3 | 34.2 CH | ||
| 36 | 17.0 CH3 | 16.5 CH3 | 19.0 CH3 | ||||
| 37 | 19.1 CH3 |
1 Recorded in CDCl3; 2 Recorded in DMSO-d6.
Table 5.
1H NMR spectroscopic data (400 MHz) of compounds 15–21 (δ in ppm, J in Hz).
| Position | 15 1 | 16 1 | 17 1 | 18 1 | 19 1 | 20 2 | 21 1 |
|---|---|---|---|---|---|---|---|
| 2 | 5.77 s | ||||||
| 3 | 4.87 s | 4.86 s | 4.94 s | 5.01 s | 5.02 s | 4.97 s | |
| 5 | 2.24 br s | 2.22 s | 2.13 3 | 2.24 dd (11.2, 2.4) | 2.26 3 | 2.87 s | 2.19 br s |
| 6 | 4.36 br s | 4.37 br d (1.6) | 4.33 s | 2.27 dd (16.0, 2.8) | 2.28 dd (16.0, 2.8) | 4.83 br d (3.6) | 4.42 s |
| 2.43 dd (16.0, 11.2) | 2.43 dd (16.0, 11.2) | ||||||
| 9 | 2.52 m | 2.51 m | 2.51 m | 2.45 m | 2.46 m | 2.49 dd (6.4, 2.8) | |
| 11α | 1.81 m | 1.80 m | 1.84 m | 1.77 m | 1.79 m | 2.20 3 | 2.25 m |
| 11β | 1.40 m | 1.40 m | 1.40 m | 1.46 m | 1.48 m | 2.07 m | 2.03 dd (18.8, 4.0) |
| 12β | 1.58 m | 1.53 m | 1.60 m | 1.54 m | 1.55 m | 1.76 m | 1.36 m |
| 12α | 1.43 m | 1.43 m | 1.47 m | 1.43 m | 1.44 m | 1.27 m | 1.51 overlapped |
| 15α | 3.71 3 | 3.73 dd (20.0,3.2) | 3.43 dd (19.2, 1.6) | 3.43 br d (18.4) | 3.43 dd (19.6, 1.2) | 5.72 br s | 6.55 s |
| 15β | 4.07 dd (20.0, 2.8) | 4.09 dd (20.0,3.2) | 3.98 dd (19.2, 3.2) | 3.94 ddd (19.6, 3.6, 2.0) | 3.93 ddd (19.6, 3.6, 2.0) | ||
| 17 | 5.13 s | 5.06 s | 5.18 s | 5.17 s | 5.14 s | 5.66 s | 5.09 s |
| 18 | 1.05 s | 1.04 s | 1.04 s | 1.01 s | 1.01 s | 1.38 s | 1.00 s |
| 19 | 1.34 s | 1.34 s | 1.29 s | 1.01 s | 1.01 s | 1.45 s | 1.33 s |
| 21 | 7.45 br s | 7.43 br s | 7.46 s | 7.47 br s | 7.47 br s | 7.64 br s | 7.49 br s |
| 22 | 6.41 br d (1.2) | 6.41 br d (0.8) | 6.43 br d (0.8) | 6.43 br d (1.2) | 6.43 br d (0.8) | 6.58 br d (1.2) | 6.45 br d (1.2) |
| 23 | 7.43 t (1.6) | 7.42 t (1.6) | 7.43 t (1.6) | 7.42 t (1.6) | 7.42 t (1.6) | 7.60 t (1.6) | 7.44 t (1.6) |
| 28 | 1.19 s | 1.20 s | 1.20 s | 1.00 s | 0.99 s | 1.01 s | 1.13 s |
| 29pro-R | 1.77 d (13.2) | 1.80 d (12.8) | 1.97 d (12.6) | 1.99 d (12.8) | 1.98 d (12.4) | 2.21 d (11.2) | 2.35 d (12.8) |
| 29pro-S | 2.43 d (13.2) | 2.45 d (12.8) | 2.31 d (12.6) | 2.15 d (12.8) | 2.15 d (12.4) | 2.88 d (11.2) | 2.70 d (12.4) |
| 30 | 3.46 br s | 3.44 br s | 3.45 br s | ||||
| 31 | 3.86 s | 3.85 s | 3.87 s | 3.67 s | 3.67 s | 3.80 s | 3.86 s |
| 3-Acyl | 3-Acyl | 3-Acyl | 3-Acyl | 3-Acyl | 3-Acyl | 2-Acyl | |
| 33 | 2.15 s | 2.57 m | 2.13 s | 2.66 m | 2.47 m | 1.94 s | 2.42 m |
| 30-Acyl | |||||||
| 34 | 3.50 m | 1.20 d (7.2) | 1.21 d (6.8) | 1.73 m | 1-Acyl | 1.48 m | |
| 3.69 m | 1.52 m | 1.73 m | |||||
| 35 | 1.27 t (6.8) | 1.22 d (7.2) | 1.19 d (7.2) | 0.94 t (7.2) | 2.55 m | 0.97 t (7.6) | |
| 30-Acyl | |||||||
| 36 | 3.51 m | 1.17 d (7.2) | 1.11 d (7.2) | 1.22 d (7.2) | |||
| 3.67 m | |||||||
| 37 | 1.27 t (6.8) | 5.08 s | 1.10 d (7.2) | ||||
| 1-OH | 2.91 br s | 2.85 s | 2.74 s | ||||
| 6-OH | 2.92 d (3.2) | 2.88 d (3.2) | 2.94 br d (2.7) | 5.58 d (4.8) | 4.69 br d (3.6) | 3.19 s | |
| 8-OH | 5.05 s | 5.00 s | |||||
| 30-OH | 4.87 s | 3.43 s |
1 Recorded in CDCl3; 2 Recorded in acetone-d6; 3 Overlapped signals assigned by 1H-1H COSY, HSQC, and HMBC spectra without designating multiplicity.
Table 6.
13C NMR spectroscopic data (100 MHz) of compounds 15–21 (δ in ppm).
| Position | 15 1 | 16 1 | 17 1 | 18 1 | 19 2 | 20 1 | 21 1 |
|---|---|---|---|---|---|---|---|
| 1 | 84.5 qC | 84.3 qC | 85.2 qC | 84.8 qC | 84.8 qC | 92.6 qC | 85.5 qC |
| 2 | 204.3 qC | 204.1 qC | 204.3 qC | 204.1 qC | 203.9 qC | 209.1 qC | 82.4 CH |
| 3 | 84.8 CH | 84.7 CH | 85.0 CH | 83.3 CH | 83.0 CH | 90.6 CH | 207.8 qC |
| 4 | 40.6 qC | 40.6 qC | 41.2 qC | 40.6 qC | 40.5 qC | 45.1 qC | 52.8 qC |
| 5 | 45.4 CH | 45.5 CH | 46.0 CH | 40.7 CH | 40.5 CH | 43.4 CH | 51.4 CH |
| 6 | 72.0 CH | 72.1 CH | 71.9 CH | 34.2 CH2 | 34.2 CH2 | 71.9 CH | 71.0 CH |
| 7 | 175.3 qC | 175.3 qC | 175.4 qC | 172.7 qC | 172.7 qC | 176.2 qC | 175.2 qC |
| 8 | 134.9 qC | 135.0 qC | 135.2 qC | 134.5 qC | 134.4 qC | 76.8 qC | 130.4 qC |
| 9 | 48.3 CH | 48.1 CH | 49.4 CH | 47.9 CH | 48.0 CH | 48.4 CH | 156.6 qC |
| 10 | 55.9 qC | 56.0 qC | 57.0 qC | 56.4 qC | 56.4 qC | 48.0 qC | 58.8 qC |
| 11 | 19.5 CH2 | 19.5 CH2 | 20.2 CH2 | 19.4 CH2 | 19.4 CH2 | 17.8 CH2 | 20.2 CH2 |
| 12 | 31.9 CH2 | 32.0 CH2 | 32.2 CH2 | 31.9 CH2 | 31.9 CH2 | 29.5 CH2 | 30.0 CH2 |
| 13 | 40.7 qC | 40.7 qC | 40.4 qC | 40.5 qC | 40.6 qC | 38.7 qC | 37.8 qC |
| 14 | 138.4 qC | 138.5 qC | 132.5 qC | 133.0 qC | 133.0 qC | 160.0 qC | 154.9 qC |
| 15 | 33.1 CH2 | 33.0 CH2 | 35.4 CH2 | 35.4 CH2 | 35.3 CH2 | 120.2 CH | 113.4 CH |
| 16 | 169.6 qC | 169.9 qC | 169.8 qC | 170.3 qC | 170.3 qC | 164.9 qC | 165.7 qC |
| 17 | 80.5 CH | 80.5 CH | 80.8 CH | 80.7 CH | 80.7 CH | 81.2 CH | 80.4 CH |
| 18 | 17.7 CH3 | 17.4 CH3 | 17.5 CH3 | 16.8 CH3 | 16.8 CH3 | 21.4 CH3 | 16.2 CH3 |
| 19 | 17.0 CH3 | 17.1 CH3 | 16.7 CH3 | 14.9 CH3 | 14.9 CH3 | 22.2 CH3 | 15.7 CH3 |
| 20 | 120.6 qC | 120.6 qC | 120.6 qC | 120.5 qC | 120.5 qC | 121.1 qC | 120.3 qC |
| 21 | 141.1 CH | 141.1 CH | 141.1 CH | 141.2 CH | 141.1 CH | 142.7 CH | 141.2 CH |
| 22 | 110.0 CH | 110.0 CH | 110.1 CH | 110.1 CH | 110.1 CH | 111.1 CH | 110.1 CH |
| 23 | 143.1 CH | 143.1 CH | 143.0 CH | 142.9 CH | 142.9 CH | 144.0 CH | 143.0 CH |
| 28 | 19.8 CH3 | 19.7 CH3 | 19.5 CH3 | 19.2 CH3 | 19.2 CH3 | 15.7 CH3 | 16.3 CH3 |
| 29 | 44.7 CH2 | 44.9 CH2 | 45.4 CH2 | 44.6 CH2 | 44.5 CH2 | 41.5 CH2 | 39.3 CH2 |
| 30 | 92.2 qC | 92.3 qC | 63.0 CH | 63.4CH | 63.5 CH | 83.6 qC | 82.4 qC |
| 31 | 53.2 CH3 | 53.1 CH3 | 53.3 CH3 | 51.8 CH3 | 51.7 CH3 | 53.0 CH3 | 53.3 CH3 |
| 3-Acyl | 3-Acyl | 3-Acyl | 3-Acyl | 3-Acyl | 3-Acyl | 2-Acyl | |
| 32 | 169.9 qC | 176.0 qC | 170.1 qC | 176.5 qC | 176.0 qC | 170.1 qC | 176.0 qC |
| 33 | 20.6 CH3 | 33.8 CH | 20.7 CH3 | 33.9 CH | 40.8 CH | 21.3 CH3 | 41.3 CH |
| 30-Acyl | 1-Acyl | ||||||
| 34 | 63.3 CH2 | 19.0 CH3 | 18.9 CH3 | 26.7 CH2 | 176.0 qC | 26.5 CH2 | |
| 35 | 15.7 CH3 | 19.1 CH3 | 18.9CH3 | 11.5 CH3 | 35.1 CH | 11.7 CH3 | |
| 30-Acyl | |||||||
| 36 | 63.4 CH2 | 17.0 CH3 | 16.5 CH3 | 19.4 CH3 | 17.2 CH3 | ||
| 37 | 15.7 CH3 | 19.3 CH3 |
1 Recorded in CDCl3; 2 Recorded in acetone-d6.
Table 7.
1H NMR spectroscopic data (400 MHz, in CDCl3) of compounds 22–29 (δ in ppm, J in Hz).
| Position | 22 | 23 | 24 | 25 | 26 | 27 | 28 | 29 |
|---|---|---|---|---|---|---|---|---|
| 1 | 7.14 d (10.4) | 3.52 m | ||||||
| 2β | 5.90 d (10.4) | 2.92 dd (14.4,6.4) | ||||||
| 2α | 2.46 dd (14.4,3.6) | |||||||
| 3 | 5.54 s | 5.50 s | 4.88 s | 4.86 s | 5.17 s | 4.82 s | ||
| 5 | 2.92 s | 2.94 s | 2.80 br s | 2.82 s | 2.40 s | 2.37 d (13.6) | 2.22 dd (12.4, 2.8) | 2.82 d (10.4) |
| 6a | 4.26 br s | 4.27 br s | 4.58 s | 4.58 s | 4.51 s | 2.40 br d (23.2) | 1.93 m (α) | 2.24 d (16.4) |
| 6b | 2.42 dd (23.2, 13.6) | 1.99 m (β) | 2.62 dd (16.4, 10.4) | |||||
| 7 | 5.30 t (2.8) | |||||||
| 9 | 3.23 m | 3.25 m | 2.54 m | 2.22 m | ||||
| 11α | 1.89 m | 1.88 m | 2.63 m | 2.62 m | 1.94 m | 1.98 t (14.4) | 2.10 m | 1.65 m |
| 11β | 1.75 m | 1.74 m | 2.37 m | 2.37 dd (20.0, 3.6) | 2.26 m | 2.19 dd (14.4, 4.0) | 1.83 m | 2.30 m |
| 12β | 1.83 m | 1.83 m | 1.39 m | 1.40 td (12.8, 4.8) | 1.56 m | 3.87 br d (13.6) | 1.70 m | 1.96 m |
| 12α | 1.25 m | 1.24 m | 1.72 m | 1.72 dd (12.8, 4.0) | 1.25 m | 2.20 m | 1.35 dd (17.2, 4.4) | |
| 15α | 6.00 s | 5.99 s | 7.23 s | 7.18 s | 6.56 s | 6.00 s | 5.87 s | 2.86 d (18.0) |
| 15β | 2.60 d (18.0) | |||||||
| 17 | 5.33 s | 5.34 s | 5.01 s | 5.01 s | 5.61 s | 5.80 s | 2.53 overlapped | 5.66 s |
| 18 | 1.08 s | 1.07 s | 1.04 s | 1.04 s | 1.38 s | 1.43 s | 1.43 s | 0.93 s |
| 19 | 1.21 s | 1.22 s | 1.54 s | 1.54 s | 1.54 s | 1.33 s | 1.24 s | 0.97 s |
| 20 | 2.97 ddd (12.0, 9.2, 2.8) | |||||||
| 21α | 7.53 br s | 7.53 br s | 7.51 br s | 7.51 s | 7.45 br s | 7.67 br s | 4.85 br d (18.3) | |
| 21β | 5.03 dd (18.3, 2.0) | |||||||
| 22α | 6.49 d (1.2) | 6.49 d (1.2) | 6.48 br d (1.2) | 6.47 br d (1.2) | 6.41 br s | 6.61 br s | 2.44 m | 6.08 br s |
| 22β | 2.49 m | |||||||
| 23α | 7.47 t (1.6) | 7.47 t (1.6) | 7.46 t (1.6) | 7.45 t (1.6) | 7.43 br s | 7.53 br s | 4.23 ddd (10.4, 9.2, 6.8) | |
| 23β | 4.46 td (8.8, 2.0) | |||||||
| 28 | 1.21 s | 1.22 s | 1.00 s | 1.00 s | 0.87 s | 0.82 s | 1.10 s | 1.03 s |
| 29pro-R | 2.49 d (19.2) | 2.46 br d (18.8) | 1.81 dd (10.8, 2.0) | 1.81 dd (10.4, 2.0) | 1.67 br d (11.0) | 1.80 d (11.2) | 1.09 s | 1.20 s |
| 29pro-S | 2.56 d (19.2) | 2.58 d (18.8) | 2.71 d (10.8) | 2.70 d (10.4) | 2.36 d (11.0) | 1.86 d (11.2) | ||
| 30α | 6.59 br d (1.6) | 6.56 br d (1.6) | 5.34 s | 4.49 s | 1.29 s | 4.92 s (30a) | ||
| 30β | 5.22 s (30b) | |||||||
| 31 | 3.81 s | 3.81 s | 3.81 s | 3.82 s | 3.80 s | 3.76 s | 7-Acyl | 3.73 s |
| 32 | 3-Acyl | 3-Acyl | 3-Acyl | 3-Acyl | 1.97 s | |||
| 33 | 2.17 s | 2.51 m | 2.27 m | 2.45 m | 1.70 s | 1.68 s | ||
| 34 | 1.53 m | 1.42 m | 3-Acyl | 3-Acyl | ||||
| 1.74 m | 1.58 m | |||||||
| 35 | 0.96 t (7.2) | 0.87 t (7.6) | 1.11 d (6.8) | 2.07 s | ||||
| 36 | 1.18 d (7.2) | 1.07 d (6.8) | 1.11 d (6.8) | 2-Acyl | 6.88 q (6.8) | |||
| 37 | 2.17 s | 1.73 br d (6.8) | ||||||
| 38 | 1.84 s | |||||||
| 1-OH | 2.81 s | 2.84 br s | 3.45 s | |||||
| 2-OH | 4.93 s | 4.93 br s | 3.57 s | |||||
| 6-OH | 3.01 s | 3.06 br s | 3.12 br s | 3.13 s |
Table 8.
13C NMR spectroscopic data (100 MHz, in CDCl3.) of compounds 22–29 (δ in ppm).
| Position | 22 | 23 | 24 | 25 | 26 | 27 | 28 | 29 |
|---|---|---|---|---|---|---|---|---|
| 1 | 215.1 qC | 215.4 qC | 85.8 qC | 85.9 qC | 84.4 qC | 84.4 qC | 156.7 CH | 77.5 CH |
| 2 | 193.6 qC | 193.5 qC | 80.7 qC | 80.8 qC | 84.0 qC | 75.7 qC | 126.0 CH | 39.2 CH2 |
| 3 | 82.9 CH | 82.4 CH | 87.2 CH | 87.2 CH | 85.6 CH | 86.6 CH | 204.0 qC | 212.4 qC |
| 4 | 41.1 qC | 41.2 qC | 45.6 qC | 45.6 qC | 44.4 qC | 43.7 qC | 44.1 qC | 48.1 qC |
| 5 | 49.2 CH | 49.2 CH | 48.2 CH | 48.1 CH | 44.8 CH | 40.5 CH | 46.2 CH | 42.9 CH |
| 6 | 70.9 CH | 70.9 CH | 71.5 CH | 71.5 CH | 71.5 CH | 33.8 CH2 | 23.5 CH2 | 32.6 CH2 |
| 7 | 175.1 qC | 175.2 qC | 175.0 qC | 174.9 qC | 174.1 qC | 174.1 qC | 73.9 CH | 173.7 qC |
| 8 | 149.7 qC | 149.6 qC | 121.0 qC | 121.1 qC | 84.0 qC | 83.7 qC | 44.8 qC | 144.8 qC |
| 9 | 43.7 CH | 44.1 CH | 169.8 qC | 169.7 qC | 86.8 qC | 87.1 qC | 37.8 CH | 49.6 CH |
| 10 | 52.7 qC | 52.6 qC | 48.8 qC | 48.8 qC | 49.0 qC | 47.4 qC | 39.9 qC | 44.0 qC |
| 11 | 21.0 CH2 | 21.2 CH2 | 25.6 CH2 | 25.6 CH2 | 26.3 CH2 | 34.3 CH2 | 15.8 CH2 | 23.7 CH2 |
| 12 | 30.8 CH2 | 30.8 CH2 | 30.1 CH2 | 30.1 CH2 | 29.5 CH2 | 66.5 CH | 31.5 CH2 | 29.2 CH2 |
| 13 | 40.0 qC | 40.0 qC | 36.5 qC | 36.5 qC | 38.1 qC | 44.7 qC | 47.9 qC | 41.8 qC |
| 14 | 165.9 qC | 166.2 qC | 152.1 qC | 152.2 qC | 154.6 qC | 152.3 qC | 193.6 qC | 80.1 qC |
| 15 | 115.1 CH | 115.0 CH | 115.8 CH | 115.7 CH | 122.3 CH | 123.7 CH | 123.8 CH | 33.5 CH2 |
| 16 | 163.8 qC | 163.8 qC | 165.4 qC | 165.5 qC | 163.9 qC | 162.4 qC | 205.1 qC | 168.2 qC |
| 17 | 79.2 CH | 79.1 CH | 80.3 CH | 80.3 CH | 80.6 CH | 78.2 qC | 61.8 CH | 81.2 CH |
| 18 | 19.6 CH3 | 19.6 CH3 | 15.8 CH3 | 15.8 CH3 | 19.6 CH3 | 13.2 CH3 | 24.2 CH3 | 14.1 CH3 |
| 19 | 15.3 CH3 | 15.4 CH3 | 16.1 CH3 | 16.0 CH3 | 17.4 CH3 | 15.6 CH3 | 19.1 CH3 | 21.7 CH3 |
| 20 | 119.6 qC | 119.7 qC | 119.9 qC | 119.9 qC | 119.6 qC | 121.5 qC | 36.8 CH | 164.3 qC |
| 21 | 141.5 CH | 141.5 CH | 141.3 qC | 141.3 CH | 141.5 CH | 142.3 CH | 177.5 qC | 72.4 CH2 |
| 22 | 110.0 CH | 110.1 CH | 110.0 CH | 110.0 CH | 109.8 CH | 109.7 CH | 29.2 CH2 | 117.8 CH |
| 23 | 143.4 CH | 143.4 CH | 143.2 CH | 143.2 CH | 143.2 CH | 144.9 CH | 66.5 CH2 | 172.5 qC |
| 28 | 16.7 CH3 | 16.5 CH3 | 16.6 CH3 | 16.6 CH3 | 15.4 CH3 | 14.5 CH3 | 27.0 CH3 | 25.5 CH3 |
| 29 | 49.7 CH2 | 49.6 CH2 | 43.1 CH2 | 43.1 CH2 | 40.5 CH3 | 39.0 CH3 | 21.3 CH3 | 21.4 CH3 |
| 30 | 134.7 CH | 134.8 CH | 194.9 qC | 195.0 qC | 74.0 CH | 78.2 CH | 26.8 CH3 | 112.5 CH2 |
| 7-Acyl | ||||||||
| 31 | 53.2 CH3 | 53.2 CH3 | 53.3 CH3 | 53.3 CH3 | 53.2 CH3 | 52.3 CH3 | 169.8 qC | 52.2 CH3 |
| 3-Acyl | 3-Acyl | 3-Acyl | 3-Acyl | |||||
| 32 | 170.4 qC | 176.2 qC | 174.3 qC | 174.8 qC | 119.5 qC | 119.4 qC | 21.0 CH3 | |
| 33 | 20.6 CH3 | 40.7 CH | 41.3 CH | 34.2 CH | 16.6 CH3 | 16.5 CH3 | ||
| 3-Acyl | 3-Acyl | |||||||
| 34 | 26.6 CH2 | 26.5 CH2 | 18.8 CH3 | 169.0 qC | 167.8 qC | |||
| 35 | 11.5 CH3 | 11.8 CH3 | 19.0 CH3 | 21.7 CH3 | 130.1 qC | |||
| 2-Acyl | ||||||||
| 36 | 16.4 CH3 | 16.7 CH3 | 170.7 qC | 139.7 CH | ||||
| 37 | 21.9 CH3 | 14.4 CH3 | ||||||
| 38 | 12.5 CH3 |
© 2018 by the authors. Licensee MDPI, Basel, Switzerland. This article is an open access article distributed under the terms and conditions of the Creative Commons Attribution (CC BY) license (http://creativecommons.org/licenses/by/4.0/).
Share and Cite
MDPI and ACS Style
Zhang, J.; Li, W.; Dai, Y.; Shen, L.; Wu, J. Twenty-Nine New Limonoids with Skeletal Diversity from the Mangrove Plant, Xylocarpus moluccensis. Mar. Drugs 2018, 16, 38. https://doi.org/10.3390/md16010038
AMA Style
Zhang J, Li W, Dai Y, Shen L, Wu J. Twenty-Nine New Limonoids with Skeletal Diversity from the Mangrove Plant, Xylocarpus moluccensis. Marine Drugs. 2018; 16(1):38. https://doi.org/10.3390/md16010038
Chicago/Turabian StyleZhang, Jianzhi, Wanshan Li, Yiguo Dai, Li Shen, and Jun Wu. 2018. "Twenty-Nine New Limonoids with Skeletal Diversity from the Mangrove Plant, Xylocarpus moluccensis" Marine Drugs 16, no. 1: 38. https://doi.org/10.3390/md16010038
Note that from the first issue of 2016, this journal uses article numbers instead of page numbers. See further details here.