1. Introduction
Although the nature of the associations between sponges and fungi is far from understood, there is accumulating evidence that some sponge-associated fungi have adopted the ability to produce chemical compounds which are structurally diverged from their terrestrial counterparts [
1]. Marine sponge-associated fungi often live in sponges and their bioactive metabolites may be interpreted as chemically mediated defense mechanisms for protecting their host organism from environmental dangers such as predation [
2]. Many studies have reported on the isolation of marine sponge-associated
Penicillium spp. as producers of bioactive metabolites. Meanwhile, a growing number of studies have indicated that marine fungi can provide sources of novel bioactive secondary metabolites [
3,
4] and produce the decalin moiety-containing secondary metabolites. Frequently, they are highly functionalized through the substitution of methyl, hydroxyl, or C=C and C=O double bonds on the decalin skeleton, or through a three-, five-, or seven-membered side chain with carboxyls (or its ester), several double bonds, or via ring formation [
5]. Their intricate structures and diverse biological activities have attracted researchers around the world to investigate their biosynthesis, chemical synthesis, and the various facets of the functionalized decalin skeleton [
5].
Inflammation is a normal immune process to protect the body from infection or tissue injury. During the inflammatory process, the stimulated immune monocytes and macrophages overexpress inducible nitric oxide synthase (iNOS) and cyclooxygenase-2 (COX-2) and secrete increased amounts of inflammatory mediators such as nitric oxide (NO), prostaglandin E2 (PGE2), and interleukin-1β (IL-1β), interleukin-6 (IL-6), tumor necrosis factor-α (TNF-α). Overproduction of these factors is involved in cell damage and inflammatory disease [
6]. Thus, inhibition of the production of these inflammatory mediators is an important target in the treatment of inflammatory diseases [
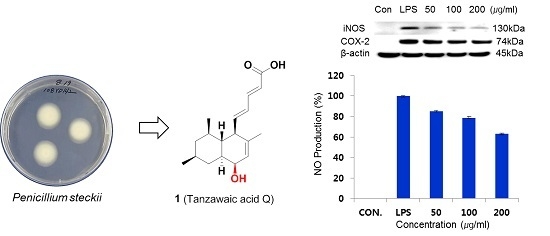
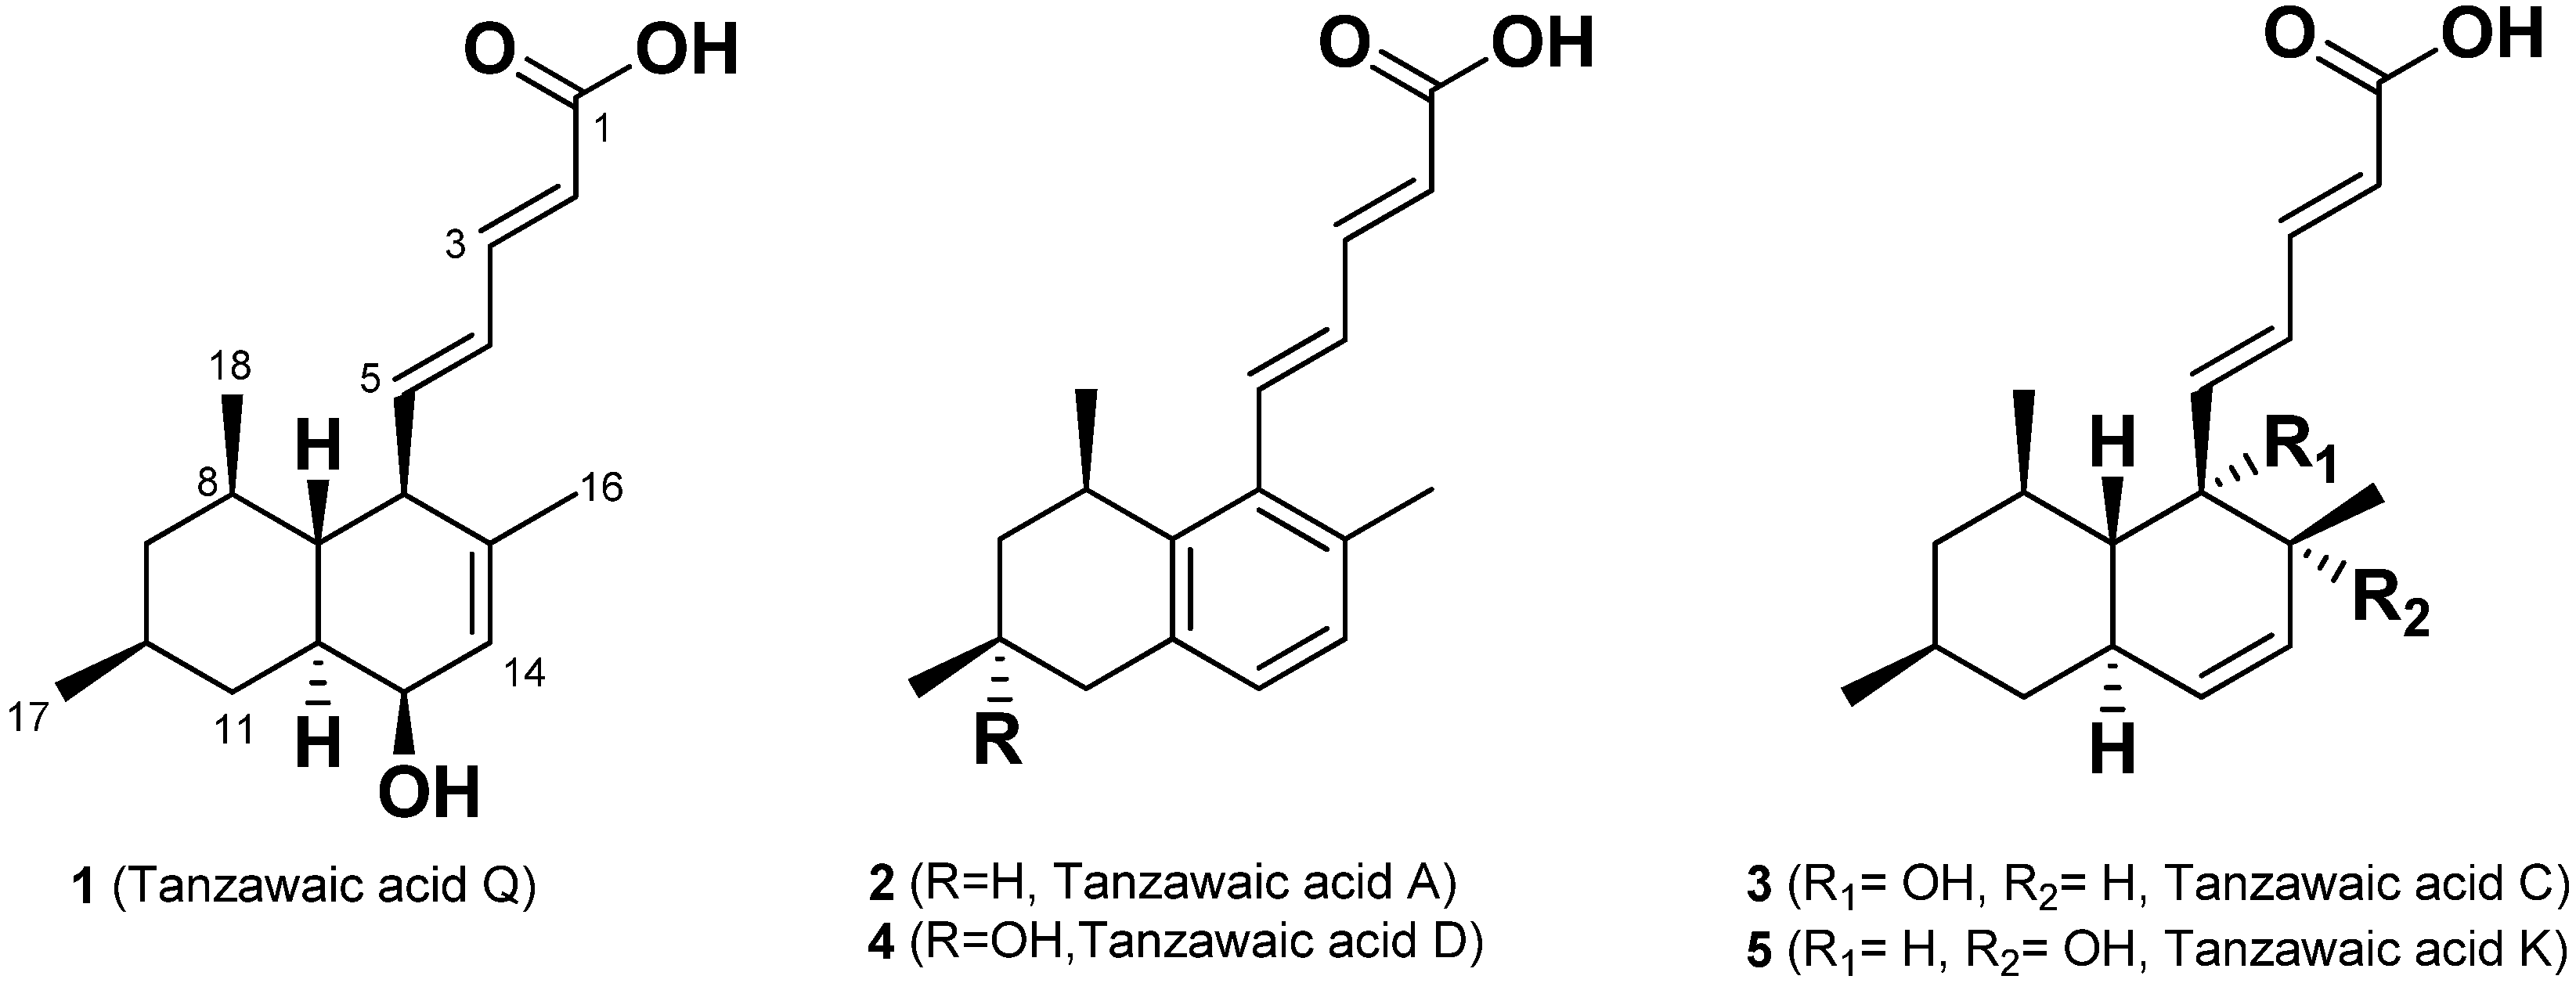
7]. In our continuous search for bioactive compounds, we isolated a new anti-inflammatory tanzawaic acid Q (
1) and four known tanzawaic acids A (
2), C (
3), D (
4) and K (
5), which have a decalin motif, from a marine sponge–associated fungus,
Penicillium steckii 108YD142 (
Figure 1). Here, we report the isolation, structure determination and anti-inflammatory activities of tanzawaic acid Q (
1).
Figure 1.
The structures of 1–5 isolated from the extract of Penicillium steckii 108YD142.
Figure 1.
The structures of 1–5 isolated from the extract of Penicillium steckii 108YD142.
2. Results and Discussion
The fungal strain 108YD142 was isolated from a marine sponge sample collected at Wangdolcho, in the Republic of Korea’s Eastern reef, and identified as
Penicillium steckii by 18s rRNA sequencing. The strain 108YD142 was cultured in Bennett’s medium at 28 °C for seven days. The culture broth was extracted with ethyl acetate and the crude extract was purified by flash open chromatography and reversed phase high-performance liquid chromatography (HPLC). The four known compounds were identified as tanzawaic acids A (
2), C (
3), and D (
4), K (
5) by comparative analysis data of their NMR, MS and optical rotation values, indicating that these compounds share the same absolute configuration [
8,
9,
10]. Compound
1 was isolated as yellow oil. The molecular formula was determined to be C
18H
26O
3 based on the HR-ESIMS data
m/
z 313.1777 (calcd for [M + Na]
+ 313.1780), indicating six indexes of unsaturation. The IR spectrum at 3397 and 1639 cm
−1 represented the hydroxyl (OH) and carbonyl (CO) groups, respectively, and the UV spectrum showed a maximum absorption at 259 nm, suggesting that
1 is a tanzawaic acid derivative.
The structure of
1 was elucidated by detailed analysis of 1D and 2D NMR data. The
1H NMR spectrum (
Table 1) showed signals of five olefinic protons at δ
H 5.80–7.23, an oxymethine proton at δ
H 3.80, three methyl signals at δ
H 0.92, 0.94, 1.60, and nine aliphatic protons at δ
H 0.74–2.59. The
13C NMR spectrum (
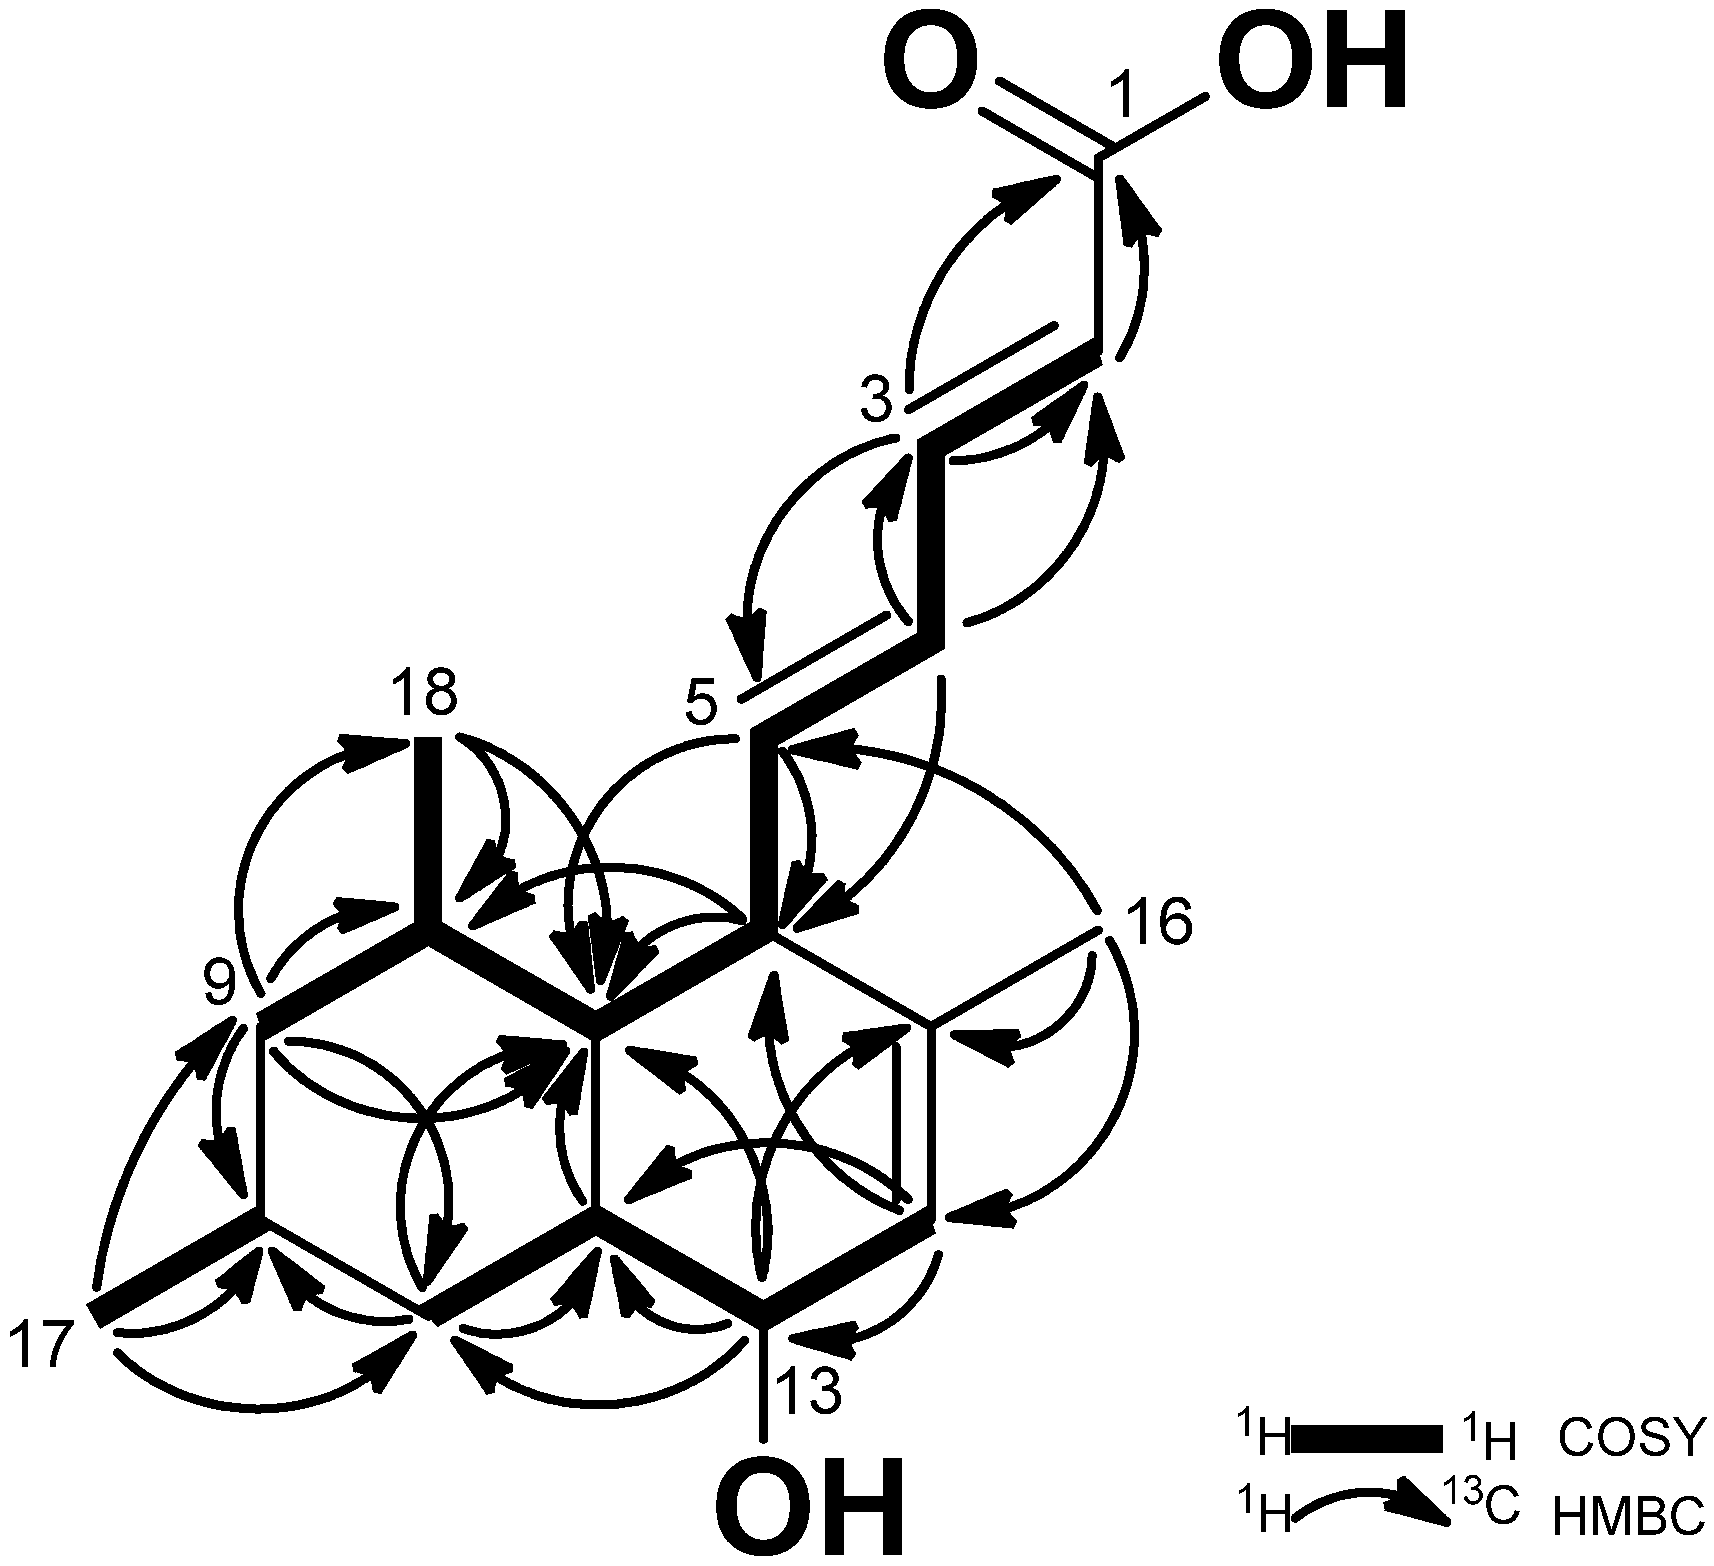
Table 1) showed 17 signals, which were identified as 11 methines, two methylenes, three methyls, and a quaternary carbon. However, the chemical shift of C-1 (δc 172.0) was obtained from the HMBC spectrum because the C-1 signal was not observed in the
13C NMR spectrum. The COSY spectrum appeared with four spin systems within the molecule starting from H-2 to H-9, H-8 to H-17, H-10 to H-18, and H-11 to H-14. The connectivity of the olefinic proton signals was confirmed by COSY correlations from H-2 (δ
H 5.83) to H-5 (δ
H 2.59). The hydroxyl group was located at C-13 by judging the chemical shifts of the oxygenated methine (δ
H 3.80, δ
C 68.6). The position of three methyl groups was determined at C-8, C-10, and C-15 by the HMBC correlations (
Figure 2): H-18 (0.94)/C-7 (δ
c 44.8), C-8 (δ
c 41.6), C-9 (δ
c 47.1); H-17 (δ
H 0.92)/C-9 (δ
c 47.1), C-10 (δ
c 33.6), C-11 (δ
c 39.8); H-16 (δ
H 1.60, s)/C-6 (δ
c 51.9), C-14 (δ
c 127.1), C-15 (δ
c 139.8).
Table 1.
1H and 13C NMR data a of tanzawaic acid Q (1) in CD3OD.
Table 1.
1H and 13C NMR data a of tanzawaic acid Q (1) in CD3OD.
| Position | δC, Type | δH, Mult. (J in Hz) | HMBC | Key NOESY |
|---|
| 1 | 172.0, qC b | | | |
| 2 | 122.2, CH | 5.83, d (15.3) | 1, 4, 5 | |
| 3 | 145.8, CH | 7.23, dd (15.3, 11) | 1, 2, 4, 5 | |
| 4 | 131.4, CH | 6.31, dd (15, 11) | 2, 3, 5 | 6 |
| 5 | 150.4, CH | 6.01, dd (15, 9.5) | 6, 7 | 7, 18 |
| 6 | 51.9, CH | 2.59, t (7.5) | 4, 5, 7, 8, 15 | 8, 12, 16 |
| 7 | 44.8, CH | 1.29 c | 8 | 9ax, 11ax, 18 |
| 8 | 41.6, CH | 1.35, brs | | 10 |
| 9 | 47.1, CH2 | 0.74ax, q (12)/1.58eqc | 7, 8, 10, 11, 17 | |
| 10 | 33.6, CH | 1.52 c | | |
| 11 | 39.8, CH2 | 1.14ax, q (12)/1.55eq c | 10, 12 | |
| 12 | 44.5, CH | 1.29 c | 7 | 6, 8, 13 |
| 13 | 68.6, CH | 3.80, d (6.5) | 8, 12, 14, 15 | 11eq, 12, 14 |
| 14 | 127.1, CH | 5.80, d (6.5) | 6, 12, 13, 16 | 16 |
| 15 | 139.8, qC | | | |
| 16 | 22.7, CH3 | 1.60, s | 6, 14, 15 | |
| 17 | 23.2, CH3 | 0.92, d (6.5) | 9, 10, 11 | 9eq |
| 18 | 23.0, CH3 | 0.94, d (6) | 7, 8, 9 | 9ax |
Figure 2.
COSY and HMBC correlations of 1.
Figure 2.
COSY and HMBC correlations of 1.
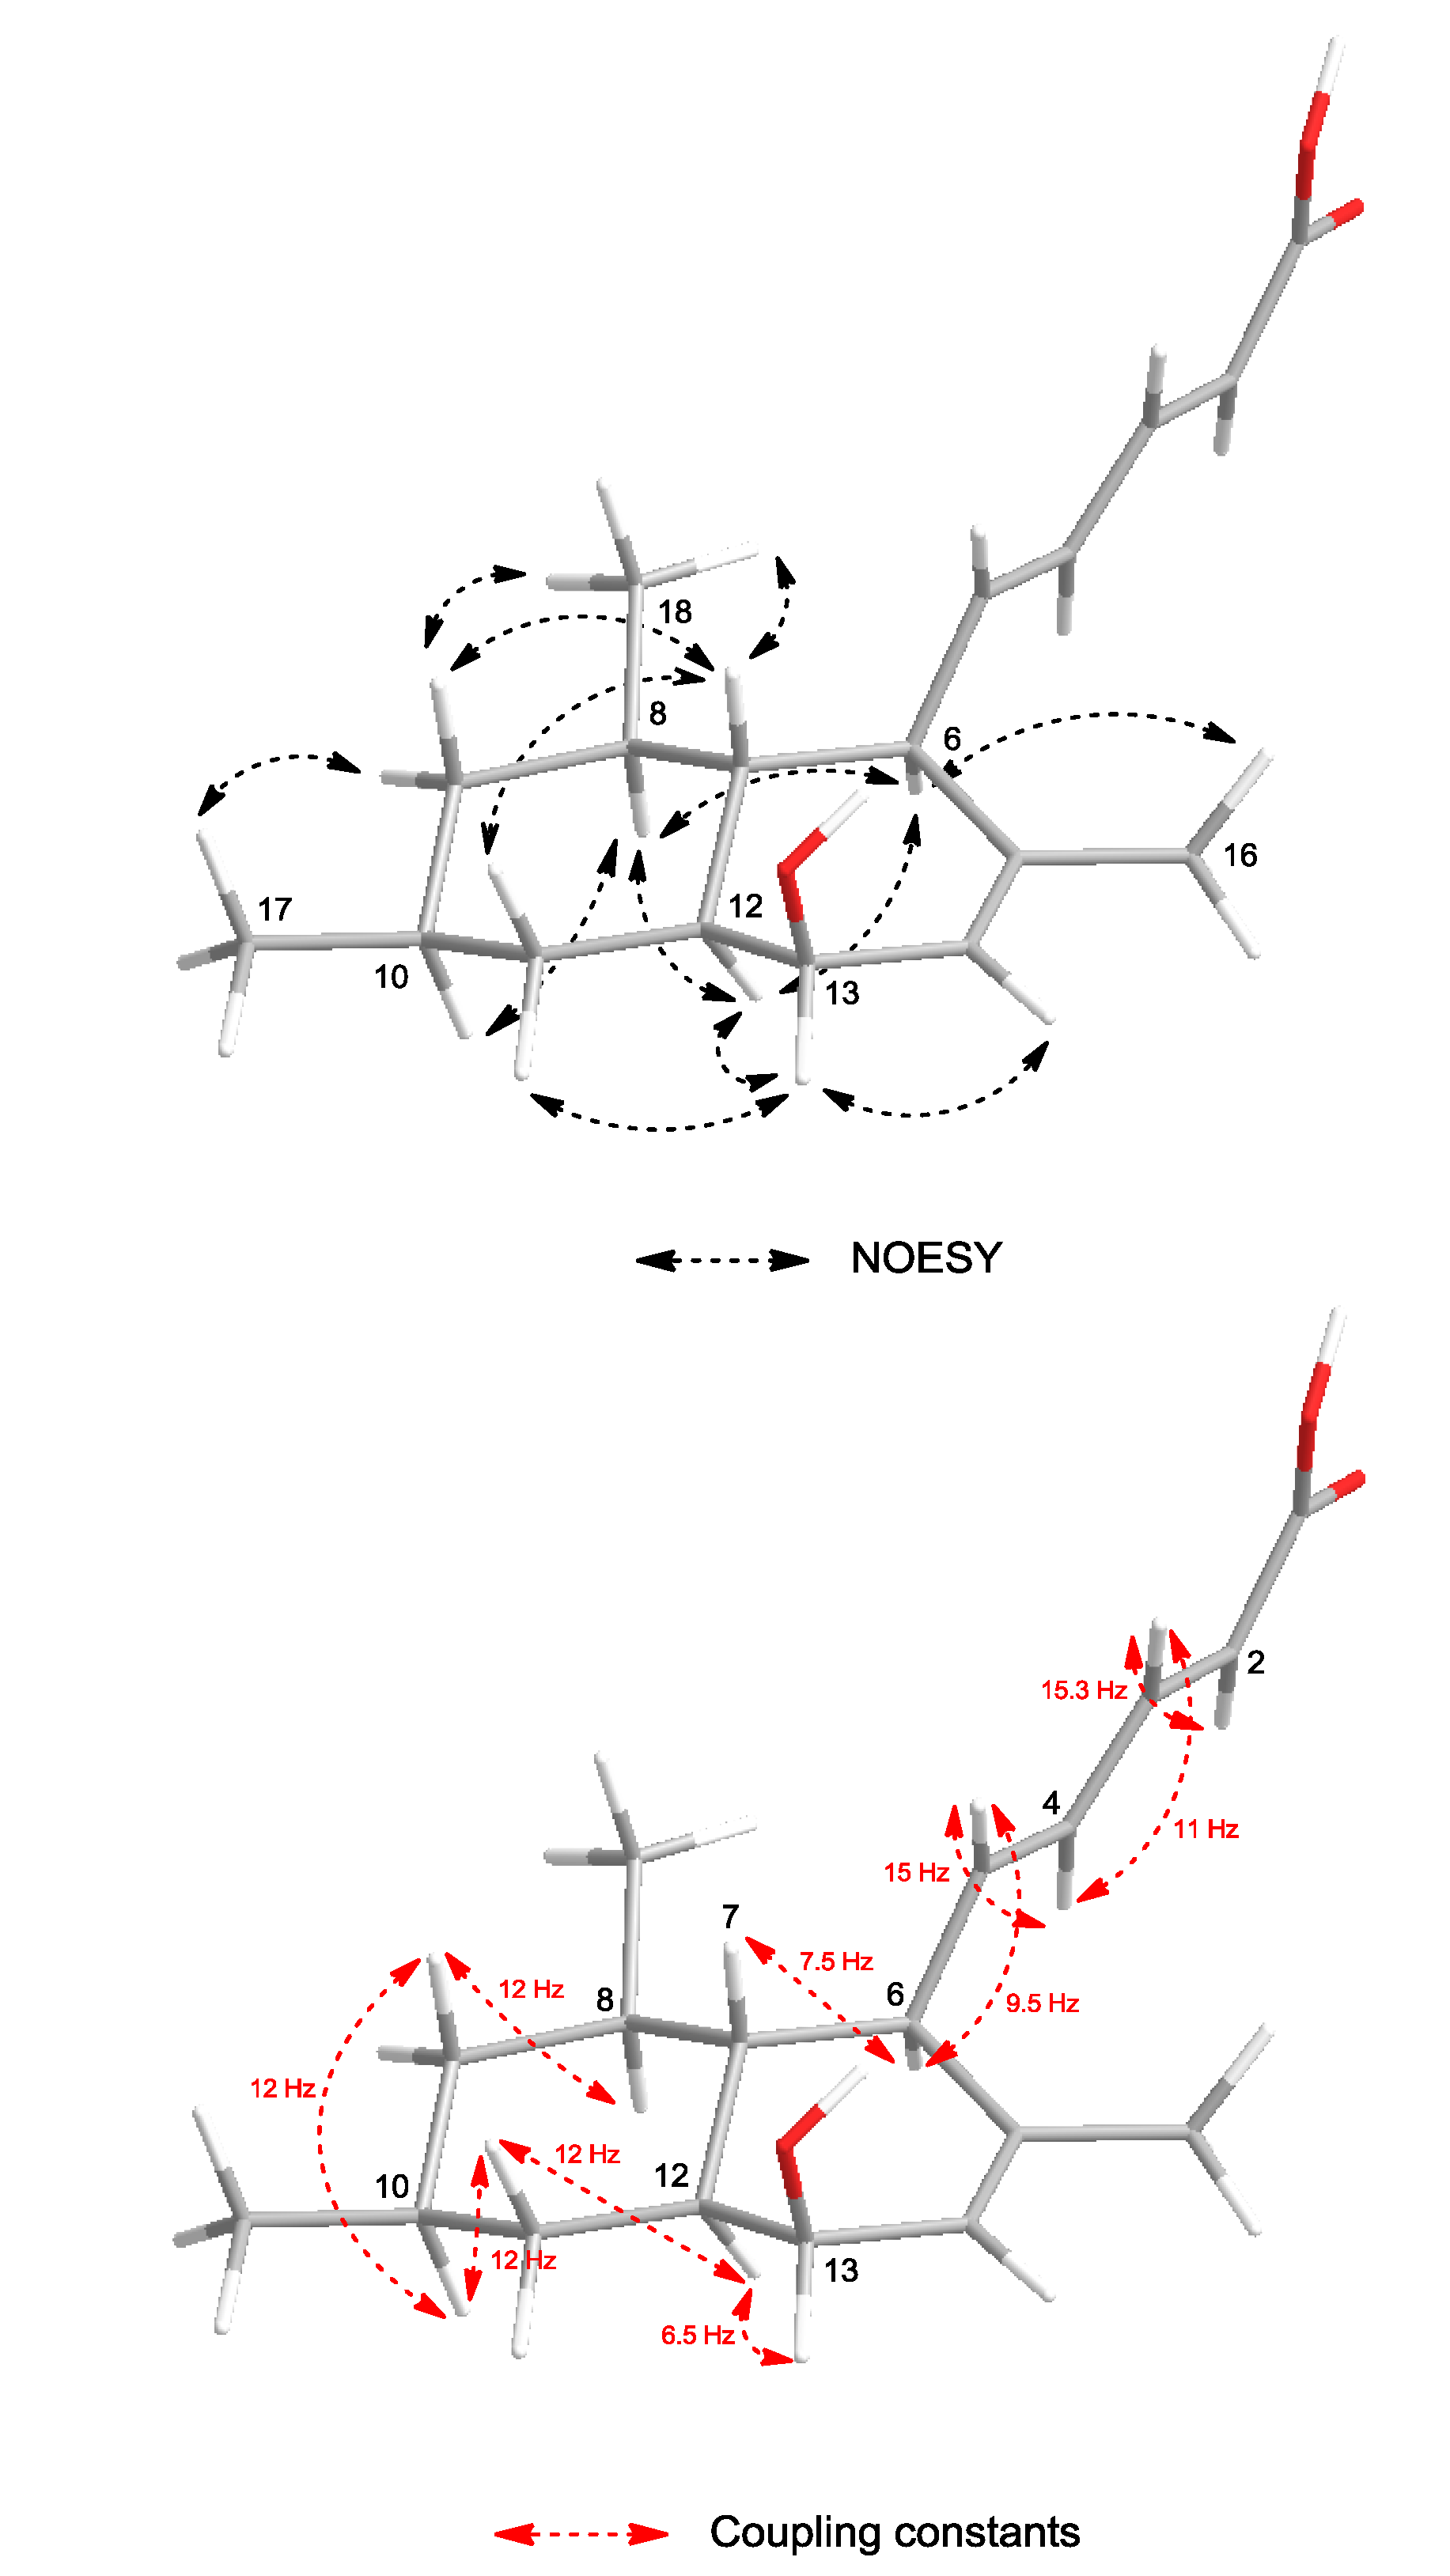
The configuration of the olefinic double bonds was deduced as
2E and
4E on the basis of the large coupling constants of H-2/H-3 (
J = 15.3 Hz) and H-4/H-5 (
J = 15 Hz). The relative configuration of
1 was determined by the NOESY spectrum and vicinal
1H–
1H coupling constants (
3Jvic). NOESY correlations (
Figure 3) of H-6 (δ
H 2.59) with H-8 (δ
H 1.35) and H-12 (δ
H 1.29) indicated a
trans fusion of the rings. The axial orientations of H-7 (δ
H 1.29), H-8 (δ
H 1.35), H-9ax (δ
H 0.74), H-10 (δ
H 1.52), H-11ax (δ
H 1.14), H-12 (δ
H 1.29) and H-13 (δ
H 3.80) were indicated by the large coupling constants (
3JH-7,H-6 = 7.5 Hz,
3JH-9ax,H-8 =
3JH-9ax,H-10 =
3JH-11ax,H-10 =
3JH-11ax,H-12 = 12 Hz,
3JH-5,H-6 = 9.5 Hz). H-13 showed only a small coupling (
J = 6.5 Hz) to H-12 and was assigned to an equatorial orientation, indicating that the hydroxyl group at C-13 is located in an axial position. H-16, H-17, and the olefinic side chain were on the same side of the molecule. The NOESY correlation between the ring junction protons H-7 and H-12 was not observed, indicating their
anti relationship. Thus, the relative configurations at C-6, C-7, C-8, C-10, C-12 and C-13 were established as shown in
Figure 3.
Figure 3.
Selected NOESY correlations and coupling constants of 1.
Figure 3.
Selected NOESY correlations and coupling constants of 1.
The structure of compound
1 was found quite similar to the reported tanzawaic acid I identified from the culture filtrates of the fungal strain
Penicillium sp. IBWF104-06 isolated from a soil sample [
10]. The only difference was that compound
1 has a hydroxyl group at C-13 but tanzawaic acid I has one more hydroxyl group at C-6. The relative configuration of
1 was also similar to tanzawaic acid I. Thus, the structure of
1 was determined as a new tanzawaic acid derivative, named tanzawaic acid Q (
1).
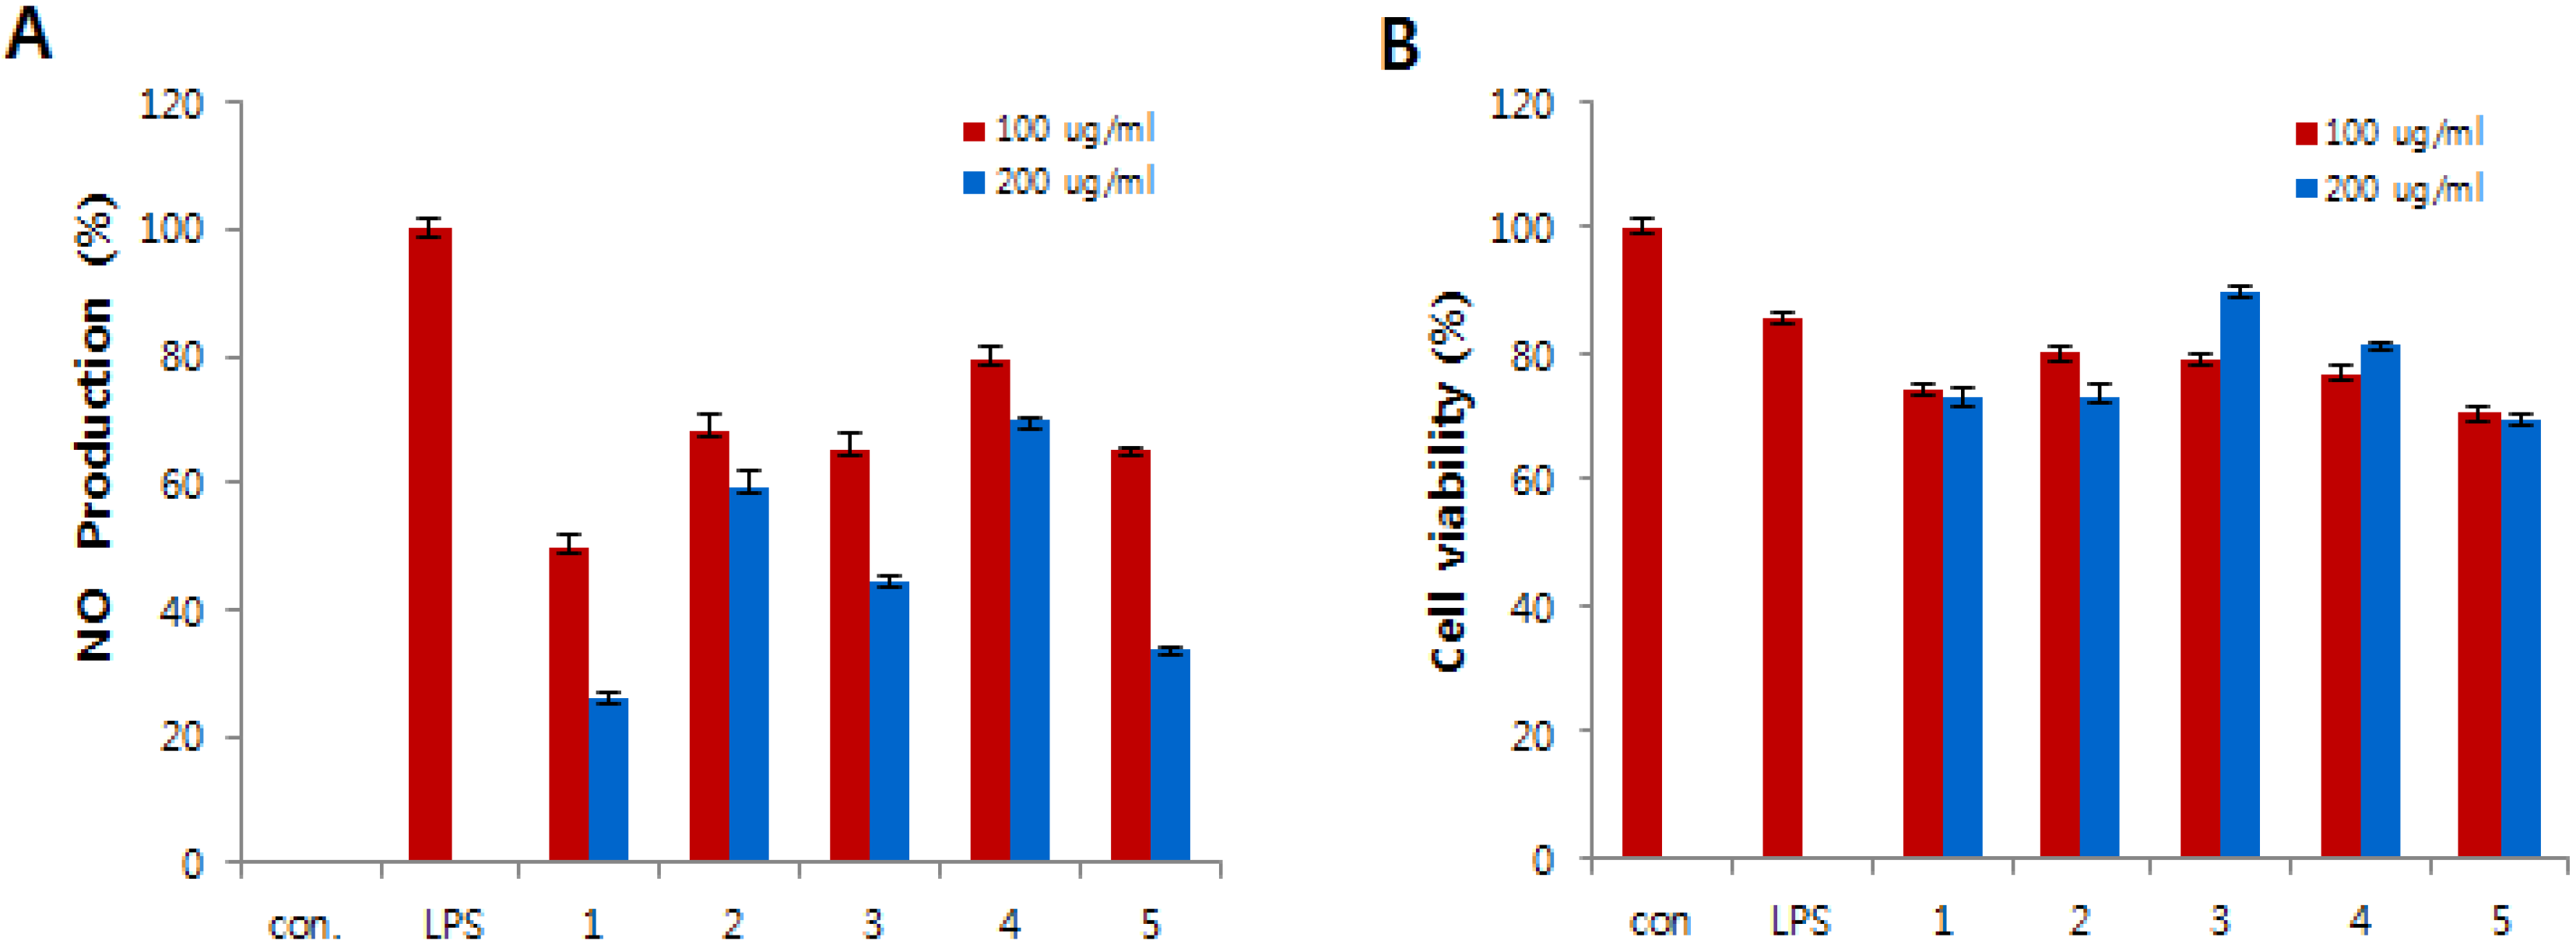
Compounds
1–
5 were tested for
in vitro anti-inflammatory activity by suppressing the production of NO in lipopolysaccharide (LPS)-induced RAW 264.7 cells. The RAW 264.7 cells were treated for 24 h with various concentrations of compounds
1–
5 and cytotoxicity was estimated using MTT assay. All compounds exhibited less cytotoxic effect on cells in comparison to control cells (
Figure 4B). LPS was used to stimulate the release of the inflammatory mediator NO from the RAW 264.7 macrophage cell line. The NO production was estimated from the accumulation of nitrite in the medium using the Griess reagent. As shown in
Figure 4A, the production of NO was strongly inhibited by compounds
1,
3, and
5.
Figure 4.
Effects of compounds 1–5 on nitric oxide (NO) production (A) and cell viability (B) in lipopolysaccharide (LPS)-induced RAW 264.7 macrophages. (A) The production of NO was measured in the culture medium of cells stimulated with LPS (1 μg/mL) for 24 h in the presence of compounds 1–5. (B) Cytotoxicity of compounds 1–5 was assayed by the MTT method. Cells (1.5 × 10⁵ cells/mL) were pre-incubated for 16 h, and then cells were stimulated with LPS (1 μg/mL) in the presence of compounds 1–5 at the indicated concentrations for 24 h.
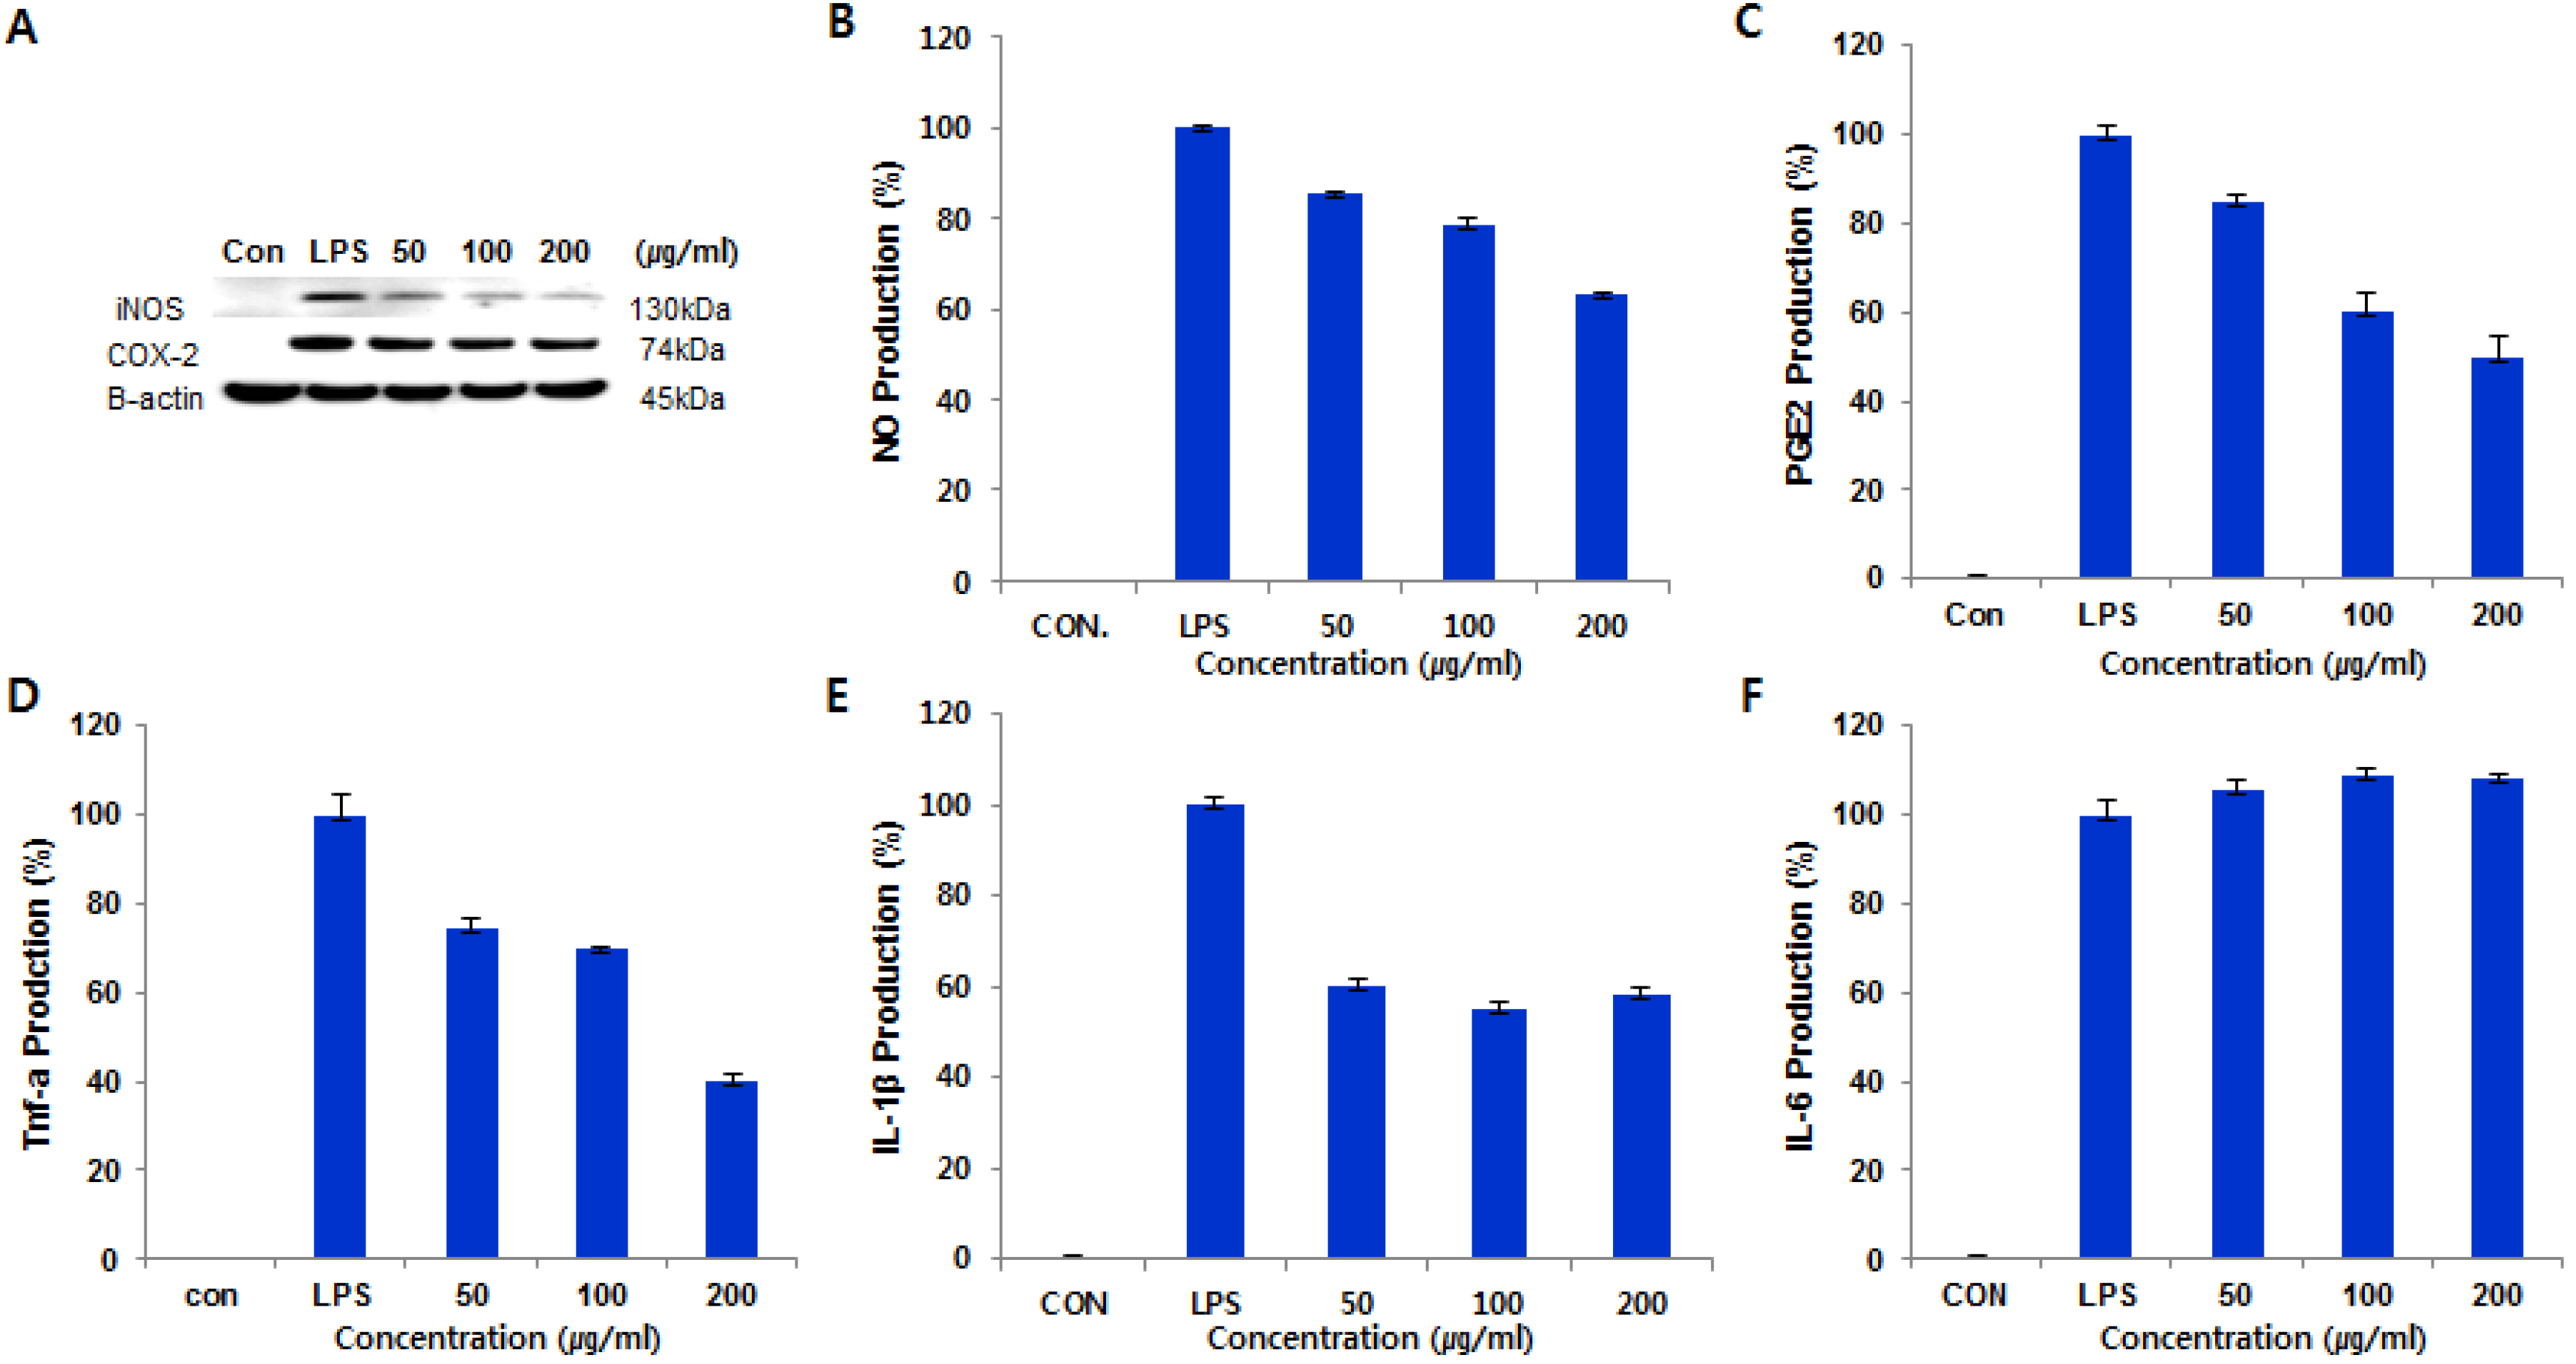
Based on this result, we studied further to investigate the effects of
1 on iNOS and COX-2 proteins and mRNA expressions in LPS-stimulated RAW 264.7 cells using immunoblot analysis. As shown in
Figure 5A, compound
1 inhibited iNOS and COX-2 protein levels in a dose-dependent manner, while the house-keeping protein
β-actin was unchanged by the existence of
1 at the same conditions. In addition, we measured the levels of inflammatory mediators, such as NO, PGE
2 and TNF-α, IL-1β, and IL-6, in LPS-stimulated RAW 264.7 cells. Compound
1 significantly reduced the production of NO, TNF-α, and IL-1β, but did not affect the level of IL-6, as shown in
Figure 5B–F.
Figure 5.
Cells (1.0 × 10⁶ cells/mL) were pre-incubated for 18 h, and then cells were stimulated with LPS (1 μg/mL) in the presence of compound 1 at the indicated concentrations for 24 h. (A) The protein levels of iNOS and COX-2 were determined by immunoblot analysis. The β-actin was used as a loading control. The effect of compound 1 on the production of NO (B); TNF-α (C); PGE2 (D); IL-1β (E); and IL-6 (F) in LPS-stimulated RAW 264.7 murine macrophage.
Tanzawaic acid derivatives have been reported to have multiple biological activities [
8,
9,
10,
11,
12,
13]. Tanzawaic acid A (
2) has been reported to have antimicrobial, anticoccidal activities and inhibited superoxide anion [
8,
9]. Tanzawaic acid K (
5) has also antimicrobial and anti-proliferative activities [
10]. The bioactivity tests revealed that tanzawaic acid C (
3) has no cytotoxicity at the concentration of 200 μg/mL. Meanwhile, tanzawaic acid K (
5) has moderate cytotoxic effect and inhibited NO production in LPS-stimulated RAW 264.7 murine macrophages at the concentration of 100 μg/mL. This inhibitory effect correlated with the inhibition effect of tanzawaic acid K (
5) on iNOS expression in LPS-stimulated RAW 264.7 cells.
3. Experimental Section
3.1. General Experimental Procedures
The 1H, 13C, and COSY, NOESY, HSQC, HMBC NMR spectra were acquired on a Varian Unity 500 MHz spectrometer. Optical rotations were measured on a JASCO DIP-1000 digital polarimeter (JASCO Corporation, Tokyo, Japan), with a 1 cm cell. UV spectra were obtained on a Shimadzu UV-1650PC spectrophotometer (Shimadzu Corporation, Kyoto, Japan). IR spectra were recorded on a JASCO FT/IR-4100 spectrophotometer, (JASCO Corporation, Tokyo, Japan). High-resolution ESI mass spectroscopy was recorded on a hybrid ion-trap time-flight mass spectrometer (SYNAPT G2, Wasters Corporation, Milford, CT, USA). High performance liquid chromatography (HPLC) was conducted with a PrimeLine pump (Analytical Scientific Instrument, Inc., El Sobrante, CA, USA) with RI 2000 refractive index detector (JORDI Labs, Mansfield, UK). Semi-preparative HPLC was performed using ODS (YMC-pack-ODS-A, 250 × 10 mm i.d., 5 μm).
3.2. Isolation and Identification of the Strain 108YD142
The strain 108YD142 was isolated from a marine sponge sample collected at Wangdolcho, East Sea, Korea, in 2010, by serial dilution technique and grown on Bennett’s agar plates (1% glucose, 0.2% tryptone, 0.1% yeast extract, 0.1% beef extract, 0.5% glycerol, 1.7% agar, salinity 32 g/L, pH 7.0 before sterilization). The plates were incubated for seven days at 28 °C, and the resulting colony of the strain 108YD142 was isolated and stocked in 40% glycerol. According to BLAST and phylogenetic analysis based on 18s rRNA gene sequences, the strain was identified as Penicillium steckii. The sequence was deposited in GenBank under the accession number KU316936. This strain is currently preserved in the Microbial Culture Collection, Korea Institute of Ocean Science and Technology (KIOST), under the curatorship of Hee Jae Shin.
3.3. Seed and Mass Cultures of the Strain 108YD142
The seed and mass cultures of the strain 108YD142 were carried out in Bennett’s medium (1% glucose, 0.2% tryptone, 0.1% yeast extract, 0.1% beef extract, 0.5% glycerol, 3.2% sea salt, pH 7.0 before sterilization). The medium (300 mL) was provided into a 500 mL conical flask and sterilized. A single colony of the strain from the agar plate was inoculated into the flask and incubated at 28 °C for four days on a rotary shaker at 120 rpm. An aliquot (0.1% v/v) from the seed culture was inoculated into 2 L flasks (total 13 flasks) containing 1 L medium and a 20 L fermenter containing 17 L of sterilized medium. The mass culture was incubated under the same conditions as the seed culture for seven days and then harvested.
3.4. Extraction and Isolation of Compounds
The culture broth (total 30 L) was harvested by high speed centrifugation (60,000 rpm) and then extracted with EtOAc (two times). The EtOAc extract was evaporated to obtain crude extract (1.97 g). The crude extract was subjected to an ODS open column chromatography followed by stepwise gradient elution with MeOH/H2O (v/v) (1:4, 2:3, 3:2, 4:1, and 100:0) as eluent. The subfraction eluted with MeOH/H2O (4:1) was purified by a reversed-phase HPLC (YMC ODS-A column, 250 × 10 mm i.d, 5 μm; 70% MeOH in H2O; flow rate 1.5 mL/min; RI detector) to yield pure compounds 1 (1.7 mg, tR 115 min), 3 (4.2 mg, tR 88 min), 4 (12 mg, tR 42 min), and 5 (1.4 mg, tR 97 min) and the subfraction eluted with MeOH/H2O (100:0) was purified by a reversed-phase HPLC (YMC ODS-A column, 250 × 10 mm i.d., 5 μm; 90% MeOH in H2O; flow rate 1.5 mL/min; RI detector) to yield pure compound 2 (0.9 mg, tR 26 min).
Tanzawaic acid Q (
1): Yellow oil; [α]
+ 69.5° (
c 0.5, MeOH); UV (MeOH) λ
max (log ε) 259 (4.82); IR (MeOH) ν
max 3397, 2923, 1678, 1639, 1550, 1394, 1263 cm
−1;
1H and
13C NMR data (
Table 1); APCI-MS
m/
z 289.08 [M − H]
−; HR-ESI-MS
m/
z 313.1777 [M + Na]
+ (calcd for C
18H
26O
3Na,
m/
z 313.1780 [M + Na]
+).
Tanzawaic acid A (2): Yellow oil; C18H22O2; [α] + 297° (c 0.5, MeOH); UV (MeOH) λmax (log ε) 205 (5.51); IR (MeOH) νmax 3418, 2923, 1695, 1629 cm−1; APCI-MS m/z 268.94 [M − H]−.
Tanzawaic acid C (3): Yellow oil; C18H26O3; [α] + 173° (c 0.5, MeOH); UV (MeOH) λmax (log ε) 258 (4.74); IR (MeOH) νmax 3433, 2929, 1724, 1635, 1271 cm−1; APCI-MS m/z 289.06 [M − H]−.
Tanzawaic acid D (4): Yellow oil; C18H22O3; [α] + 56.4° (c 0.57, MeOH); UV (MeOH) λmax (log ε) 207 (4.97); IR (MeOH) νmax 3386, 2925, 1688, 1377, 1267 cm−1; APCI-MS m/z 284.65 [M − H]−.
Tanzawaic acid K (5): Yellow oil; C18H26O3; [α] − 29.1° (c 0.5, MeOH); UV (MeOH) λmax (log ε) 257 (4.94); IR (MeOH) νmax 3390, 2923, 1681, 1643, 1457, 1270 cm−1; APCI-MS m/z 289.03 [M − H]−.
3.5. Cell Culture
The murine macrophage cell line RAW 264.7 was purchased from the Korean Cell Line Bank (KCLB; Seoul, Korea). RAW 264.7 cells were cultured in Dulbecco’s modified Eagle’s medium (DMEM; GIBCO Inc., NY, USA) supplemented with 100 U/mL of penicillin, 100 μg/mL of streptomycin and 10% fetal bovine serum (FBS; GIBCO Inc., New York, NY, USA). The cells were incubated in a humidified atmosphere of 5% CO2 at 37 °C and sub-cultured every three days.
3.6. Determination of Cell Viability
Cell viability was measured twice using the conventional MTT assay. RAW 264.7 cells were seeded in 96-well plates at a density of 1.5 × 10⁵ cells/mL. After 16 h, the cells were treated with LPS (1 μg/mL) and samples, followed by additional incubation for 24 h at 37 °C. MTT stock solution (2 mg/mL) was added to wells for a total reaction volume of 200 μL. After 4 h incubation, the plates were centrifuged for 5 min at 800 g, and the supernatants were aspirated. The formazan crystals in each well were dissolved in 150 μL of DMSO, and the absorbance was measured using a microplate reader (ThermoMax, Sunnyvale, CA, USA) at a wavelength of 540 nm. Relative cell viability was evaluated based on the quantity of MTT converted to the insoluble formazan salt. The optical density of formazan generated in the control cells represented 100% viability. The data are expressed as mean percentages of the viable cells compared to the respective control.
3.7. Determination of NO Production
After pre-incubation of RAW 264.7 cells (1.5 × 10
5 cells/mL) with LPS (1 μg/mL) and samples at 37 °C for 24 h, the quantity of nitrite accumulated in the culture medium was measured twice as an indicator of NO production [
14]. Briefly, 100 μL of cell culture medium were mixed with 100 μL Griess reagent (1% sulfanilamide and 0.1% naphthylethylenediamine dihydrochloride in 2.5% phosphoric acid), and incubated at room temperature for 10 min. Absorbance at 540 nm was measured in a microplate reader (ThermoMax, Sunnyvale, CA, USA). Fresh culture medium was used as the blank in all determinations.
3.8. Determination of PGE2 Production
Samples were diluted with DMEM before treatment. Cells were treated with LPS (1 μg/mL) to allow cytokine production for 24 h. The PGE2 concentration in the culture medium was quantified using a competitive enzyme immunoassay kit (R & D Systems, Minneapolis, MN, USA) according to the manufacturer’s instructions. PGE2 production was measured relative to that of the control.
3.9. Measurement of Pro-Inflammatory Cytokine Production
Samples solubilized in DMSO were diluted with DMEM before treatment. The inhibitory effect of samples on pro-inflammatory cytokine (TNF-α, IL-1β, and IL-6) production from LPS (1 μg/mL)-treated RAW 264.7 cells was determined as described by Cho
et al. [
15]. Supernatants were assayed using mouse ELISA kits (R&D Systems Inc., Minneapolis, MN, USA).
5. Conclusions
As a result, we isolated a new tanzawaic acid derivative, tanzawaic acid Q (
1), and four known analogues, tanzawaic acids A (
2), C (
3), D (
4) and K (
5), from a marine-derived fungus,
Penicillium steckii 108YD142. Tanzawaic acids Q (
1), C (
3) and K (
5) strongly inhibited LPS-induced NO production. Especially, tanzawaic acid Q (
1) inhibited the expression of iNOS and COX-2 proteins in RAW264.7 cells. Also,
1 depleted the production of PGE
2, TNF-α, and IL-1β mRNA protein. Based on the anti-inflammatory effects of tanzawaic acid Q (
1), C (
3) and K (
5) against LPS-stimulated RAW 264.7 macrophages, it could be suggested that the position of the hydroxyl group (OH) or the presence of the carboxyl group (COOH) in the structure might be key structural features for the anti-inflammatory activity of tanzawaic acids. Tanzawaic acid A, which has an aromatic ring, exhibited good anti-inflammatory activity [
6], suggesting that the aromatic ring is also important for the activity. In conclusion, this study revealed for the first time that tanzawaic acid Q (
1) possesses anti-inflammatory activity. However, further studies are needed to know the detailed mechanism of the anti-inflammatory activity of
1.


 ,
, 
