
Anti-Obese Effect of Glucosamine and Chitosan Oligosaccharide in High-Fat Diet-Induced Obese Rats

Abstract
:1. Introduction
2. Results and Discussion
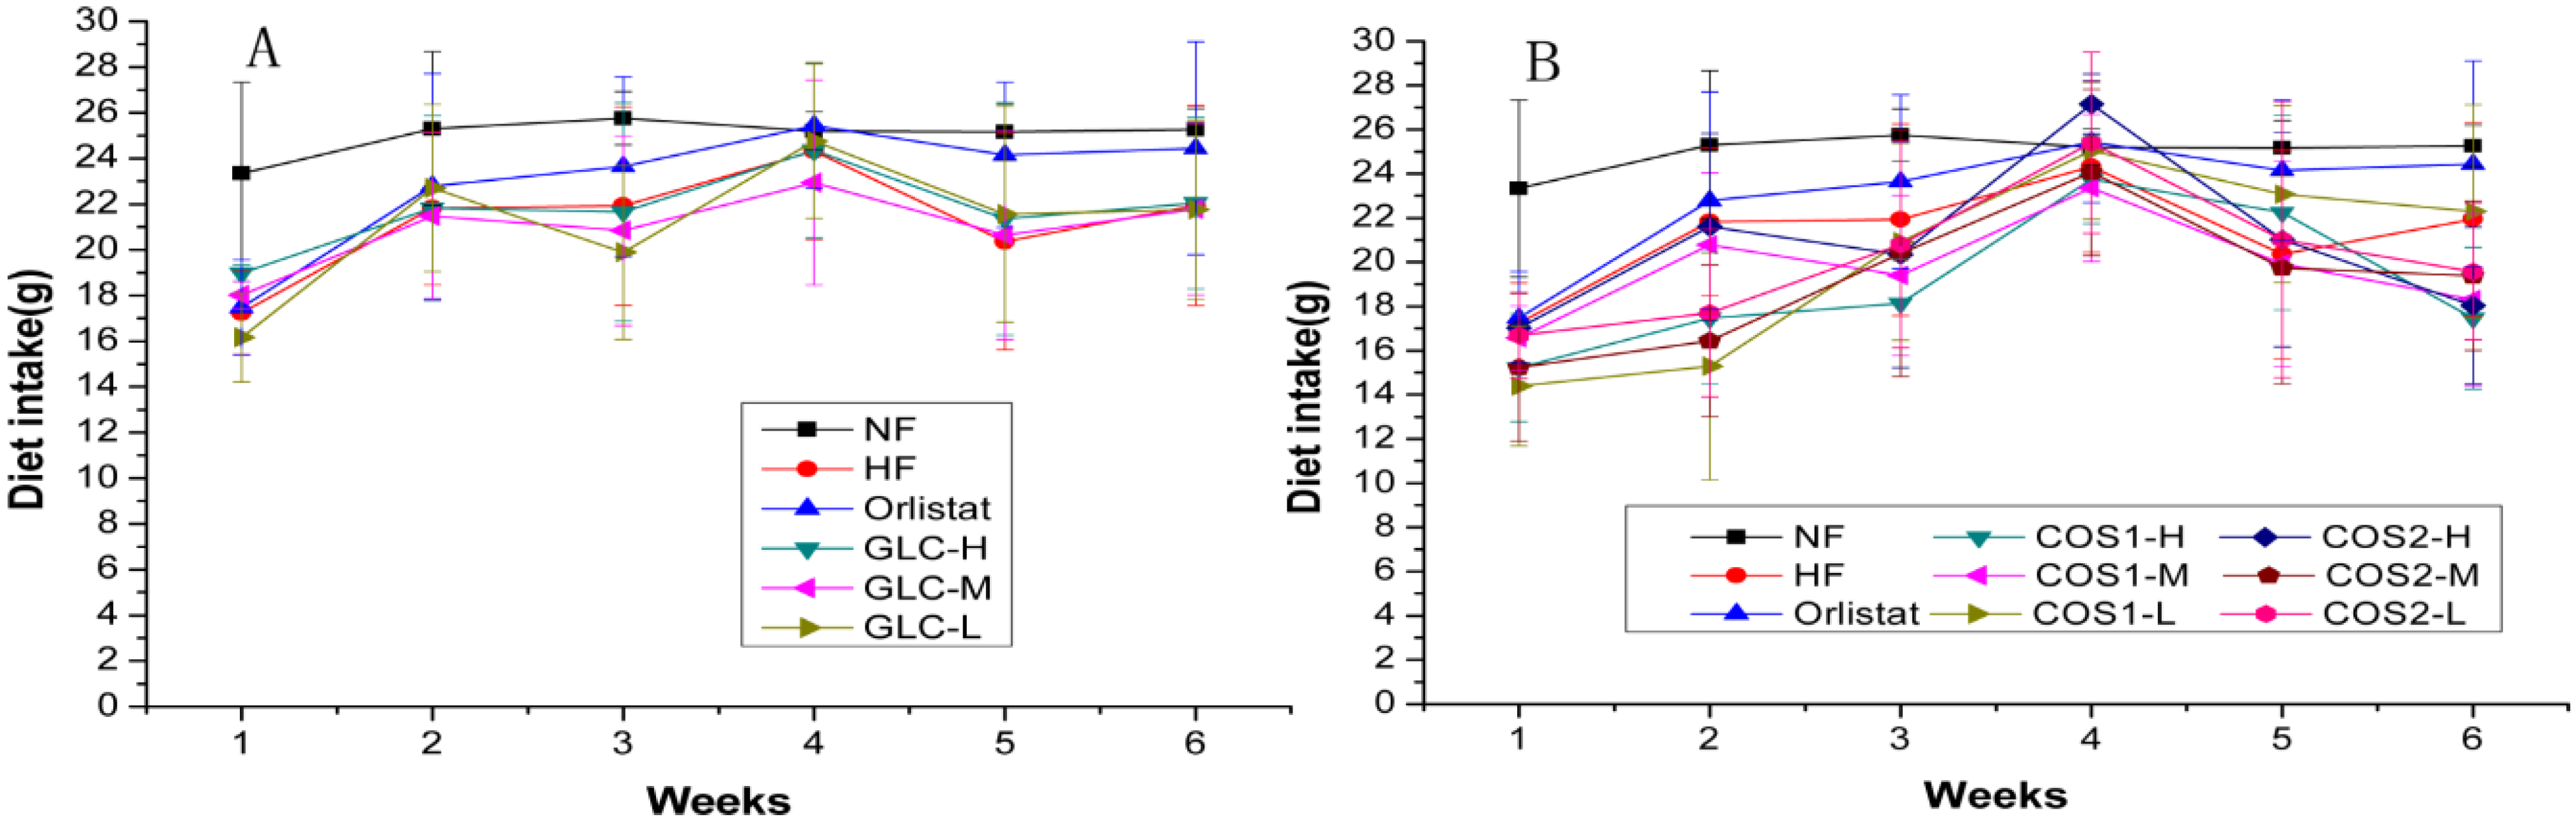
2.1. Food Intake

| Groups | Dietary Intake during Administration (g/day) |
|---|---|
| NF | 25.07 ± 2.40 ** |
| HF | 21.27 ± 4.14 |
| Orlistat | 22.99 ± 4.29 |
| GLC-H | 21.70 ± 3.94 |
| GLC-M | 20.95 ± 3.77 |
| GLC-L | 21.14 ± 4.30 |
| COS1-H | 19.04 ± 4.05 *## |
| COS1-M | 19.72 ± 3.84 ## |
| COS1-L | 20.17 ± 5.12 # |
| COS2-H | 20.86 ± 4.75 |
| COS2-M | 19.21 ± 4.81 ## |
| COS2-L | 20.19 ± 4.25 # |
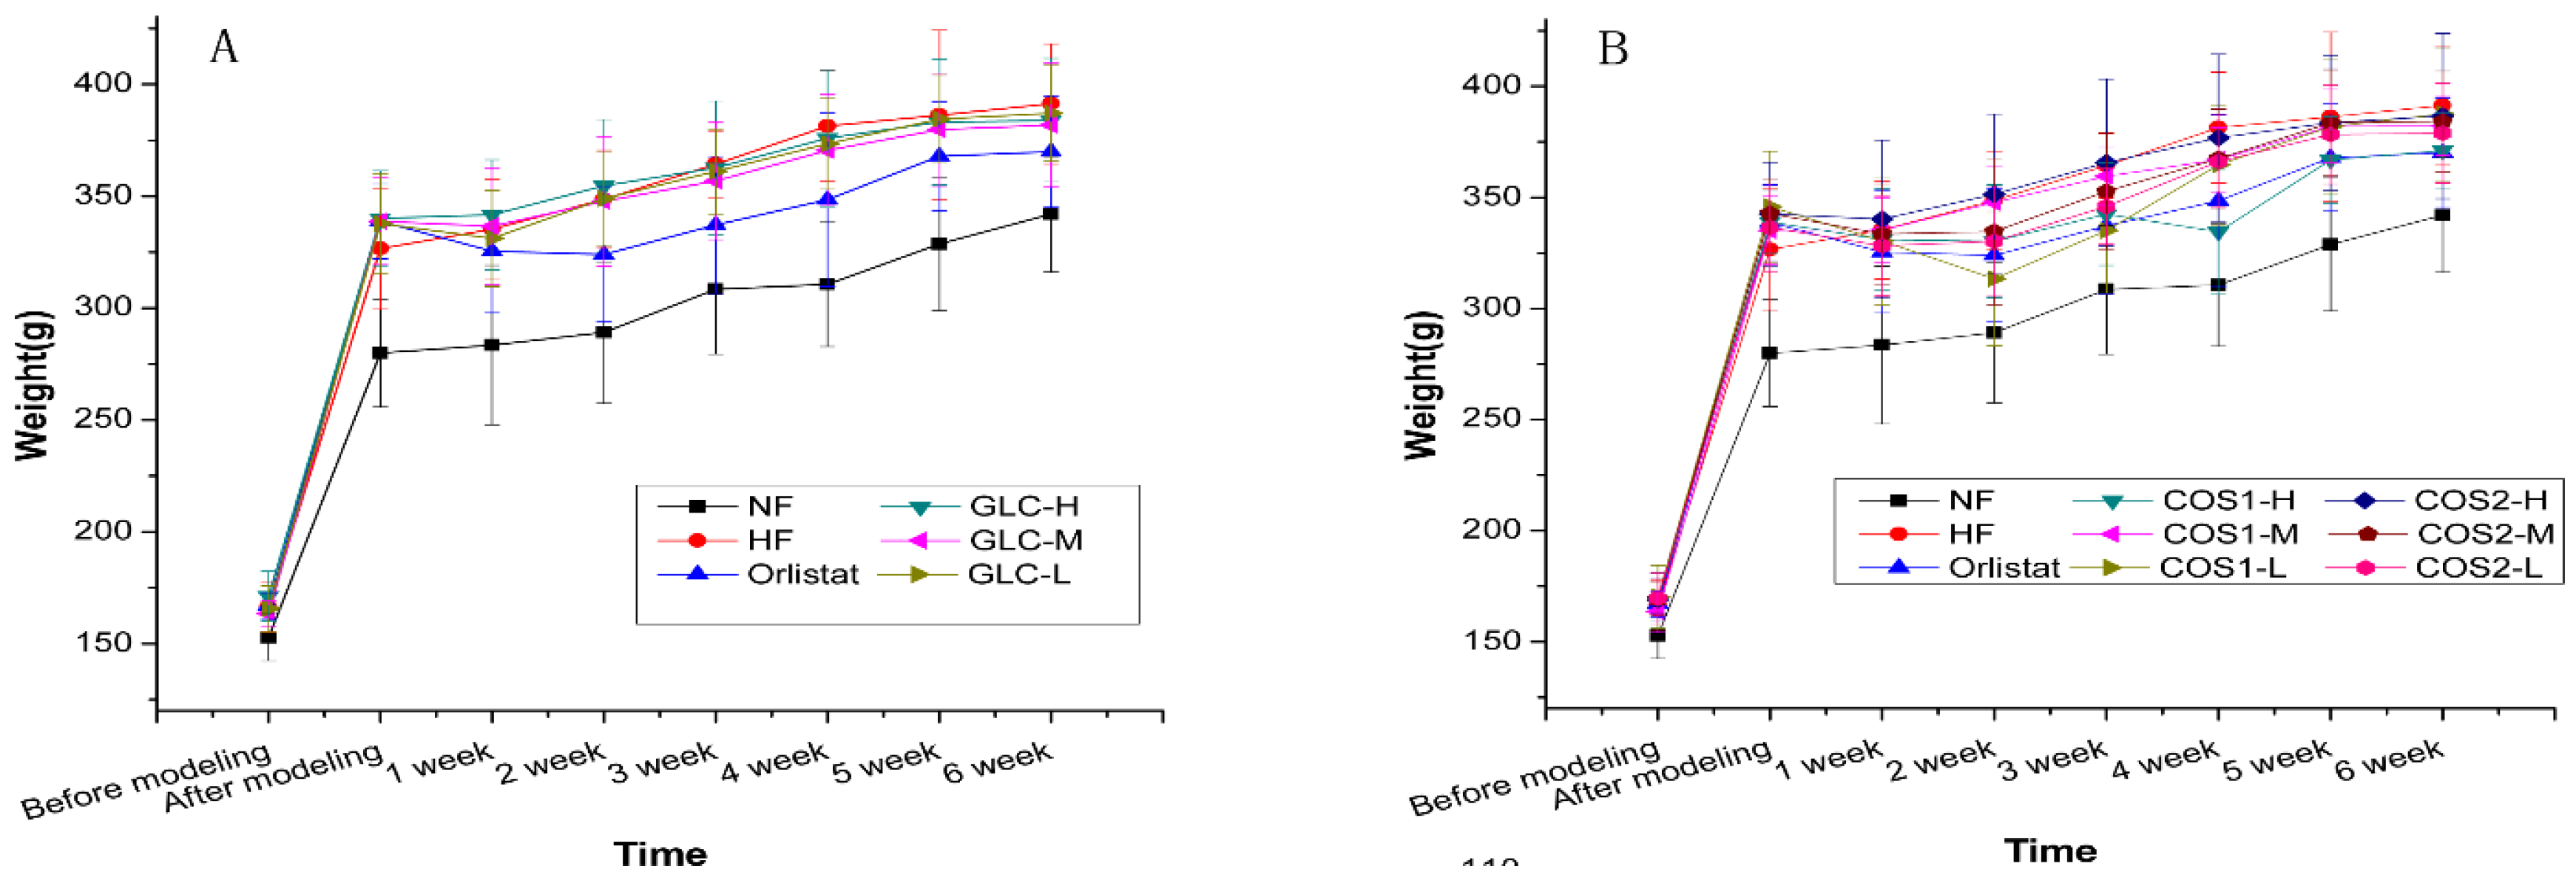
2.2. Body Weight
| Groups | Weight before Modeling (g) | Weight before Administration (g) | Weight after Administration (g) | Weight Gain during Administration(g) |
|---|---|---|---|---|
| NF | 152.78 ± 10.34 **## | 279.92 ± 24.07 **## | 342.34 ± 25.51 **## | 62.42 ± 14.52 ## |
| HF | 166.39 ± 11.49 | 337.01 ± 20.35 | 397.38 ± 18.00 # | 60.37 ± 26.39 ## |
| Orlistat | 167.04 ± 5.84 | 335.29 ± 20.08 | 369.99 ± 24.74 * | 34.70 ± 19.48 ** |
| GLC-H | 171.31 ± 11.07 | 340.18 ± 21.24 | 383.91 ± 27.70 | 43.74 ± 14.14 * |
| GLC-M | 163.51 ± 5.65 | 338.81 ± 19.44 | 381.90 ± 27.57 | 43.09 ± 11.87 * |
| GLC-L | 165.61 ± 10.22 | 337.77 ± 22.20 | 387.19 ± 21.32 | 49.42 ± 12.56 # |
| COS1-H | 168.27 ± 12.41 | 338.96 ± 13.79 | 371.10 ± 16.72 * | 32.14 ± 14.60 ** |
| COS1-M | 163.64 ± 9.40 | 335.09 ± 15.22 | 382.11 ± 13.07 | 47.03 ± 13.70 |
| COS1-L | 170.31 ± 14.16 | 345.76 ± 24.98 | 387.59 ± 29.98 | 41.83 ± 8.93 * |
| COS2-H | 168.96 ± 9.96 | 342.53 ± 23.31 | 386.59 ± 37.20 | 44.06 ± 20.46 * |
| COS2-M | 169.16 ± 7.42 | 335.29 ± 20.16 | 384.10 ± 22.72 | 41.39 ± 14.28 * |
| COS2-L | 169.64 ± 11.46 | 336.36 ± 19.61 | 378.87 ± 22.42 | 42.51 ± 10.31 * |
2.3. Organ Index
| Groups | Cardiac Index (%) | Liver Index (%) |
|---|---|---|
| NF | 0.32 ± 0.02 # | 2.41 ± 0.19 * |
| HF | 0.33 ± 0.03 | 2.59 ± 0.28 |
| Orlistat | 0.30 ± 0.03 | 2.44 ± 0.23 |
| GLC-H | 0.31 ± 0.02 | 2.75 ± 0.17 ## |
| GLC-M | 0.32 ± 0.02 | 2.55 ± 0.15 |
| GLC-L | 0.33 ± 0.03 # | 2.53 ± 0.18 |
| COS1-H | 0.33 ± 0.02 | 2.39 ± 0.16 * |
| COS1-M | 0.33 ± 0.03 # | 2.35 ± 0.23 ** |
| COS1-L | 0.32 ± 0.03 | 2.41 ± 0.10 * |
| COS2-H | 0.32 ± 0.03 | 2.38 ± 0.18 * |
| COS2-M | 0.30 ± 0.01 | 2.41 ± 0.16 |
| COS2-L | 0.31 ± 0.03 | 2.34 ± 0.12 ** |
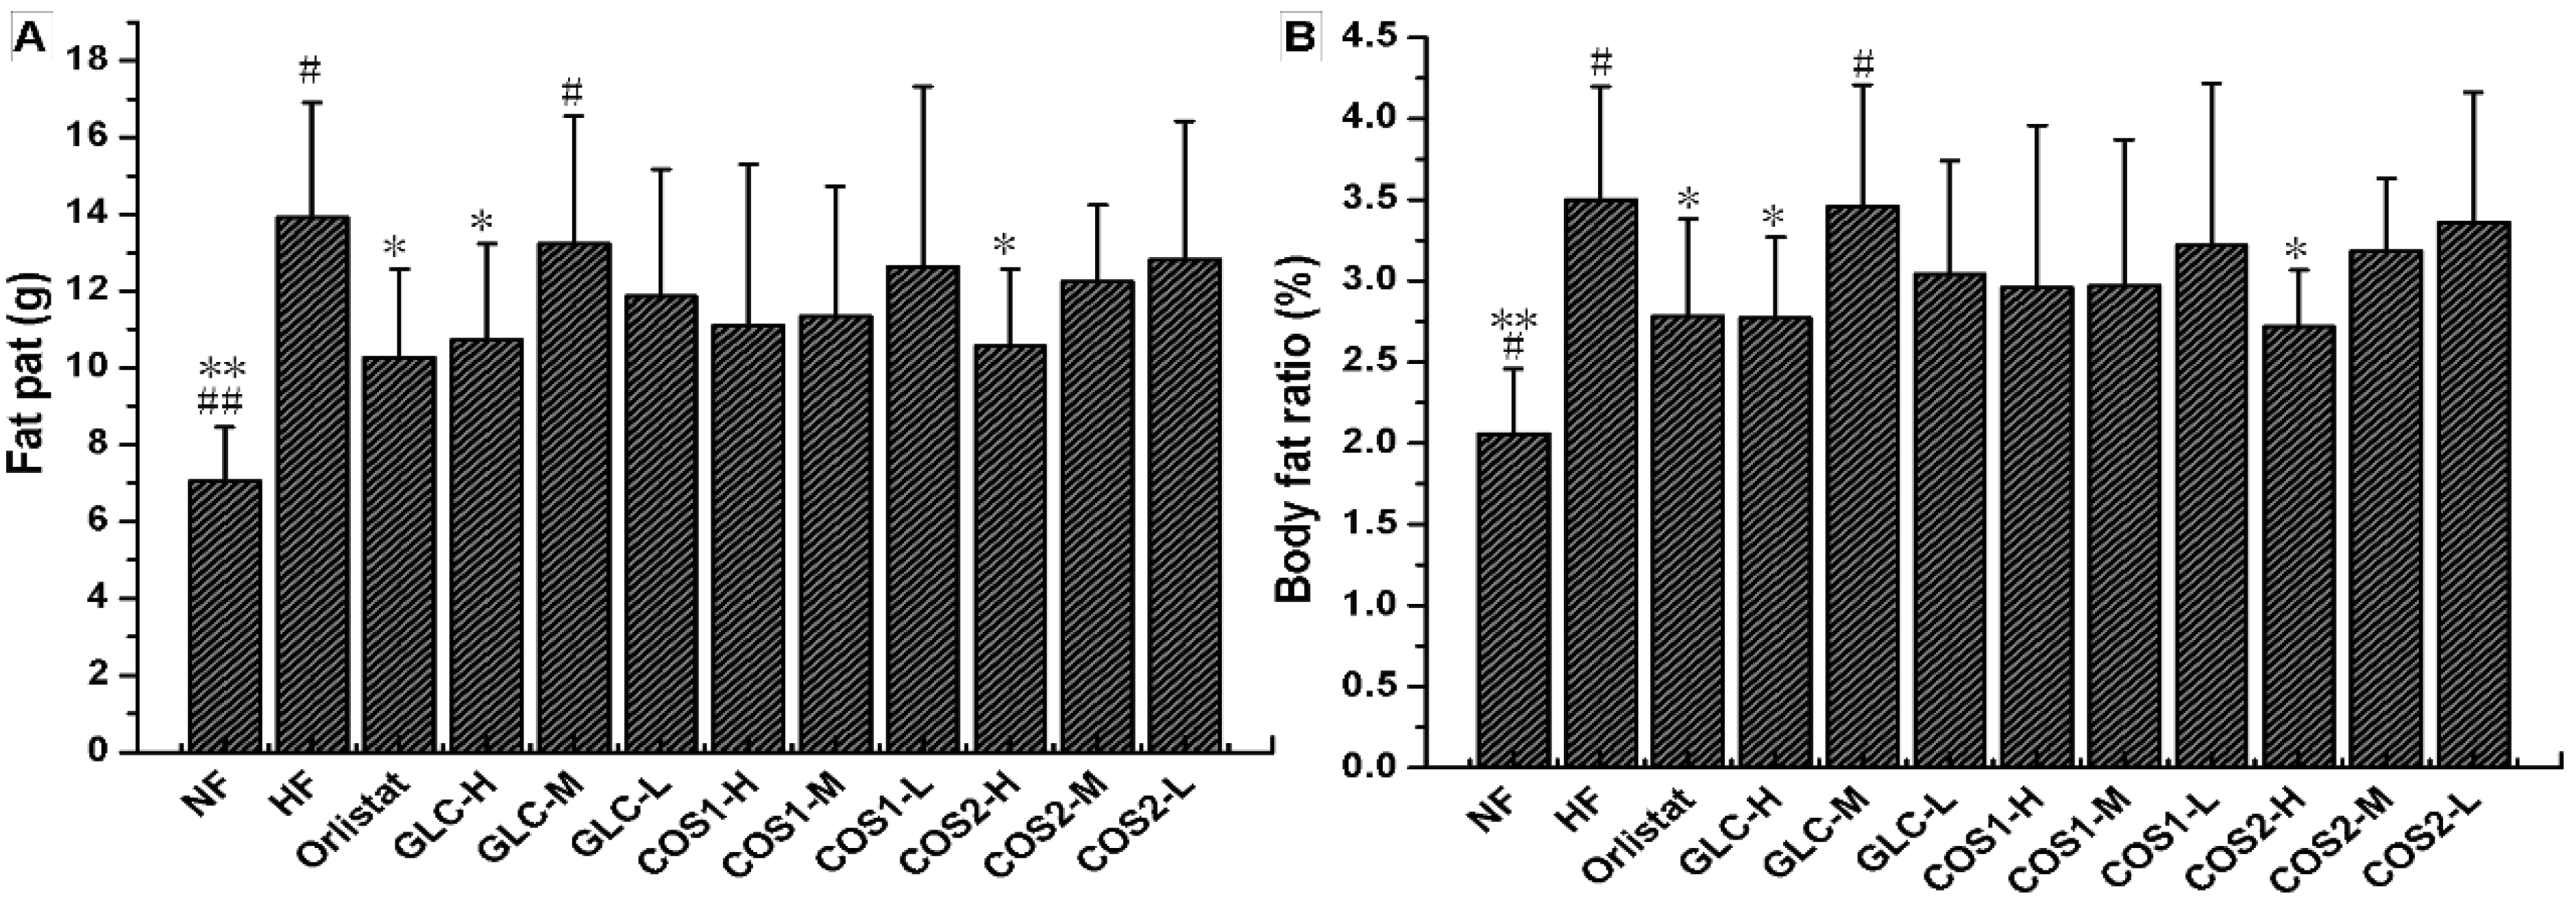
2.4. Fat Pad and Body Fat Ratio
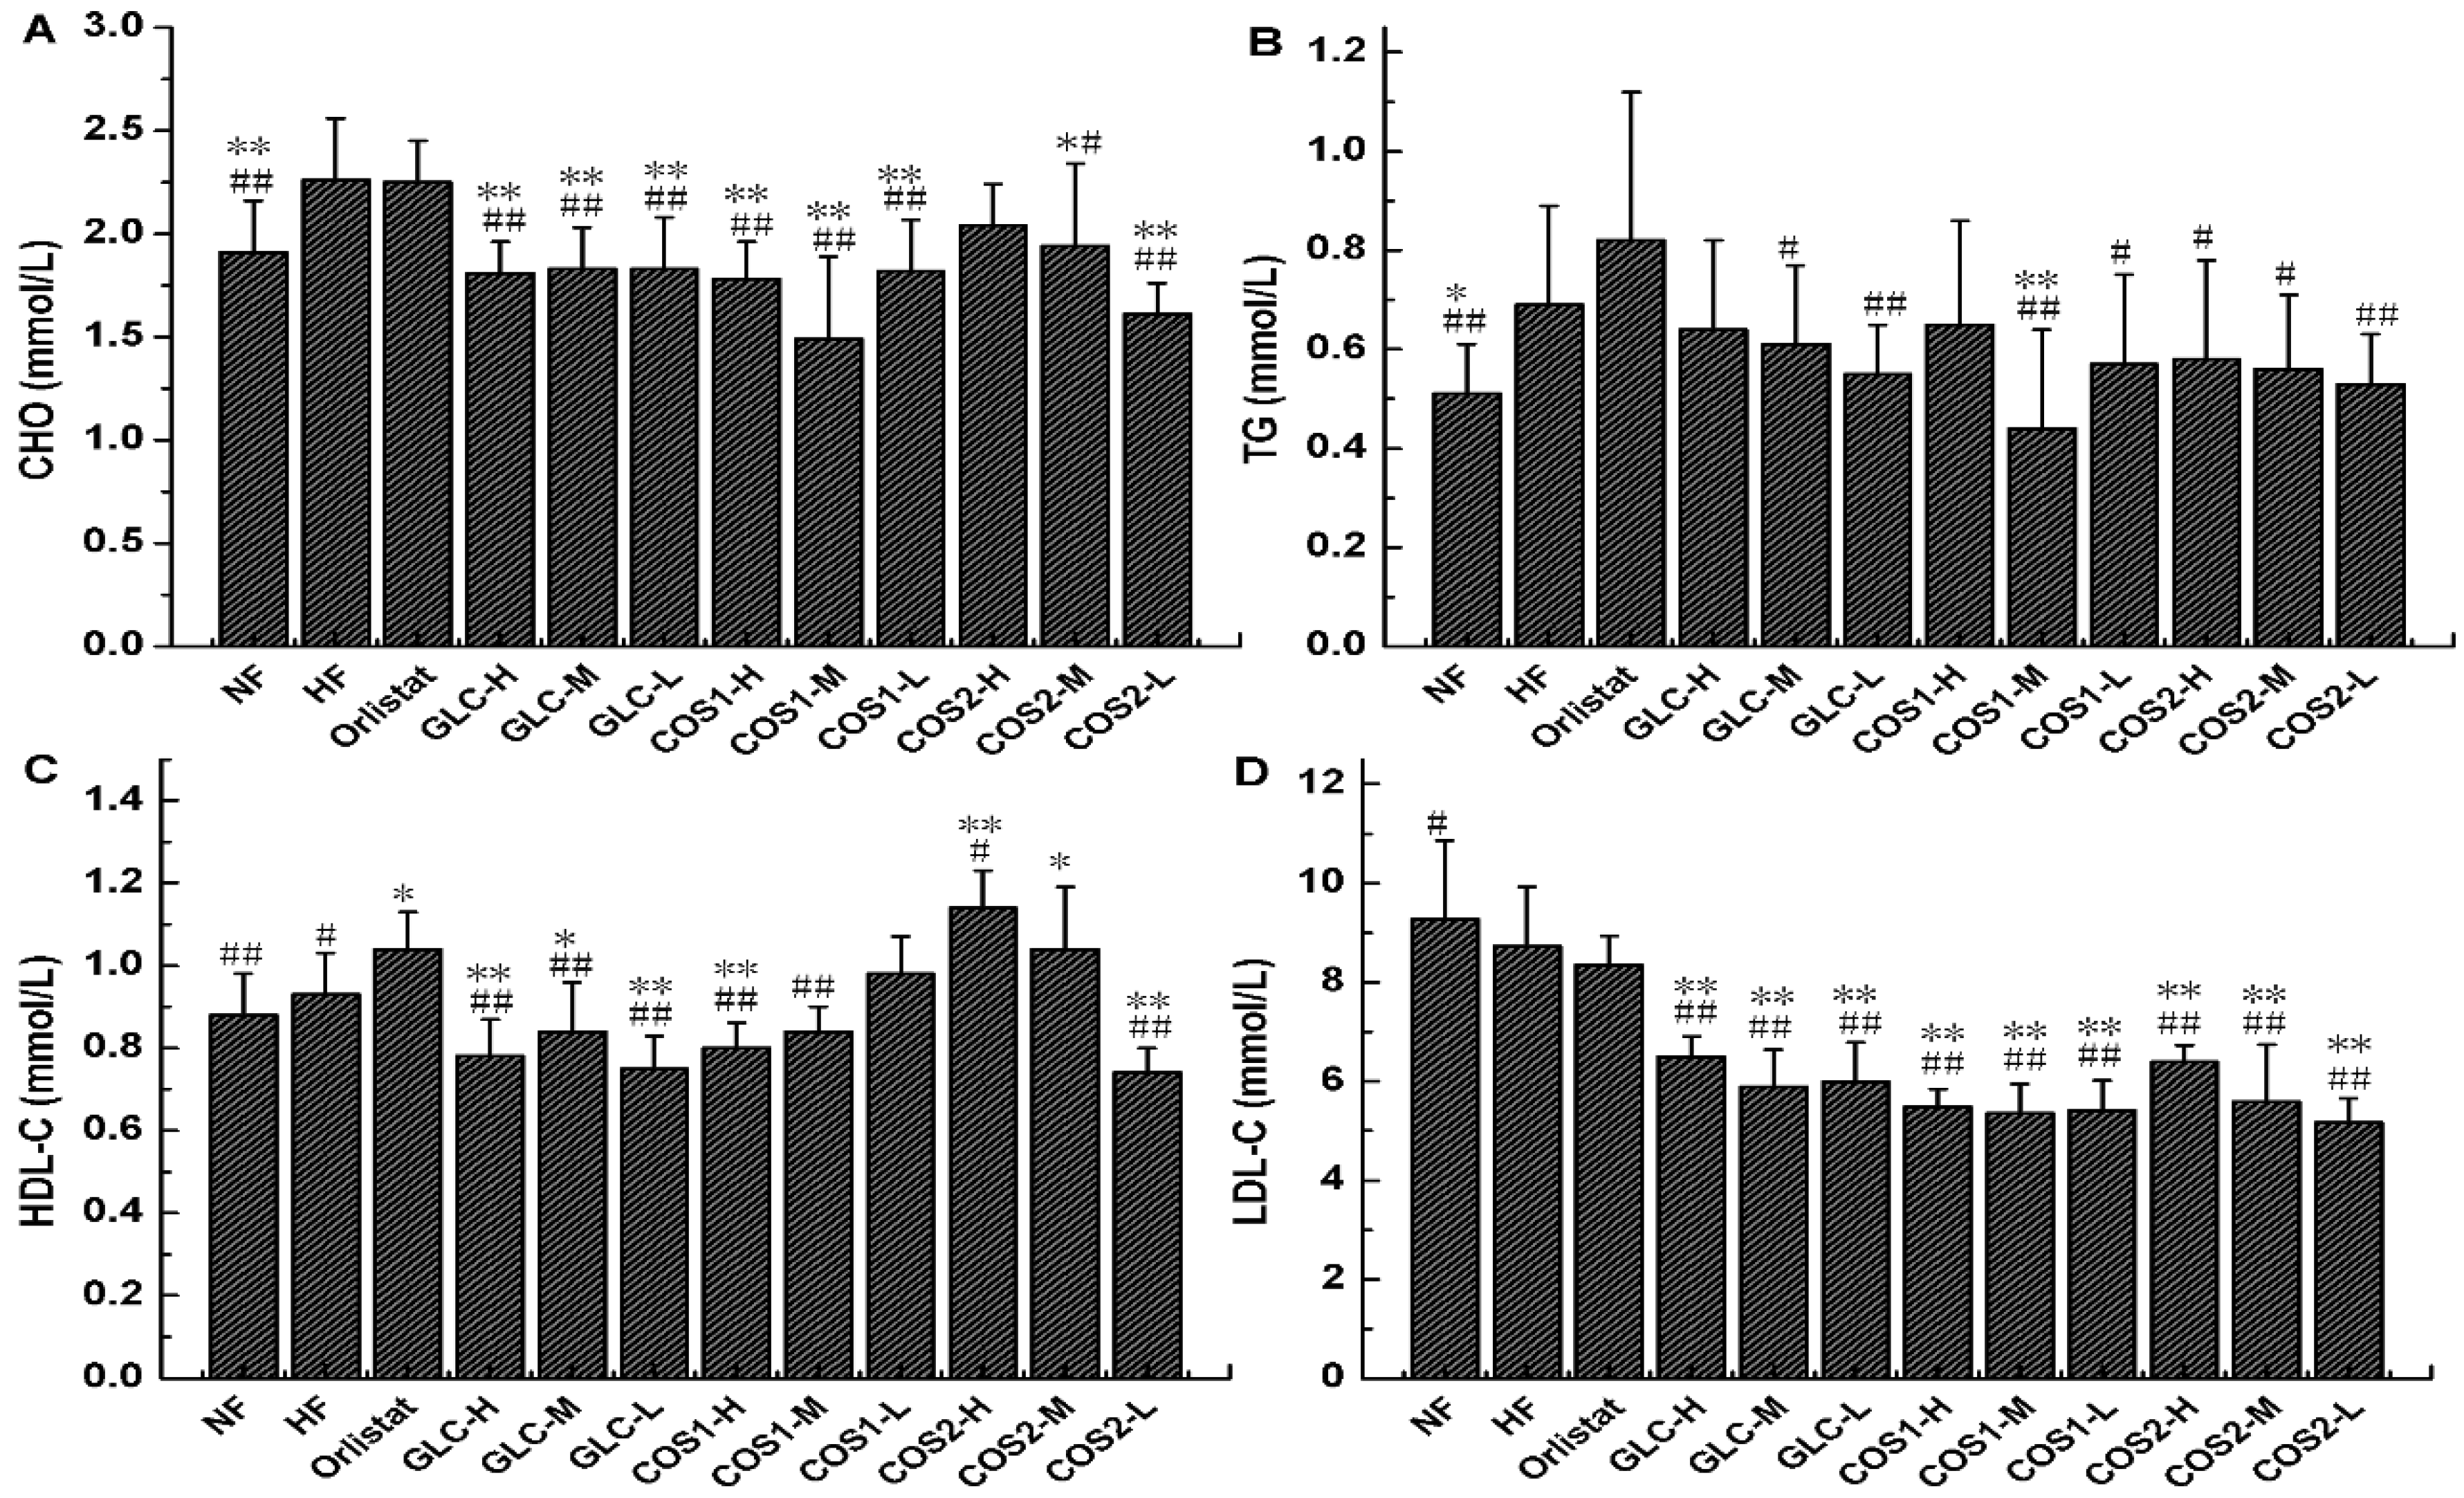
2.5. Serum Lipid Determination

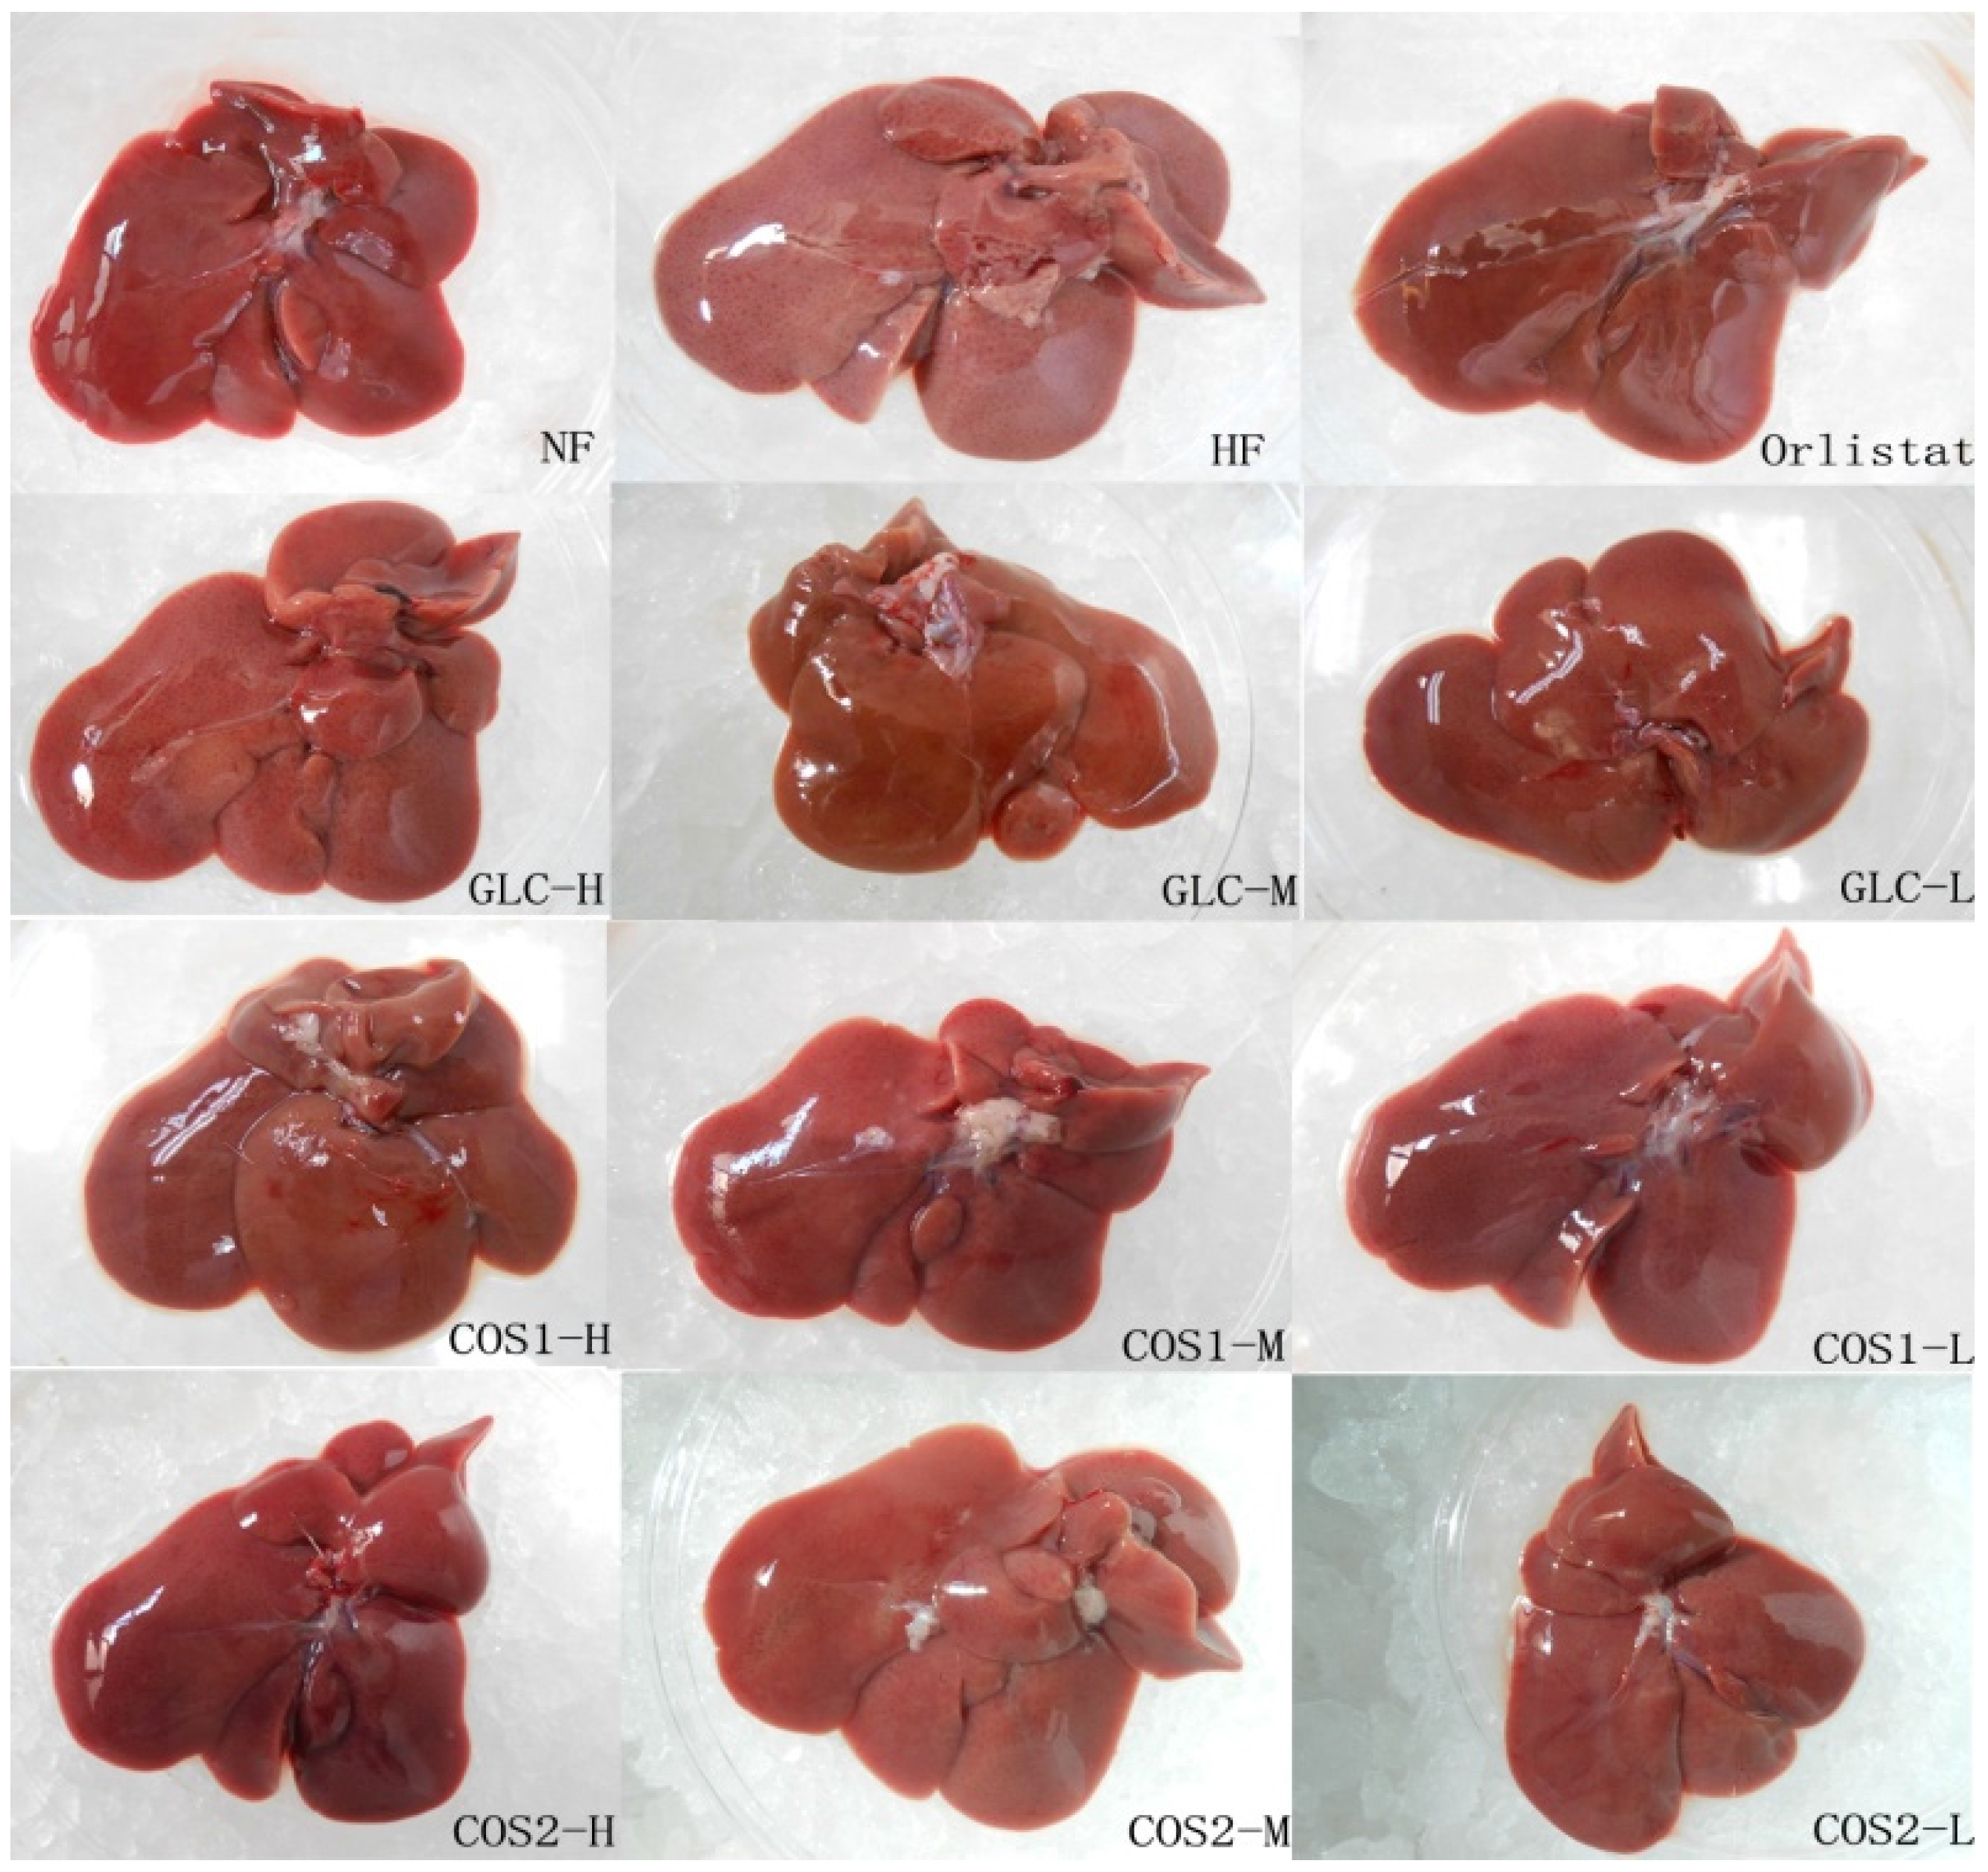
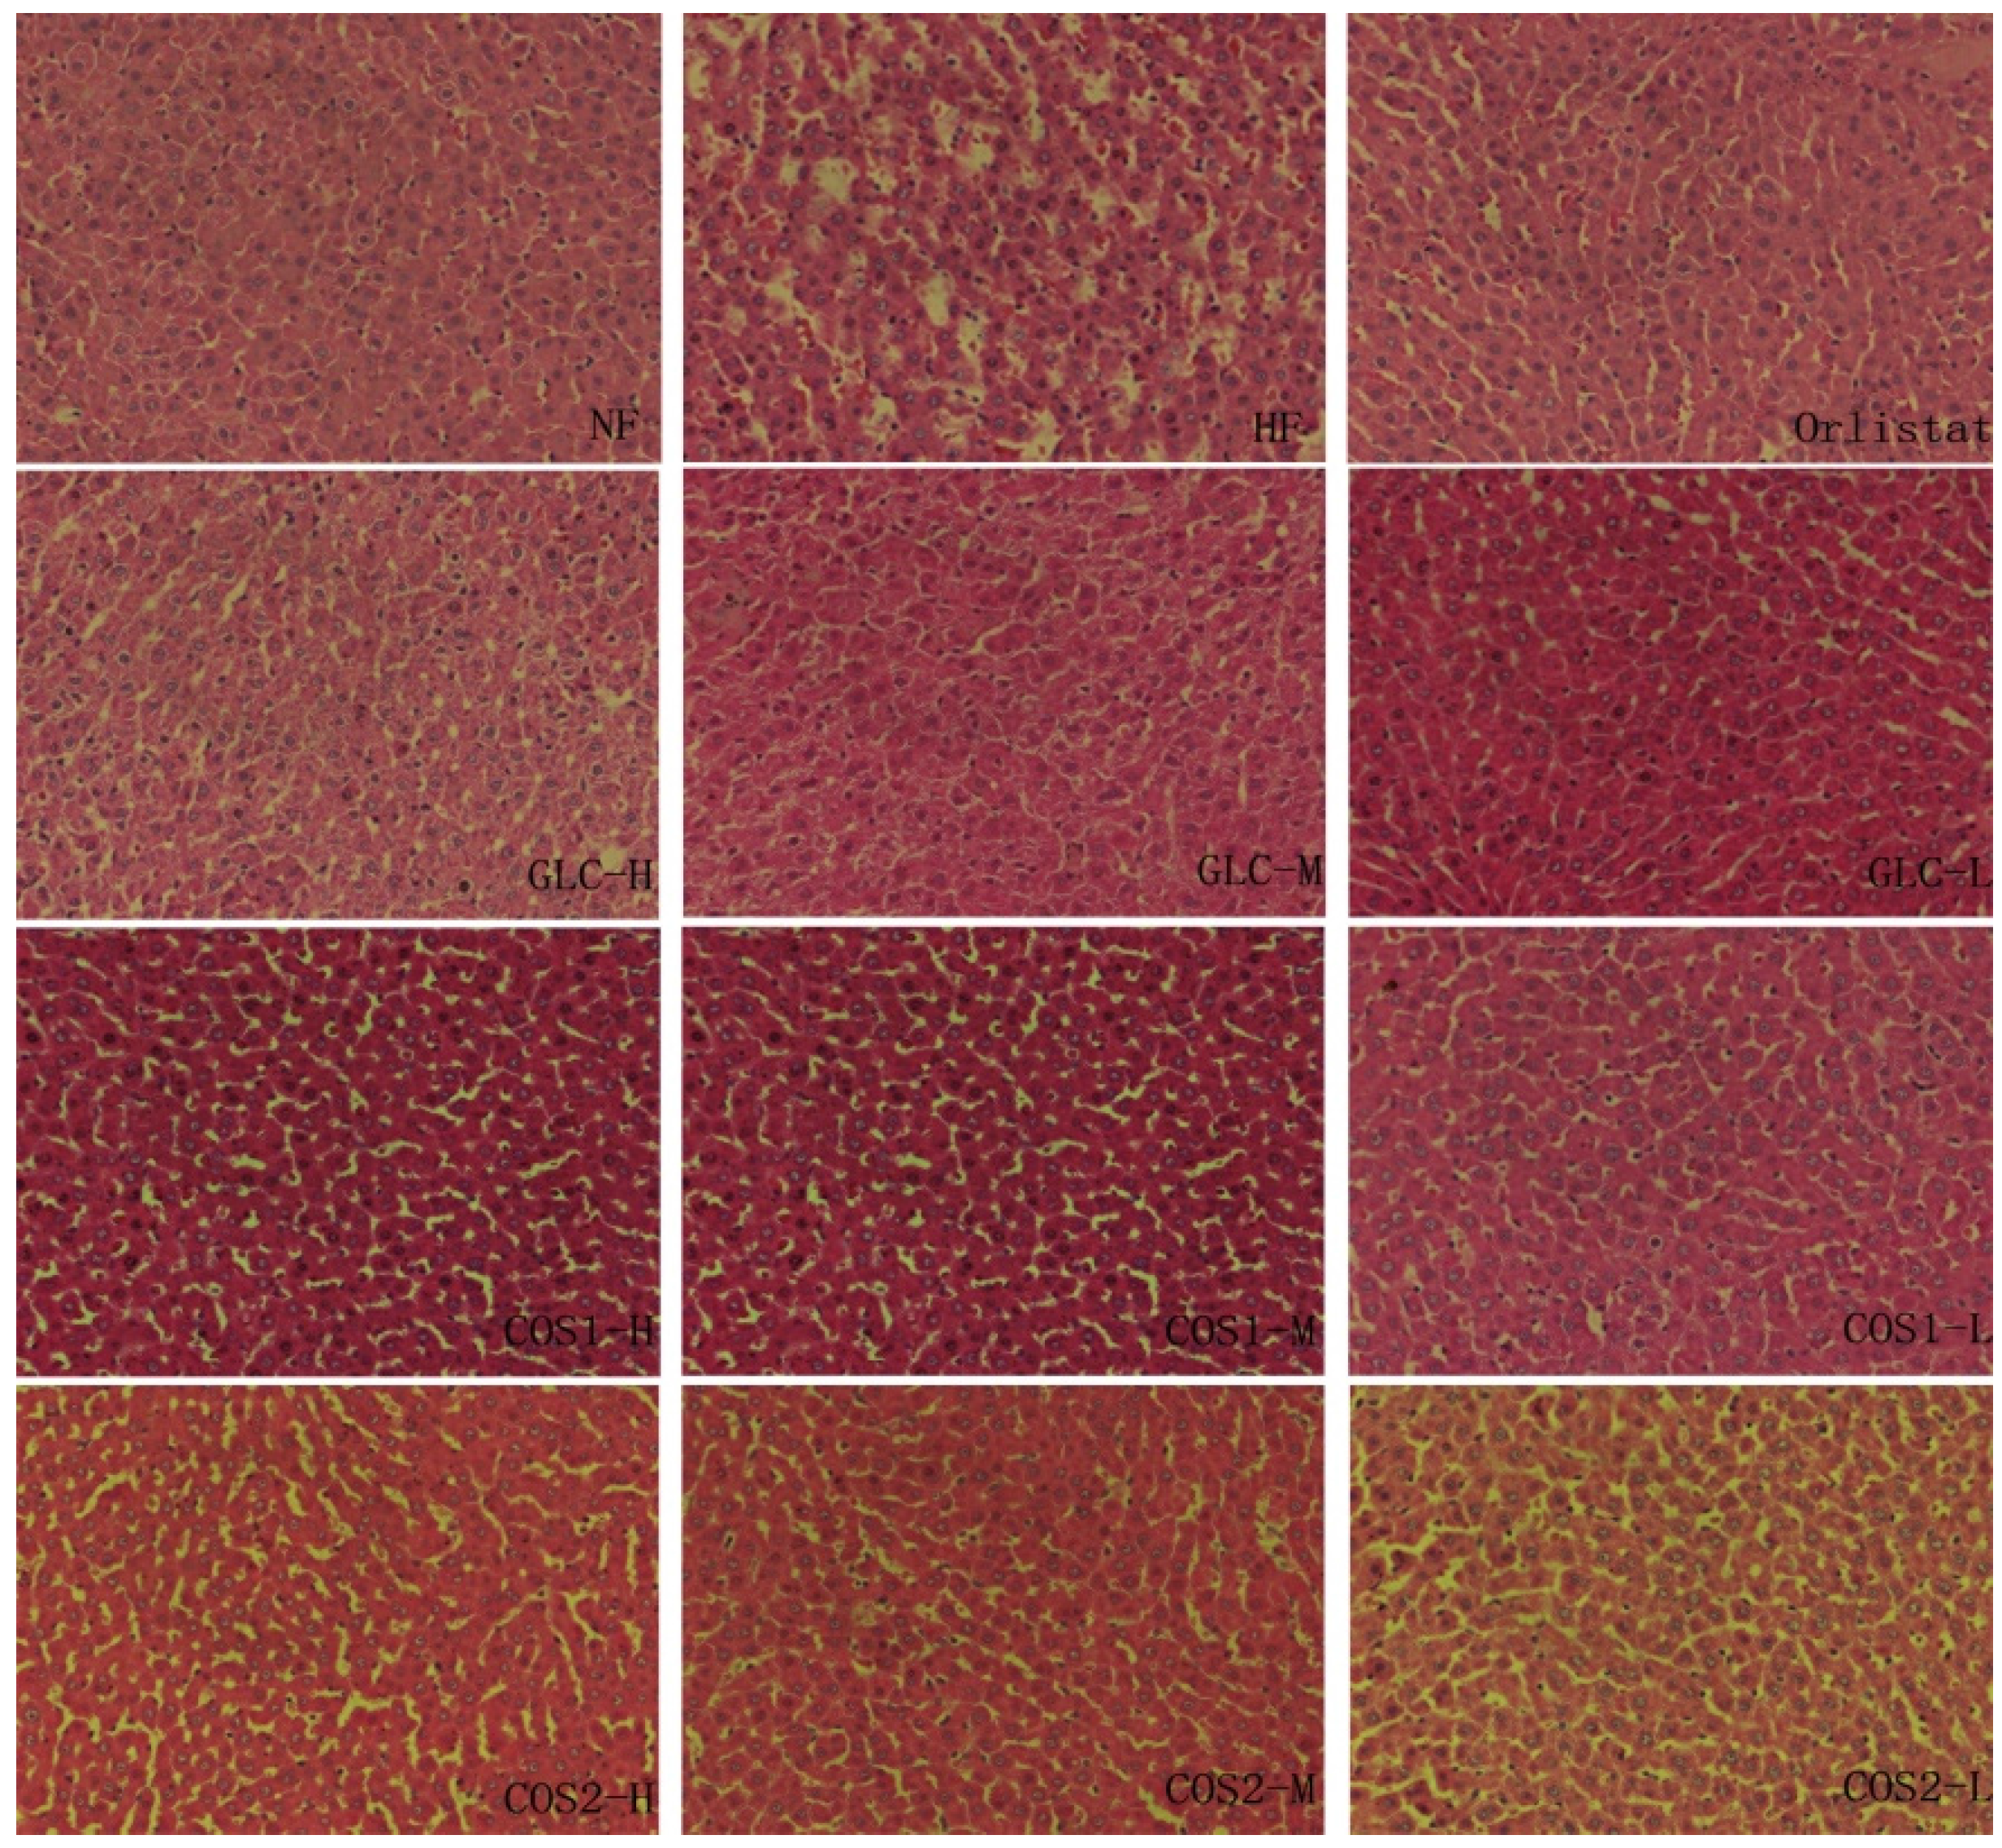
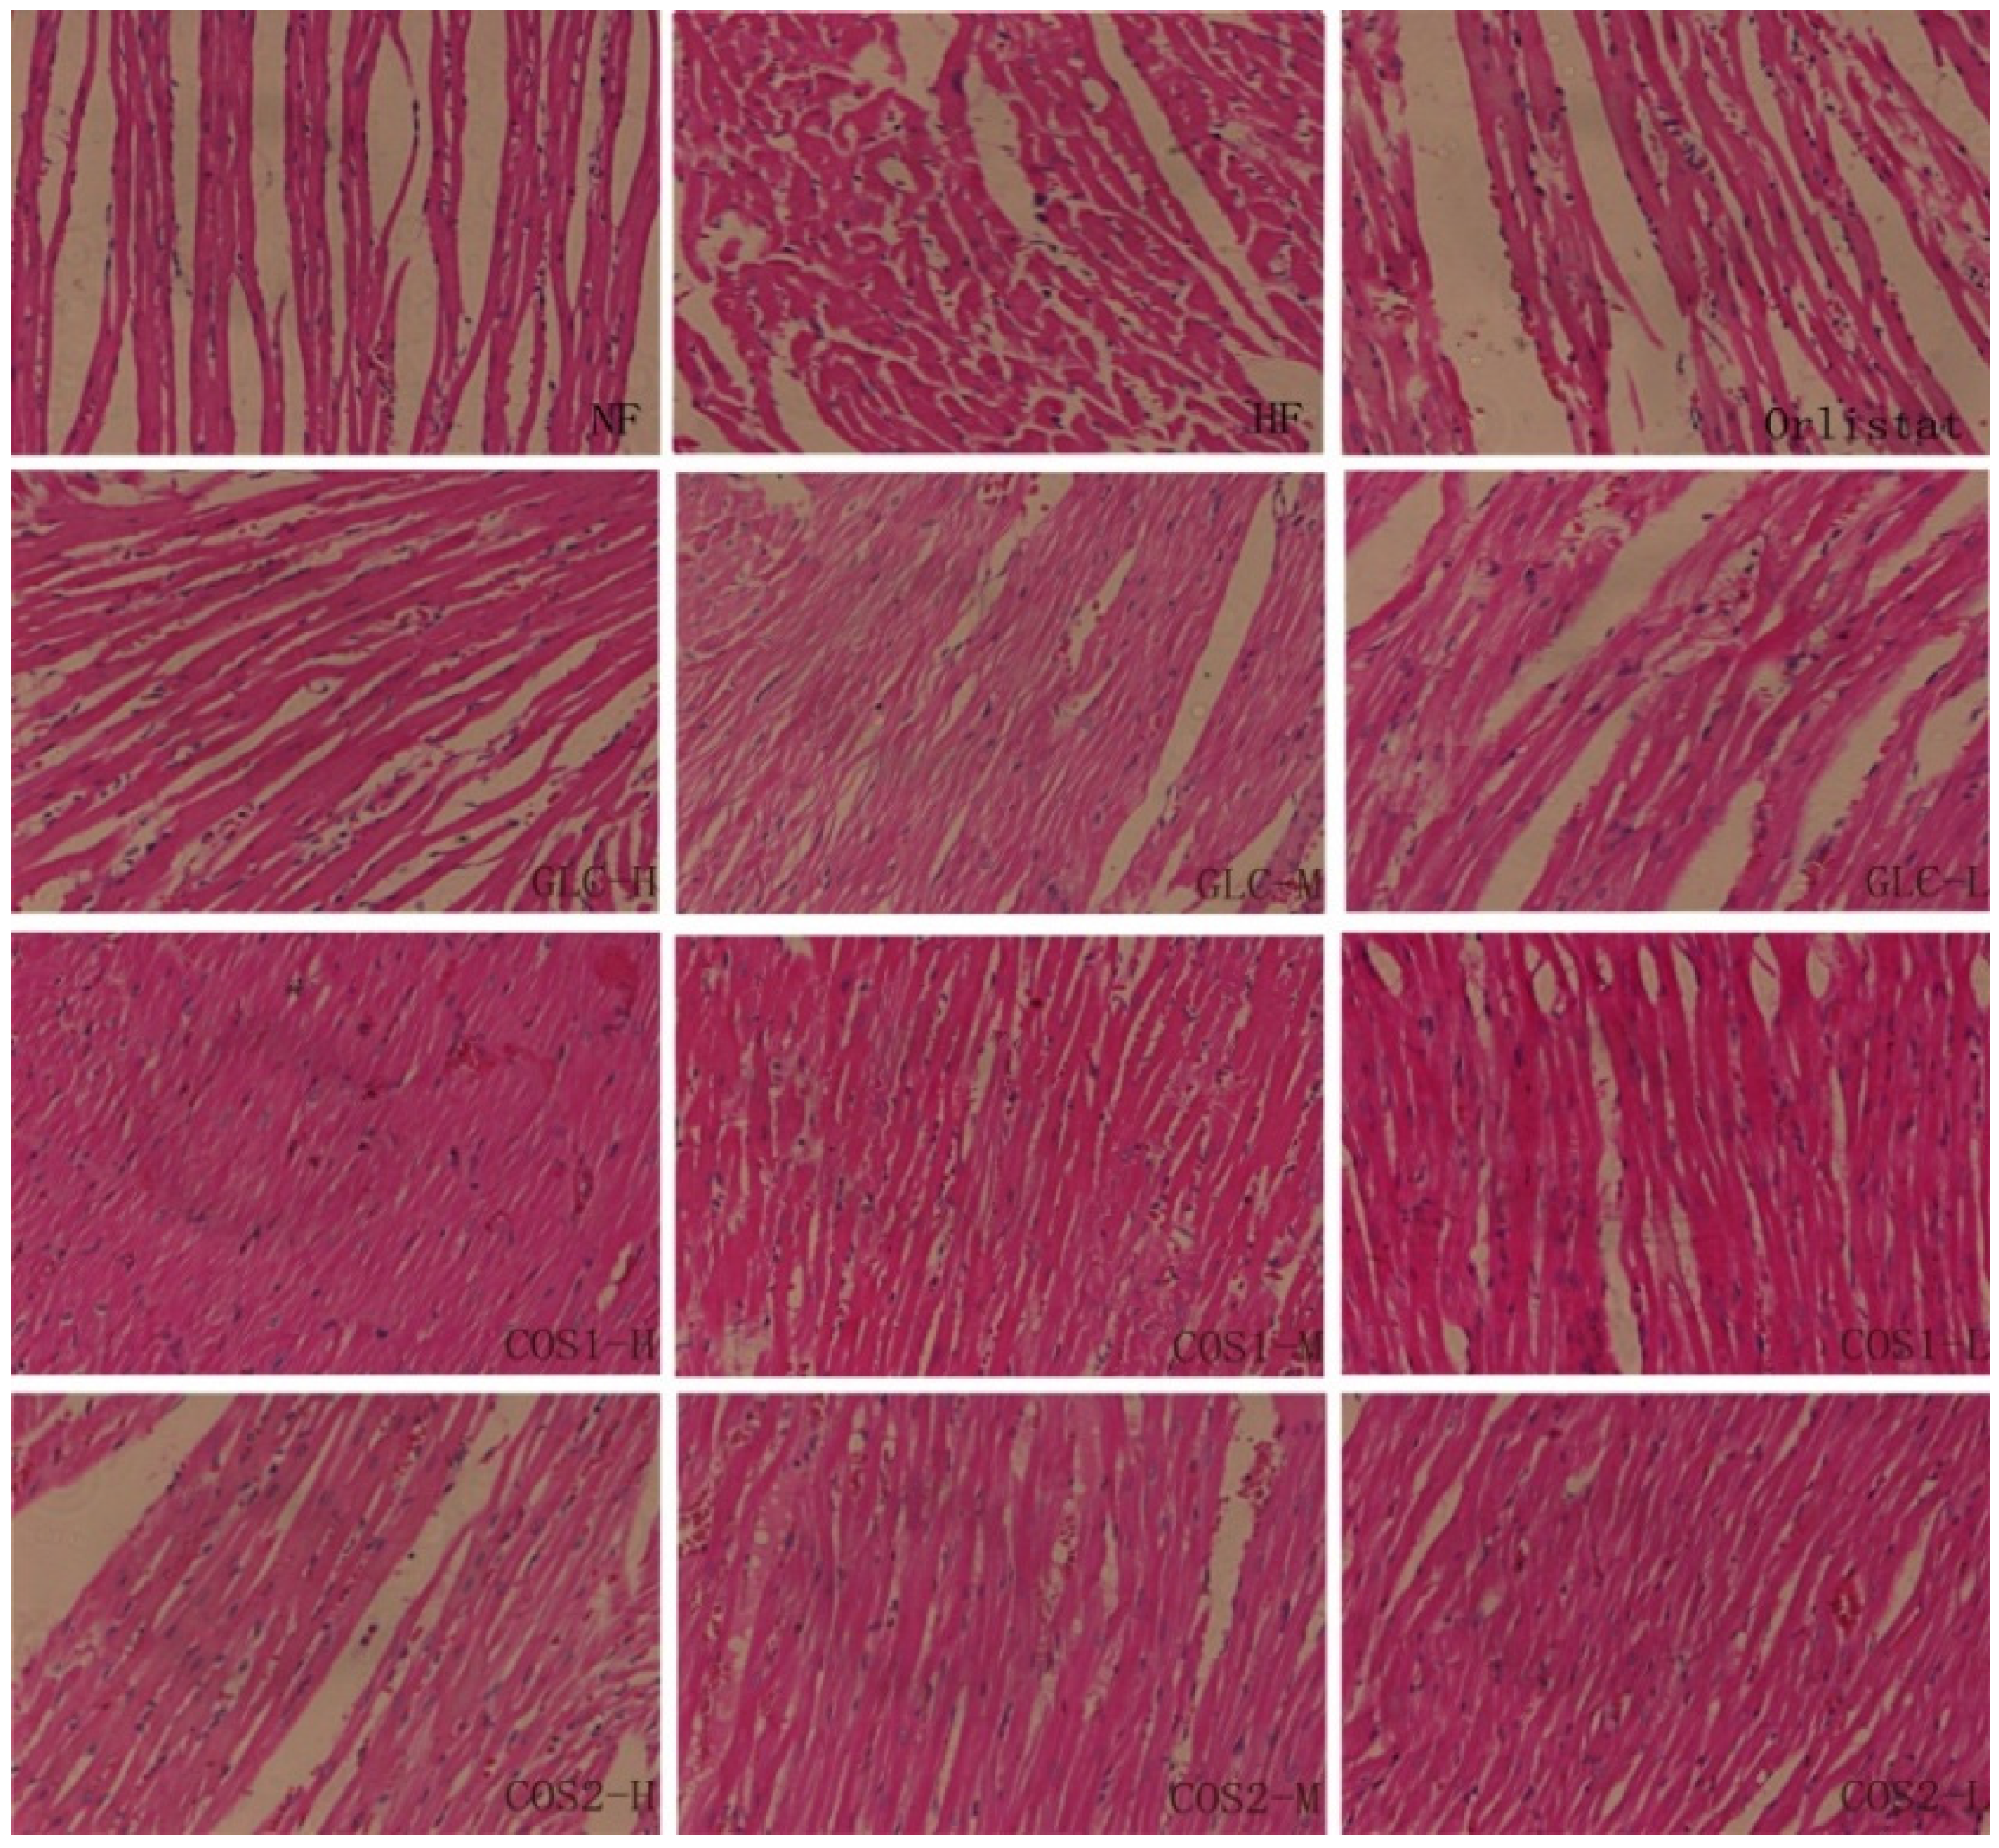
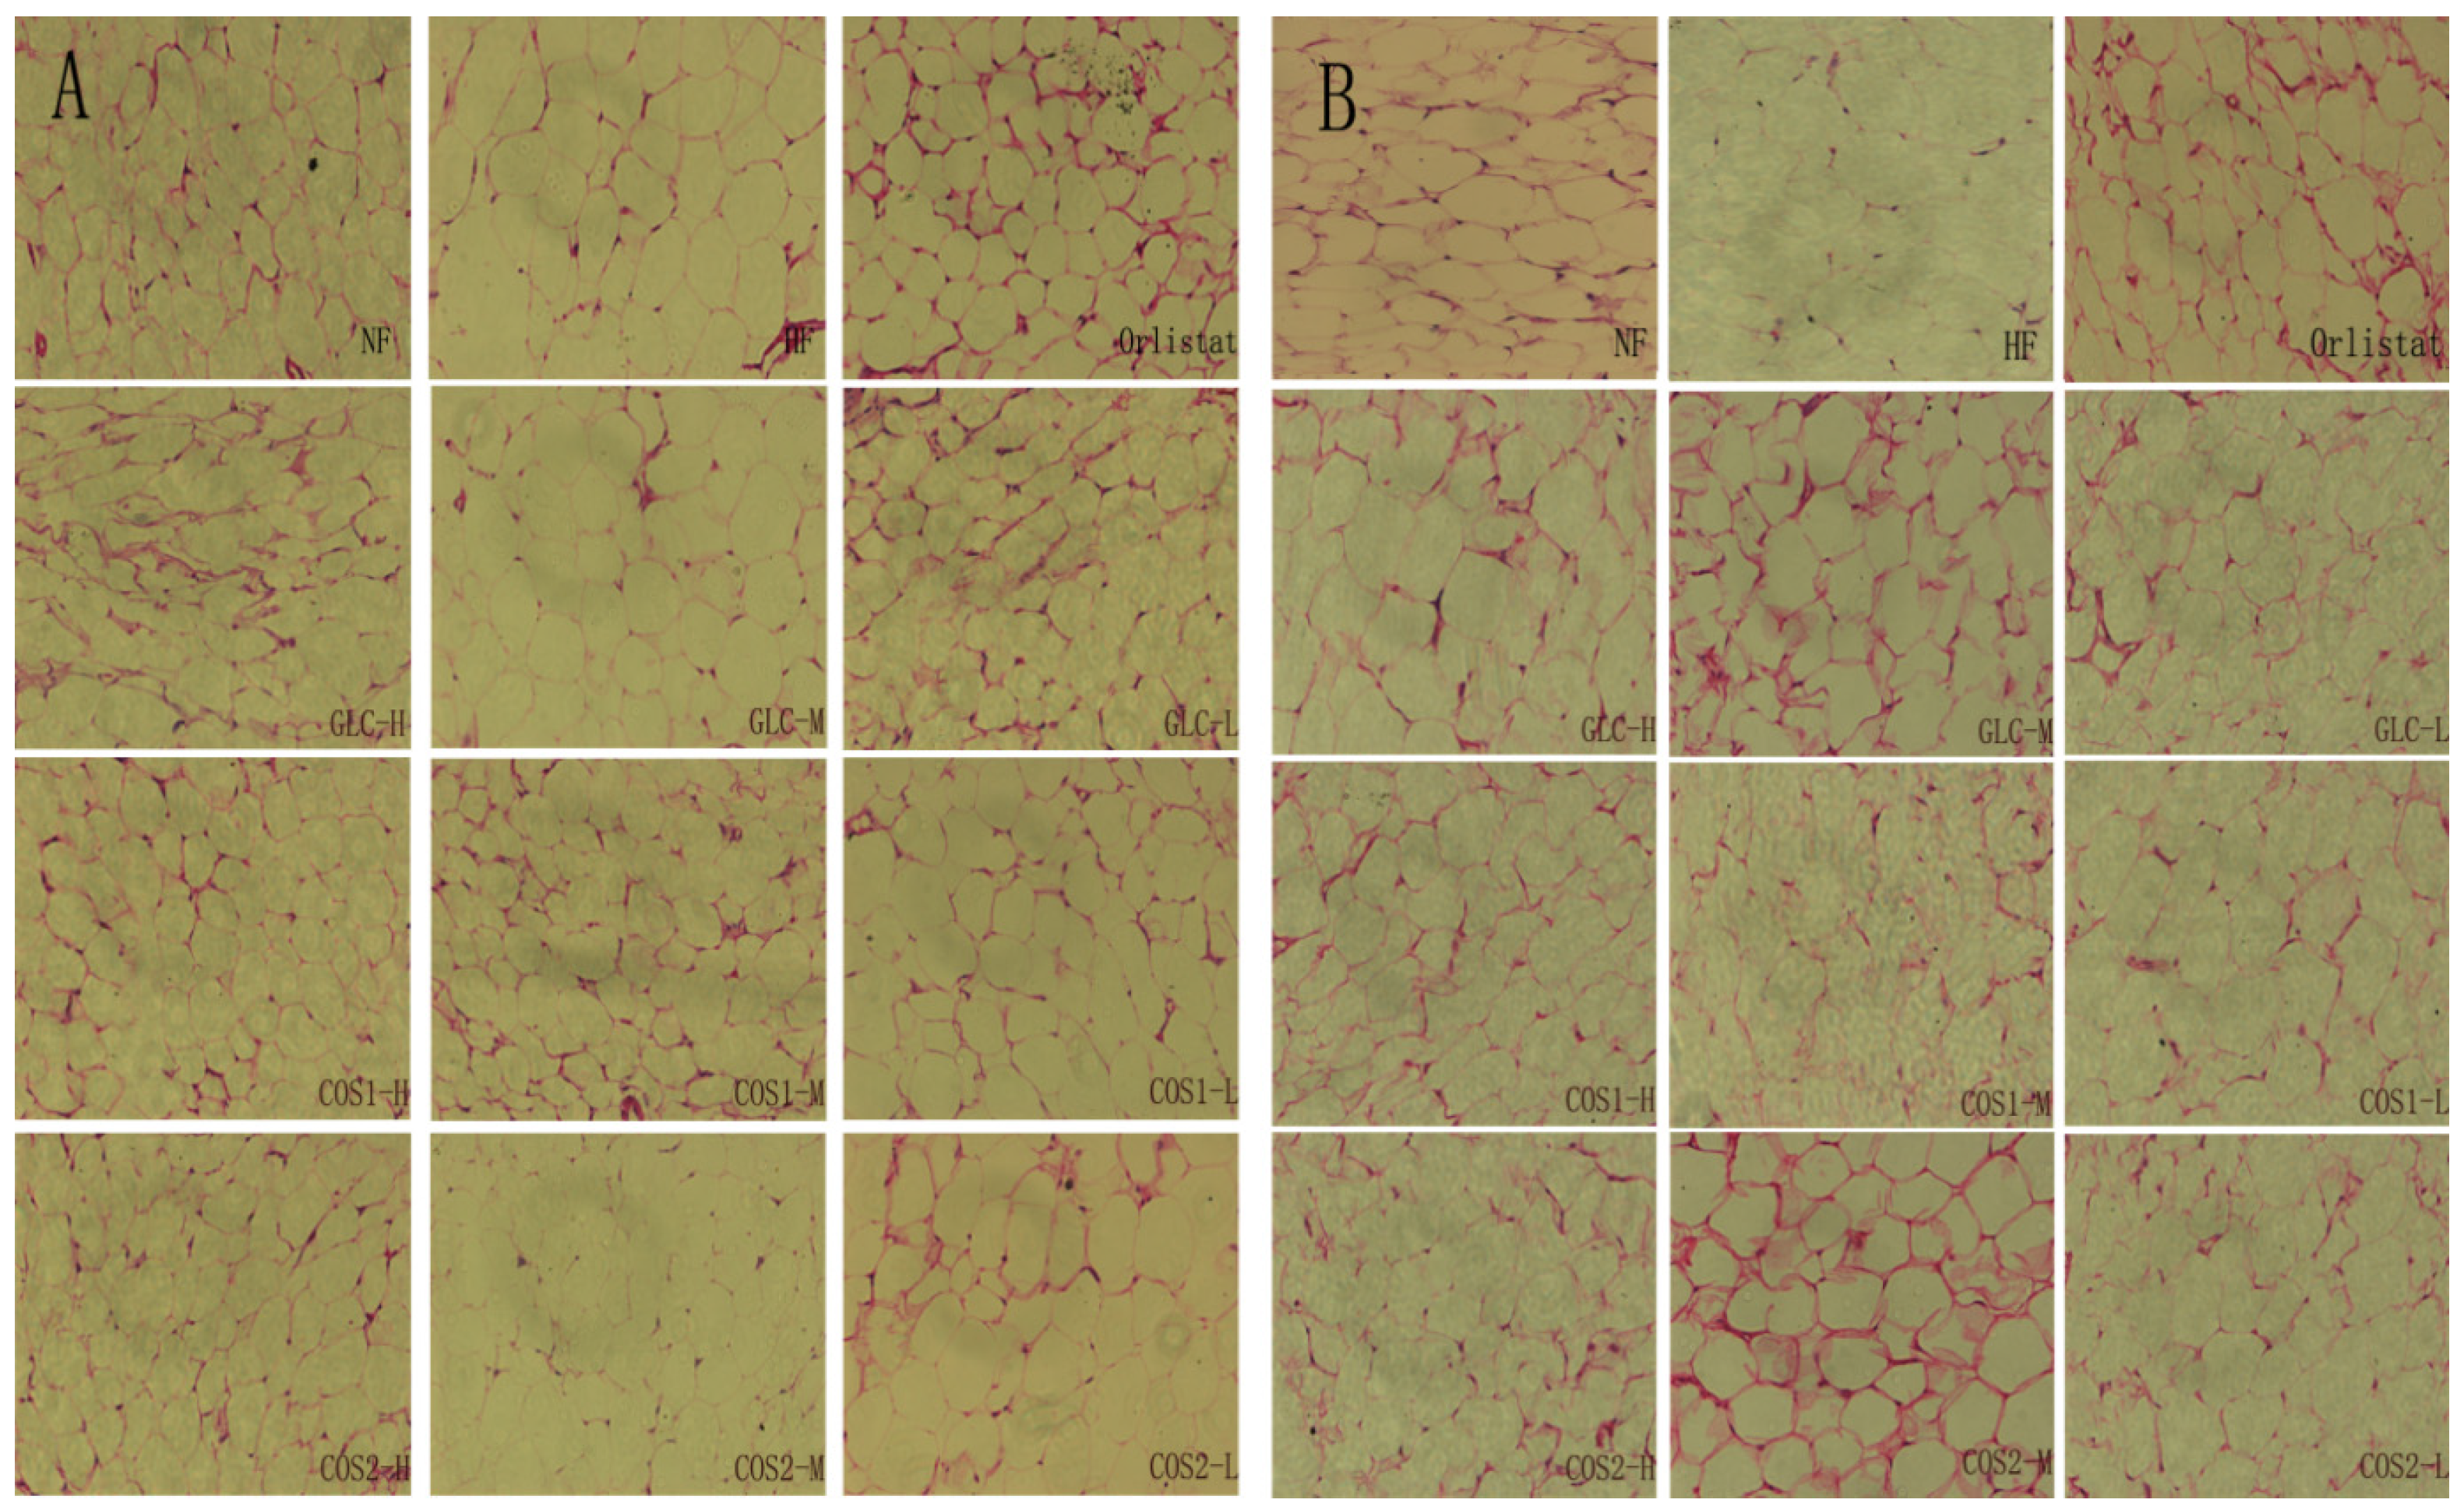
2.6. Histological Analysis


2.7. Differential Gene Expression
2.7.1. Test of RNA Quality
| Sample | Instrument | RIN | Concentration (ng/μL) | 28S/18S |
|---|---|---|---|---|
| NF | Agilent 2100 | 7.6 | 269 | 1.6 |
| HF | Agilent 2100 | 7.8 | 298 | 1.5 |
| GLC | Agilent 2100 | 7.2 | 300 | 1.6 |
| COS1 | Agilent 2100 | 7.8 | 310 | 1.5 |
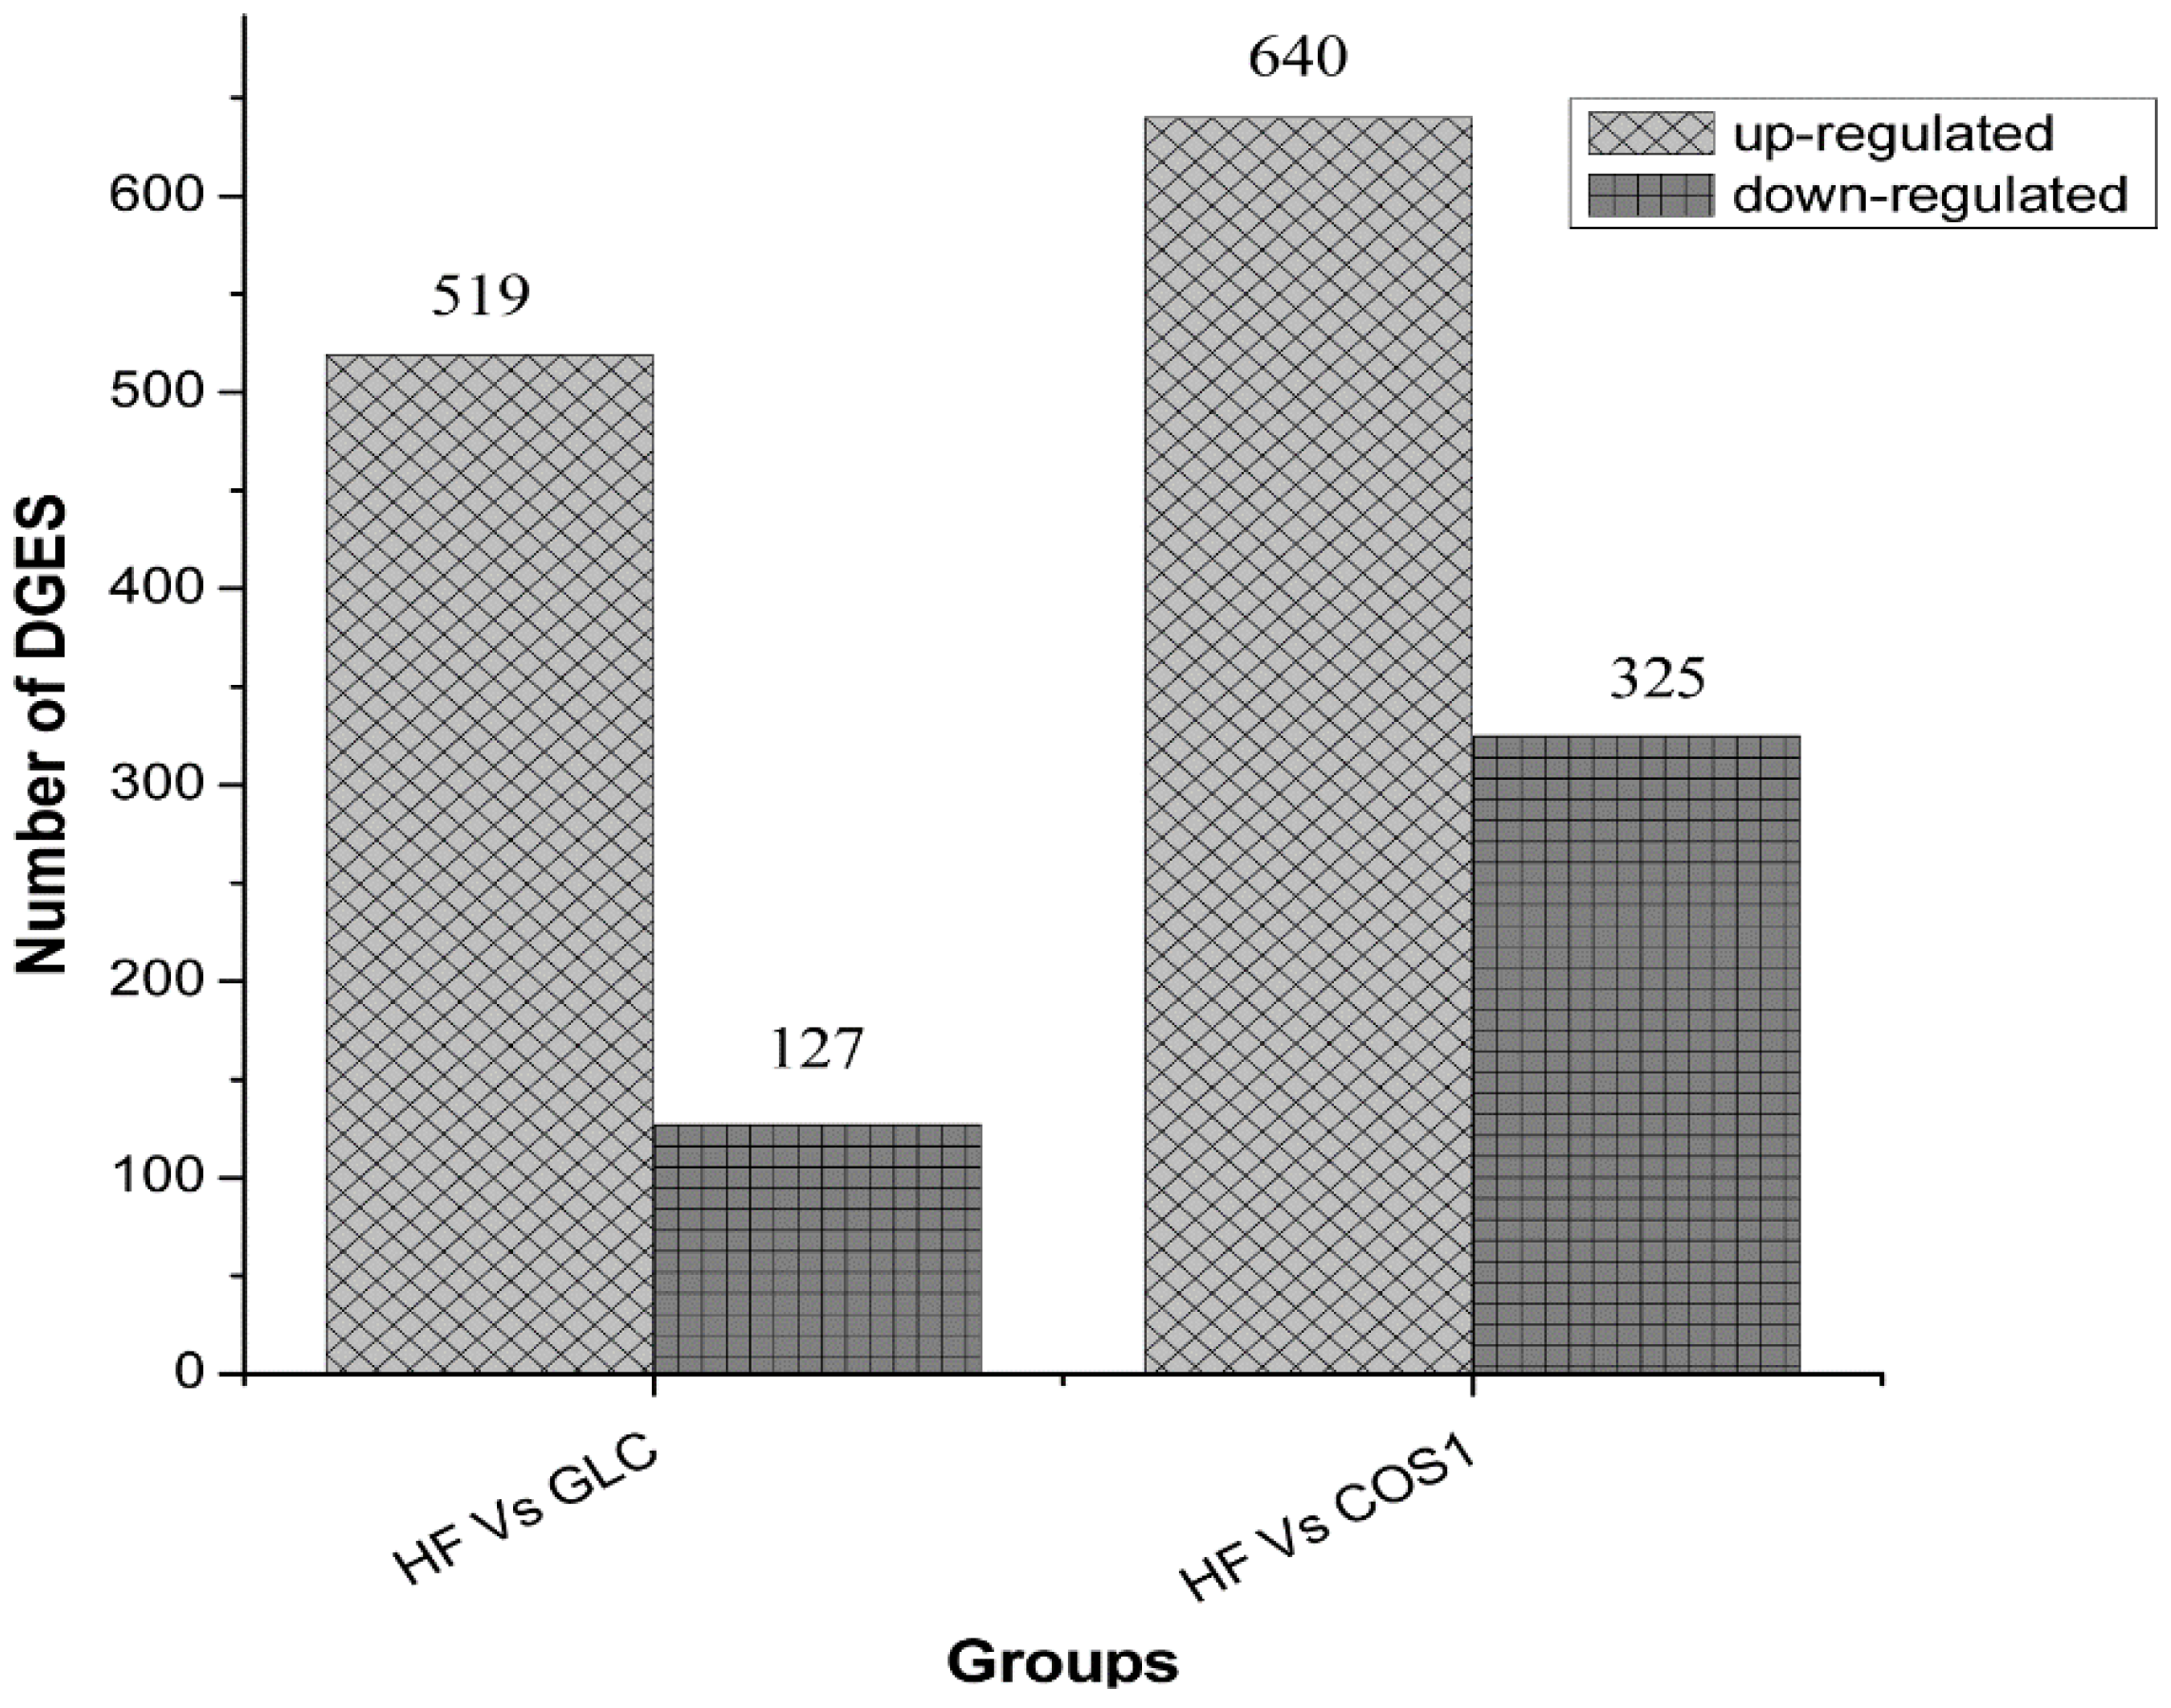
2.7.2. Differential Gene Expression Screening
2.7.3. GO Enrichment Analysis
| Symbol | log2 Ratio (GLC/HF) | GO Function | |
|---|---|---|---|
| Up-regulated | Zfp354a | 9.07 | GO:0001071//nucleic acid binding transcription factor activity;GO:0003676//nucleic acid binding;GO:0016564//transcription repressor activity;GO:0046914//transition metal ion binding;GO:0001071//nucleic acid binding transcription factor activity;GO:0003676//nucleic acid binding;GO:0016564//transcription repressor activity;GO:0046914//transition metal ion binding |
| Fcrla | 8.74 | - | |
| Pbsn | 7.91 | GO:0005488//binding | |
| Clec4g | 7.91 | GO:0005488//binding | |
| Map2k6 | 7.85 | GO:0004712//protein serine/threonine/tyrosine kinase activity; GO:0032559 | |
| Down-regulated | Scd1 | 8.36 | GO:0016215;GO:0046914//transition metal ion binding;GO:0016215; GO:0046914//transition metal ion binding |
| - | 8.17 | - | |
| Npas2 | 8.07 | GO:0001071//nucleic acid binding transcription factor activity;GO:0003676//nucleic acid binding;GO:0031072//heat shock protein binding;GO:0060089 | |
| Xcr1 | 7.13 | GO:0001637//G-protein coupled chemoattractant receptor activity | |
| Cd99l2 | 7.02 | - |
2.7.4. Pathway Significant Enrichment Analysis
| Symbol | log2 Ratio (COS1/HF) | GO Function | |
|---|---|---|---|
| Up-regulated | RGD1311874 | 9.72 | - |
| Zfp354a | 9.25 | GO:0001071//nucleic acid binding transcription factor activity;GO:0003676//nucleic acid binding;GO:0016564//transcription repressor activity;GO:0046914//transition metal ion binding;GO:0001071//nucleic acid binding transcription factor activity;GO:0003676//nucleic acid binding;GO:0016564//transcription repressor activity;GO:0046914//transition metal ion binding | |
| Pbsn | 8.93 | GO:0005488//binding | |
| Nkain3 | 8.52 | - | |
| RGD1562667 | 8.36 | GO:0005488//binding | |
| Down-regulated | Ddx56 | 10 | GO:0003676//nucleic acid binding;GO:0003724//RNA helicase activity;GO:0005515//protein binding;GO:0032559;GO:0042623//ATPase activity, coupled;GO:0003676//nucleic acid binding;GO:0003724//RNA helicase activity;GO:0005515//protein binding;GO:0032559;GO:0042623//ATPase activity, coupled |
| LOC100362069 | 8.22 | GO:0003676//nucleic acid binding;GO:0005198//structural molecule activity | |
| - | 8.17 | - | |
| - | 7.64 | GO:0004175//endopeptidase activity;GO:0005488//binding;GO:0004175//endopeptidase activity;GO:0005488//binding | |
| Paxip1 | 7.56 | GO:0005488//binding;GO:0005488//binding |
| Pathway | DEGs with Pathway Annotation (502) | All Genes with Pathway Annotation (18,766) | P Value | Q Value | Pathway ID |
|---|---|---|---|---|---|
| Metabolic pathways | 108 (21.51%) | 2077 (11.07%) | 5.821E−12 | 1.182E−09 | ko01100 |
| Circadian rhythm-mammal | 8 (1.59%) | 29 (0.15%) | 6.489E−07 | 6.586E−05 | ko04710 |
| PPAR signaling pathway | 16 (3.19%) | 151 (0.8%) | 3.001E−06 | 1.568E−04 | ko03320 |
| Primary bile acid biosynthesis | 8 (1.59%) | 35 (0.19%) | 3.089E−06 | 1.568E−04 | ko00120 |
| Steroid hormone biosynthesis | 10 (1.99%) | 76 (0.4%) | 3.366E−05 | 1.366E−03 | ko00140 |
| Steroid biosynthesis | 6 (1.2%) | 28 (0.15%) | 8.117E−05 | 2.746E−03 | ko00100 |
| Terpenoid backbone biosynthesis | 5 (1%) | 25 (0.13%) | 4.579E−04 | 1.328E−02 | ko00900 |
| Fatty acid metabolism | 8 (1.59%) | 70 (0.37%) | 5.465E−04 | 1.387E−02 | ko00071 |
| Biosynthesis of unsaturated fatty acids | 6 (1.2%) | 43 (0.23%) | 9.357E−04 | 2.111E−02 | ko01040 |
| Lysosome | 13 (2.59%) | 190 (1.01%) | 1.861E−03 | 3.778E−02 | ko04142 |
| Bile secretion | 10 (1.99%) | 129 (0.69%) | 2.469E−03 | 4.557E−02 | ko04976 |
| Pathway | DEGs with Pathway Annotation (744) | All Genes with Pathway Annotation (18,766) | P Value | Q Value | Pathway ID |
|---|---|---|---|---|---|
| Metabolic pathways | 135 (18.15%) | 2077 (11.07%) | 3.405E−09 | 5.525E−07 | ko01100 |
| Steroid hormone biosynthesis | 17 (2.28%) | 76 (0.4%) | 5.261E−09 | 5.525E−07 | ko00140 |
| Lysosome | 23 (3.09%) | 190 (1.01%) | 1.968E−06 | 1.377E−04 | ko04142 |
| Bile secretion | 18 (2.42%) | 129 (0.69%) | 3.394E−06 | 1.782E−04 | ko04976 |
| Primary bile acid biosynthesis | 9 (1.21%) | 35 (0.19%) | 6.438E−06 | 2.704E−04 | ko00120 |
| Retinol metabolism | 11 (1.48%) | 86 (0.46%) | 5.761E−04 | 2.016E−02 | ko00830 |
| Circadian rhythm-mammal | 6 (0.81%) | 29 (0.15%) | 8.272E−04 | 2.482E−02 | ko04710 |
| Biosynthesis of unsaturated fatty acids | 7 (0.94%) | 43 (0.23%) | 1.388E−03 | 3.643E−02 | ko01040 |
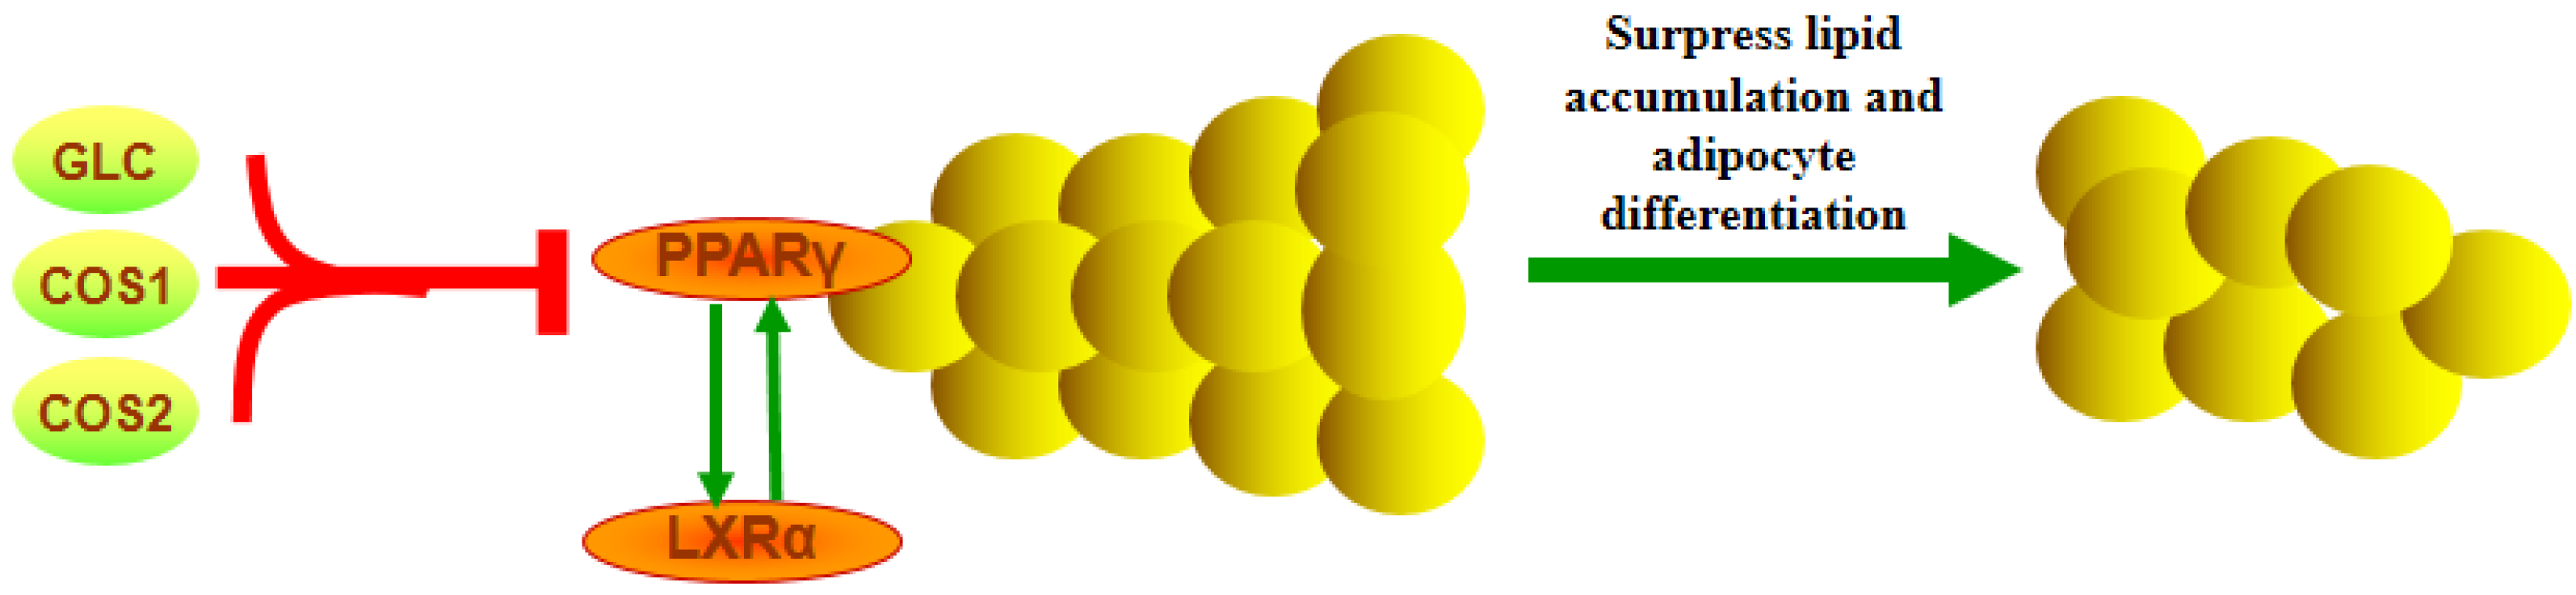
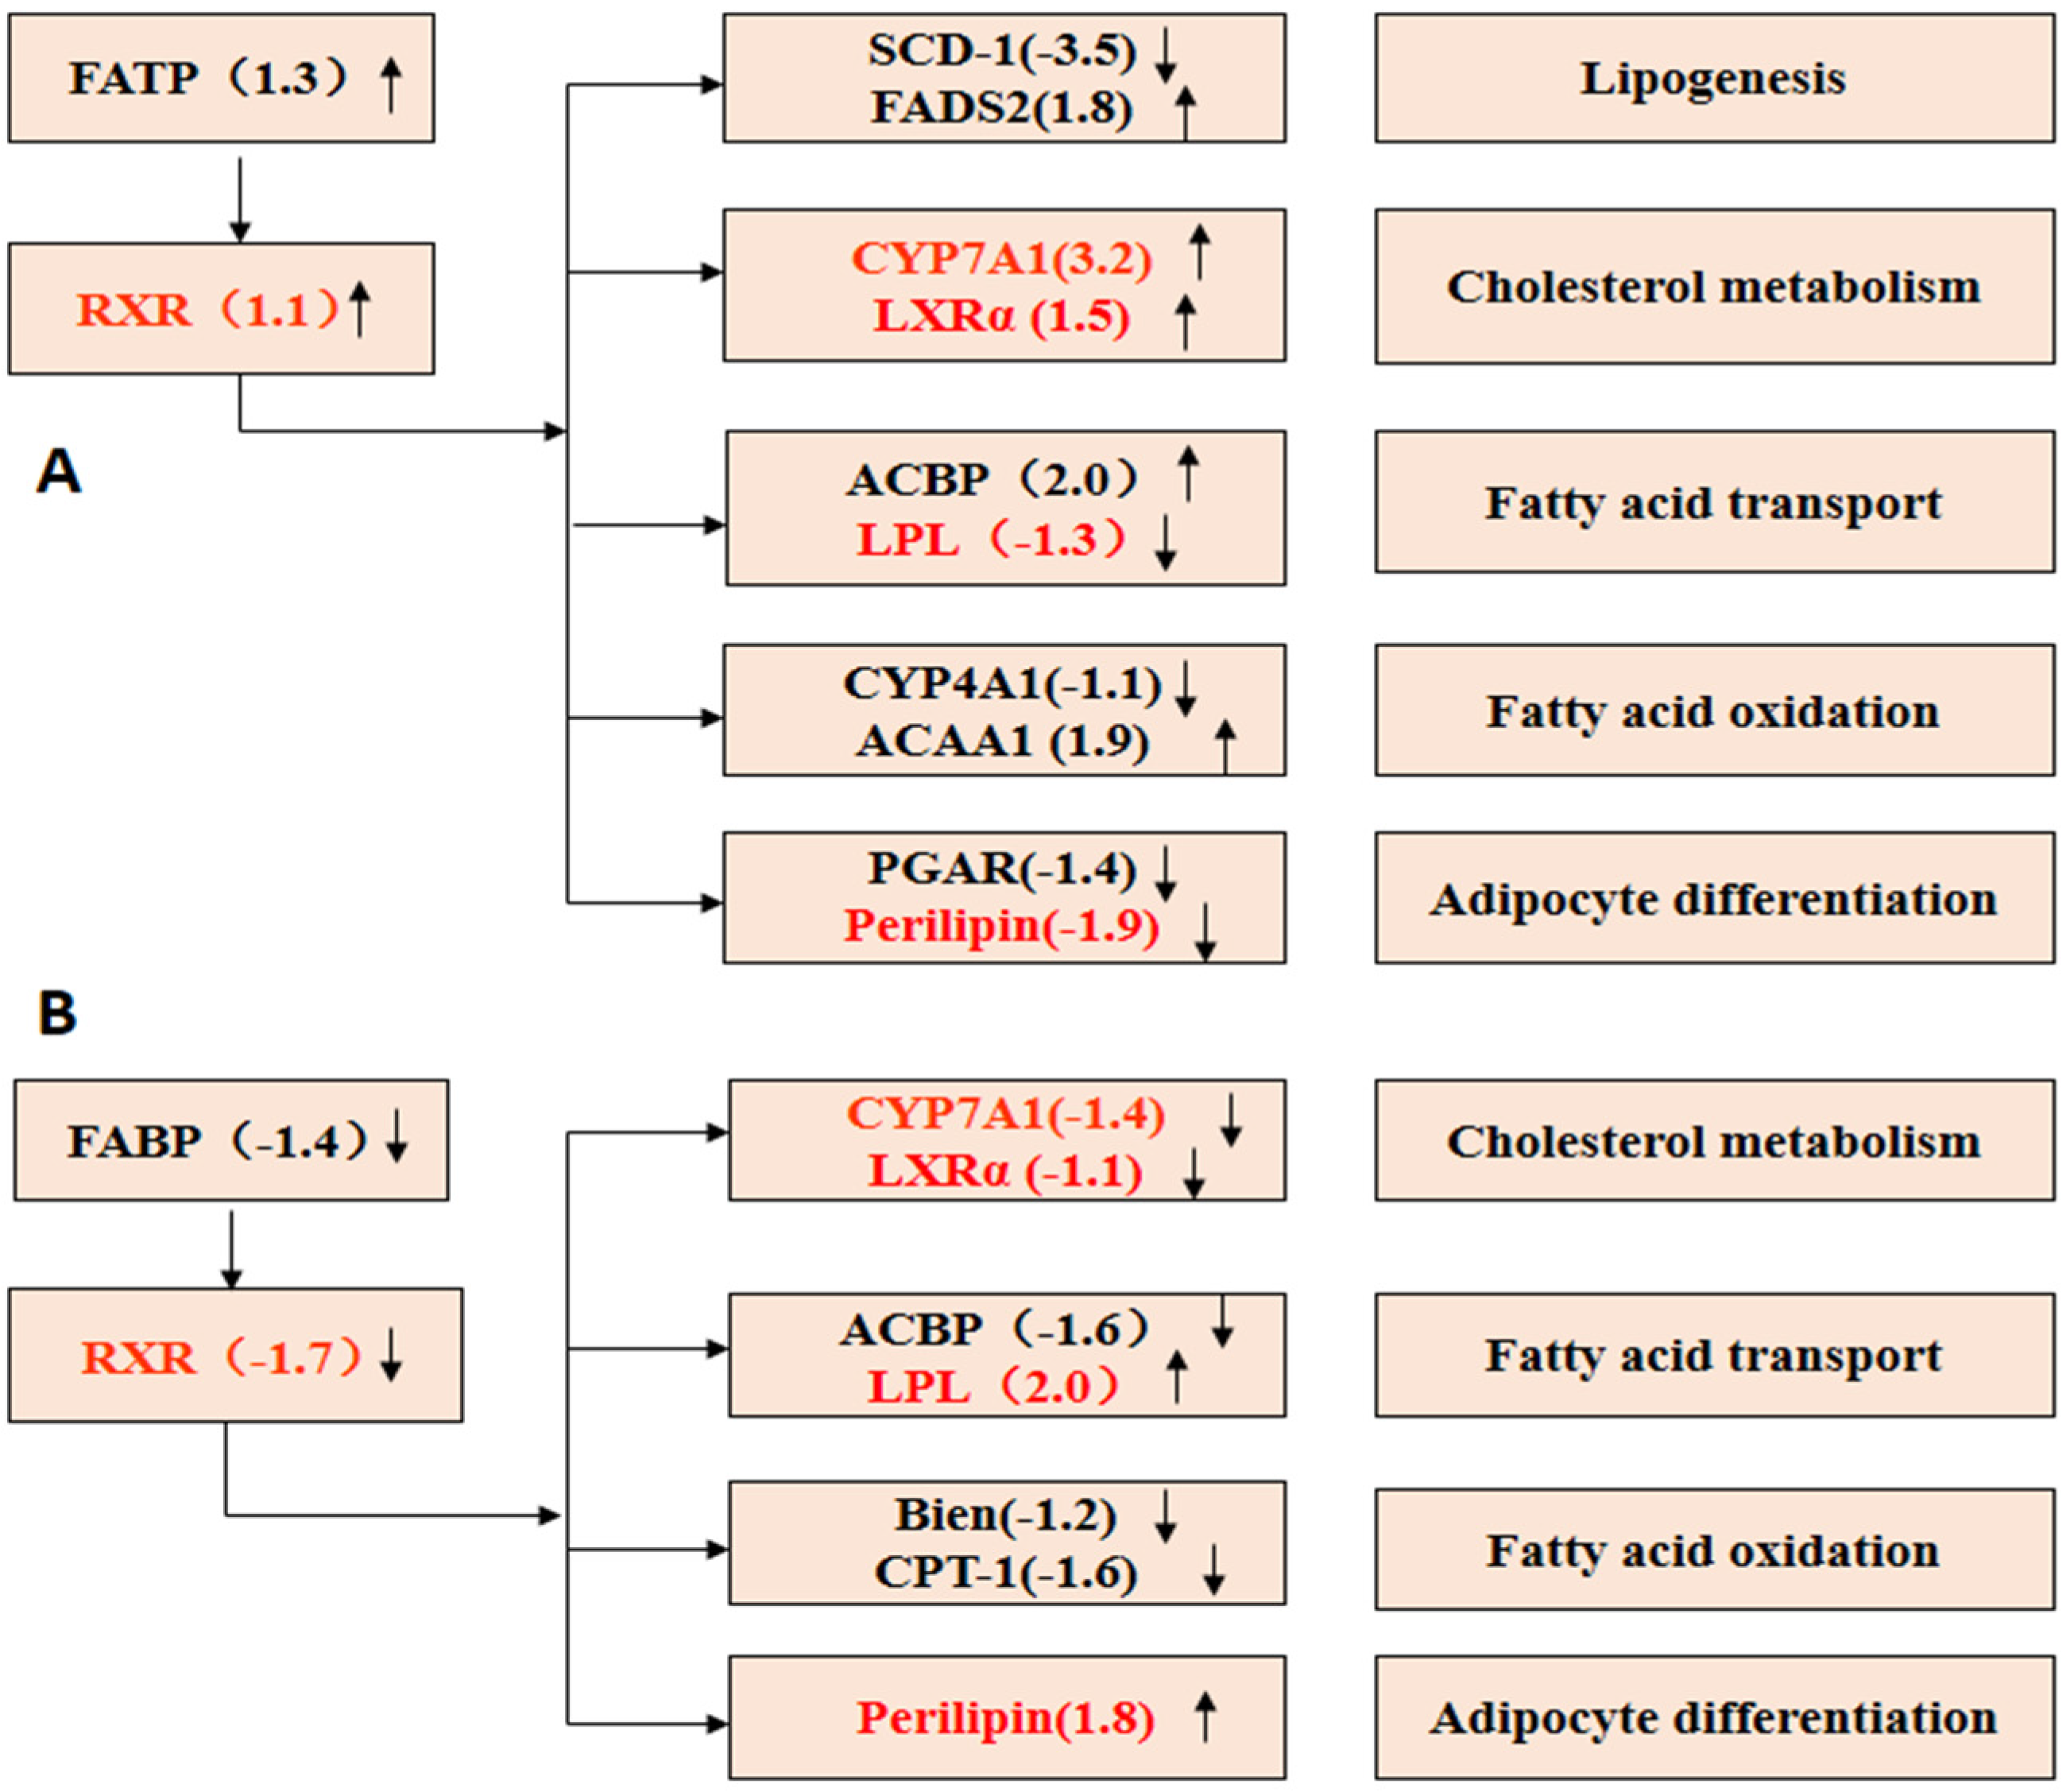
2.7.5. PPAR Signaling Pathway
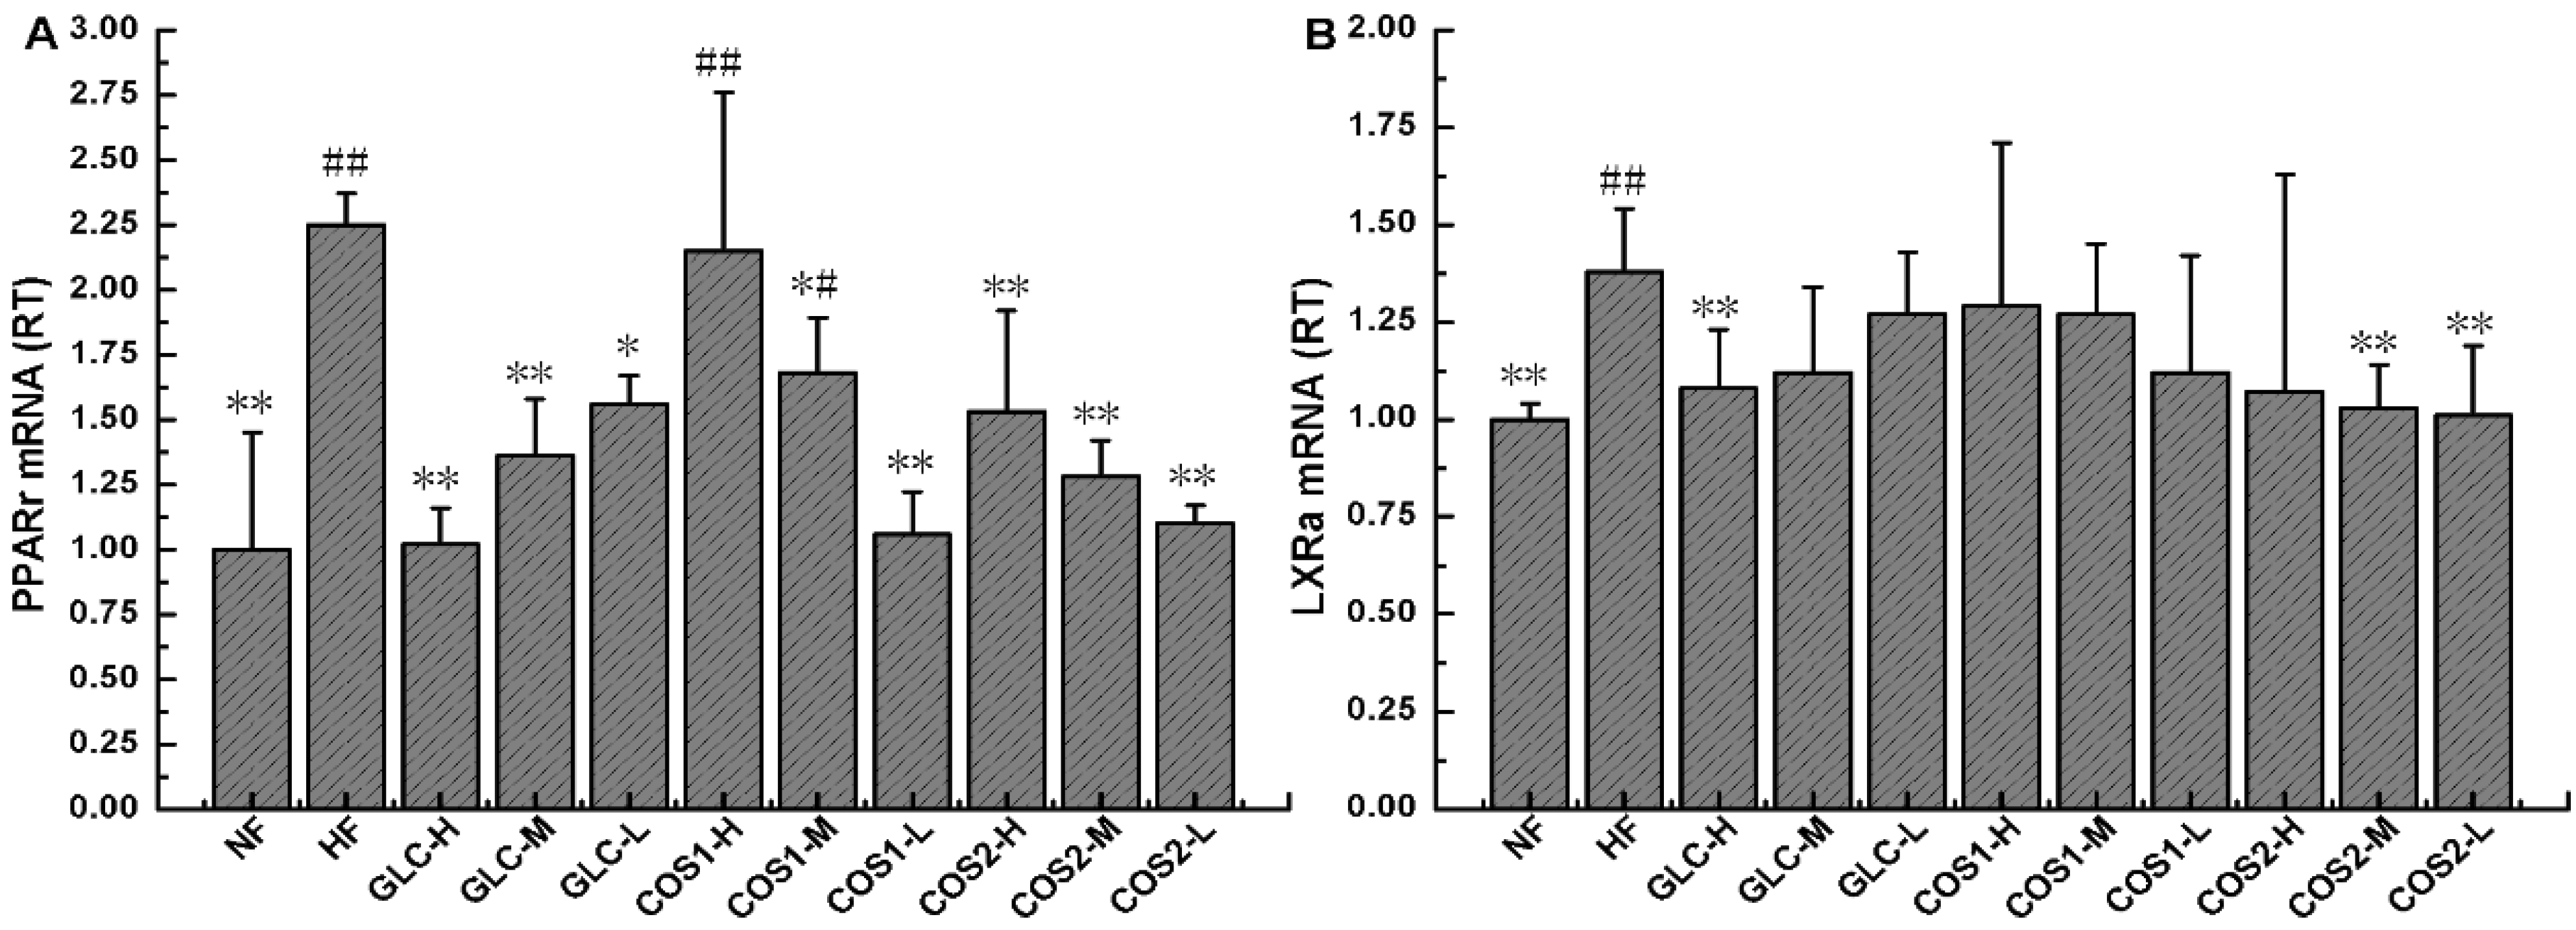
2.8. Expression of PPARγ and LXRα mRNA in Epididymal Adipose Tissue

2.9. Discussion
3. Materials and Methods
3.1. Materials
3.2. Animals
3.3. Experimental Design
3.4. Biochemical Parameter Analysis
3.5. Histological Analysis
3.6. Digital Gene Expression Tag Profiling
3.7. Quantitative RT-PCR Analysis
- PPARγ (Sequence ID: NM_001145366.1)
- FORWARD: 5′-GCCCTTTGGTGACTTTATGG-3′
- REVERSE: 5′-CAGCAGGTTGTCTTGGATGT-3′
- LXRα (Sequence ID: NM_031627.2)
- FORWARD: 5′-GCACGCTACATTTGCCATAG-3′
- REVERSE: 5′-CCTGCTCCTCTTCTTGACG-3′
- β-actin (Sequence ID: NM_031144)
- FORWARD: 5′-CACCCGCGAGTACAACCTTC-3′
- REVERSE: 5′-CCCATACCCACCATCACACC-3′
3.8. Data Analysis
4. Conclusions

Acknowledgments
Author Contributions
Abbreviations
| COS | chitosan oligosaccharide |
| GLC | glucosamine |
| CTS | chitosan |
| NF | normal diet group |
| HF | high-fat diet group |
| CHO | total cholesterol |
| TG | triacylglycerol |
| HDL-C | high-density lipoprotein cholesterol |
| LDL-C | low-density lipoprotein cholesterol |
| PPAR | peroxisome proliferator-activated receptor |
| LXR | liver X receptor |
Conflicts of Interest
References
- WHO. Obesity: Preventing and managing the global epidemic. Report of a WHO consultation. World Health Organ. Tech. Rep. Ser 2000, 894, 1–253. [Google Scholar]
- Low, S.; Chin, M.C.; Deurenberg-Yap, M. Review on epidemic of obesity. Ann. Acad. Med. Singap. 2009, 38, 57–59. [Google Scholar] [PubMed]
- Xi, B.; Liang, Y.; He, T.; Reilly, K.H.; Hu, Y.; Wang, Q.; Yan, Y.; Mi, J. Secular trends in the prevalence of general and abdominal obesity among Chinese adults, 1993–2009. Obes. Rev. 2012, 13, 287–296. [Google Scholar] [CrossRef] [PubMed]
- Lee, S.O.; Simons, A.L.; Murphy, P.A.; Hendrich, S. Soyasaponins lowered plasma cholesterol and increased fecal bile acids in female golden Syrian hamsters. Exp. Biol. Med. (Maywood) 2005, 230, 472–478. [Google Scholar]
- Haslam, D.W.; James, W.P. Obesity. Lancet 2005, 366, 1197–1209. [Google Scholar] [CrossRef] [PubMed]
- Ahima, R.S. Digging deeper into obesity. J. Clin. Investig. 2011, 121, 2076–2079. [Google Scholar] [CrossRef] [PubMed]
- Reilly, J.J.; Methven, E.; McDowell, Z.C.; Hacking, B.; Alexander, D.; Stewart, L.; Kelnar, C.J. Health consequences of obesity. Arch. Dis. Child. 2003, 88, 748–752. [Google Scholar] [CrossRef] [PubMed]
- Younes, I.; Rinaudo, M. Chitin and Chitosan Preparation from Marine Sources. Structure, Properties and Applications. Mar. Drugs 2015, 13, 1133–1174. [Google Scholar] [CrossRef] [PubMed]
- Ju, C.; Yue, W.; Yang, Z.; Zhang, Q.; Yang, X.; Liu, Z.; Zhang, F. Antidiabetic effect and mechanism of chitooligosaccharides. Biol. Pharm. Bull. 2010, 33, 1511–1516. [Google Scholar] [CrossRef] [PubMed]
- Fernandes, J.C.; Sereno, J.; Garrido, P.; Parada, B.; Cunha, M.F.; Reis, F.; Pintado, M.E.; Santos-Silva, A. Inhibition of bladder tumor growth by chitooligosaccharides in an experimental carcinogenesis model. Mar. Drugs 2012, 10, 2661–2675. [Google Scholar] [CrossRef] [PubMed]
- Yang, Y.; Liu, M.; Gu, Y.; Lin, S.; Ding, F.; Gu, X. Effect of chitooligosaccharide on neuronal differentiation of PC-12 cells. Cell Biol. Int. 2009, 33, 352–356. [Google Scholar] [CrossRef] [PubMed]
- Niu, J; Lin, H.Z; Jiang, S.G; Chen, X; Wu, K.C; Liu, Y.J; Wang, S; Tian, L.X. Comparison of effect of chitin, chitosan, chitosan oligosaccharide and N-acetyl-d-glucosamine on growth performance, antioxidant defenses and oxidative stress status of Penaeus monodon. Aquaculture 2013, 372–375, 1–8. [Google Scholar]
- Walsh, A.M.; Sweeney, T.; Bahar, B.; Flynn, B.; O’Doherty, J.V. The effect of chitooligosaccharide supplementation on intestinal morphology, selected microbial populations, volatile fatty acid concentrations and immune gene expression in the weaned pig. Animal 2012, 6, 1620–1626. [Google Scholar] [CrossRef] [PubMed]
- Kim, J.N.; Chang, I.Y.; Kim, H.I.; Yoon, S.P. Long-term effects of chitosan oligosaccharide in streptozotocin-induced diabetic rats. Islets 2009, 1, 111–116. [Google Scholar] [CrossRef] [PubMed]
- Yan, Y.; Wanshun, L.; Baoqin, H.; Bing, L.; Chenwei, F. Protective effects of chitosan oligosaccharide and its derivatives against carbon tetrachloride-induced liver damage in mice. Hepatol. Res. 2006, 35, 178–184. [Google Scholar] [CrossRef]
- Choi, C.R.; Kim, E.K.; Kim, Y.S.; Je, J.Y.; An, S.H.; Lee, J.D.; Wang, J.H.; Ki, S.S.; Jeon, B.T.; Moon, S.H.; et al. Chitooligosaccharides decreases plasma lipid levels in healthy men. Int. J. Food Sci. Nutr. 2012, 63, 103–106. [Google Scholar] [CrossRef] [PubMed]
- Sherman, A.L.; Ojeda-Correal, G.; Mena, J. Use of glucosamine and chondroitin in persons with osteoarthritis. PMR 2012, 4, S110–S116. [Google Scholar] [CrossRef]
- Reginster, J.Y.; Neuprez, A.; Lecart, M.P.; Sarlet, N.; Bruyere, O. Role of glucosamine in the treatment for osteoarthritis. Rheumatol. Int. 2012, 32, 2959–2967. [Google Scholar] [CrossRef] [PubMed]
- Liming, J.; Yan, Y.; Wanshun, L.; Baoqin, H.; Wenjie, T.; Shengdi, F. Protective effects of d-glucosamine against carbon tetrachloride-induced liver damage in mice. J. Zhengzhou Univ. (Med. Sci.) 2009, 44, 122–125. [Google Scholar]
- Wendi, C.; Jinxin, C.; Chenwei, F.; Wanshun, L.; Baoqin, H. Effect of glucosamine on immune function of murine peritoneal macrophages. Chin. J. Biol. 2010, 23, 946–948. [Google Scholar]
- Xin, C. Studies on antimicrobial effects of d-glucosamine hydrochloride. Fish. Sci. 2001, 20, 14–15. [Google Scholar]
- Shintani, T.; Yamazaki, F.; Katoh, T.; Umekawa, M.; Matahira, Y.; Hori, S.; Kakizuka, A.; Totani, K.; Yamamoto, K.; Ashida, H. Glucosamine induces autophagy via an mTOR-independent pathway. Biochem. Biophys. Res. Commun. 2010, 391, 1775–1779. [Google Scholar] [CrossRef] [PubMed] [Green Version]
- Xing, R.; Liu, S.; Guo, Z.; Yu, H.; Li, C.; Ji, X.; Feng, J.; Li, P. The antioxidant activity of glucosamine hydrochloride in vitro. Bioorganic Med. Chem. 2006, 14, 1706–1709. [Google Scholar] [CrossRef]
- Hong, L.Z.; Li, J.; Schmidt-Kuntzel, A.; Warren, W.C.; Barsh, G.S. Digital gene expression for non-model organisms. Genome Res. 2011, 21, 1905–1915. [Google Scholar] [CrossRef] [PubMed]
- Tiirikka, T.; Siermala, M.; Vihinen, M. Clustering of gene ontology terms in genomes. Gene 2014, 550, 155–164. [Google Scholar] [CrossRef] [PubMed]
- Hong, M.G.; Pawitan, Y.; Magnusson, P.K.; Prince, J.A. Strategies and issues in the detection of pathway enrichment in genome-wide association studies. Hum. Genet. 2009, 126, 289–301. [Google Scholar] [CrossRef] [PubMed]
- Kanehisa, M.; Goto, S.; Sato, Y.; Kawashima, M.; Furumichi, M.; Tanabe, M. Data, information, knowledge and principle: Back to metabolism in KEGG. Nucleic Acids Res. 2014, 42, D199–D205. [Google Scholar] [CrossRef] [PubMed]
- Tao, Y.; Zhang, H.L.; Hu, Y.M.; Wan, S.; Su, Z.Q. Preparation of chitosan and water-soluble chitosan microspheres via spray-drying method to lower blood lipids in rats fed with high-fat diets. Int. J. Mol. Sci. 2013, 14, 4174–4184. [Google Scholar] [CrossRef] [PubMed] [Green Version]
- Zhang, H.L.; Zhong, X.B.; Tao, Y.; Wu, S.H.; Su, Z.Q. Effects of chitosan and water-soluble chitosan micro- and nanoparticles in obese rats fed a high-fat diet. Int. J. Nanomed. 2012, 7, 4069–4076. [Google Scholar] [CrossRef]
- Tan, S.; Gao, B.; Tao, Y.; Guo, J.; Su, Z.Q. Antiobese effects of capsaicin-chitosan microsphere (CCMS) in obese rats induced by high fat diet. J. Agric. Food Chem. 2014, 62, 1866–1874. [Google Scholar] [CrossRef] [PubMed]
- Cho, E.J.; Rahman, M.A.; Kim, S.W.; Baek, Y.M.; Hwang, H.J.; Oh, J.Y.; Hwang, H.S.; Lee, S.H.; Yun, J.W. Chitosan oligosaccharides inhibit adipogenesis in 3T3-L1 adipocytes. J. Microbiol. Biotechnol. 2008, 18, 80–87. [Google Scholar]
- Kumar, S.G.; Rahman, M.A.; Lee, S.H.; Hwang, H.S.; Kim, H.A.; Yun, J.W. Plasma proteome analysis for anti-obesity and anti-diabetic potentials of chitosan oligosaccharides in ob/ob mice. Proteomics 2009, 9, 2149–2162. [Google Scholar] [CrossRef] [PubMed]
- Rahman, A.; Kumar, S.G.; Kim, S.W.; Hwang, H.J.; Baek, Y.M.; Lee, S.H.; Hwang, H.S.; Shon, Y.H.; Nam, K.S.; Yun, J.W. Proteomic analysis for inhibitory effect of chitosan oligosaccharides on 3T3-L1 adipocyte differentiation. Proteomics 2008, 8, 569–581. [Google Scholar] [CrossRef] [PubMed]
- Chawla, A.; Boisvert, W.A.; Lee, C.H.; Laffitte, B.A.; Barak, Y.; Joseph, S.B.; Liao, D.; Nagy, L.; Edwards, P.A.; Curtiss, L.K.; et al. A PPAR gamma-LXR-ABCA1 pathway in macrophages is involved in cholesterol efflux and atherogenesis. Mol. Cell 2001, 7, 161–171. [Google Scholar] [CrossRef] [PubMed]
- Hayashi, K.; Ito, M. Antidiabetic action of low molecular weight chitosan in genetically obese diabetic KK-Ay mice. Biol. Pharm. Bull. 2002, 25, 188–192. [Google Scholar] [CrossRef] [PubMed]
- Sumiyoshi, M.; Kimura, Y. Low molecular weight chitosan inhibits obesity induced by feeding a high-fat diet long-term in mice. J. Pharm. Pharmacol. 2006, 58, 201–207. [Google Scholar] [CrossRef] [PubMed]
- Gottlicher, M.; Widmark, E.; Li, Q.; Gustafsson, J.A. Fatty acids activate a chimera of the clofibric acid-activated receptor and the glucocorticoid receptor. Proc. Natl. Acad. Sci. USA 1992, 89, 4653–4657. [Google Scholar] [CrossRef] [PubMed]
- Mitro, N.; Mak, P.A.; Vargas, L.; Godio, C.; Hampton, E.; Molteni, V.; Kreusch, A.; Saez, E. The nuclear receptor LXR is a glucose sensor. Nature 2007, 445, 219–223. [Google Scholar] [CrossRef] [PubMed]
- Edwards, P.A.; Kennedy, M.A.; Mak, P.A. LXRs; oxysterol-activated nuclear receptors that regulate genes controlling lipid homeostasis. Vascul. Pharmacol. 2002, 38, 249–256. [Google Scholar] [CrossRef] [PubMed]
- Gronemeyer, H.; Gustafsson, J.A.; Laudet, V. Principles for modulation of the nuclear receptor superfamily. Nat. Rev. Drug Discov. 2004, 3, 950–964. [Google Scholar] [CrossRef] [PubMed]
- Lee, C.H.; Olson, P.; Evans, R.M. Minireview: Lipid metabolism, metabolic diseases, and peroxisome proliferator-activated receptors. Endocrinology 2003, 144, 2201–2207. [Google Scholar] [CrossRef] [PubMed]
- Gervois, P.; Fruchart, J.C.; Staels, B. Drug Insight: Mechanisms of action and therapeutic applications for agonists of peroxisome proliferator-activated receptors. Nat. Clin. Pract. Endocrinol. Metab. 2007, 3, 145–156. [Google Scholar] [CrossRef] [PubMed]
- Vuppalanchi, R.; Chalasani, N. Nonalcoholic fatty liver disease and nonalcoholic steatohepatitis: Selected practical issues in their evaluation and management. Hepatology 2009, 49, 306–317. [Google Scholar] [CrossRef] [PubMed]
- Rosen, E.D.; Spiegelman, B.M. PPARgamma: A nuclear regulator of metabolism, differentiation, and cell growth. J. Biol. Chem. 2001, 276, 37731–37734. [Google Scholar] [CrossRef] [PubMed]
- Millatt, L.J.; Bocher, V.; Fruchart, J.C.; Staels, B. Liver X receptors and the control of cholesterol homeostasis: Potential therapeutic targets for the treatment of atherosclerosis. Biochim. Biophys. Acta 2003, 1631, 107–118. [Google Scholar] [CrossRef] [PubMed]
- Rebe, C.; Filomenko, R.; Raveneau, M.; Chevriaux, A.; Ishibashi, M.; Lagrost, L.; Junien, J.L.; Gambert, P.; Masson, D. Identification of biological markers of liver X receptor (LXR) activation at the cell surface of human monocytes. PLoS ONE 2012, 7, e48738. [Google Scholar] [CrossRef] [PubMed]
- Chawla, A.; Repa, J.J.; Evans, R.M.; Mangelsdorf, D.J. Nuclear receptors and lipid physiology: Opening the X-files. Science 2001, 294, 1866–1870. [Google Scholar] [CrossRef] [PubMed]
- Yoshikawa, T.; Shimano, H.; Amemiya-Kudo, M.; Yahagi, N.; Hasty, A.H.; Matsuzaka, T.; Okazaki, H.; Tamura, Y.; Iizuka, Y.; Ohashi, K.; et al. Identification of liver X receptor-retinoid X receptor as an activator of the sterol regulatory element-binding protein 1c gene promoter. Mol. Cell. Biol. 2001, 21, 2991–3000. [Google Scholar] [CrossRef] [PubMed]
- Pawar, A.; Botolin, D.; Mangelsdorf, D.J.; Jump, D.B. The role of liver X receptor-alpha in the fatty acid regulation of hepatic gene expression. J. Biol. Chem. 2003, 278, 40736–40743. [Google Scholar] [CrossRef] [PubMed]
- Schultz, J.R.; Tu, H.; Luk, A.; Repa, J.J.; Medina, J.C.; Li, L.; Schwendner, S.; Wang, S.; Thoolen, M.; Mangelsdorf, D.J.; et al. Role of LXRs in control of lipogenesis. Genes Dev. 2000, 14, 2831–2838. [Google Scholar] [CrossRef] [PubMed]
© 2015 by the authors; licensee MDPI, Basel, Switzerland. This article is an open access article distributed under the terms and conditions of the Creative Commons Attribution license (http://creativecommons.org/licenses/by/4.0/).
Share and Cite
Huang, L.; Chen, J.; Cao, P.; Pan, H.; Ding, C.; Xiao, T.; Zhang, P.; Guo, J.; Su, Z. Anti-Obese Effect of Glucosamine and Chitosan Oligosaccharide in High-Fat Diet-Induced Obese Rats. Mar. Drugs 2015, 13, 2732-2756. https://doi.org/10.3390/md13052732
Huang L, Chen J, Cao P, Pan H, Ding C, Xiao T, Zhang P, Guo J, Su Z. Anti-Obese Effect of Glucosamine and Chitosan Oligosaccharide in High-Fat Diet-Induced Obese Rats. Marine Drugs. 2015; 13(5):2732-2756. https://doi.org/10.3390/md13052732
Chicago/Turabian StyleHuang, Lanlan, Jian Chen, Peiqiu Cao, Haitao Pan, Chen Ding, Tiancun Xiao, Pengfei Zhang, Jiao Guo, and Zhengquan Su. 2015. "Anti-Obese Effect of Glucosamine and Chitosan Oligosaccharide in High-Fat Diet-Induced Obese Rats" Marine Drugs 13, no. 5: 2732-2756. https://doi.org/10.3390/md13052732