Occurrence of the Microcystins MC-LW and MC-LF in Dutch Surface Waters and Their Contribution to Total Microcystin Toxicity


Abstract
:
1. Introduction


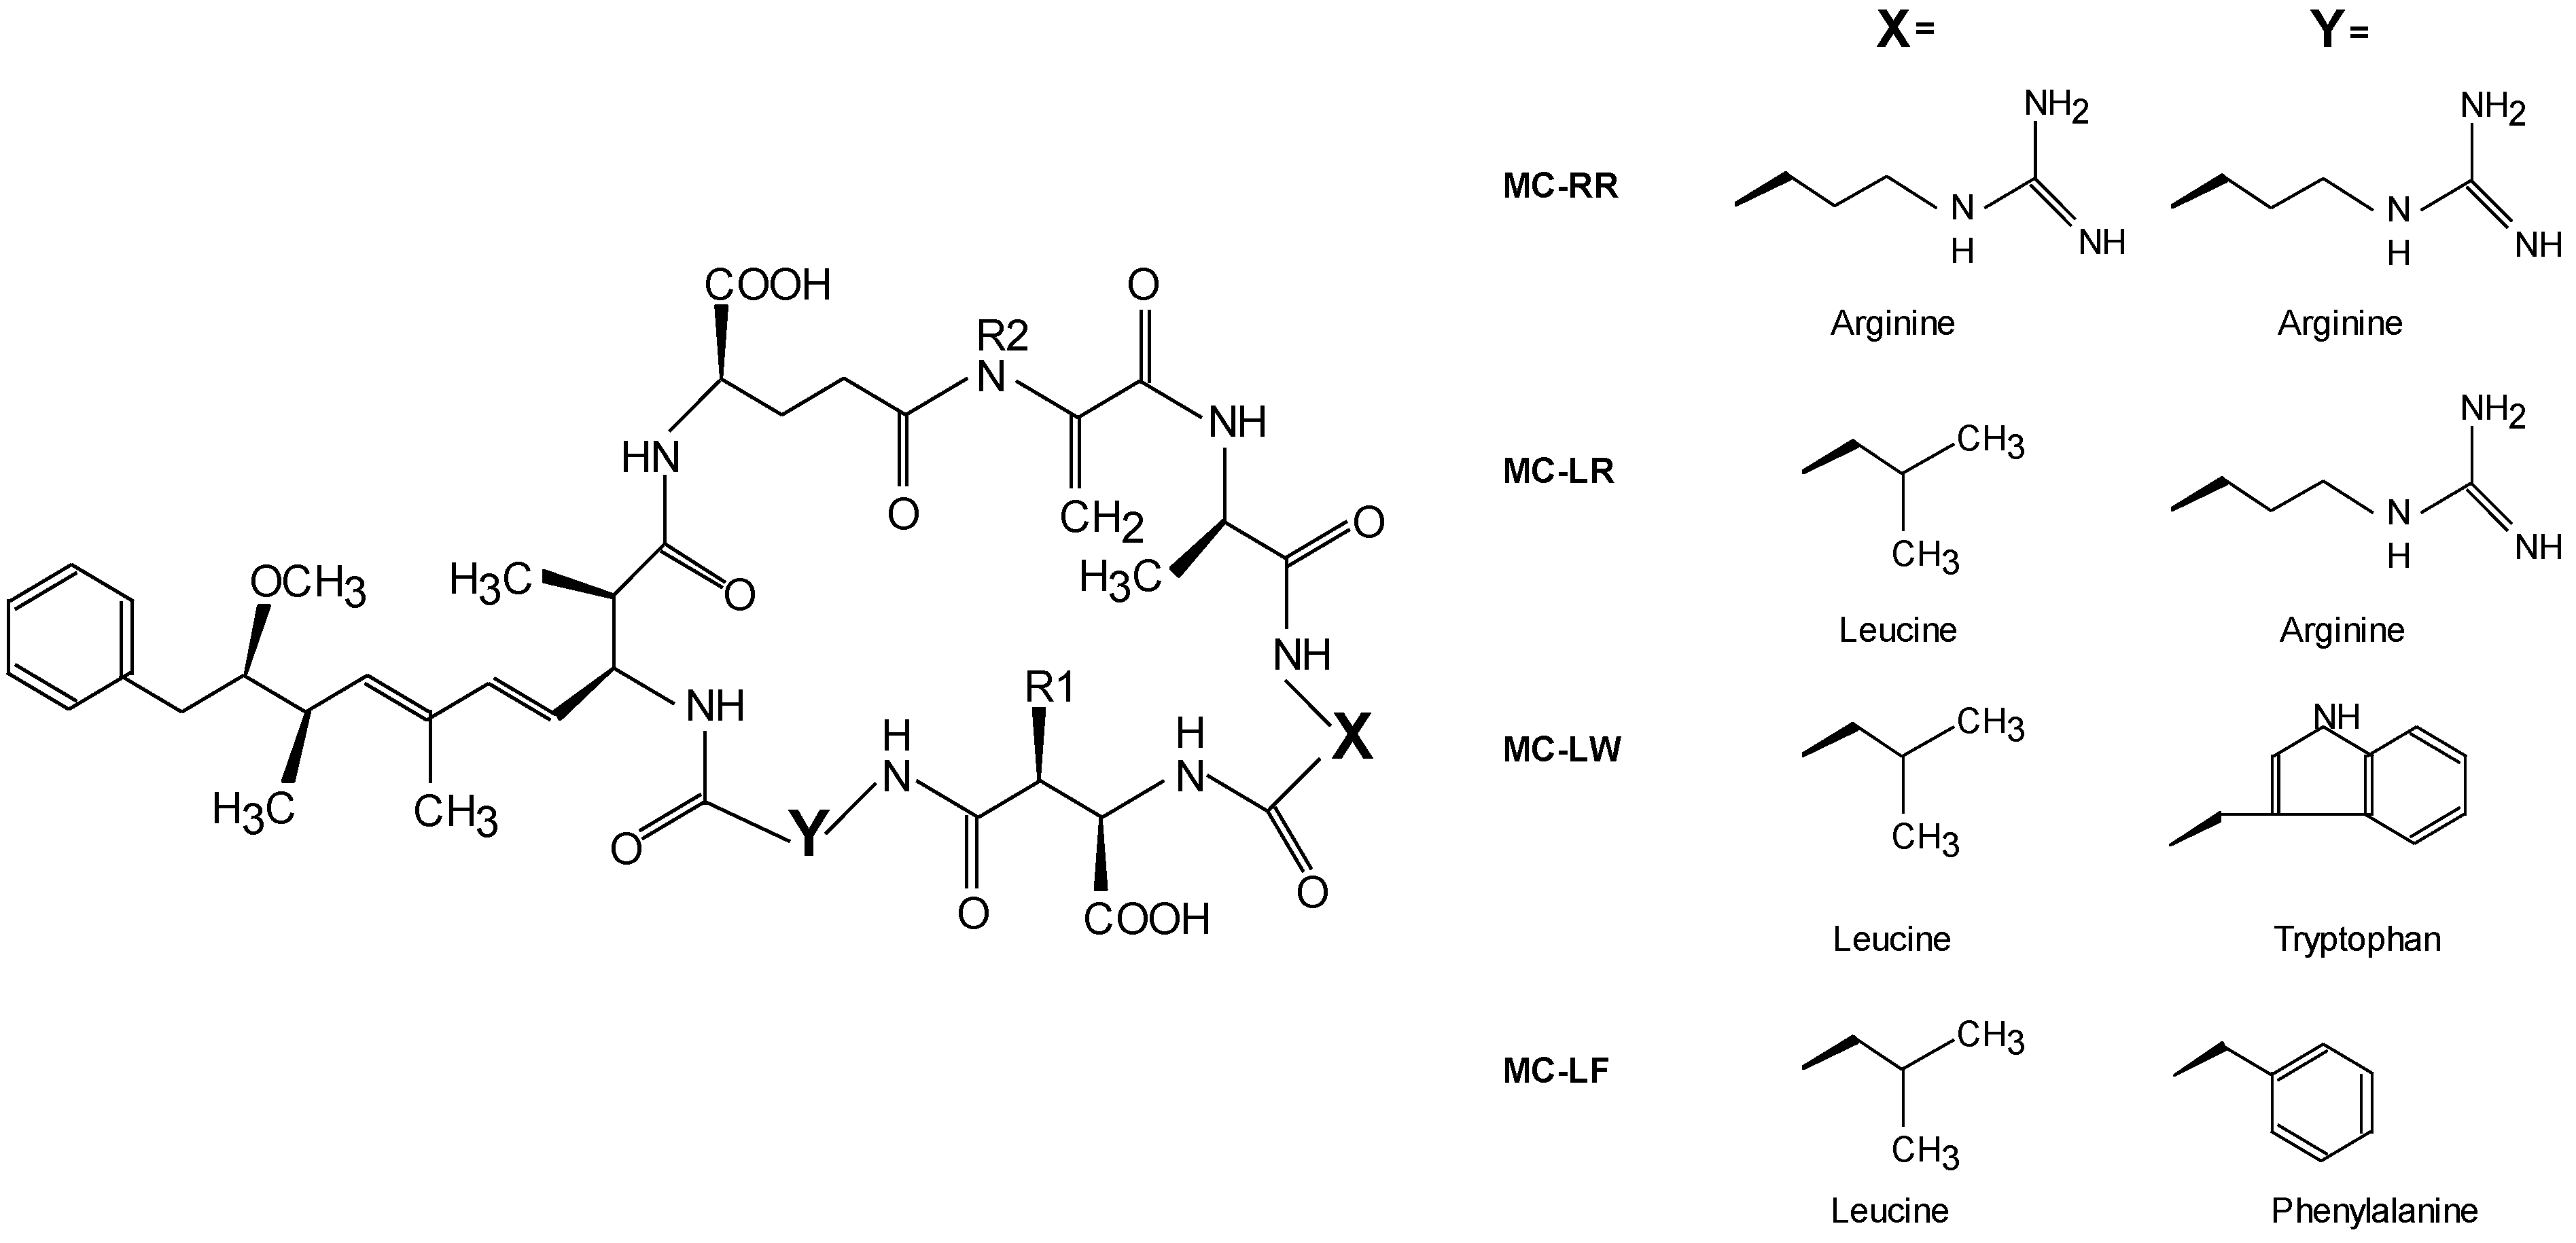
| MC variant | LD50 mouse (i.p.) [8] | LC50 protozoan [16] | EC50 in vitro 1 [9] | Factor used in this study |
|---|---|---|---|---|
| dm-7-MC-RR | 0.28 | n.d. | n.d. | 0.28 |
| MC-RR | 0.06–0.10 | n.d. | 0.02–0.20 | 0.08 |
| MC-YR | 0.25–0.33 | n.d. | n.d. | 0.29 |
| dm-7-MC-LR | 0.20 | n.d. | n.d. | 0.20 |
| MC-LY | 0.56 | 1.1–1.4 | n.d. | 0.56 |
| MC-LW | n.d. | 1.9–2.9 | 7–64 | 7 |
| MC-LF | n.d. | 2.0–3.0 | 7–69 | 7 |

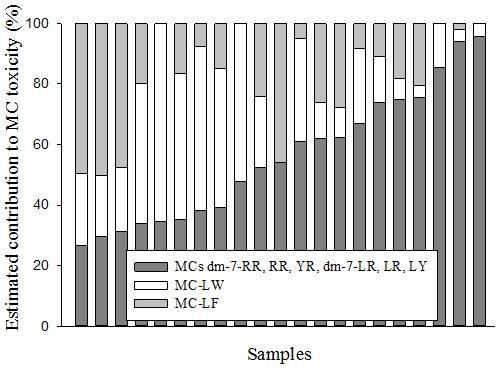
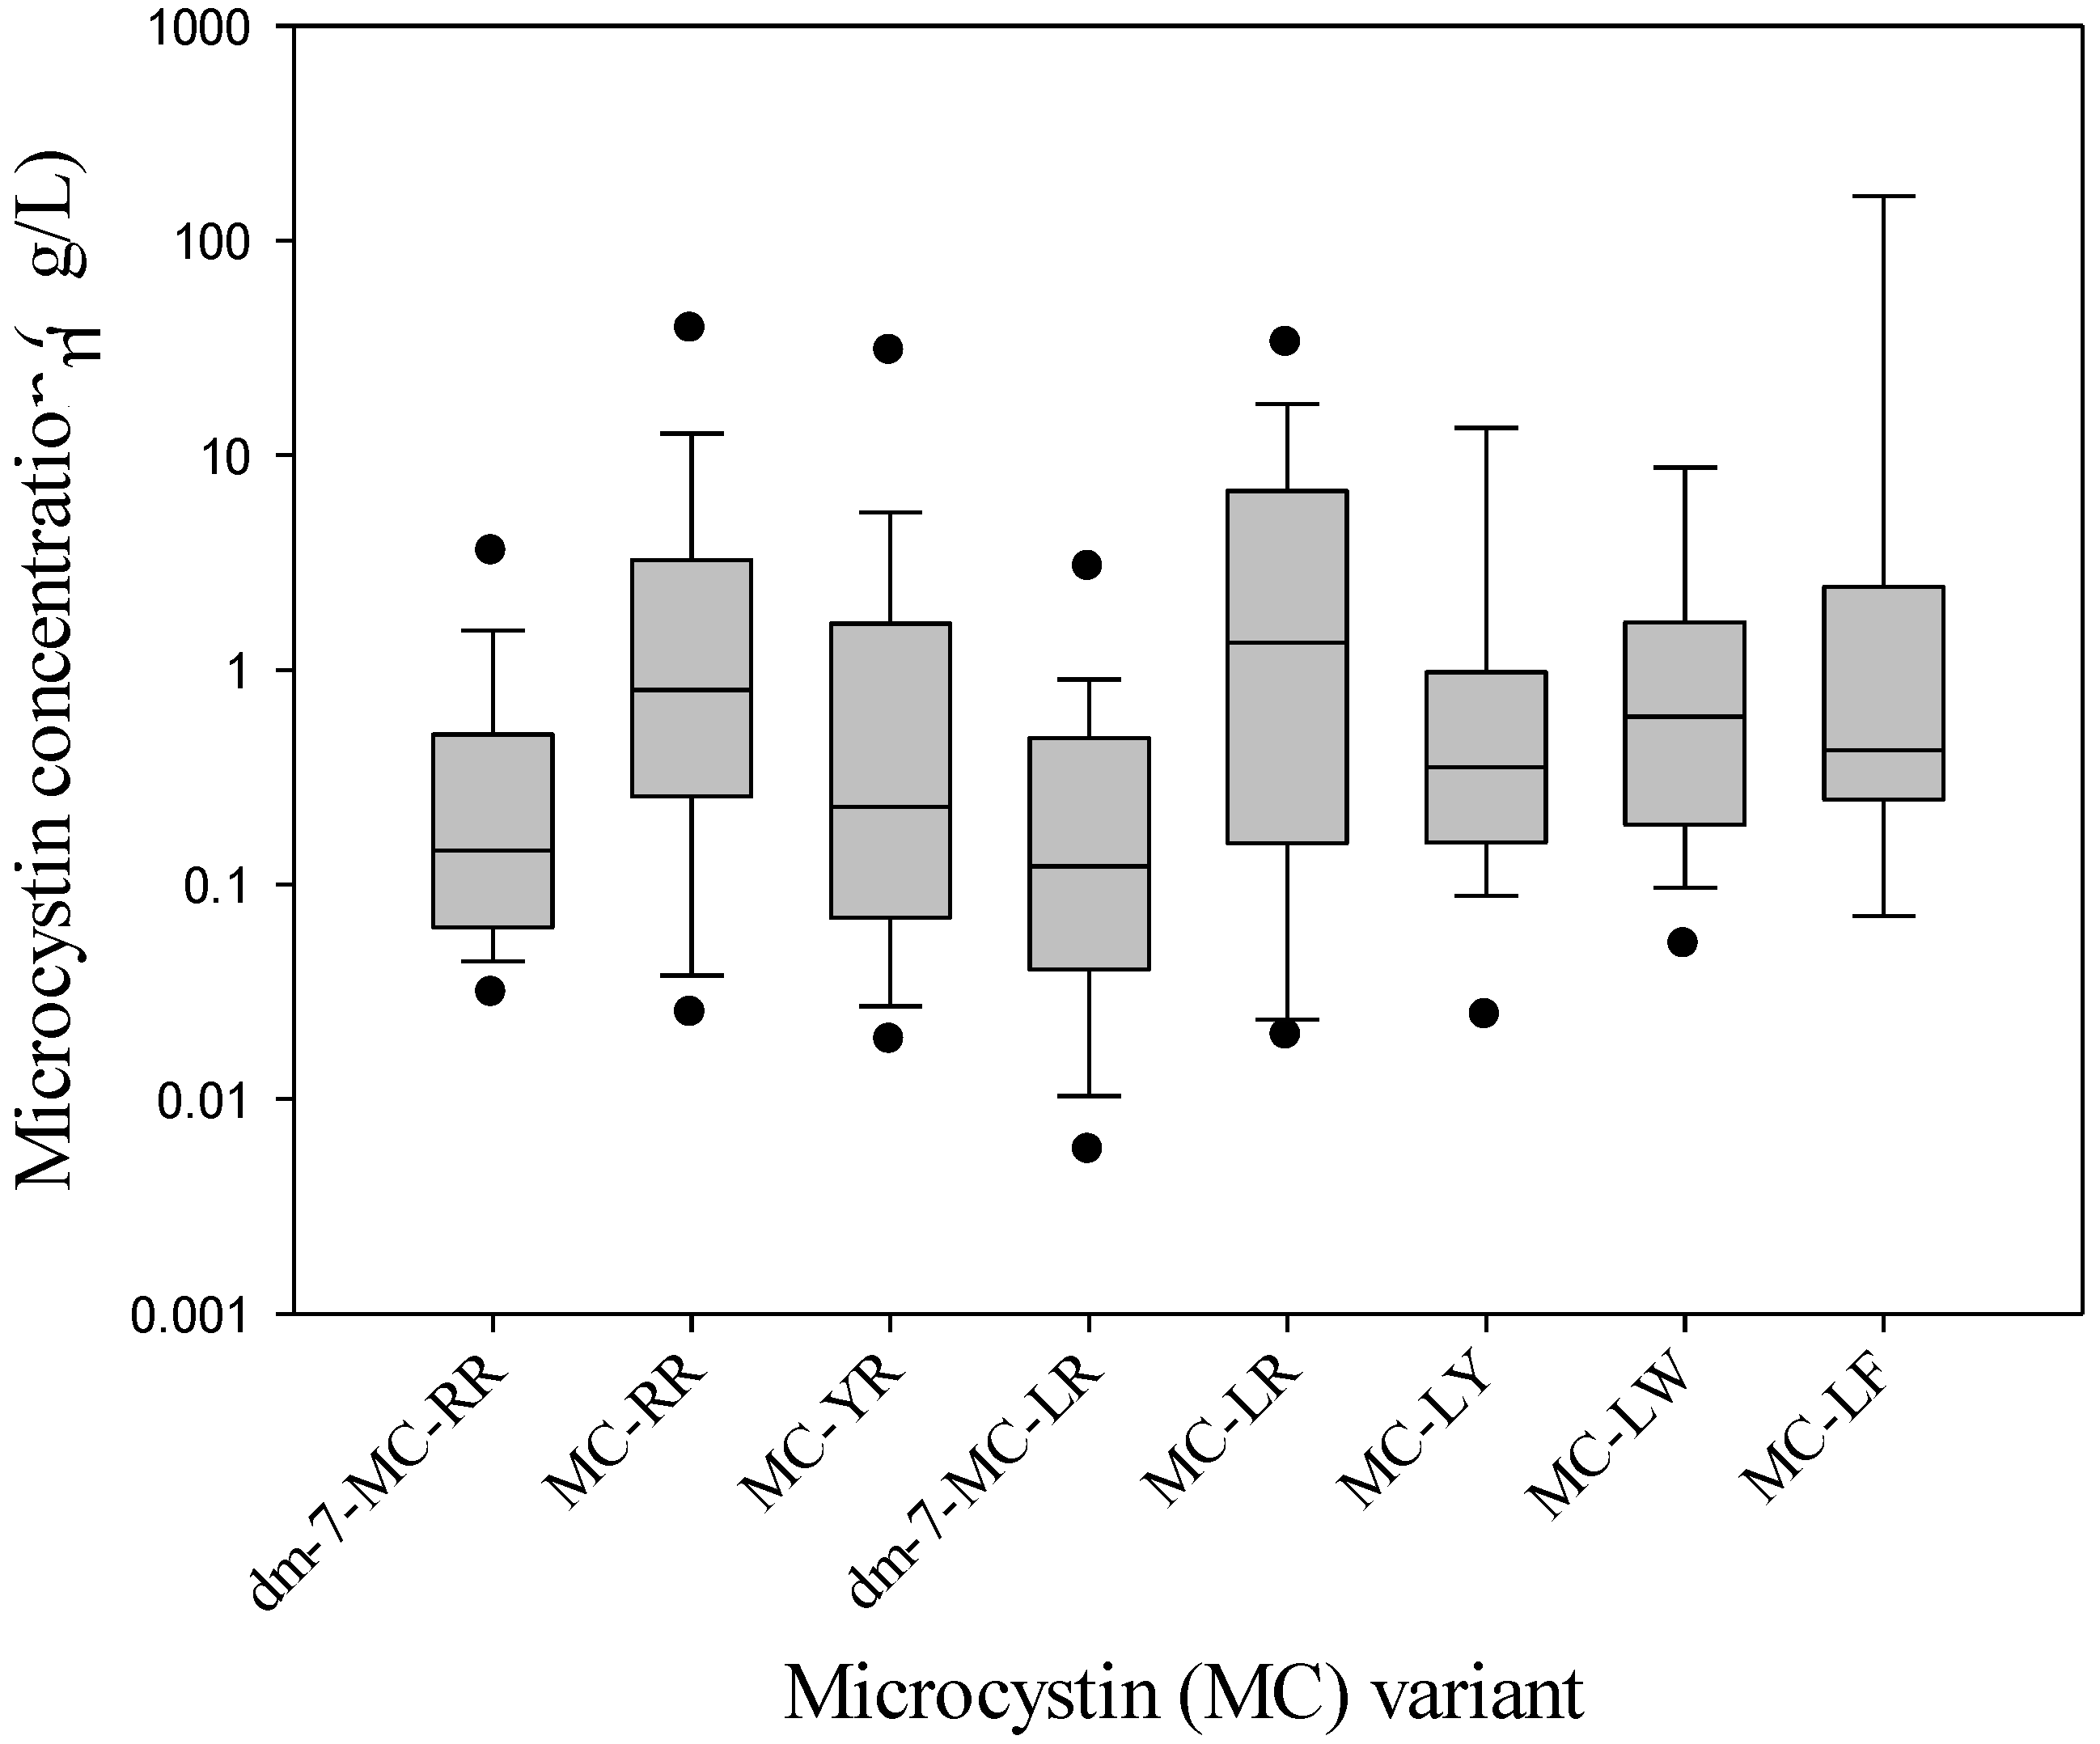
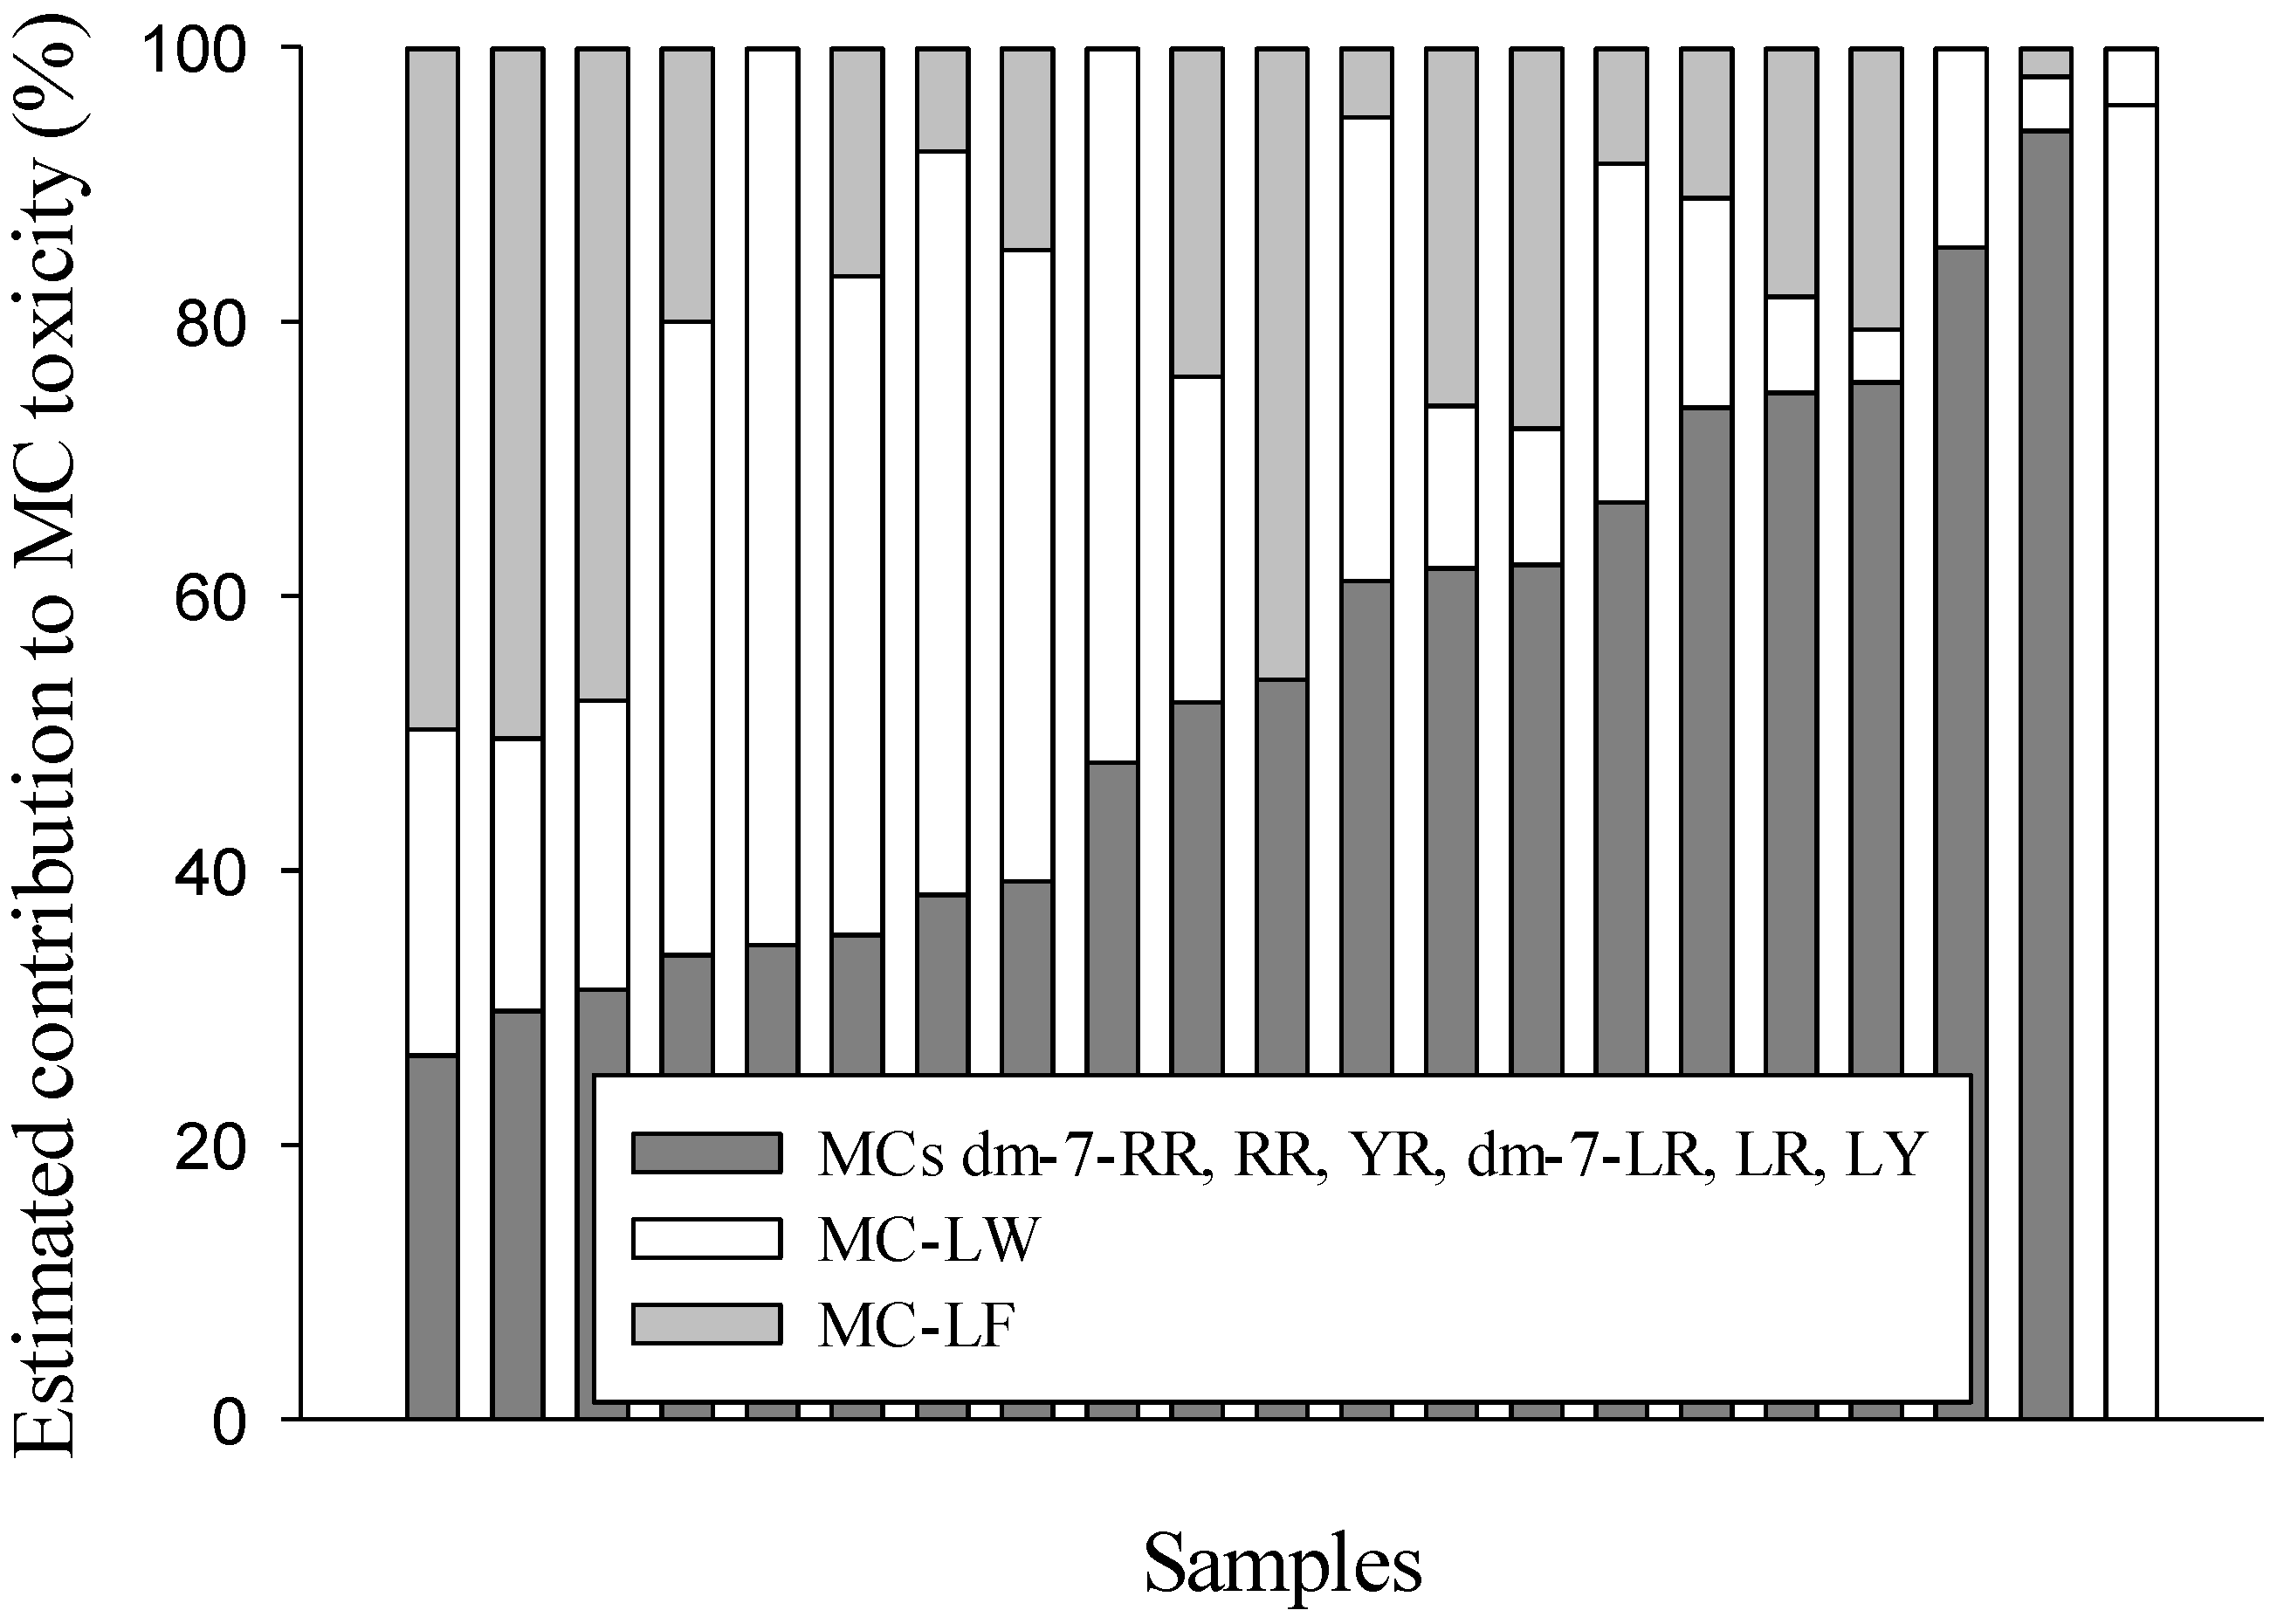
2. Results and Discussion
| dm-7-RR | RR | YR | dm-7-LR | LR | LY | LW | LF | Total MC | |
|---|---|---|---|---|---|---|---|---|---|
| average | 0.45 | 5.0 | 2.4 | 4.0 | 35 | 5.9 | 14 | 4.2 | 49 |
| median | 0.20 | 0.81 | 0.23 | 0.12 | 1.3 | 0.35 | 0.61 | 0.42 | 2.5 |
| maximum | 3.6 | 66 | 41 | 220 | 2100 | 110 | 260 | 33 | 2800 |
| minimum | 0.03 | 0.02 | 0.01 | 0.003 | 0.01 | 0.001 | 0.05 | 0.05 | 0.02 |
| n quantified | 38 | 67 | 67 | 62 | 73 | 25 | 20 | 17 | 73 |
| n not quantified | 20 | 2 | 5 | 9 | 2 | 0 | 0 | 6 | 4 |
| n not detected | 30 | 19 | 16 | 17 | 13 | 63 | 68 | 65 | 11 |
| dm-7-RR | RR | YR | dm-7-LR | LR | LY | LW | LF | Total MC | |
|---|---|---|---|---|---|---|---|---|---|
| average | 47 | 780 | 230 | 41 | 1700 | 840 | 300 | 580 | 3400 |
| median | 11 | 85 | 81 | 7.6 | 160 | 530 | 100 | 260 | 480 |
| maximum | 170 | 4600 | 1200 | 230 | 7900 | 2300 | 990 | 1800 | 14,000 |
| minimum | 4.3 | 3.8 | 1.2 | 0.89 | 3.0 | 24 | 10 | 8.0 | 26 |
| n detected | 8 | 10 | 10 | 10 | 10 | 4 | 4 | 4 | 10 |
| n not detected | 2 | 0 | 0 | 0 | 0 | 6 | 6 | 6 | 0 |

3. Experimental Section
3.1. Sample Origin
3.2. Sample Extraction
3.3. LC-MS/MS Analysis
| Compound | Retention time | Precursor ion | Fragmentor | Quantifier ion | CE 1 quantifier | Qualifier ion | CE 1 qualifier | Ratio 2 |
|---|---|---|---|---|---|---|---|---|
| min | m/z | V | m/z | V | m/z | V | % | |
| dm-7-MC-RR | 6.93 | 512.8 | 135 | 135.1 | 26 | 70.1 | 85 | 1.2 |
| MC-RR | 7.62 | 519.8 | 151 | 135.1 | 30 | 70.1 | 75 | 2.7 |
| NOD | 8.03 | 825.5 | 220 | 135.1 | 70 | 70.1 | 95 | 44.2 |
| MC-YR | 8.16 | 523.3 | 102 | 911.5 | 5 | 135.1 | 6 | 103.6 |
| dm-7-MC-LR | 8.21 | 491.3 | 88 | 847.6 | 5 | 135.1 | 6 | 84.0 |
| MC-LR | 8.24 | 498.3 | 88 | 135.1 | 6 | 482.3 | 6 | 56.7 |
| MC-LY | 9.67 | 868.4 | 170 | 163.0 | 35 | 136.1 | 75 | 29.0 |
| MC-LW | 10.22 | 891.5 | 146 | 163.0 | 31 | 159.0 | 75 | 26.9 |
| MC-LF | 10.47 | 852.5 | 140 | 163.1 | 31 | 120.1 | 79 | 39.1 |
4. Conclusions
Acknowledgments
Conflict of Interest
References and Notes
- Carmichael, W. A World Overview—One-Hundred-Twenty-Seven Years of Research on Toxic Cyanobacteria—Where Do We Go from Here? In Cyanobacterial Harmful Algal Blooms: State of the Science and Research Needs; Springer: New York, NY, USA, 2008; Volume 619, pp. 104–125. [Google Scholar]
- O’Neil, J.M.; Davis, T.W.; Burford, M.A.; Gobler, C.J. The rise of harmful cyanobacteria blooms: The potential roles of eutrophication and climate change. Harmful Algae 2012, 14, 313–334. [Google Scholar] [CrossRef]
- Codd, G.A.; Morrison, L.F.; Metcalf, J.S. Cyanobacterial toxins: Risk management for health protection. Toxicol. Appl. Pharmacol. 2005, 203, 264–272. [Google Scholar] [CrossRef]
- Sivonen, K.; Jones, G.J. Cyanobacterial Toxins. In Toxic Cyanobacteria in Water: A Guide to Their Public Health Consequences, Monitoring and Management; Chorus, I., Bartram, J., Eds.; E & FN Spon: London, UK, 1999; pp. 41–111. [Google Scholar]
- Doekel, S.; Marahiel, M.A. Biosynthesis of Natural Products on Modular Peptide Synthetases. Metab. Eng. 2001, 3, 64–77. [Google Scholar] [CrossRef]
- Dittmann, E.; Fewer, D.P.; Neilan, B.A. Cyanobacterial toxins: Biosynthetic routes and evolutionary roots. FEMS Microb. Rev. 2013, 37, 23–43. [Google Scholar] [CrossRef]
- Kuiper-Goodman, T.; Falconer, I.R.; Fitzgerald, J. Human Health Aspects. In Toxic Cyanobacteria in Water: A Guide to Their Public Health Consequences, Monitoring and Management; Chorus, I., Bartram, J., Eds.; E & FN Spon: London, UK, 1999; pp. 41–111. [Google Scholar]
- Zurawell, R.W.; Chen, H.; Burke, J.M.; Prepas, E.E. Hepatotoxic cyanobacteria: A review of the biological importance of microcystins in freshwater environments. J. Toxicol. Environ. Health Part B 2005, 8, 1–37. [Google Scholar] [CrossRef]
- Fischer, A.; Hoeger, S.J.; Stemmer, K.; Feurstein, D.J.; Knobeloch, D.; Nussler, A.; Dietrich, D.R. The role of organic anion transporting polypeptides (OATPs/SLCOs) in the toxicity of different microcystin congeners in vitro: A comparison of primary human hepatocytes and OATP-transfected HEK293 cells. Toxicol. Appl. Pharmacol. 2010, 245, 9–20. [Google Scholar] [CrossRef]
- Vesterkvist, P.S.M.; Misiorek, J.O.; Spoof, L.E.M.; Toivola, D.M.; Meriluoto, J.A.O. Comparative cellular toxicity of hydrophilic and hydrophobic microcystins on Caco-2 cells. Toxins 2012, 4, 1008–1023. [Google Scholar] [CrossRef]
- Feurstein, D.; Holst, K.; Fischer, A.; Dietrich, D.R. Oatp-associated uptake and toxicity of microcystins in primary murine whole brain cells. Toxicol. Appl. Pharmacol. 2009, 234, 247–255. [Google Scholar] [CrossRef]
- Feurstein, D.; Stemmer, K.; Kleinteich, J.; Speicher, T.; Dietrich, D.R. Microcystin congener- and concentration-dependent induction of murine neuron apoptosis and neurite degeneration. Toxicol. Sci. 2011, 124, 424–431. [Google Scholar] [CrossRef]
- Monks, N.R.; Liu, S.; Xu, Y.; Yu, H.; Bendelow, A.S.; Moscow, J.A. Potent cytotoxicity of the phosphatase inhibitor microcystin LR and microcystin analogues in OATP1B1- and OATP1B3-expressing HeLa cells. Mol. Cancer Ther. 2007, 6, 587–598. [Google Scholar]
- Feurstein, D.; Kleinteich, J.; Heussner, A.H.; Stemmer, K.; Dietrich, D.R. Investigation of microcystin congener-dependent uptake into primary murine neurons. Environ. Health Perspect. 2010, 118, 1370–1375. [Google Scholar] [CrossRef]
- Vesterkvist, P.S.M.; Meriluoto, J.A.O. Interaction between microcystins of different hydrophobicities and lipid monolayers. Toxicon 2003, 41, 349–355. [Google Scholar] [CrossRef]
- Ward, C.J.; Codd, G.A. Comparative toxicity of four microcystins of different hydrophobicities to the protozoan, Tetrahymena pyriformis. J. Appl. Microb. 1999, 86, 874–882. [Google Scholar] [CrossRef]
- Cuvin-Aralar, M.L.; Fastner, J.; Focken, U.; Becker, K.; Aralar, E.V. Microcystins in natural blooms and laboratory cultured Microcystis aeruginosa from Laguna de Bay, Philippines. Syst. Appl. Microb. 2002, 25, 179–182. [Google Scholar] [CrossRef]
- Graham, J.L.; Loftin, K.A.; Meyer, M.T.; Ziegler, A.C. Cyanotoxin mixtures and taste-and-odor compounds in cyanobacterial blooms from the midwestern united states. Environ. Sci. Technol. 2010, 44, 7361–7368. [Google Scholar] [CrossRef]
- Gambaro, A.; Barbaro, E.; Zangrando, R.; Barbante, C. Simultaneous quantification of microcystins and nodularin in aerosol samples using high-performance liquid chromatography/negative electrospray ionization tandem mass spectrometry. Rapid Commun. Mass Spectrom. 2012, 26, 1497–1506. [Google Scholar] [CrossRef]
- Spoof, L.; Vesterkvist, P.; Lindholm, T.; Meriluoto, J. Screening for cyanobacterial hepatotoxins, microcystins and nodularin in environmental water samples by reversed-phase liquid chromatography-electrospray ionisation mass spectrometry. J. Chromatogr. A 2003, 1020, 105–119. [Google Scholar] [CrossRef]
- Ballot, A.; Krienitz, L.; Kotut, K.; Wiegand, C.; Metcalf, J.S.; Codd, G.A.; Pflugmacher, S. Cyanobacteria and cyanobacterial toxins in three alkaline Rift Valley lakes of Kenya—Lakes Bogoria, Nakuru and Elmenteita. J. Plankton Res. 2004, 26, 925–935. [Google Scholar] [CrossRef]
- Krienitz, L.; Ballot, A.; Kotut, K.; Wiegand, C.; Pütz, S.; Metcalf, J.S.; Codd, G.A.; Pflugmacher, S. Contribution of hot spring cyanobacteria to the mysterious deaths of Lesser Flamingos at Lake Bogoria, Kenya. FEMS Microb. Ecol. 2003, 43, 141–148. [Google Scholar] [CrossRef]
- Gurbuz, F.; Metcalf, J.S.; Karahan, A.G.; Codd, G.A. Analysis of dissolved microcystins in surface water samples from Kovada Lake, Turkey. Sci. Total Environ. 2009, 407, 4038–4046. [Google Scholar] [CrossRef]
- Craig, M.; McCready, T.L.; Luu, H.A.; Smillie, M.A.; Dubord, P.; Holmes, C.F.B. Identification and characterization of hydrophobic microcystins in Canadian freshwater cyanobacteria. Toxicon 1993, 31, 1541–1549. [Google Scholar] [CrossRef]
- Lürling, M.; Faassen, E.J. Dog poisonings associated with a Microcystis aeruginosa bloom in the Netherlands. Toxins 2013, 5, 556–567. [Google Scholar] [CrossRef]
- Messineo, V.; Bogialli, S.; Melchiorre, S.; Sechi, N.; Lugliè, A.; Casiddu, P.; Mariani, M.A.; Padedda, B.M.; Corcia, A.D.; Mazza, R.; Carloni, E.; Bruno, M. Cyanobacterial toxins in Italian freshwaters. Ecol. Manag. Inland Waters 2009, 39, 95–106. [Google Scholar]
- Wang, J.; Pang, X.; Ge, F.; Ma, Z. An ultra-performance liquid chromatography-tandem mass spectrometry method for determination of microcystins occurrence in surface water in Zhejiang Province, China. Toxicon 2007, 49, 1120–1128. [Google Scholar] [CrossRef]
- Pavlova, V.; Babica, P.; Todorova, D.; Bratanova, Z.; Maršálek, B. Contamination of some reservoirs and lakes in Republic of Bulgaria by microcystins. Acta Hydrochim. Hydrobiol. 2006, 34, 437–441. [Google Scholar] [CrossRef]
- Lürling, M.; Faassen, E.J. Controlling toxic cyanobacteria: Effects of dredging and phosphorus-binding clay on cyanobacteria and microcystins. Water Res. 2012, 46, 1447–1459. [Google Scholar] [CrossRef]
- Chorus, I. Current Approaches to Cyanotoxin Risk Assessment, Risk Management and Regulations in Different Countries; Umweltbundesambt: Dessau-Roβlau, Germany, 2012; Volume 63, pp. 1–147. [Google Scholar]
- Van De Waal, D.B.; Verspagen, J.M.H.; Lürling, M.; van Donk, E.; Visser, P.M.; Huisman, J. The ecological stoichiometry of toxins produced by harmful cyanobacteria: An experimental test of the carbon-nutrient balance hypothesis. Ecol. Lett. 2009, 12, 1326–1335. [Google Scholar] [CrossRef]
- Robillot, C.; Vinh, J.; Puiseux-Dao, S.; Hennion, M.C. Hepatotoxin production kinetics of the cyanobacterium Microcystis aeruginosa PCC 7820, as determined by HPLC-mass spectrometry and protein phosphatase bioassay. Environ. Sci. Technol. 2000, 34, 3372–3378. [Google Scholar] [CrossRef]
- Krüger, T.; Wiegand, C.; Kun, L.; Luckas, B.; Pflugmacher, S. More and more toxins around-analysis of cyanobacterial strains isolated from Lake Chao (Anhui Province, China). Toxicon 2010, 56, 1520–1524. [Google Scholar] [CrossRef]
Supplementary Files
© 2013 by the authors; licensee MDPI, Basel, Switzerland. This article is an open access article distributed under the terms and conditions of the Creative Commons Attribution license (http://creativecommons.org/licenses/by/3.0/).
Share and Cite
Faassen, E.J.; Lürling, M. Occurrence of the Microcystins MC-LW and MC-LF in Dutch Surface Waters and Their Contribution to Total Microcystin Toxicity. Mar. Drugs 2013, 11, 2643-2654. https://doi.org/10.3390/md11072643
Faassen EJ, Lürling M. Occurrence of the Microcystins MC-LW and MC-LF in Dutch Surface Waters and Their Contribution to Total Microcystin Toxicity. Marine Drugs. 2013; 11(7):2643-2654. https://doi.org/10.3390/md11072643
Chicago/Turabian StyleFaassen, Elisabeth J., and Miquel Lürling. 2013. "Occurrence of the Microcystins MC-LW and MC-LF in Dutch Surface Waters and Their Contribution to Total Microcystin Toxicity" Marine Drugs 11, no. 7: 2643-2654. https://doi.org/10.3390/md11072643