Image-Based Airborne Sensors: A Combined Approach for Spectral Signatures Classification through Deterministic Simulated Annealing

Abstract
:1. Introduction
2. Design of the Classifier
2.1. Training Phase
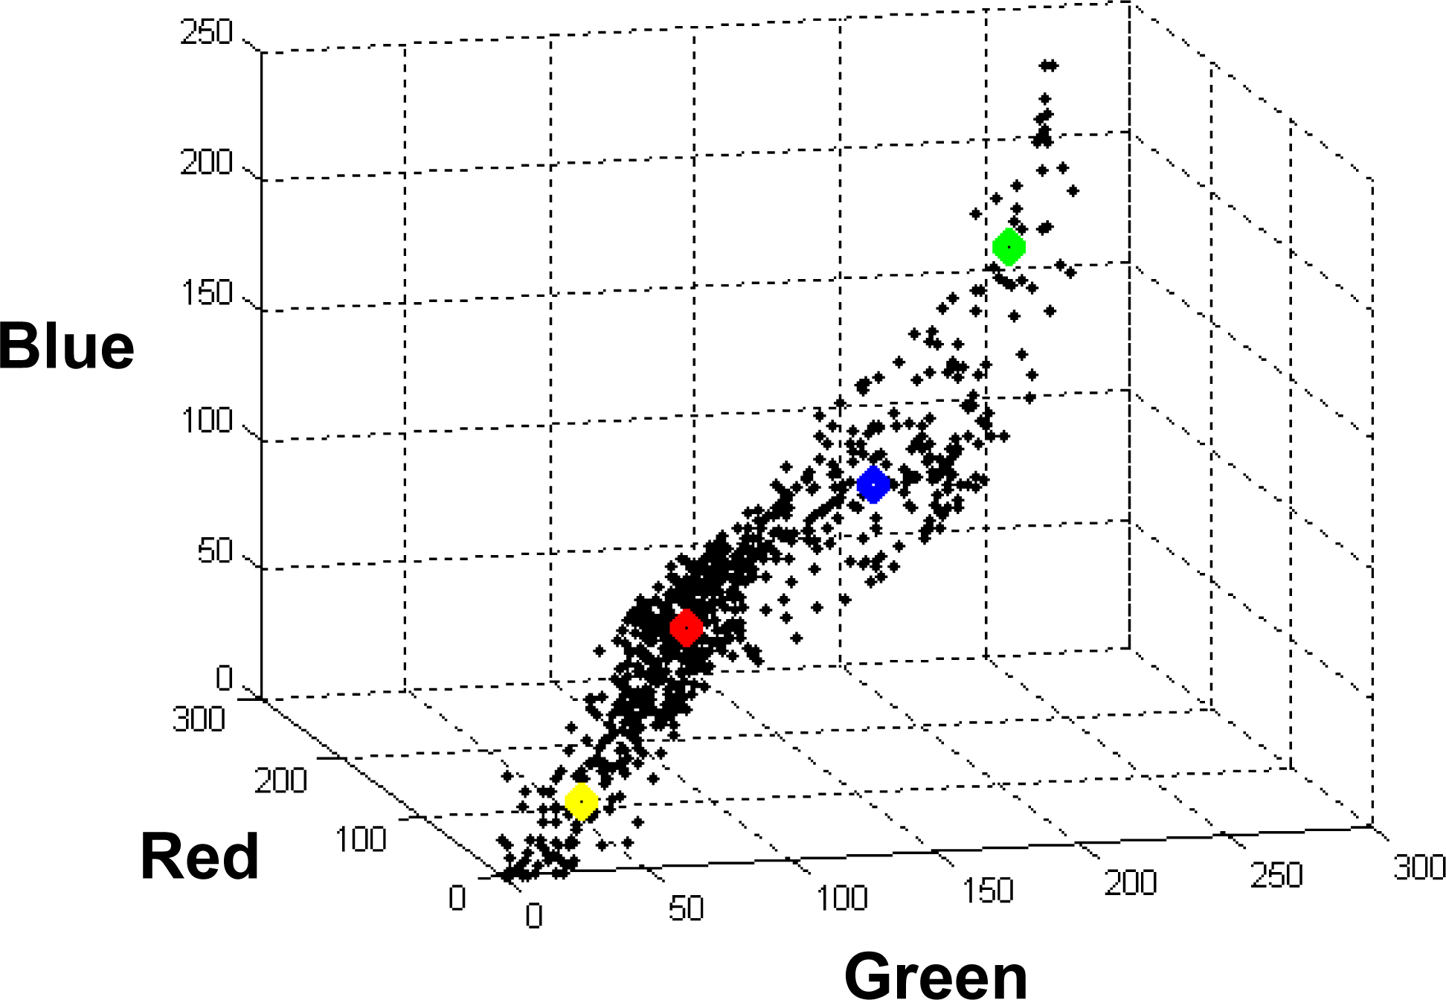
a) Fuzzy Clustering (FC)
b) Bayesian Parametric (BP) estimation
2.2. Decision Phase
- Initialization: load each node with according to the equation (2); set ε = 0.01 (constant to accelerate the convergence, section 3.1); tmax = 100. Define nc as the number of nodes that change their state values at each iteration.
- DSA process:t = 0while t < tmax or nc ≠ 0
- t = t + 1; nc = 0;
- for each node i
- if
- then
- nc = nc + 1; else nc = nc
- end if; end for; end while
- Outputs: the states for all nodes updated.
3. Comparative Analysis and Performance Evaluation
3.1. Setting Free Parameters
a) Parameters involved in the FC training phase
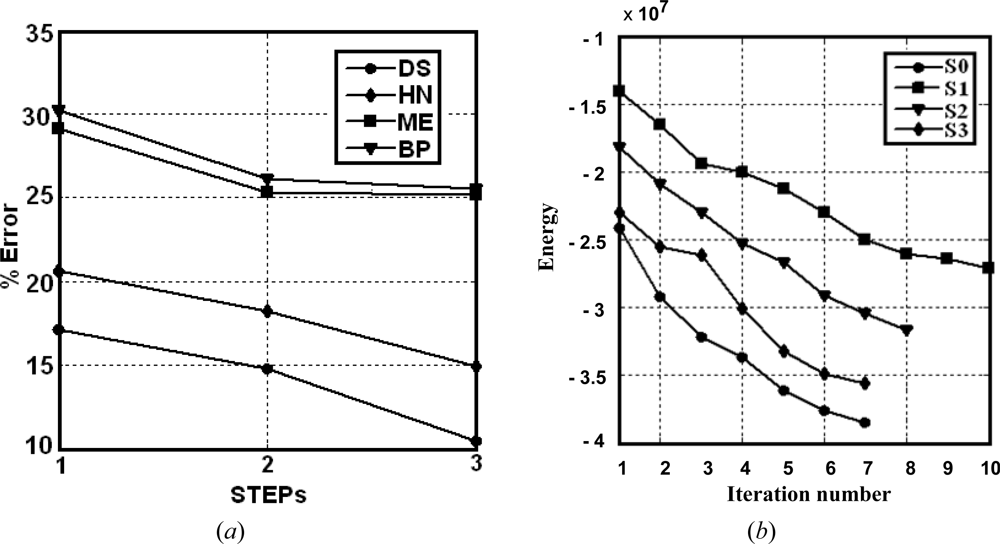
b) DSA convergence
3.2. Training Phase
3.3. Decision Phase and Comparative Analysis
a) Design of a test strategy
b) Results
c) Discussion
- Simple classifiers: the best performance is achieved by BP as compared to FC. This suggests that the network initialization, through the probabilities supplied by BP, is acceptable.
- Combined rules: the mean and product rules achieve both similar averaged errors. The performance of the mean is slightly better than the product. This is because, as reported in [38], combining classifiers which are trained in independent feature spaces result in improved performance for the product rule, while in completely dependent feature spaces the performance is the same. We think that this occurs in our RGB feature space because of the high correlation among the R, G and B spectral components [39,40]. High correlation means that if the intensity changes, all the three components will change accordingly.
- Fuzzy combination: this approach outperforms the simple classifiers and the combination rules. Nevertheless, this improvement requires the convenient adjusting of the parameter a, with other values the results get worse.
- Optimization and relaxation approaches: once again, the best performance is achieved by DS, which with a similar number of iterations that HN obtains better percentages of successes, the improvement is about 3.6 percentage points. DS also outperforms FM. This is because DS avoids satisfactorily some minima of energy, as expected.
4. Conclusions
Acknowledgments
References and Notes
- Valdovinos, R.M.; Sánchez, J.S.; Barandela, R. Dynamic and static weighting in classifier fusion. In Pattern Recognition and Image Analysis, Lecture Notes in Computer Science; Marques, J.S., Pérez de la Blanca, N., Pina, P., Eds.; Springer Berlin/Heidelberg: Berlin, Germany, 2005; pp. 59–66. [Google Scholar]
- Puig, D.; García, M.A. Automatic texture feature selection for image pixel classification. Patt. Recog 2006, 39, 1996–2009. [Google Scholar]
- Hanmandlu, M.; Madasu, V.K.; Vasikarla, S. A Fuzzy Approach to Texture Segmentation. Proceedings of the IEEE International Conference on Information Technology: Coding and Computing (ITCC’04), Las Vegas, NV, USA, April 5–7, 2004; pp. 636–642.
- Rud, R.; Shoshany, M.; Alchanatis, V.; Cohen, Y. Application of spectral features’ ratios for improving classification in partially calibrated hyperspectral imagery: a case study of separating Mediterranean vegetation species. J. Real-Time Image Process 2006, 1, 143–152. [Google Scholar]
- Kumar, K.; Ghosh, J.; Crawford, M.M. Best-bases feature extraction for pairwise classification of hyperspectral data. IEEE Trans. Geosci. Remot. Sen 2001, 39, 1368–1379. [Google Scholar]
- Yu, H.; Li, M.; Zhang, H.J.; Feng, J. Color texture moments for content-based image retrieval. Proceedings of International Conference on Image Processing, Rochester, NY, USA, September 22–25, 2002; pp. 24–28.
- Maillard, P. Comparing texture analysis methods through classification. Photogramm. Eng. Remote Sens 2003, 69, 357–367. [Google Scholar]
- Randen, T.; Husøy, J.H. Filtering for texture classification: a comparative study. IEEE Trans. Patt. Anal. Mach. Int 1999, 21, 291–310. [Google Scholar]
- Wagner, T. Texture Analysis. Signal Processing and Pattern Recognition. In Handbook of Computer Vision and Applications; Jähne, B., Hauβecker, H., Geiβler, P., Eds.; Academic Press: St. Louis, MO, USA, 1999. [Google Scholar]
- Smith, G.; Burns, I. Measuring texture classification algorithms. Patt. Recog. Lett 1997, 18, 1495–1501. [Google Scholar]
- Drimbarean, A.; Whelan, P.F. Experiments in colour texture analysis. Patt. Recog. Lett 2003, 22, 1161–1167. [Google Scholar]
- Kong, Z.; Cai, Z. Advances of Research in Fuzzy Integral for Classifier’S Fusion. Proceedings of 8th ACIS International Conference on Software Engineering, Artificial Intelligence, Networking and Parallel/Distributed Computing, Tsingtao, China, July 30–August 1, 2007; pp. 809–814.
- Kuncheva, L.I. “Fuzzy” vs “non-fuzzy” in combining classifiers designed by boosting. IEEE Trans. Fuzzy Syst 2003, 11, 729–741. [Google Scholar]
- Kumar, S.; Ghosh, J.; Crawford, M.M. Hierarchical fusion of multiple classifiers for hyperspectral data analysis. Patt. Anal. Appl 2002, 5, 210–220. [Google Scholar]
- Kittler, K.; Hatef, M.; Duin, R.P.W.; Matas, J. On combining classifiers. IEEE Trans. Patt. Anal. Mach. Int 1998, 20, 226–239. [Google Scholar]
- Cao, J.; Shridhar, M.; Ahmadi, M. Fusion of Classifiers with Fuzzy Integrals. Proceedings of 3rd Int. Conf. Document Analysis and Recognition (ICDAR’95), Montreal, Canada, August 14–15, 1995; pp. 108–111.
- Partridge, D.; Griffith, N. Multiple classifier systems: software engineered, automatically modular leading to a taxonomic overview. Patt. Anal. Appl 2002, 5, 180–188. [Google Scholar]
- Deng, D.; Zhang, J. Combining Multiple Precision-Boosted Classifiers for Indoor-Outdoor Scene Classification. Inform. Technol. Appl 2005, 1, 720–725. [Google Scholar]
- Alexandre, L.A.; Campilho, A.C.; Kamel, M. On combining classifiers using sum and product rules. Patt. Recog. Lett 2001, 22, 1283–1289. [Google Scholar]
- Kuncheva, L.I. Combining Pattern Classifiers: Methods and Algorithms; Wiley: New York, NY, USA, 2004. [Google Scholar]
- Duda, R.O.; Hart, P.E.; Stork, D.S. Pattern Classification; Wiley: New York, NY, USA, 2001. [Google Scholar]
- Zimmermann, H.J. Fuzzy Set Theory and its Applications; Kluwer Academic Publishers: Norwell, MA, USA, 1991. [Google Scholar]
- Geman, S.; Geman, G. Stochastic relaxation, Gibbs distributions, and the Bayesian restoration of images. IEEE Trans. Patt. Anal. Mach. Int 1984, 6, 721–741. [Google Scholar]
- Koffka, K. Principles of Gestalt Psychology; Harcourt Brace & Company: New York, NY, USA, 1935. [Google Scholar]
- Palmer, S.E. Vision Science; MIT Press: Cambridge, MA, USA, 2004. [Google Scholar]
- Xu, L.; Amari, S.I. Encyclopedia of Artificial Intelligence. In Combining Classifiers and Learning Mixture-of-Experts; Rabuñal-Dopico, J. R., Dorado, J., Pazos, A., Eds.; IGI Global (IGI) publishing company: Hershey, PA, USA, 2008; pp. 318–326. [Google Scholar]
- Pajares, G.; Guijarro, M.; Herrera, P.J.; Ribeiro, A. IET Comput. Vision 2009, in press.. [CrossRef]
- Pajares, G.; Guijarro, M.; Herrera, P.J.; Ribeiro, A. A hopfield neural network for combining classifiers applied to textured images. Neural Networks 2009, in press.. [Google Scholar] [CrossRef]
- Haykin, S. Neural Networks: a comprehensive foundation; Macmillan College Publishing Co.: New York, NY, USA, 1994. [Google Scholar]
- Bezdek, J.C. Pattern Recognition with Fuzzy Objective Function Algorithms; Kluwer-Plenum Press: New York, NY, USA, 1981. [Google Scholar]
- Kirkpatrick, S.; Gelatt, C.D.; Vecchi, M.P. Optimization by simulated annealing. Science 1983, 220, 671–680. [Google Scholar]
- Kirkpatrick, S. Optimization by simulated annealing: quantitative studies. J. Statist. Phys 1984, 34, 975–984. [Google Scholar]
- Hajek, B. Cooling schedules for optimal annealing. Math. Oper. Res 1988, 13, 311–329. [Google Scholar]
- Laarhoven, P.M.J.; Aarts, E.H.L. Simulated Annealing: Theory and Applications; Kluwer Academic: Norwell, MA, USA, 1989. [Google Scholar]
- Asuncion, A.; Newman, D.J. UCI Machine Learning Repository; University of California, School of Information and Computer Science: Irvine, CA, USA; website http://archive.ics.uci.edu/ml/ (accessed September 7, 2009).
- Cabrera, J.B.D. On the impact of fusion strategies on classification errors for large ensambles of classifiers. Patt. Recog 2006, 39, 1963–1978. [Google Scholar]
- Yager, R.R. On ordered weighted averaging aggregation operators in multicriteria decision making. IEEE Trans. Syst. Man Cybern 1988, 18, 183–190. [Google Scholar]
- Tax, D.M.J.; Breukelen, M.; Duin, R.P.W.; Kittler, J. Combining multiple classifiers by averaging or by multiplying? Patt. Recog 2000, 33, 1475–1485. [Google Scholar]
- Littmann, E.; Ritter, H. Adaptive color segmentation -A comparison of neural and statistical methods. IEEE Trans. Neural Networks 1997, 8, 175–185. [Google Scholar]
- Cheng, H.D.; Jiang, X.H.; Sun, Y.; Wang, J. Color image segmentation: advances and prospects. Patt. Recog 2001, 34, 2259–2281. [Google Scholar]


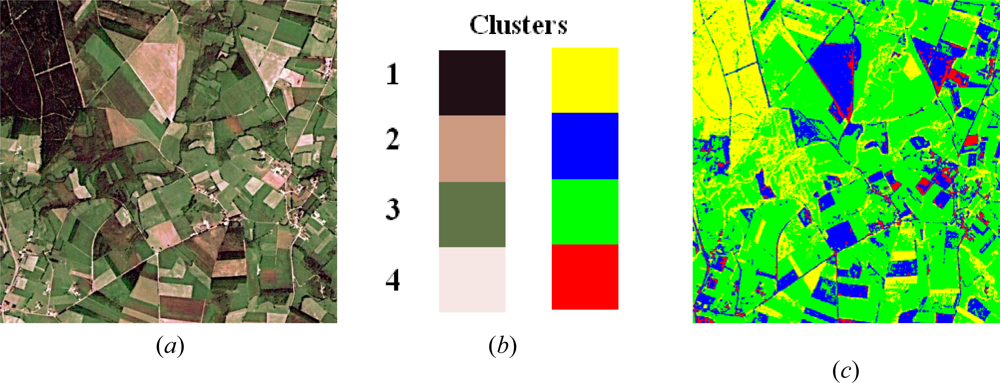
| cluster w1 | cluster w2 | cluster w3 | cluster w4 | |
|---|---|---|---|---|
| Number of patterns | 139,790 | 196,570 | 387,359 | 62,713 |
| BP (mi) | (37.5, 31.3, 21.5) | (167.0,142.6, 108.4) | (93.1, 106.0, 66.4) | (226.7, 191.9, 180.4) |
| FC (vi) | (35.3, 28.8, 19.9) | (168.0,142.8,108.6) | (93.0, 106.4, 66.5) | (229.1, 194.0, 184.4) |
| ẽN: average percentage of error σ̃N: standard deviation of error | STEP 1 | STEP 2 | STEP 3 | ||||||||||
|---|---|---|---|---|---|---|---|---|---|---|---|---|---|
| S0 | S1 | S0 | S2 | S0 | S3 | ||||||||
| ẽ0 | σ̃0 | ẽ1 | σ̃1 | ẽ0 | σ̃0 | ẽ2 | σ̃2 | ẽ0 | σ̃0 | ẽ3 | σ̃3 | ||
| Combination by optimization (DS, HN) and relaxation (FM) | [iterations] DS (Simulated) | [8] 17.1 | 1.1 | [10] 17.8 | 1.2 | [8] 14.8 | 1.0 | [8] 13.8 | 0.8 | [7] 10.5 | 0.7 | [7] 13.5 | 0.7 |
| [iterations] HN (Hopfield) | [9] 20.6 | 1.6 | [10] 21.5 | 1.5 | [9] 18.2 | 1.2 | [8] 17.2 | 1.0 | [7] 14.9 | 0.8 | [8] 17.2 | 0.8 | |
| [iterations] FM(Fuzzy C.) | [16] 21.6 | 1.7 | [18] 21.6 | 1.6 | [14] 19.1 | 1.2 | [15] 19.8 | 1.1 | [11] 16.0 | 0.9 | [12] 18.6 | 0.8 | |
| Fuzzy Combination | FA (Yager) | 25.5 | 2.2 | 26.8 | 2.1 | 24.1 | 1.9 | 24.4 | 1.8 | 21.5 | 1.6 | 20.8 | 1.5 |
| Combination rules | MA (Maximum) | 31.2 | 2.9 | 30.7 | 2.7 | 28.4 | 2.8 | 27.5 | 2.6 | 26.9 | 2.1 | 26.8 | 1.9 |
| MI (Minimum) | 37.1 | 3.1 | 36.9 | 2.9 | 32.2 | 3.3 | 35.2 | 2.8 | 30.9 | 2.4 | 28.5 | 2.3 | |
| ME (Mean) | 29.1 | 2.6 | 28.6 | 2.2 | 25.3 | 2.3 | 26.4 | 2.2 | 25.5 | 1.9 | 24.3 | 1.7 | |
| PR (Product) | 29.5 | 2.7 | 29.1 | 2.3 | 25.8 | 2.4 | 27.0 | 2.4 | 25.2 | 2.1 | 25.1 | 1.8 | |
| Simple classifiers | BP (Bayesian Parametric) | 30.2 | 2.7 | 29.1 | 2.5 | 26.1 | 2.2 | 26.4 | 2.2 | 25.2 | 2.0 | 24.7 | 1.8 |
| FC (Fuzzy clustering) | 32.1 | 2.8 | 30.2 | 2.6 | 27.1 | 2.3 | 27.4 | 2.3 | 26.0 | 2.1 | 25.9 | 2.0 | |
© 2009 by the authors; licensee MDPI, Basel, Switzerland This article is an open access article distributed under the terms and conditions of the Creative Commons Attribution license (http://creativecommons.org/licenses/by/3.0/).
Share and Cite
Guijarro, M.; Pajares, G.; Herrera, P.J. Image-Based Airborne Sensors: A Combined Approach for Spectral Signatures Classification through Deterministic Simulated Annealing. Sensors 2009, 9, 7132-7149. https://doi.org/10.3390/s90907132
Guijarro M, Pajares G, Herrera PJ. Image-Based Airborne Sensors: A Combined Approach for Spectral Signatures Classification through Deterministic Simulated Annealing. Sensors. 2009; 9(9):7132-7149. https://doi.org/10.3390/s90907132
Chicago/Turabian StyleGuijarro, María, Gonzalo Pajares, and P. Javier Herrera. 2009. "Image-Based Airborne Sensors: A Combined Approach for Spectral Signatures Classification through Deterministic Simulated Annealing" Sensors 9, no. 9: 7132-7149. https://doi.org/10.3390/s90907132