Measurement and Evaluation of Finger Tapping Movements Using Log-linearized Gaussian Mixture Networks

Abstract
:1. Introduction
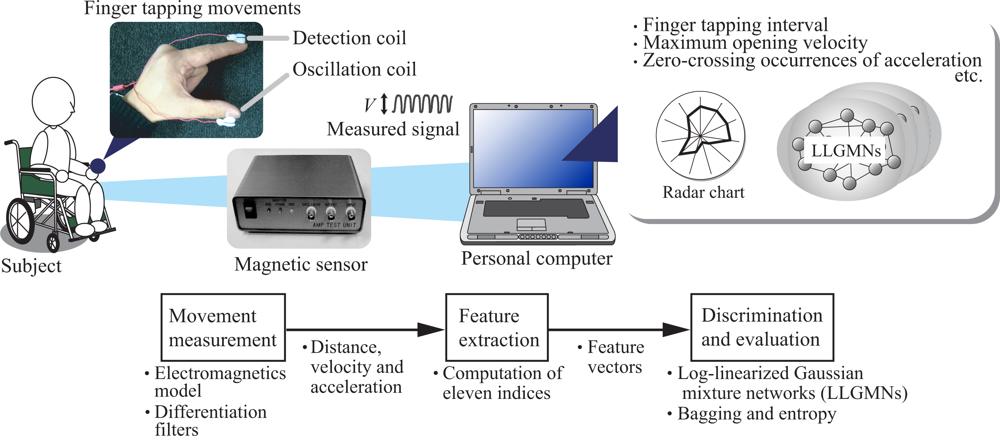
2. Diagnosis support system for finger tapping movements
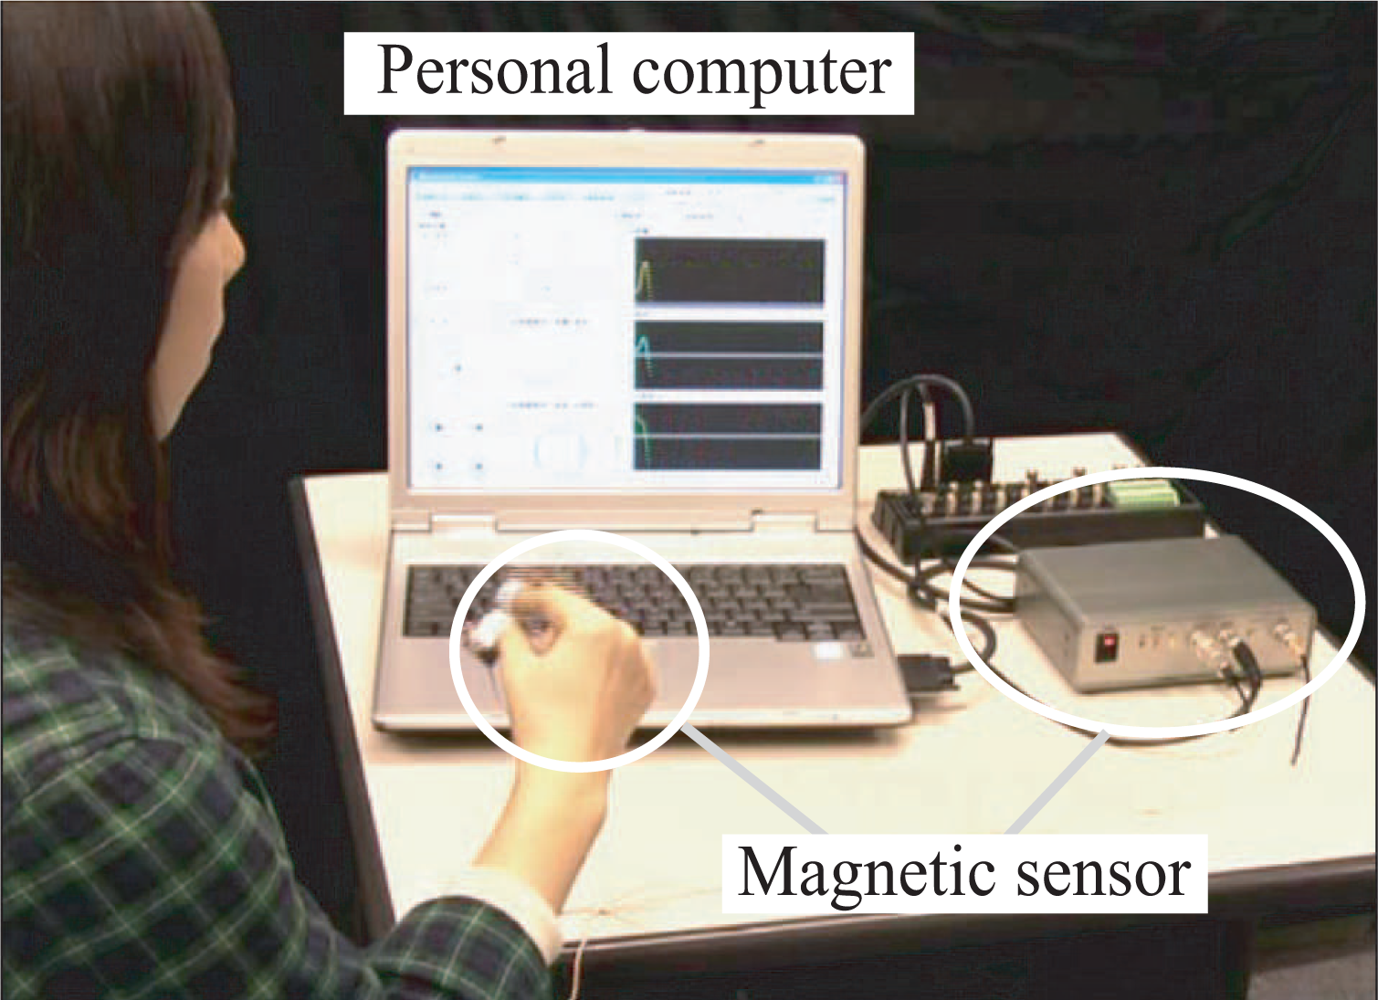
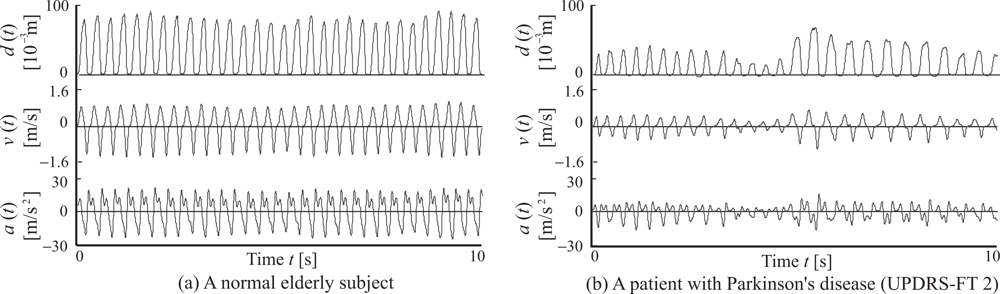
2.1. Movement measurement
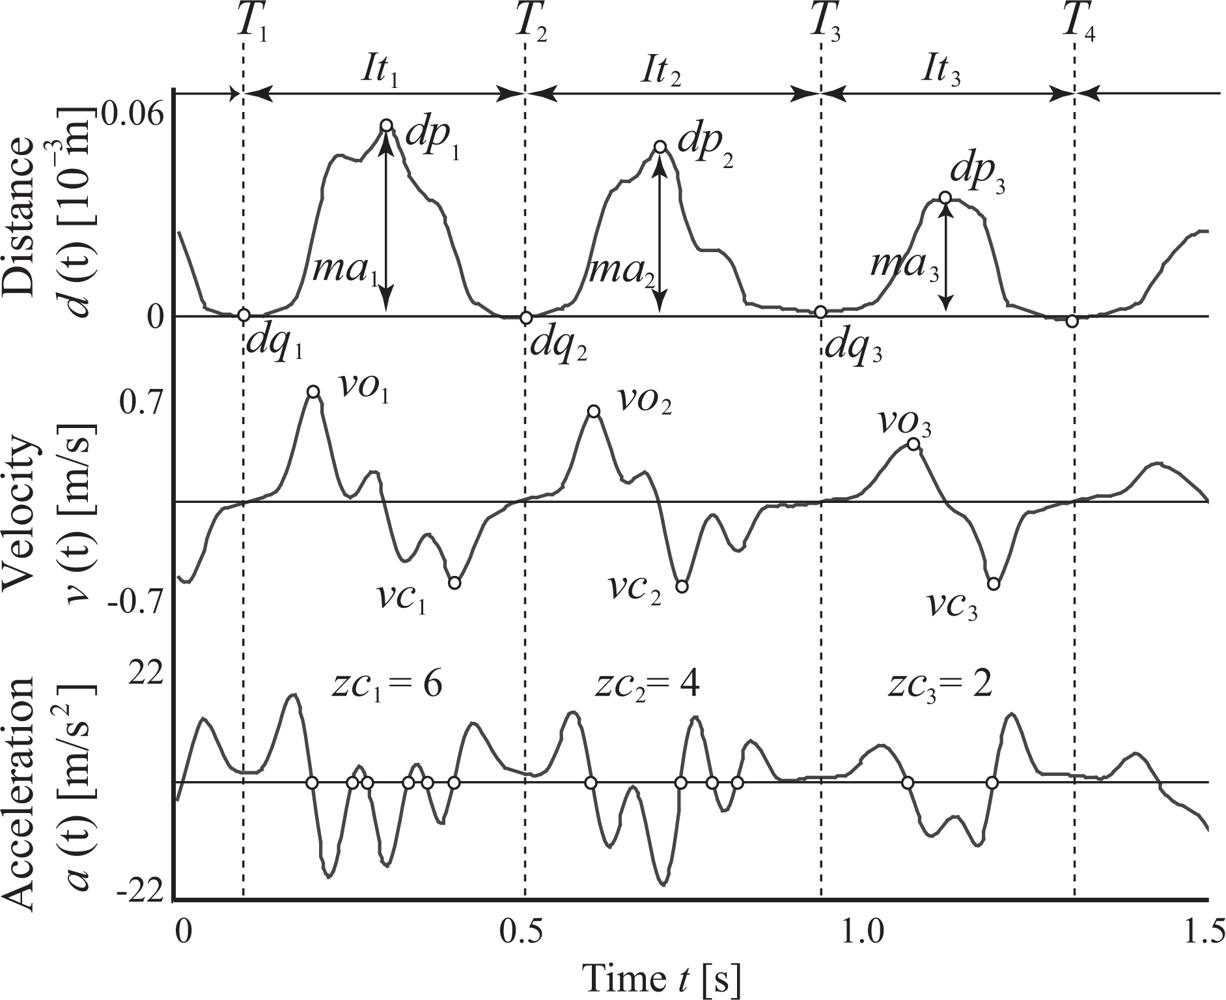
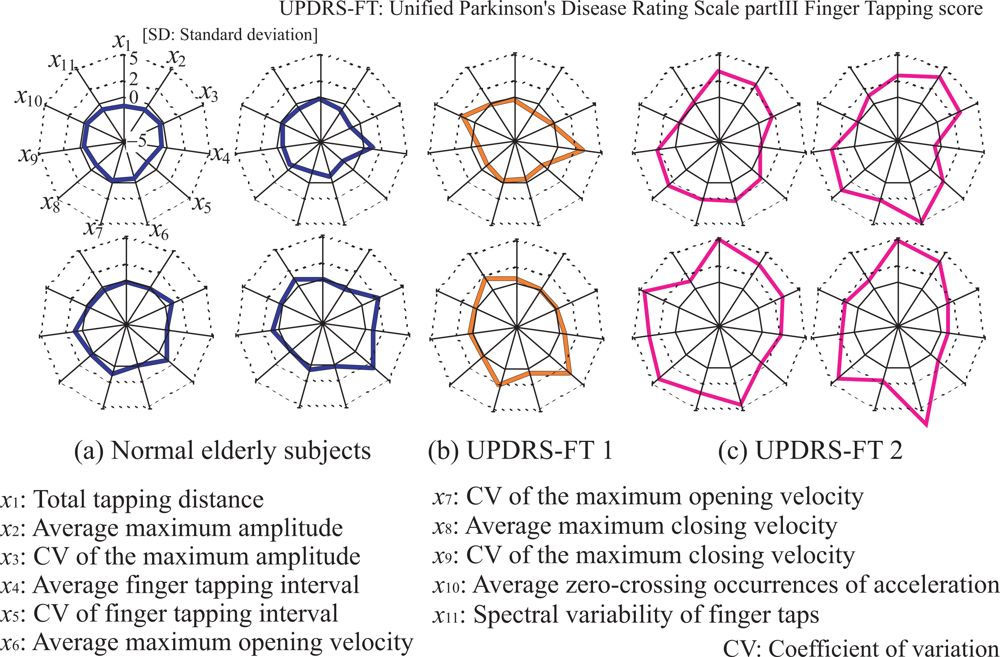
2.2. Feature extraction
- Total tapping distance
- Average maximum amplitude of finger taps
- Coefficient of variation (CV) of maximum amplitude
- Average finger tapping interval
- CV of finger tapping interval
- Average maximum opening velocity
- CV of maximum opening velocity
- Average maximum closing velocity
- CV of maximum closing velocity
- Average zero-crossing number of acceleration
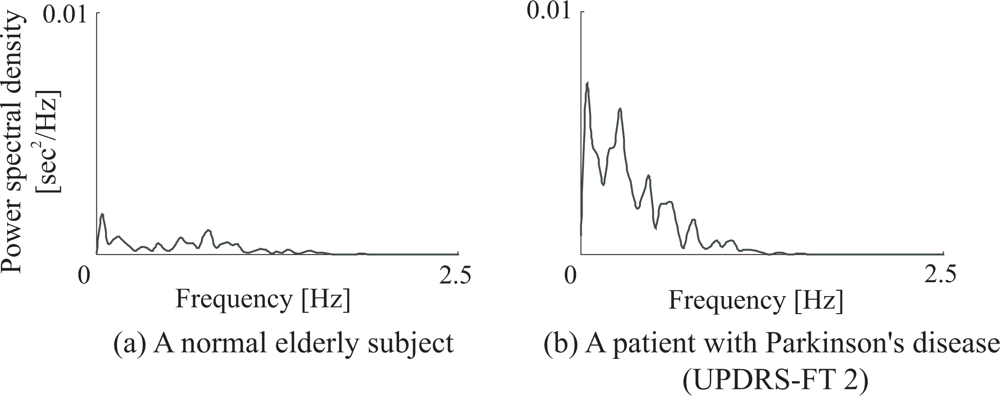
- Spectral variability of finger taps
- (0): Normal;
- (1): Mild slowing and/or reduction in amplitude;
- (2): Moderately impaired. Definite and early fatiguing. May have occasional arrests in movement;
- (3): Severely impaired. Frequent hesitation in initiating movements or arrests in ongoing movement;
- (4): Can barely perform the task.
2.3. Evaluation using probabilistic neural network ensembles
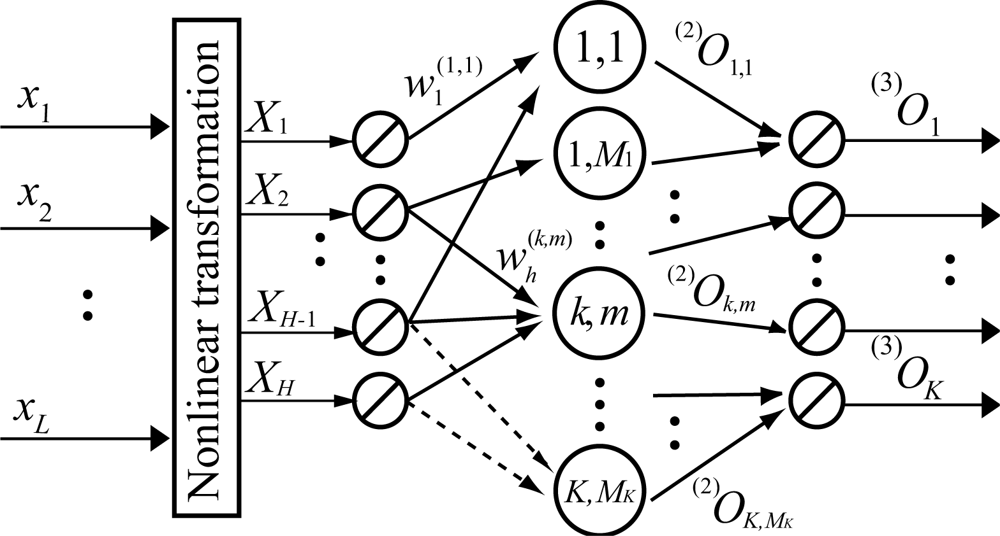
2.3.2. LLGMN [10]
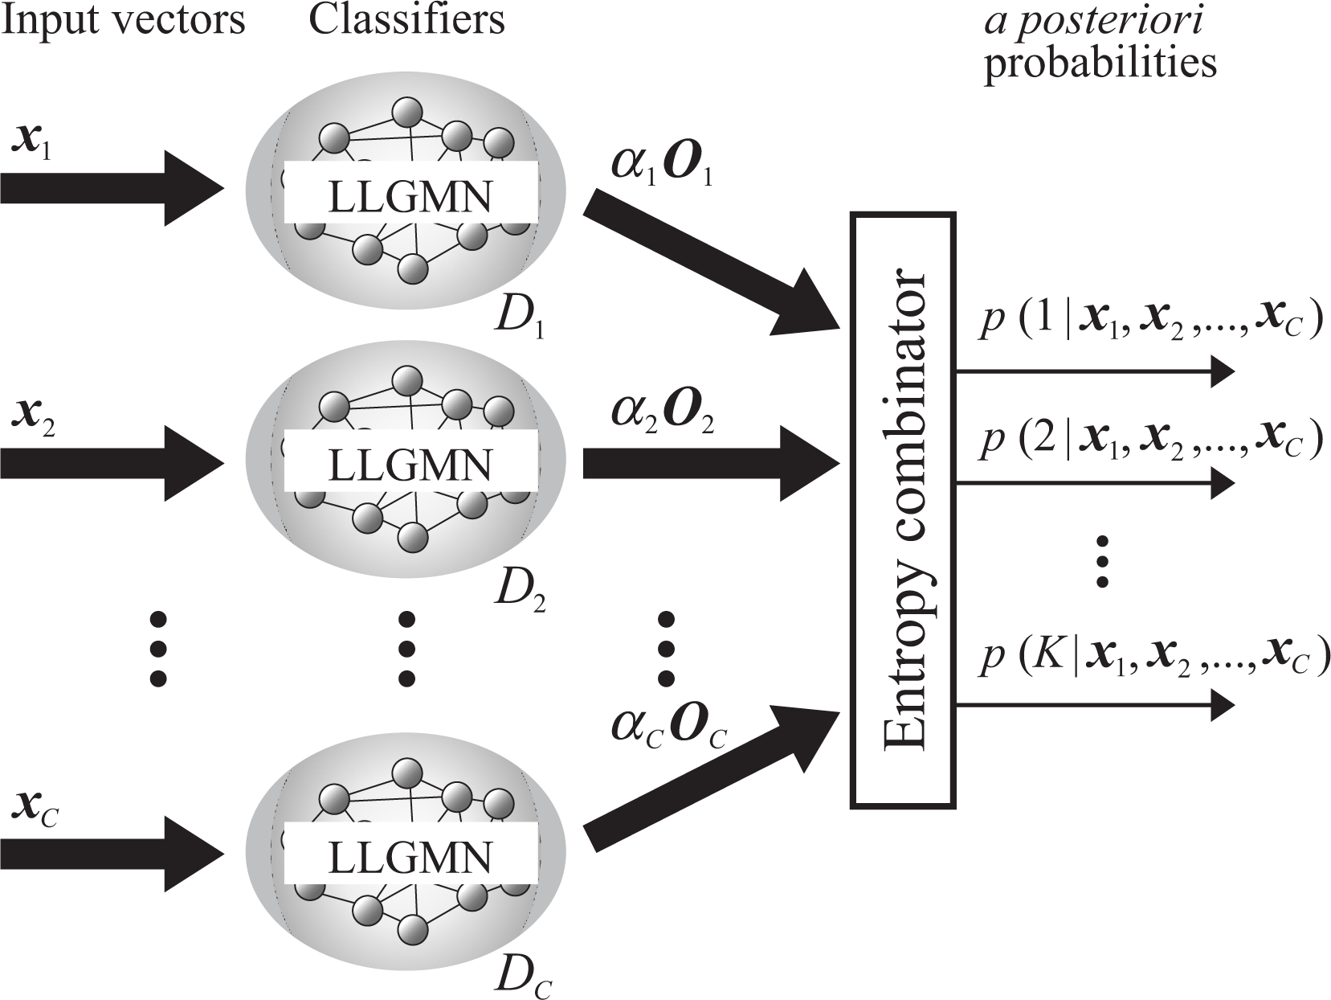
2.3.2. Combination rules of LLGMNs
2.3.2. Evaluation of finger tapping movements
3. Experiments
3.1. Methods
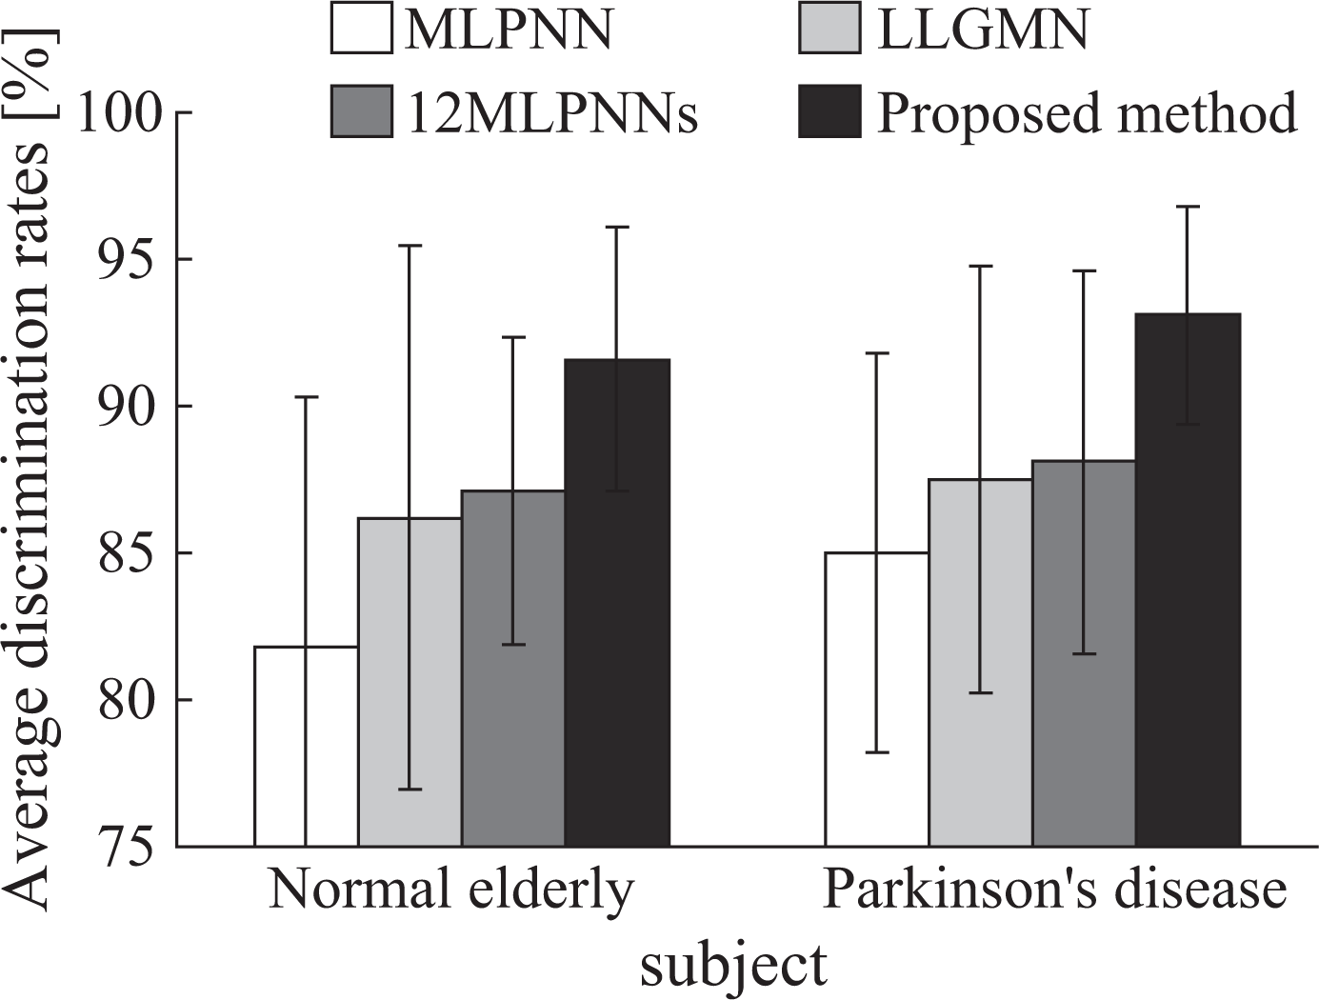
3.2. Results
3.3. Discussion
4. Conclusion
- The proposed system is capable of comprehensibly presenting evaluation results for doctors through visual radar-chart representation of the evaluated results and feature quantities.
- The finger tapping movements of Parkinson’s disease (PD) patients were discriminated with high accuracy (93.1 ± 3.69%), demonstrating that the proposed system is effective in supporting diagnosis using finger movements.
- PD patients’ movements can be discriminated with the proposed method more accurately than with a single probabilistic neural network; this indicates that the proposed system is suitable for use in screening tests for patients with PD.
Acknowledgments
References and Notes
- Alexander, MP. Mild traumatic brain injury: pathophysiology, natural history, and clinical management. Neurology 1995, 45, 1253–1260. [Google Scholar]
- Ghika, J.; Wiegner, A.W.; Fang, J.J.; Davies, L.; Young, R.R.; Growdon, J.H. Portable system for quantifying motor abnormalities in Parkinson’s disease. IEEE Trans. on Biomedical Engineering 1993, 40(3), 276–283. [Google Scholar]
- Ventre-Dominey, J.; Dominey, P.F.; Broussolle, E. Dissociable processing of temporal structure in repetitive eye-hand movements in Parkinson’s disease. Neuropsychologia 2002, 40(8), 1407–1418. [Google Scholar]
- Holmes, G. The symptoms of acute cerebellar injuries due to gunshot injuries. Brain 1917, 40(4), 461–535. [Google Scholar]
- Shimoyama, I.; Hinokuma, K.; Ninchoji, T.; Uemura, K. Microcomputer analysis of finger tapping as a measure of cerebellar dysfunction. Neurol. Med. Chir 1983, 23(6), 437–440. [Google Scholar]
- Konczak, J.; Ackermann, H.; Hertrich, I.; Spieker, S.; Dichgans, J. Control of repetitive lip and finger movements in parkinson’s disease. Mov. Dis 1997, 12(5), 665–676. [Google Scholar]
- Okuno, R.; Yokoe, M.; Akazawa, K.; Abe, K.; Sakoda, S. Finger taps acceleration measurement system for quantitative diagnosis of Parkinson’s disease. Proceedings of the 2006 IEEE International Conference of the Engineering in Medicine and Biology Society, Orland, Florida, USA; 2006; pp. 6623–6626. [Google Scholar]
- Kandori, A.; Yokoe, M.; Sakoda, S.; Abe, K.; Miyashita, T.; Oe, H.; Naritomi, H.; Ogata, K.; Tsukada, K. Quantitative magnetic detection of finger movements in patients with Parkinson’s disease. Neurosci. Res 2004, 49(2), 253–260. [Google Scholar]
- Kittler, J.; Hatef, M.; Duin, R.P.W.; Matas, J. On combining classifiers. IEEE Trans. Pattern Anal. Machine Intell 1998, 20(3), 226–239. [Google Scholar]
- Tsuji, T.; Fukuda, O.; Ichinobe, H.; Kaneko, M. A log-linearized Gaussian mixture network and its application toEEG pattern classification. IEEE Trans. on Systems, Man, and Cybernetics-Part C: Applications and Reviews 1999, 29(1), 60–72. [Google Scholar]
- Breiman, L. Bagging predictors. Mach. Learn 1996, 24, 123–140. [Google Scholar]
- Shima, K.; Tsuji, T.; Kan, E.; Kandori, A.; Yokoe, M.; Sakoda, S. Measurement and evaluation of finger tapping movements using magnetic sensors. Proceedings of the 30th Annual International Conference of the IEEE Engineering in Medicine and Biology Society, 2008; pp. 5628–5631.
- Fahn, S.; Elton, R.L.; Members of The UPDRS Development Committee. Unified Parkinson’s Disease Rating Scale. Macmillan Health Care Information 1987, 2, 153–304. [Google Scholar]
- Shima, K.; Okamoto, M.; Bu, N.; Tsuji, T. Novel human interface for game control using voluntarily generated biological signals. J. Rob. Mech 2006, 18(5), 626–633. [Google Scholar]
- Fukuda, O.; Tsuji, T.; Kaneko, M.; Otsuka, A. A human-assisting manipulator teleoperated by EMG signals and arm motions. IEEE Trans. on Robotics and Automation 2003, 19(2), 210–222. [Google Scholar]


| (a) Single LLGMN | ||||
|---|---|---|---|---|
| Ratio of disc. results
| ||||
| NE | PD | Sus. | ||
| Subject group | NE | 0.719 | 0.125 | 0.156 |
| PD | 0.152 | 0.636 | 0.212 | |
| (b) Proposed method | ||||
|---|---|---|---|---|
| Ratio of disc. results
| ||||
| NE | PD | Sus. | ||
| Subject group | NE | 0.906 | 0.0625 | 0.0313 |
| PD | 0.0303 | 0.909 | 0.0606 | |
© 2009 by the authors; licensee MDPI, Basel, Switzerland This article is an open-access article distributed under the terms and conditions of the Creative Commons Attribution license (http://creativecommons.org/licenses/by/3.0/).
Share and Cite
Shima, K.; Tsuji, T.; Kandori, A.; Yokoe, M.; Sakoda, S. Measurement and Evaluation of Finger Tapping Movements Using Log-linearized Gaussian Mixture Networks. Sensors 2009, 9, 2187-2201. https://doi.org/10.3390/s90302187
Shima K, Tsuji T, Kandori A, Yokoe M, Sakoda S. Measurement and Evaluation of Finger Tapping Movements Using Log-linearized Gaussian Mixture Networks. Sensors. 2009; 9(3):2187-2201. https://doi.org/10.3390/s90302187
Chicago/Turabian StyleShima, Keisuke, Toshio Tsuji, Akihiko Kandori, Masaru Yokoe, and Saburo Sakoda. 2009. "Measurement and Evaluation of Finger Tapping Movements Using Log-linearized Gaussian Mixture Networks" Sensors 9, no. 3: 2187-2201. https://doi.org/10.3390/s90302187