Article

An Updating System for the Gridded Population Database of China Based on Remote Sensing, GIS and Spatial Database Technologies

1
State Key Lab of Resources and Environmental Information System, Institute of Geographical Sciences & Natural Resources Research, Chinese Academy of Sciences (CAS) / Beijing 100101, P.R. China
2
Graduate School of the Chinese Academy of Sciences / Beijing 100049, P.R. China
3
Department of Geography, University of North Texas / 1155 Union Circle #305279, Denton, TX 76203, USA
*
Author to whom correspondence should be addressed.
Sensors 2009, 9(2), 1128-1140; https://doi.org/10.3390/s90201128
Submission received: 18 December 2008 / Revised: 13 February 2009 / Accepted: 17 February 2009 / Published: 20 February 2009
(This article belongs to the Section Remote Sensors)

Abstract

:
The spatial distribution of population is closely related to land use and land cover (LULC) patterns on both regional and global scales. Population can be redistributed onto geo-referenced square grids according to this relation. In the past decades, various approaches to monitoring LULC using remote sensing and Geographic Information Systems (GIS) have been developed, which makes it possible for efficient updating of geo-referenced population data. A Spatial Population Updating System (SPUS) is developed for updating the gridded population database of China based on remote sensing, GIS and spatial database technologies, with a spatial resolution of 1 km by 1 km. The SPUS can process standard Moderate Resolution Imaging Spectroradiometer (MODIS L1B) data integrated with a Pattern Decomposition Method (PDM) and an LULC-Conversion Model to obtain patterns of land use and land cover, and provide input parameters for a Population Spatialization Model (PSM). The PSM embedded in SPUS is used for generating 1 km by 1 km gridded population data in each population distribution region based on natural and socio-economic variables. Validation results from finer township-level census data of Yishui County suggest that the gridded population database produced by the SPUS is reliable.

1. Introduction

Demographic data is one of the most direct indexes of the influence of human activities on the planet Earth. Application areas of demographic information include ecosystem assessment, global environmental changes, public health, and regional sustainable development studies [1-7]. Traditionally, census datasets of administrative or statistical reporting units could not meet the needs of these applications because of (1) the low spatial resolution of the datasets, and (2) the long time interval between census years. A new concept of “population spatialization” was presented in a workshop on Global Demography in 1994 for redistributing population onto geo-referenced grids instead of political or administrative units [8-9]. Since Tobler et al. released the first version of Gridded Population of the World (GPW) in 1995 [8], great progress has been made by many scientists and organizations in creating population databases. One example is the Gridded Population of the World (GPW) developed by the Center for International Earth Science Network (CIESIN) at Columbia University to depict the distribution of human population across the globe [10-14]. The latest developments were Gridded Population of the World, version 3 (GPWv3) and the Global Rural-Urban Mapping Project (GRUMP). GRUMP builds on GPWv3 by incorporating urban and rural information, allowing new insights into urban population distribution and the global extents of human settlements [15]. Another example is the LandScan Global Population Dataset developed by the Oak Ridge National Laboratory (ORNL) as a worldwide population database for ambient population at 30″ by 30″ resolution [16, 17]. Census counts (at sub-national level) were apportioned to each grid cell based on likelihood coefficients, which are based on proximity to roads, slopes, land cover types, nighttime lights, and other information.
In 2002, the Data Center for Resources and Environmental Sciences (RESDC) of the Chinese Academy of Sciences (CAS) developed the China Gridded Population Datasets of 1995 and 2000 for residential population with a spatial resolution of 1 km by 1 km [18]. By the end of the year 2006, the China Gridded Population Datasets of 2005 was also produced by RESDC. This paper focuses on the development of the Spatial Population Updating System (SPUS) for automated updating of annual gridded population databases based on LULC data derived from the Moderate Resolution Imaging Spectroradiometer (MODIS) images acquired by NASA's Earth Observing System (L1B data of bands 1-7 with 500 m spatial resolution). Validation results and future directions of improvement are also discussed.

2. Data and Methodology

2.1. Data Sources

The data of the research include the Chinese census data, land use data and ancillary data listed in Table 1. According to the differences in data sources and data types, the criterion and precision also vary. Data preprocessing has been conducted for all data layers, including satellite image correction, projection transformation, and attribution data standardization.

2.2. Methodology for Land-use/Land-cover (LULC) Data Updating

The Chinese land use types were used as primary indices in the spatial population model of this paper. The Pattern Decomposition Method (PDM) is applied to MODIS data to obtain the land use/land cover patterns. The vegetation, water and soil coefficients are extracted by PDM for each MODIS image pixel to create a LULC-Conversion Model (LULC-CM). The MODIS images are classified into different land use types based on the relationship between the spectral coefficients and the land-use structure. To eliminate the noise effects to MODIS bands, e.g. cloud effects, we merged the clearest images between July and September which corresponds to the period when vegetation flourished. Thus it was easier to classify the land cover of built-ups and bare soil areas caused by crop harvesting, which is sufficient for modeling spatial distribution of population in annual increments.

(1) Pattern Decomposition Method (PDM)

Spectral response patterns for each pixel of an image can be decomposed into three components using three standard spectral shape patterns determined from the image data [19, 20]. Zhang has used the PDM to detect land cover in Miyun District in Beijing of China, and found that there are good correlations between the bands of VIS and LULC type and area [21]. The LULC information can be represented by three standard spectral patterns: vegetation, water and soil, transferred from the 7 VIS bands of MODIS data.
First of all, standard spectrum patterns are extracted from the MODIS L1B data. Surface albedos of the MODIS L1B data within the specified experimental area are normalized to avoid the disturbance of absolute spectrum values. The normalization albedo can be calculated using:
B i = ( A i j = 1 7 A j ) .
where Bi is the normalized albedo value of band i; Ai is the original surface albedo value of band i; Aj is the original surface albedo value of band j; and j is the index of image bands. After choosing the sample pixels of pure water, soil and vegetation in the test area, a 3 × 7 matrix P is obtained by averaging the Bi values of the 7 bands. The Bi values represent the spectrum pattern of water, vegetation and soil in MODIS band 1 to 7. Taking Shandong Province as an example, the standard spectrum patterns are shown in Table 2.
Secondly, pixel spectrum decomposition is conducted based on the standard spectrum patterns. The albedo of each pixel is expressed as a linear combination of the reflectance of each LULC unit:
A i = C w P iw + C v P iv + C s P is + R
where Ai is the surface albedo of the pixel at band i; Piw, Piv, and Pis are the standard spectrum patterns of water, vegetation and soil; and Cw, Cv, and Cs represent decomposition coefficients (positive numbers). According to the PDM principle, proportions of the three types of land use in each pixel can be obtained using:
r k = C k S k / ( C w S w + C v S v + C s S s ) , k = w , v , s .
where rw, rv, and rs represent the three matrices for water, vegetation and soil proportions in a pixel of 500 m × 500 m.

(2) LULC-Conversion Model (LULC-CM)

The results obtained from Equation (3) cannot be converted to land use types directly. However, the combination of rw, rv, and rs can be associated with land use types. This paper uses the decomposition results and LULC-CM to derive land use types. The LULC-CM is created using the following equation:
C 1 X 1 = Y Y = [ C 2 C 3 ] [ r w r v r s 1 ] .
where C1, C2, C3, X1, and Y are matrices, and X1 = [x1, x2, x3, x4, x5, x6], representing different percentages of cropland, forest, grassland, urban residential, rural residential, and water area in each pixel; C1, C2, and C3 are modulus of the model and the constant part; rw, rv, rs are obtained from Equation (3).

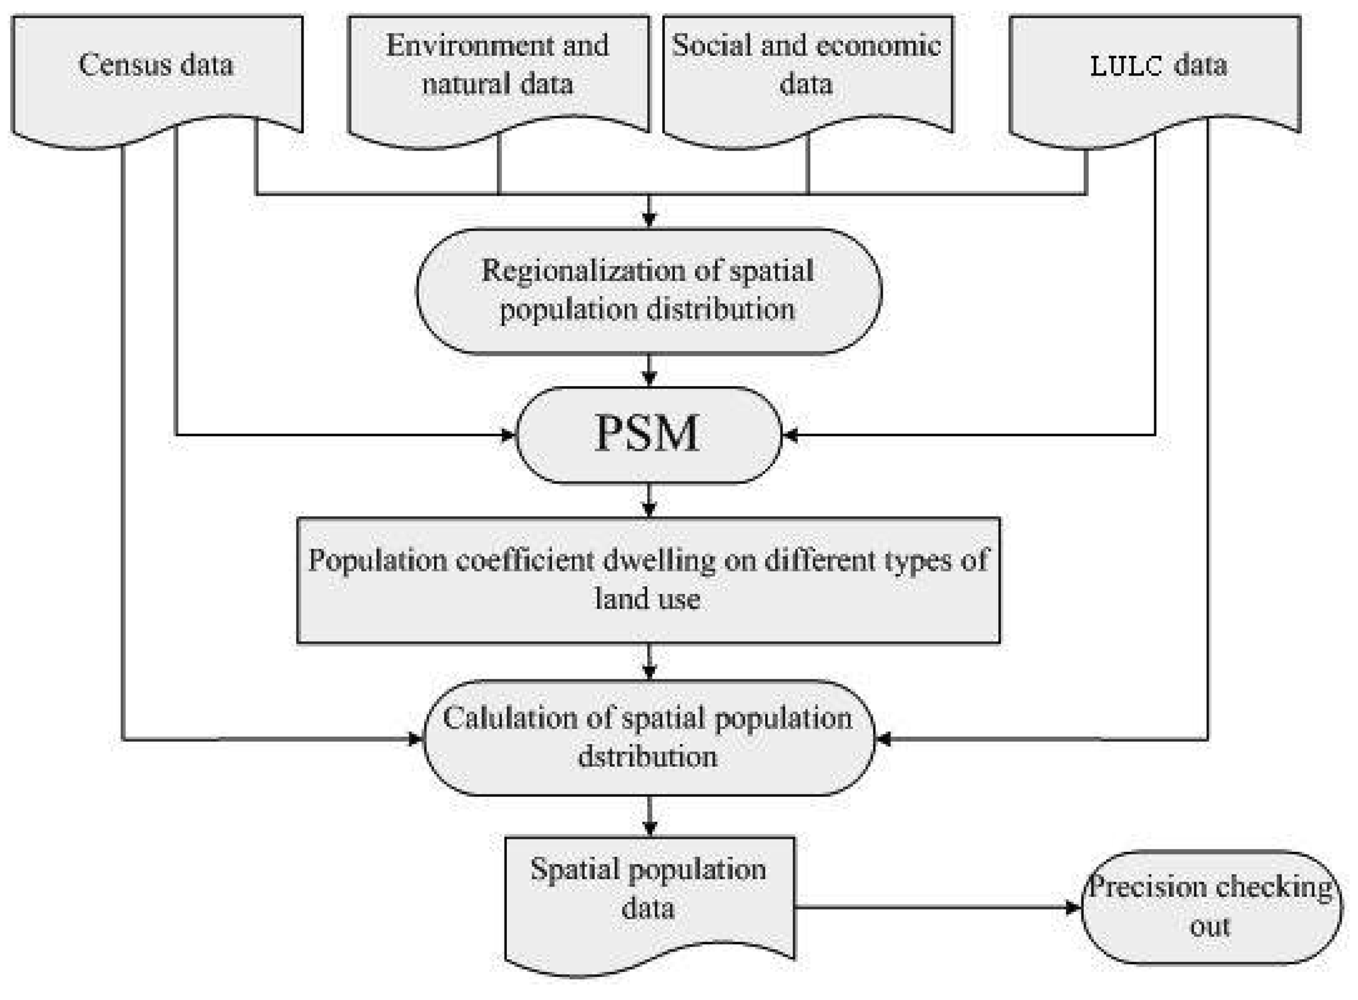
2.3. Method of Population Spatialization

This paper adopts the method of population spatialization model based on the relationship between demographical data and land use types, and redistributes population onto 1 km by 1 km grids [18]. The Data Center for Resources and Environmental Sciences of the Chinese Academy of Sciences (RESDC, CAS) has applied this method to build the 2000 gridded population database of China. The general steps for redistributing population are shown in Figure 1.

(1) Regionalization of Spatial Population Distribution

China is a large country with different population density and land use patterns from the west to the east. According the Fifth Census of China in 2000, the average population densities of the eastern, central, and western China are 452.3, 262.2 and 51.4 (persons/km2), respectively. To obtain more reliable results, we constructed a three-dimensional feature space based on the provincial population density core and regionalization index to divide the whole country into 8 regions using the minimum distance rule [21]. A population model was established for each region using the following steps: 1) Calculation of spatial population characteristic index. Based on population density, economic development, land use structure, transportation network, and river density at county level, Equation 5 is used to calculate the spatial population characteristic index of the model.
I p = ( P + GDP ) / S / ( 1 I c ) / ( 1 I rd ) / ( 1 I rl ) / ( i I r )
where Ip is the spatial population characteristic index; P is the total population; GDP is the gross domestic product; S is the total land area; Ic is the index of cultivation density ; Ird is the road density; Irl is the railway density; and Ir is the residential density. 2) Determining the center of provincial population distribution. Based on the characteristics of a provincial population distribution index (z) and the spatial distribution of population centers (x, y), a three-dimensional space to calculate inter-provincial population distribution distance (d) is constructed, and the minimum distance method is used to divide the first level into eight population regions. 3) Secondary population regions are divided by county-level terrain parameters and population density. Due to the limitations of space, the details can be found in our previous research [18].

(2) Population Spatialization Model (PSM)

Quite a few types of methods for distributing census data have been proposed in recent years. The LandScan Global Population Dataset was produced according to a linear relationship between census counts (at sub-national level) and distribution of roads, slope, land cover, nighttime lights [16, 17]. Mennis and Hultgren presented an “intelligent” dasymetric mapping technique (IDM), which used the ratio of class densities to redistribute population to sub-source zone areas [23].
A population spatialization model is built to redistribute population of a county into different types of land uses:
P i = j = 1 n f a j x fj + B i
where Pi stands for the total population of the i-th county, aj is the population density of the j-th land use type, xfj is the total area of the j-th land use type in f-th section (km2), and nf is the number of land use types in the current section. According to the rule of “no residential area, no population”, the intercept Bi is set to zero.
To ensure that predicted population equals to the census statistical results within each administrative unit, the population density of each land use type should be adjusted by the ratio of the predicted population (Pi) and the census count (Pi0). The initial coefficient aj of the adjustment is defined as:
a ij = P i 0 P i × a j
where aij is the modified population density for the j-th land use type within the i-th administrative unit; Pi and Pi0 are the predicted population and census count of the i-th administrative unit respectively.
After the above-mentioned steps, population can be estimated from cell to cell. To create spatialized population data of China, the population of each cell is calculated by linking population density coefficient aij to land use grid using the following equation:
P i = j = 1 n a ij x j .

3. SPUS System Design and Development

SPUS is a software system combining PDM, LULC-CM, and PSM. Functionalities of SPUS include generation, analysis, visualization, and management of gridded population databases. The system is developed in Microsoft Windows environment and is easy to use. The input to the system includes census data, remotely sensed (such as MODIS) data, and other ancillary data.

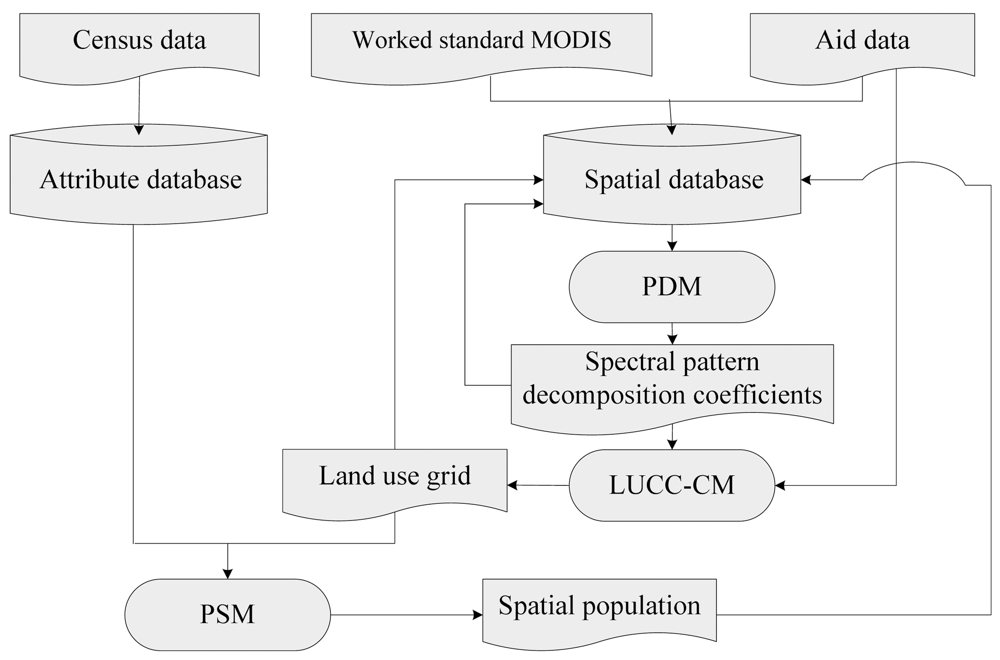
3.1. Flowchart for Data Processing

Figure 2 shows the data processing flowchart of SPUS. The input data includes statistical population data at county level, MODIS/Terra Surface Reflectance 8-Day L3 Global 500 m SIN Grid, and ancillary data such as administrative boundary maps. All data layers are stored in the attribute and spatial databases.
As an example of input data layers for SPUS, Figure 3 shows the land use data of Shandong Province in 2002.

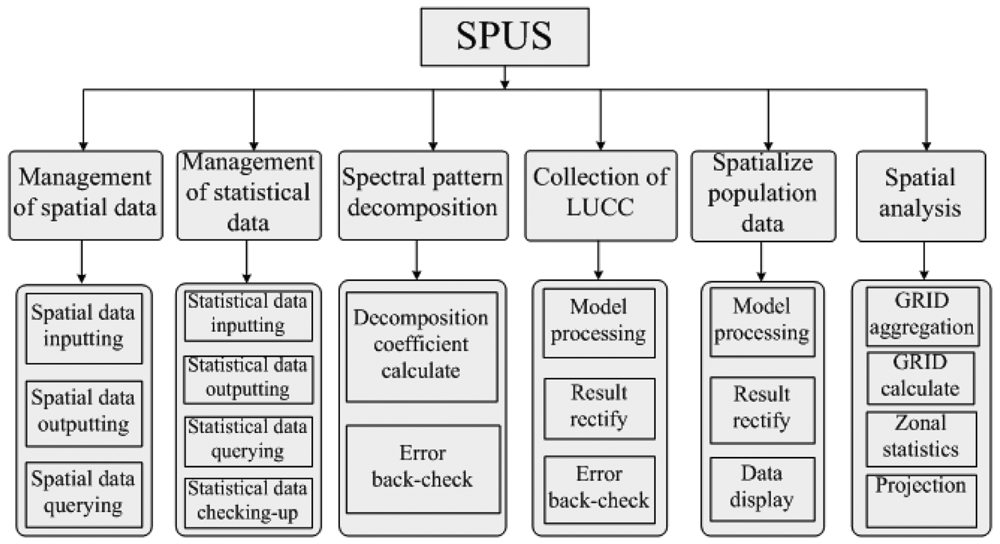
3.2. System Function Development

Figure 4 shows the schematic representation of system function modules.

(1) Management Module of Spatial Data

The module is a spatial database tool that manages all spatial data based on ArcSDE. It can be used to import, export and query spatial data (including raster and vector databases).

(2) Management Module of Statistical Data

The module manages all kinds of statistical data including population, socio-economic data and ancillary attribution data using Oracle 9i. The functions include data input, storage, output with common formats such as Excel, XML, MDB, DBF, data checking, quality control, and data querying.

(3) Spectral Pattern Decomposition Module

The module executes the PDM to conduct processing of standard MODIS data to generate ASCII files of coefficients using IDL in the .Net environment. ArcEngine is used to convert ASCII files to GRID format. The module is a mixture of .Net, IDL and ArcEngine.

(4) LULC-CM Module

This is a functional module that executes LULC-CM. The module includes three steps: 1) Train the sample areas selected according to the regionalization to get the modulus which can be considered repository of SPUS as the basic information of LULC. 2) Apply the LULC-CM to convert the result of PDM to six different land use types defined as cropland, forest, grassland, city, rural residential area and water in a pixel of 500 by 500 meters. 3) Check and import LULC data into the spatial database. Considering the advantage of IDL in scientific computation, LULC-CM was developed by IDL. The IDL program generates ASCII files with the percentages of six LULC types in each pixel, and then uses ArcEngine to create LULC grids for spatial analysis.

(5) Population Data Spatialization Module

The module is the core of SPUS. It executes the PSM to redistribute the statistical population data on grids by combining the LULC grid, province vector data, county vector data and other ancillary data. It is a GIS system developed with ArcEngine consisting of three major functions.
  • Data display. The main interface that can add and display spatial data and provide functions of querying, panning, zooming in, zooming out, selecting and saving.
  • Model processing. To create spatial population grids based on PSM.
  • Results verification. To adjust the primary results according to total population control within county level units to generate the final result of gridded spatial population dataset.

(6) Spatial Analysis Module
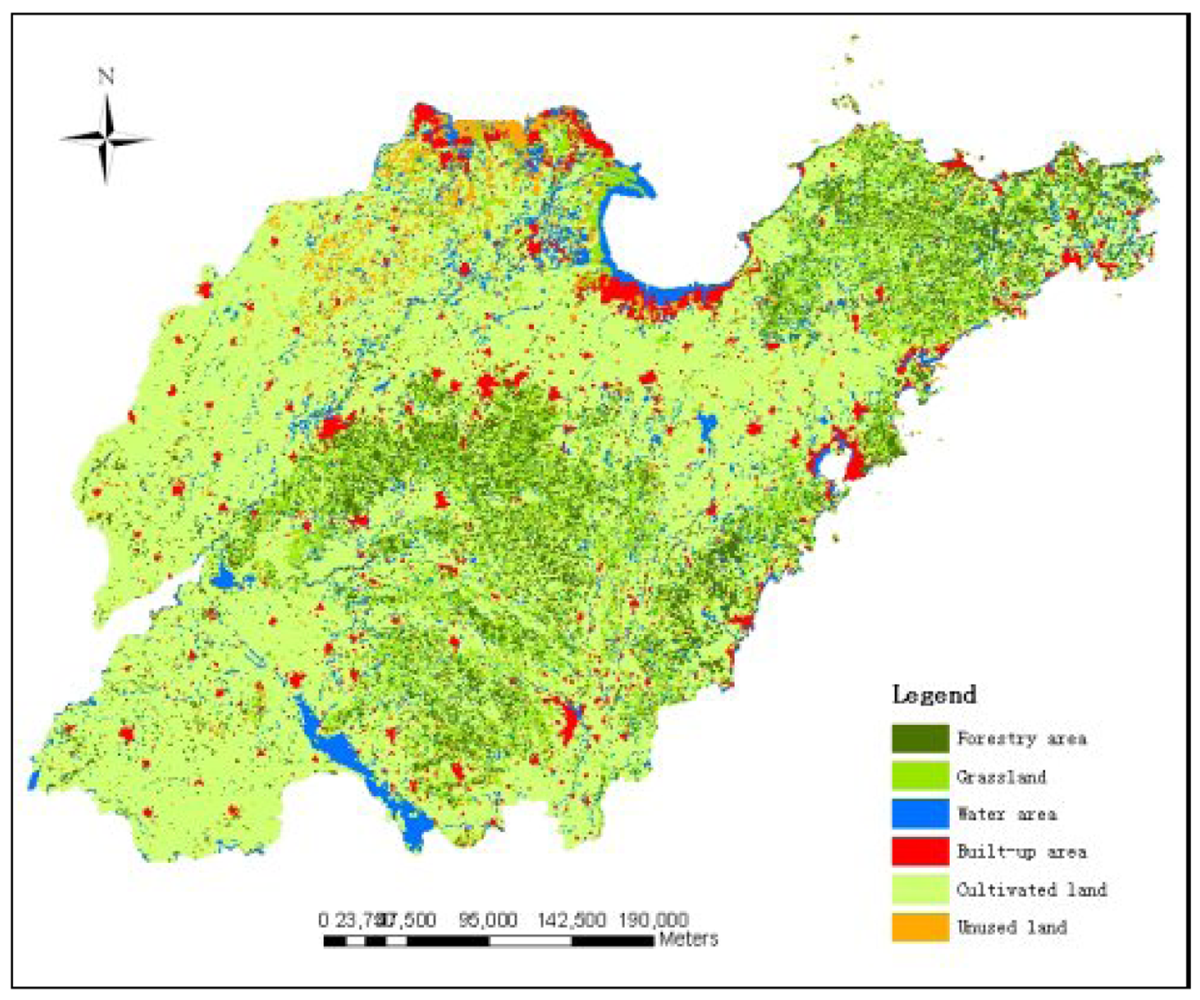
SPUS provides some common functions of GIS spatial analysis such as grid calculation, projection transformation, aggregation, buffering, overlaying (union, intersect, erase), zonal and neighborhood analysis. Users can combine these functions easily to obtain new spatial indices such as regional total population, population growth rate, and degree of population aggregation.

4. Results

The most important functionality of the SPUS system is to update gridded population data. Figure 5 shows the gridded population data of Shandong Province of China in 2002 based on MODIS data. The spatial resolution of grid is 500 m by 500 m, and the maximum value of population in 0.25 sq km grid in Shandong Province is 3,094 persons. There are some high-value areas on the image within county-level administrative units showing the urban areas with higher population density.
Verification of redistributed China population data is time-consuming mainly because of the difficulty in establishing a suitable reference database for comparison purposes. It is difficult to get actual census counts for 1 km × 1 km grids. However, census data of sub-county units, which is township level in China, could be obtained in some provinces. A substitute approach has been designed for verification based on these population data. The following steps were carried out for towns with census data: (1) Create vector boundary maps of towns with census data; (2) Overlay gridded population data with boundary maps; (3) Accumulate population of all cells within these towns; and (4) Compare population estimations with census data. We have collected census data of 19 towns in Yishui County, Shandong Province. Verifications have been conducted using 2002 statistical data.
Table 2 shows that the relative errors between predicted population and actual census counts vary from 0.51% to 25.63%, with eight towns lower than 10%, eight higher than 20%, and the remaining three between 10%-20%. The accuracies are acceptable for many applications at the county, province, or national levels.

5. Conclusions

This paper describes the design and implementation of the Spatial Population Updating System (SPUS) integrating GIS, remote sensing, spatial database, and statistical methods. The system combines several modules seamlessly for efficient generation, analysis, visualization, and management of spatial population datasets. Preliminary verification of 2002 gridded population datasets using township level census data suggests that the gridded population datasets can be used for many applications at a regional or national scale. Accuracies of gridded population data derived from currently available global remote sensing data are inadequate for modeling population distribution and detecting changes in the spatial distribution of population on annual increments. Further research in two major directions may be important. The first is to improve model accuracy with more factors related to the spatial distribution of population (especially in urban areas), and validate population models with more accurate census counts at finer resolutions. The other is to extend the SPUS functions for more real applications, such as adding new population indices to help users build spatial population databases.

Acknowledgments

This research was funded by the Ministry of Science and Technology of China (Grant 2006AA120105) and partly by the National Science Foundation of China (40471112). The authors would like to thank Prof. Wang Naibin, Prof. Xiong Liya and Ms. Lei Ying for their help in this research. Thanks are due to the Data Center for Resources and Environmental Sciences (RESDC) of the Chinese Academy of Sciences (CAS), the State Bureau of Statistics of China, and the State Bureau of Surveying and Mapping of China for providing relevant research data. The authors would also like to thank three anonymous reviewers for their helpful comments and suggestions.

References

  1. Goldewijk, K.K. Three centuries of global population growth: A spatial referenced population (density) database for 1700–2000. Popul. Environ. 2005, 26, 343–367. [Google Scholar]
  2. Hales, S.; de Wet, N.; Maindonald, J.; Woodward, A. Potential effect of population and climate changes on global distribution of dengue fever: An empirical model. Lancet 2002, 360, 830–834. [Google Scholar]
  3. Hay, S.I.; Guerra, C.A.; Tatem, A.J.; Noor, A.M.; Snow, R.W. The global distribution and population at risk of malaria: Past, present, and future. Lancet Infect. Dis. 2004, 4, 327–336. [Google Scholar]
  4. Lutz, W. The future population of the world. What can we assume today? Revised and Updated Edition; Earthscan Publications: London, 1996. [Google Scholar]
  5. Small, C.; Gornitz, V.; Cohen, J.E. Coastal hazards and the global distribution of human population. Environ. Geosci. 2000, 7, 3–12. [Google Scholar]
  6. Sutton, P. Modeling population density with nighttime satellite imagery and GIS. Compu. Environ. Urban Syst. 2007, 21, 227–244. [Google Scholar]
  7. Caruthers, A.W. Mapping the population census of Scotland. Cartogr. J. 1985, 22, 83–87. [Google Scholar]
  8. Tobler, W.; Deichmann, U.; Gottsegen, J.; Maloy, K. The global demography project. In Technical Report TR-95-6; National Center for Geographic Information and Analysis, Department of Geography,University of California: Santa Barabara, 1995. [Google Scholar]
  9. Tobler, W.; Deichmann, U.; Gottsegen, J.; Maloy, K. World population in a grid of spherical quadrilaterals. Int. J. Popul. Geogr. 1997, 3, 203–225. [Google Scholar]
  10. Balk, D.; Brickman, M.; Anderson, B.; Pozzi, F.; Yetman, G. Estimates of future global population distribution to 2015. CIESIN, Columbia University: Palisades, NY, 2005. Available online: http://sedac.ciesin.columbia.edu/gpw/documentation.jsp#.
  11. Balk, D.; Pozzi, F.; Yetman, G.; Deichmann, U.; Nelson, A. The distribution of people and the dimension of place: Methodologies to improve the global estimation of urban extents. Draft version. Palisades, Columbia University: New York, NY, CIESIN, 2004. Available online: http://beta.sedac.ciesin.columbia.edu/gpw/documentation.jsp.
  12. Balk, D.; Yetman, G. The global distribution of population: Evaluating the gains in resolution refinement, documentation for GPW v3. Palisades, Columbia University: NY, CIESIN, 2004. Available online: http://beta.sedac.ciesin.columbia.edu/gpw/documentation.jsp.
  13. CIESIN (Center for International Earth Science Information Network), Columbia University; Centro Internacional de Agricultura Tropical (CIAT). Gridded population of the world version 3 (GPWv3): Population grids. Socioeconomic Data and Applications Center (SEDAC), Columbia University: Palisades, NY, 2005. Available online: http://sedac.ciesin.columbia.edu/gpw.
  14. Salvatore, M.; Pozzi, F.; Ataman, E.; Huddleston, B.; Bloise, M. Mapping global urban and rural population distributions; FAO: Rome, 2005. [Google Scholar]
  15. Balk, D.L.; Deichmann, U.; Yetman, G.; Pozzi, F.; Hay, S.I. Determining global population distribution: methods, applications and data. Adv. Parasit. 2006, 62, 119–156. [Google Scholar]
  16. Dobson, J.E.; Bright, E.A.; Coleman, P.R.; Durfee, R.C.; Worley, B.A. LandScan: A global population database for estimating populations at risk. Photogramm. Eng. Rem. Sens. 2000, 66, 849–857. [Google Scholar]
  17. Bhaduri, B.; Bright, E.; Coleman, P.; Dobson, J. LandScan: Locating people is what matters. Geoinformatics 2002, 5, 34–37. [Google Scholar]
  18. Yang, X.; Jiang, D.; Wang, N.; Liu, H. Method of Pixelizing Population Data. J. Geogr. Sci. 2002, 57 Supp, 70–75. [Google Scholar]
  19. Yang, X.; Wang, N.; Jiang, D.; Xiong, L.; Liu, H. Regionalization of population distribution based on spatial analysis. J. Geogr. Sci. 2002, 57 Supp, 76–81. [Google Scholar]
  20. Muramatsu, K.; Furumi, A.; Fujiwara, N. Pattern decomposition method in the albedo space for Landsat TM and MSS data analysis. Int. J. Remote Sens. 2000, 21, 99–119. [Google Scholar]
  21. Zhang, X.; Yang, X. Spectral pattern extract and related analysis based on Landsat 7 ETM+ images – Taking land cover in Miyun district of Beijing as a case. Geo. Inf. Sci. 2005, 7, 107–110. [Google Scholar]
  22. Hu, H. On population distribution of China; China Science Press: Beijing, China, 1983; p. 518. (in Chinese) [Google Scholar]
  23. Mennis, J.; Hultgren, T. Intelligent dasymetric mapping and its application to areal interpolation. Cartogr. Geogr. Inf. Sci. 2006, 33, 179–194. [Google Scholar]
Figure 1. Flowchart for producing Gridded Population Dataset of China.
Sensors 09 01128f1
Figure 2. Data process flow of SPUS.
Sensors 09 01128f2
Figure 3. Land use data of Shandong Province, 2002.
Sensors 09 01128f3
Figure 4. Framework of function modules.
Sensors 09 01128f4
Figure 5. 500 m by 500 m gridded population data of Shandong Peninsula in 2002.
Sensors 09 01128f5
Table 1. List of the Data Sources.
Data typeTimeData sourcesScale or resolution
Census data1995∼2002State Bureau of Statistics of ChinaCounty level
MODIS L1B2002EOS website500 m
Statistical social and economic data2000Chinese Statistic YearbooksCounty level
Land use2000Resources and Environmental Scientific Data Center (RESDC), Chinese Academy of Sciences (CAS)1: 100,000
DEM data2000State Bureau of Surveying and Mapping of China1: 250,000
Boundary of counties2000RESDC1: 100,000
Residential map2000State Bureau of Surveying and Mapping of China1: 250,000
Statistic population of Yishui County, Shandong Province2002Statistic Yearbook of Yishui CountyTownship level
Table 2. Standard spectrum patterns in Shandong Province.
Band1Band2Band3Band4Band5Band6Band7
Water pattern Pw0.305890.237650.172090.114740.076470.057310.03585
Vegetation pattern Pv0.089830.083720.067110.245930.248800.172510.09210
Soil pattern Ps0.091820.089180.097330.178800.205280.191810.14579
Table 2. Results validation with census data of 19 sample towns in Yishui County
No.Town namePopulation (statistical)Population (gridded)ErrorRelative error (%)
1Quan Li37,25646,8059,55025.63
2Sha Gou68,56683,01814,45121.08
3Ma Zhan67,45654,435-13,021-19.30
4Fu Guanzhuang46,08557,41011,32524.57
5Yang Zhuang63,40861,389-2,019-3.18
6Zhe Ge75,32590,97515,65020.78
7Gao Qiao60,14646,109-14,037-23.34
8Quan Zhuang34,29334,118-175-0.51
9Yi Shui175,136152,313-22,823-13.03
10Dao Tuo36,83136,831-2,529-6.43
11Gao Zhuang51,50750,914-593-1.15
12Long Jiaquan61,23147,691-13,540-22.11
13Chui Jiayu33,38039,1015,72117.14
14Huang Shanpu50,25237,842-12,410-24.70
15Xu Jiahu81,43176,713-4,718-5.79
16Yuan Dongtou29,19136,1856,99423.96
17Si Shilipu66,31261,245-5,067-7.64
18Yao Dianzi44,76640,533-4,233-3.52
19Xia Wei54,89852,967-1,931-2.93

