Error in Radar-Derived Soil Moisture due to Roughness Parameterization: An Analysis Based on Synthetical Surface Profiles

 , and
, and
Abstract
:1. Introduction
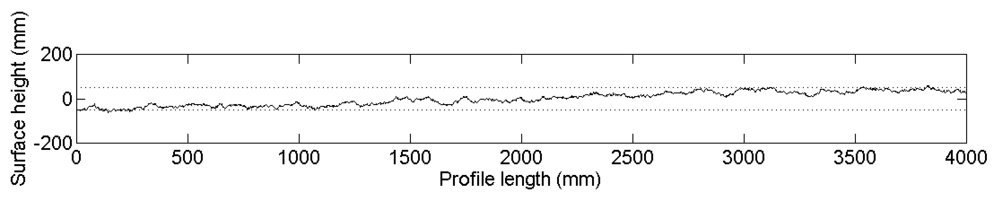
- A series of surface height points (roughness profile) is defined along a 1-dimensional surface transect, mostly sampled by means of meshboard, pin profilometer or laser techniques [6]. Generally, profiles used in practice have a length between 1 m and 4 m [6–9], and the horizontal spacing between height points usually lies between 1 mm [5] and 2 cm [7].
- From this profile a linear trend is removed to compensate for the possibility that the measurement device was not aligned perfectly parallel to a horizontal reference surface [8].
2. Soil moisture retrieval technique
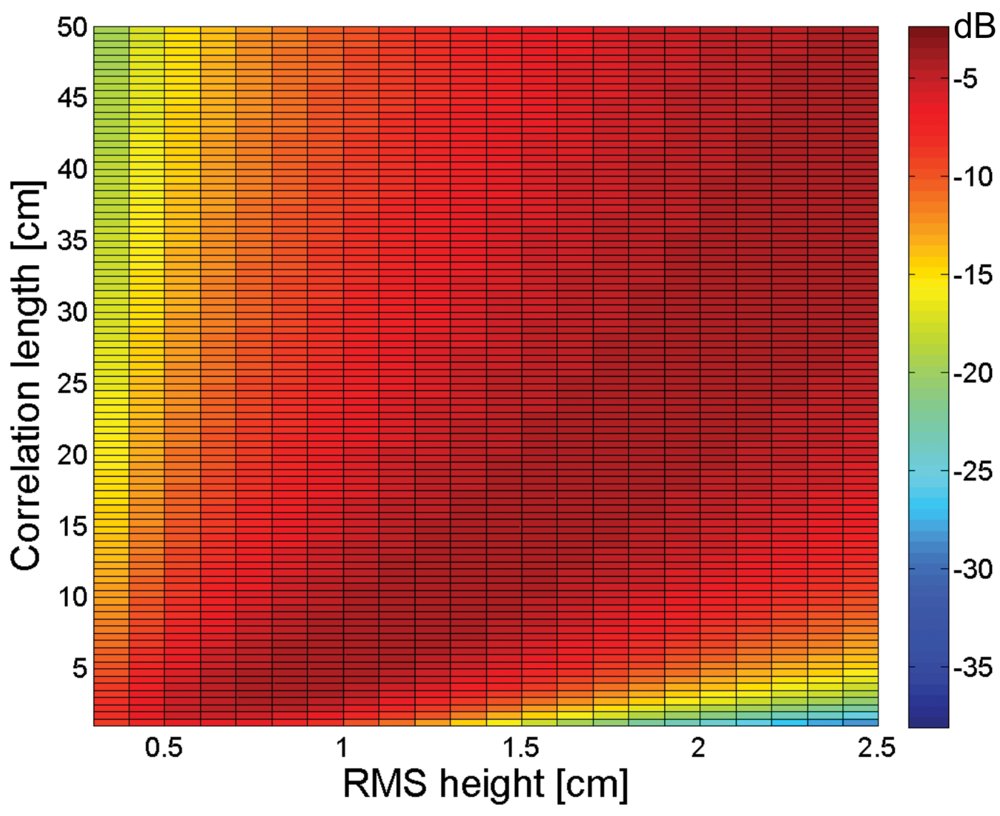
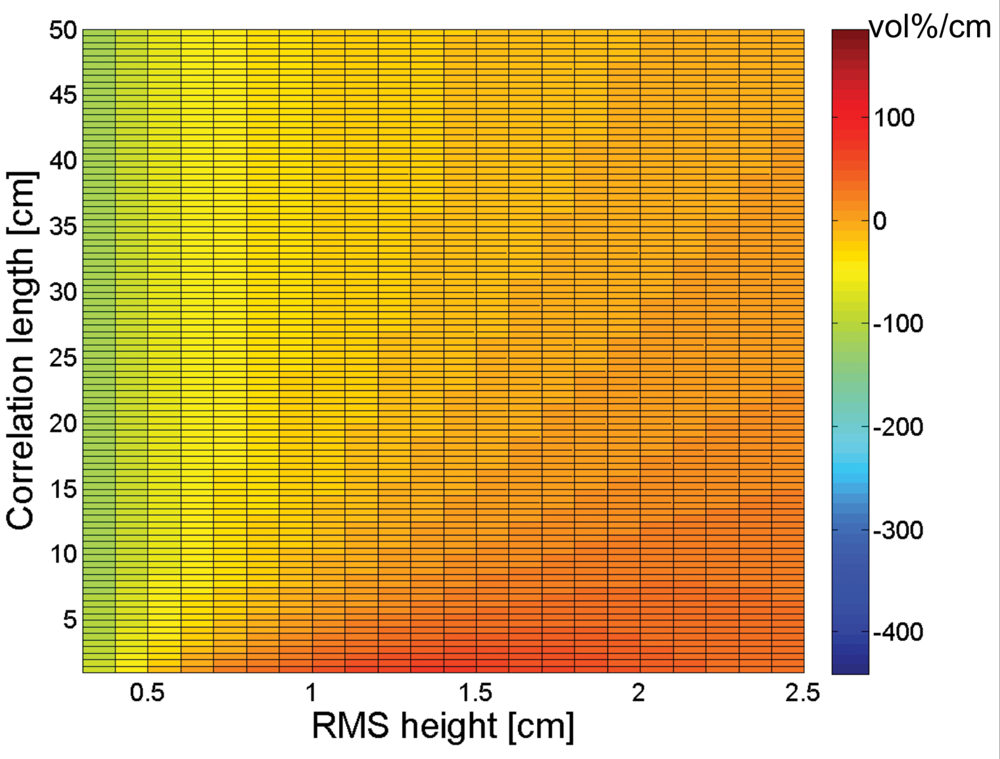
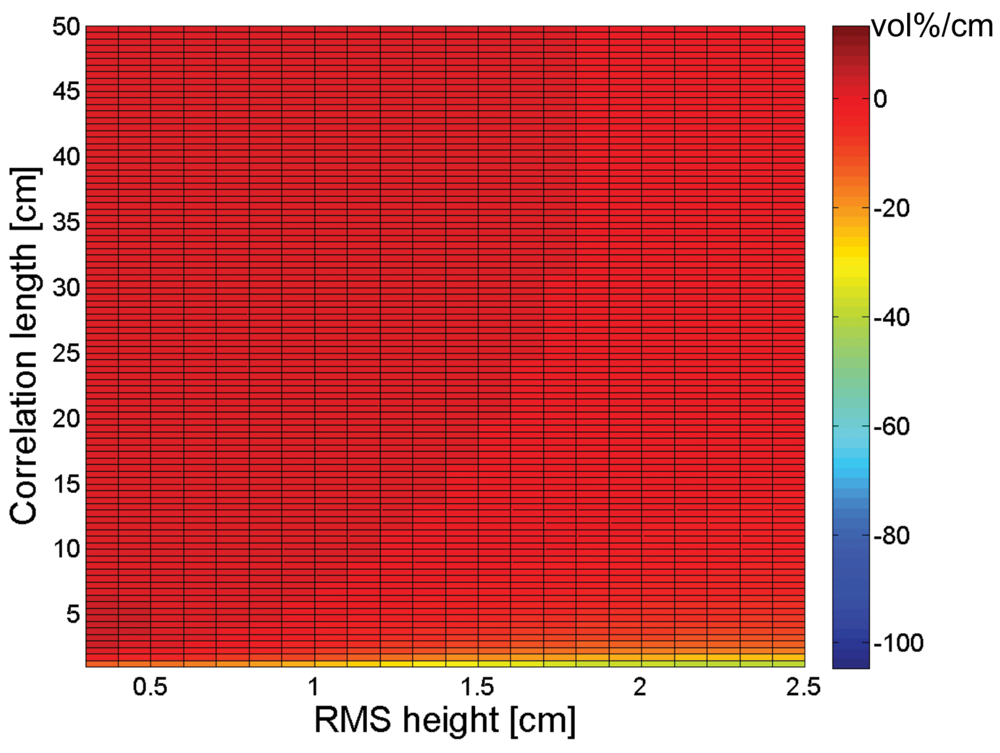
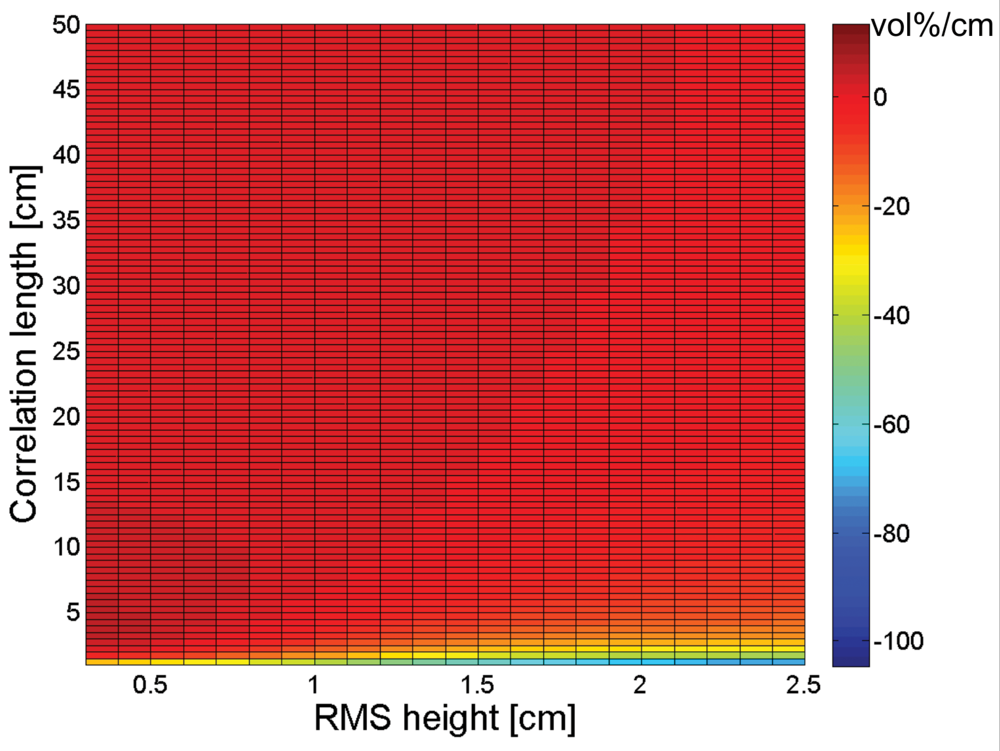
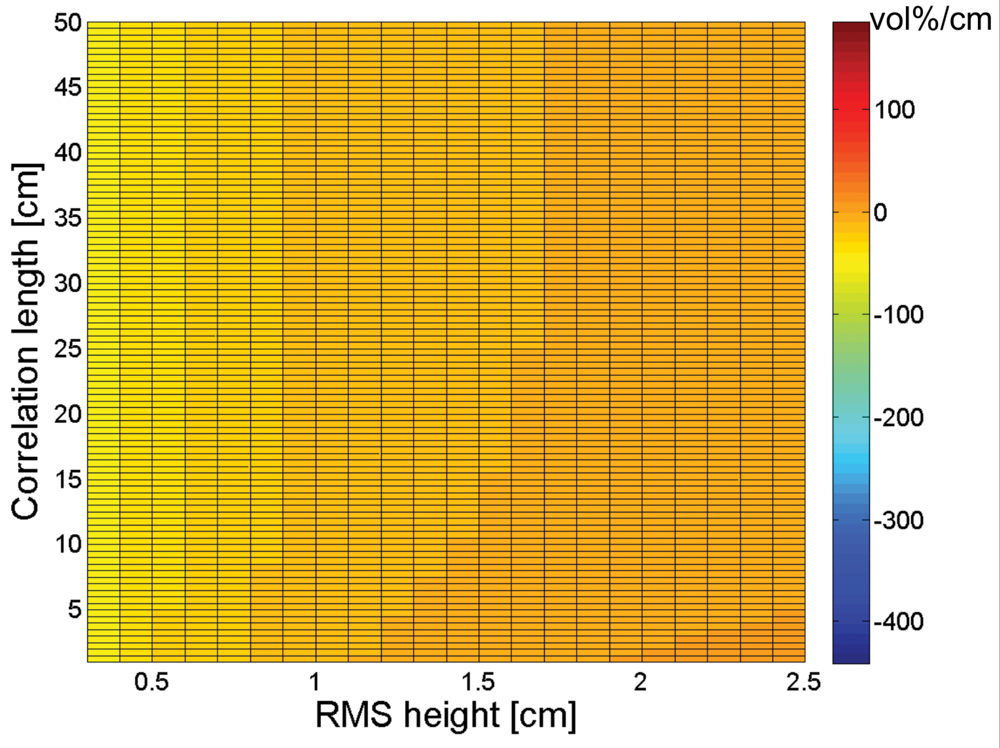
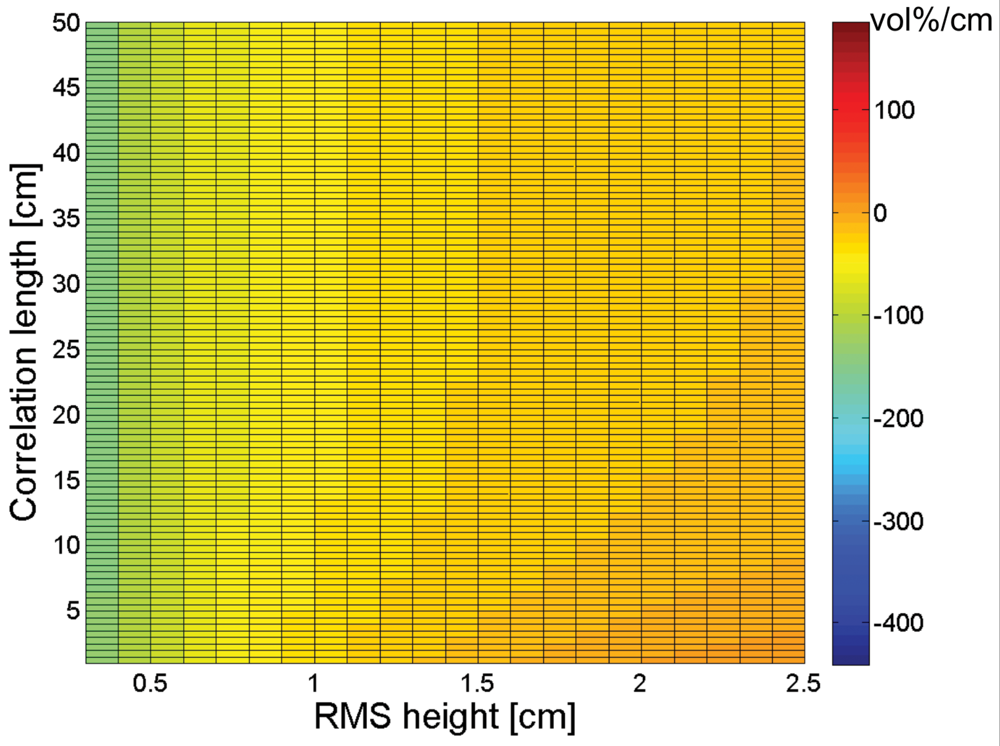
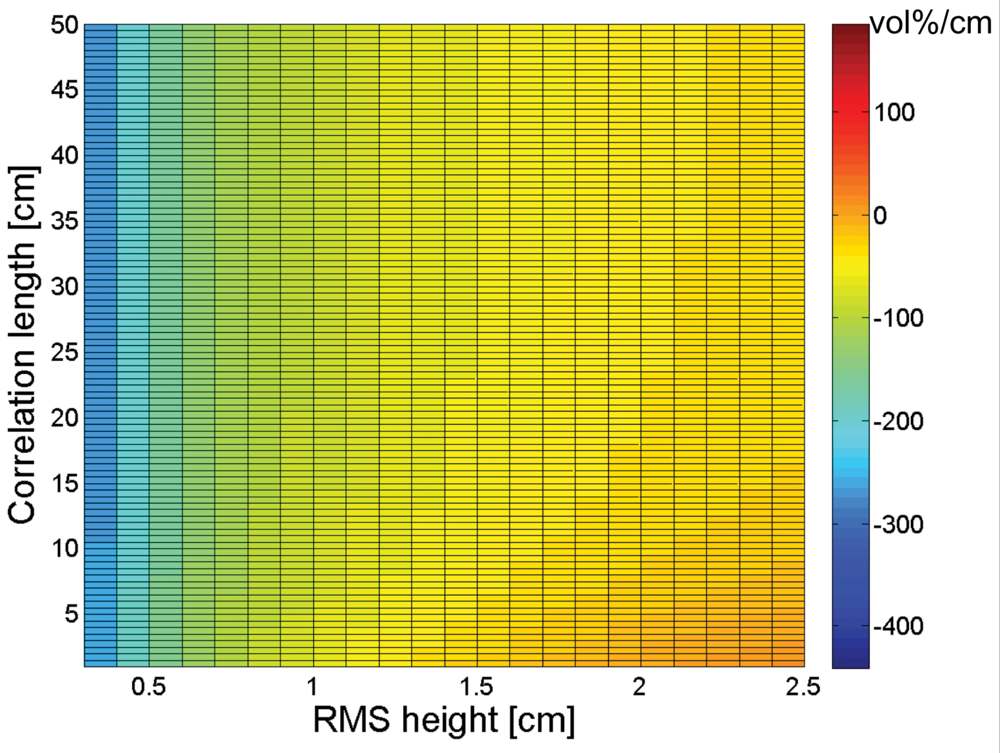
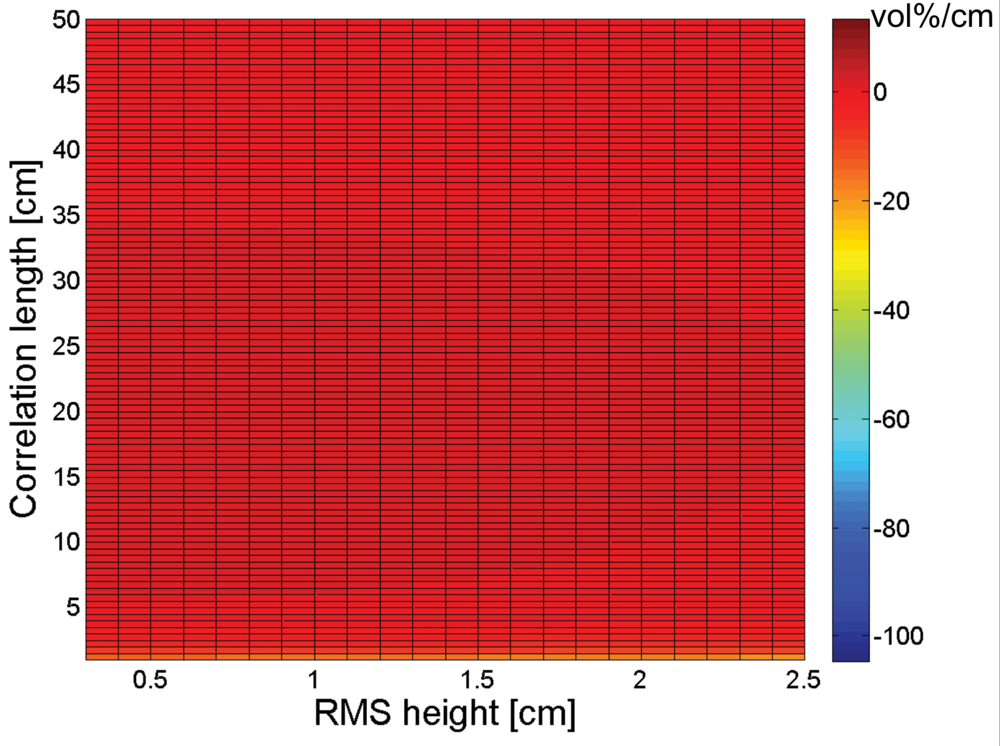
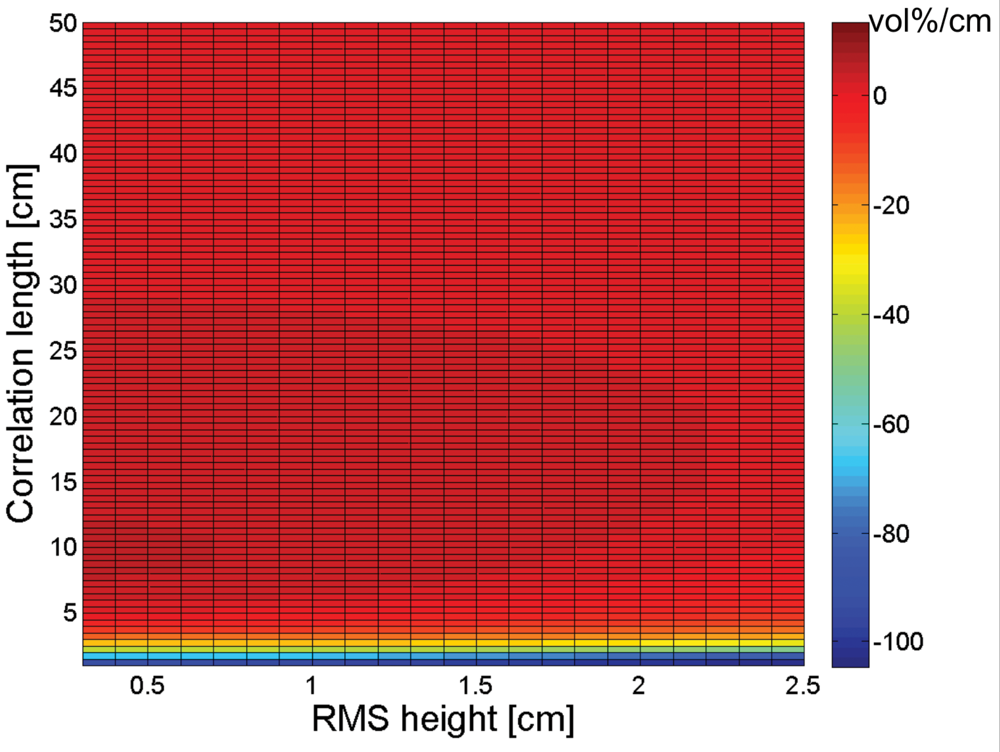
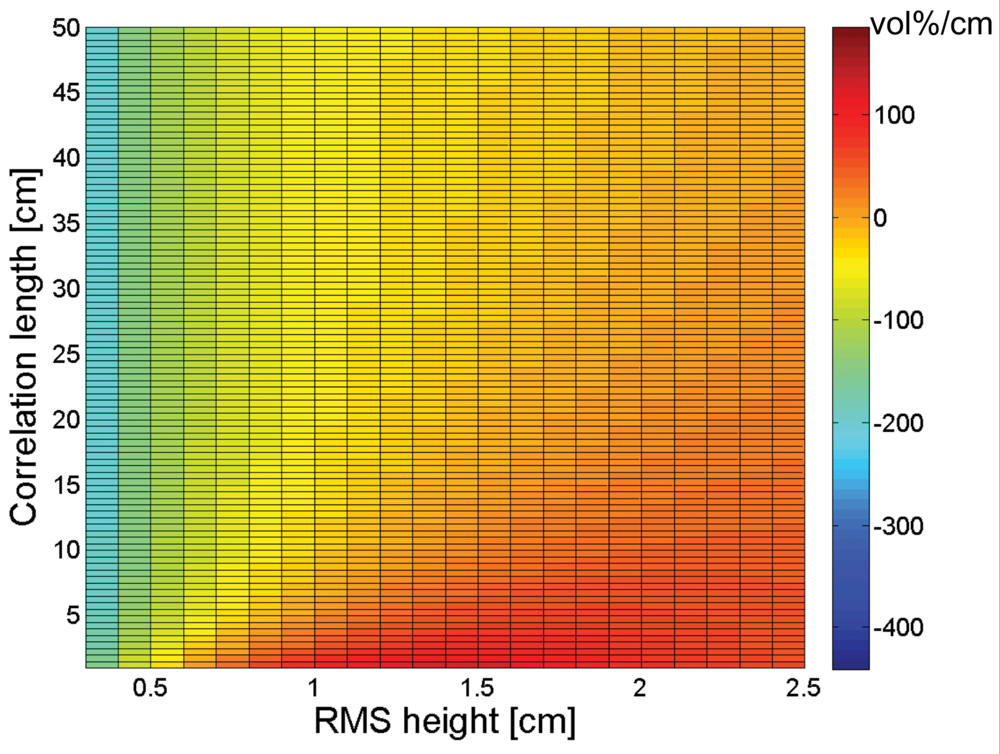
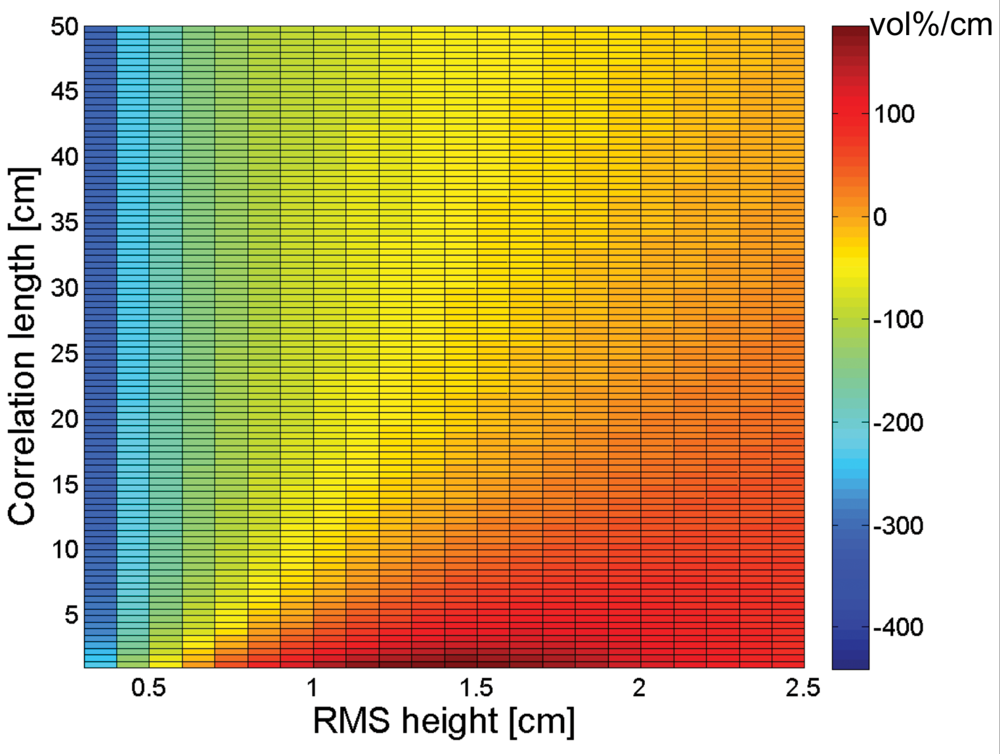
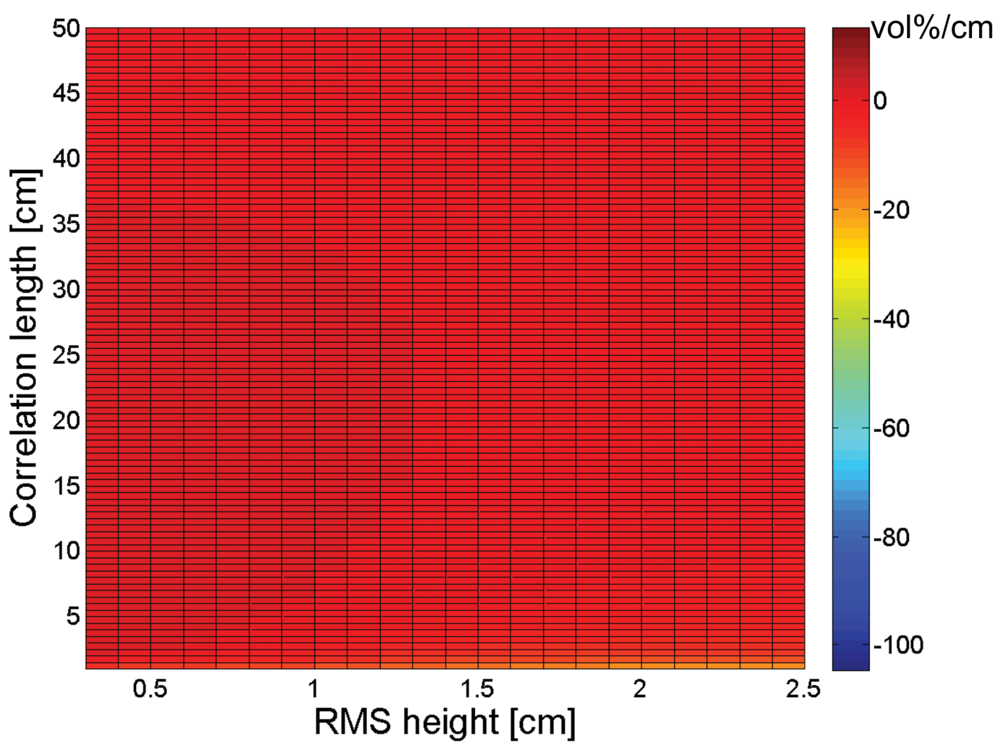
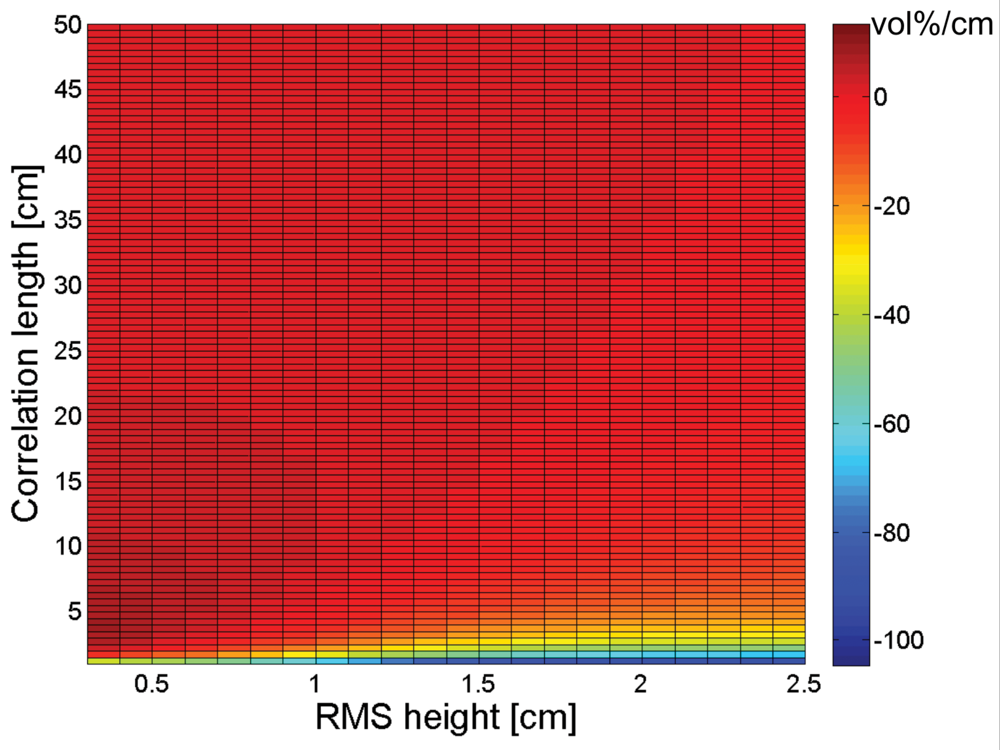
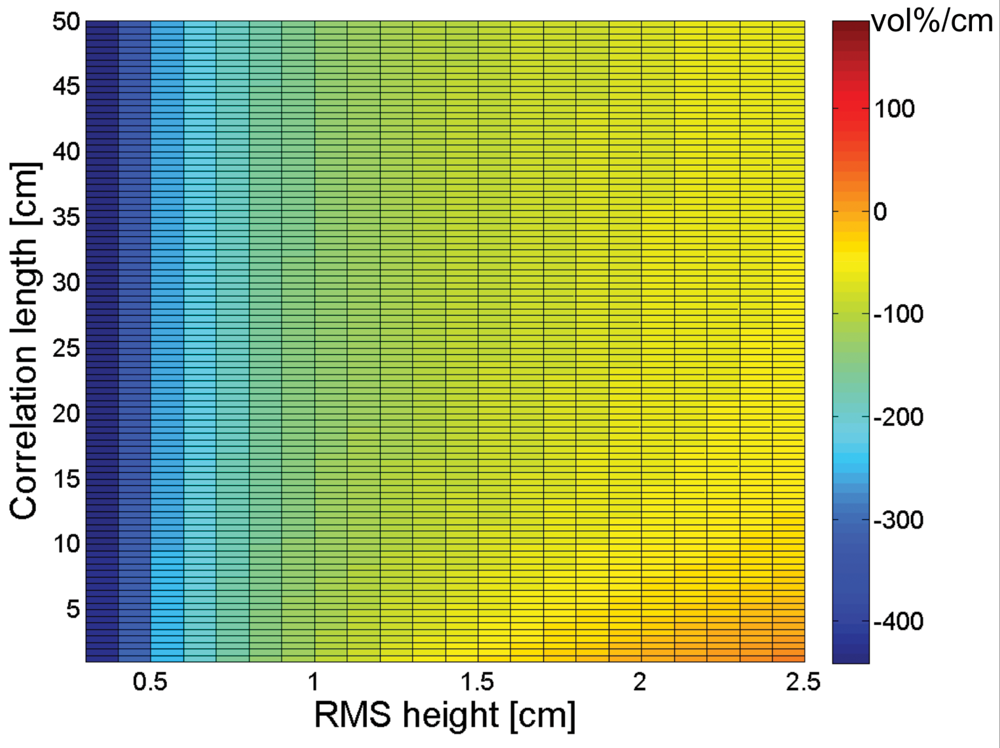
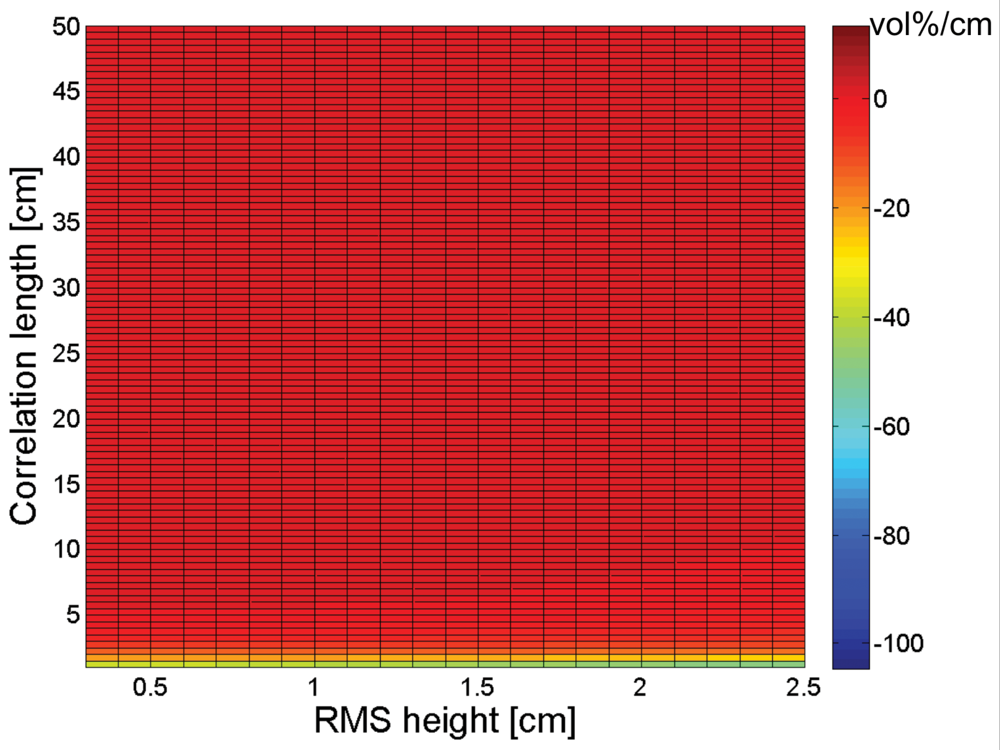
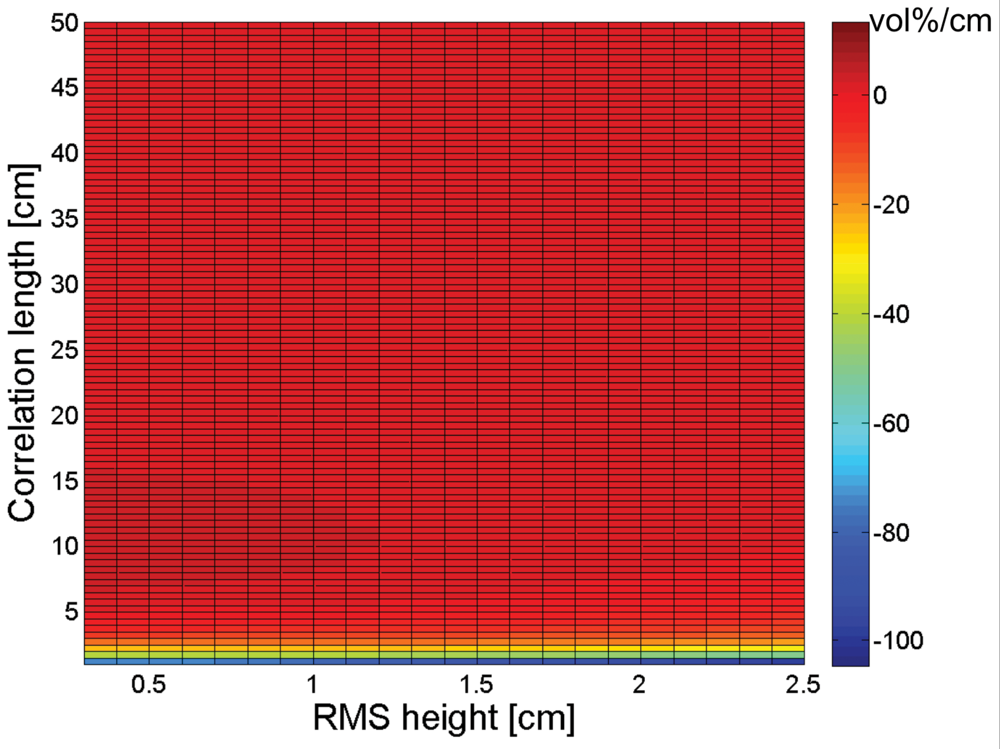
3. Sensitivity of soil moisture retrieval to RMS height and correlation length
4. Sensitivity of soil moisture retrieval to roughness parameterization techniques
4.1. Generation of synthetical 1-dimensional surface profiles
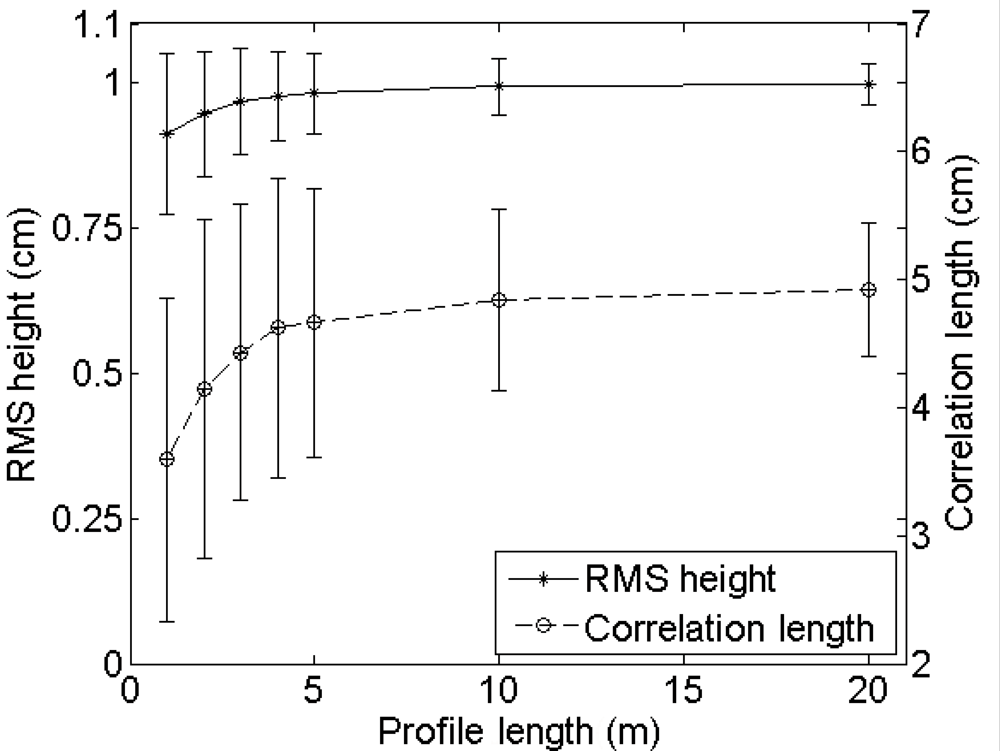
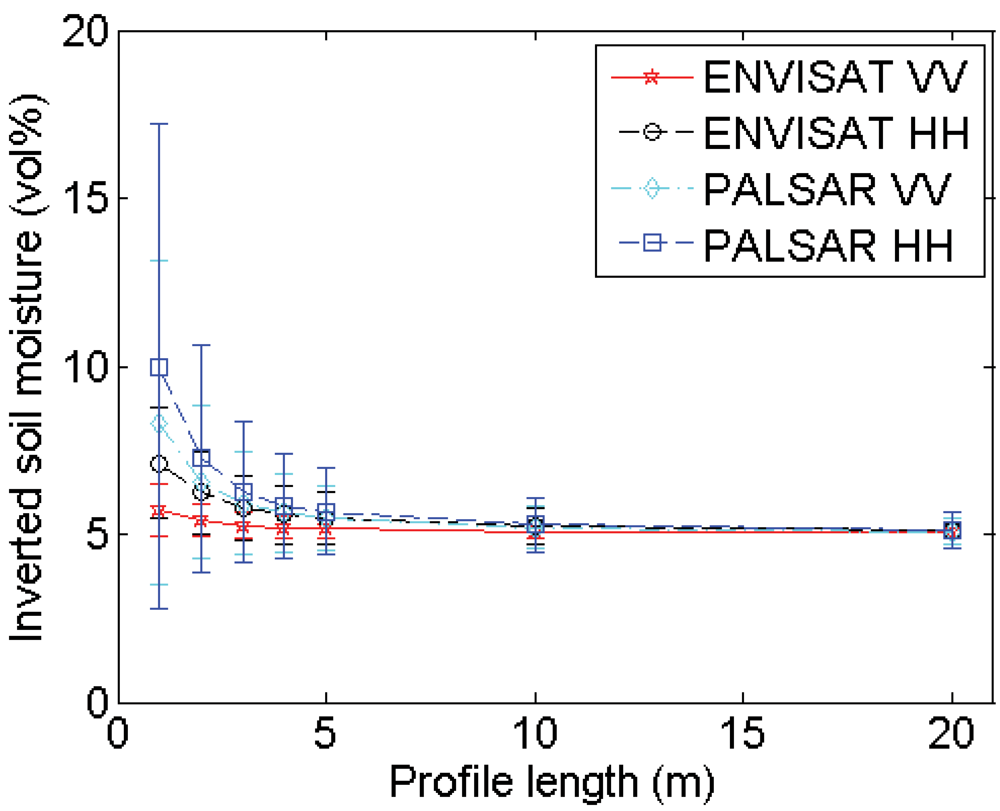
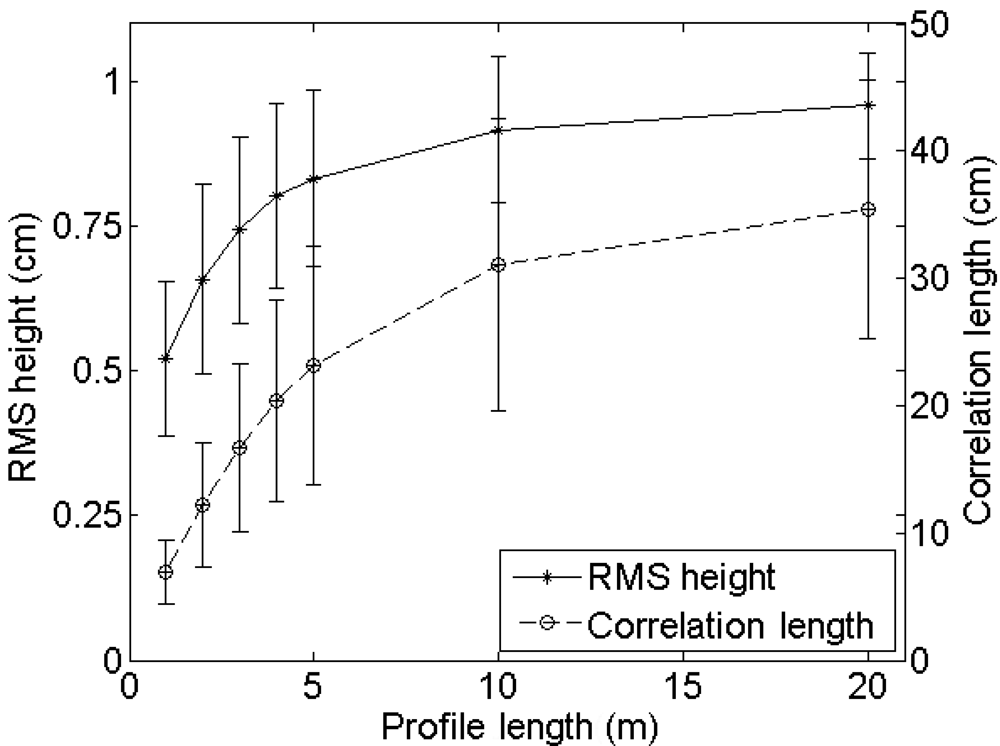
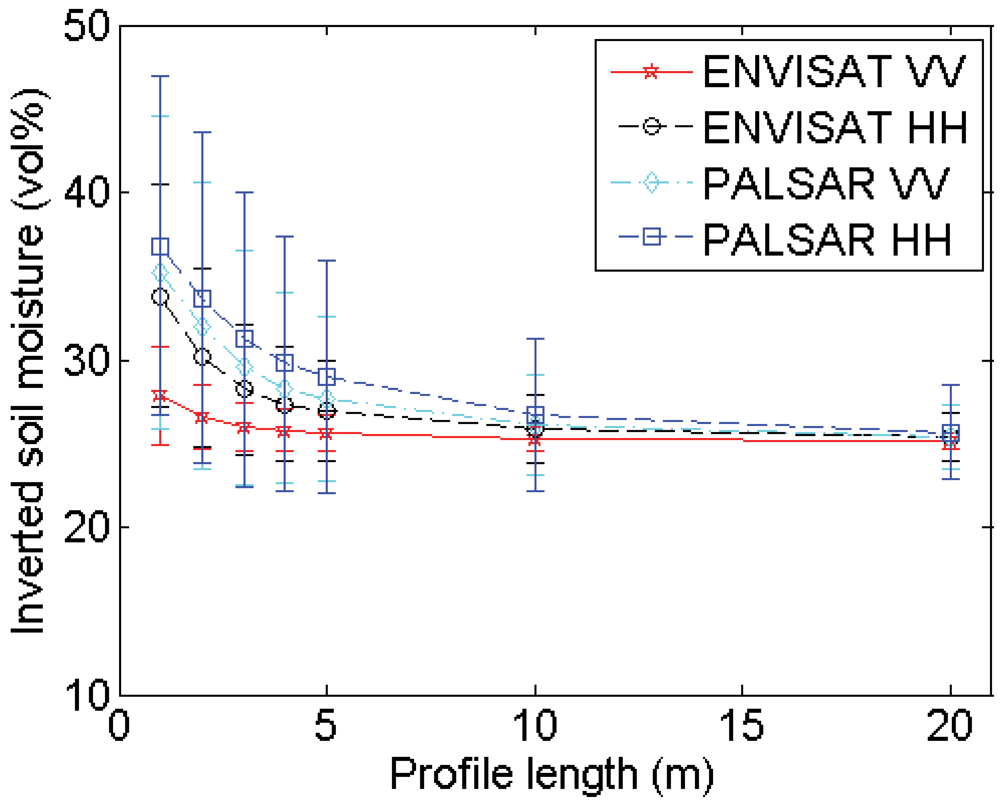
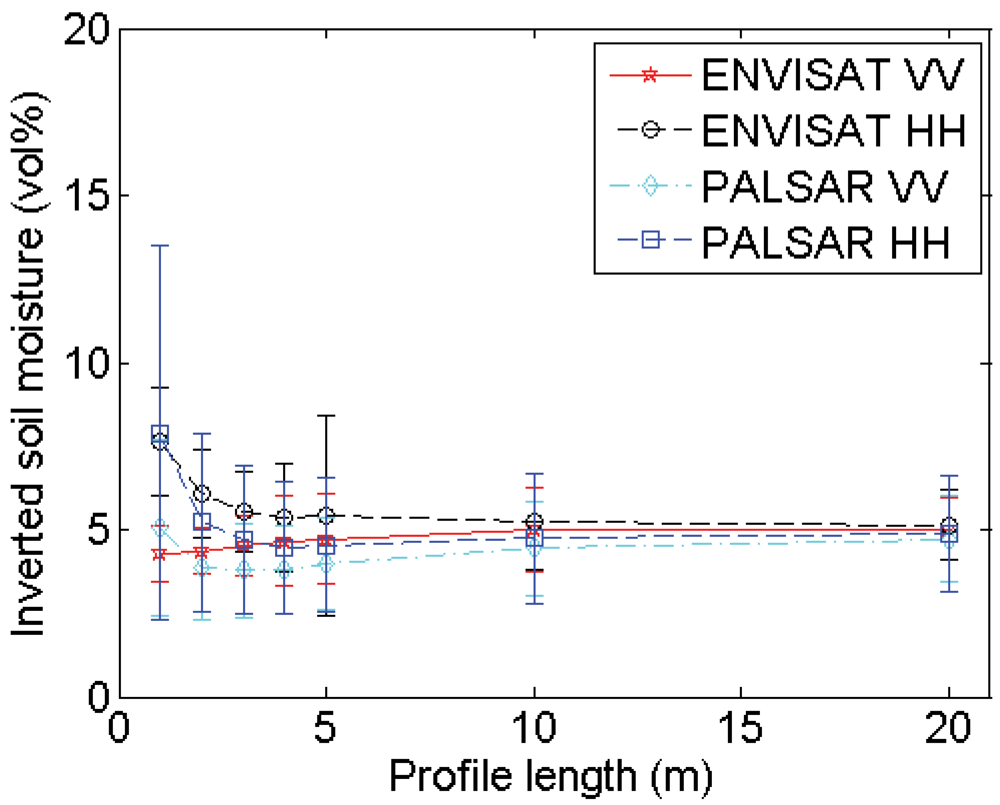
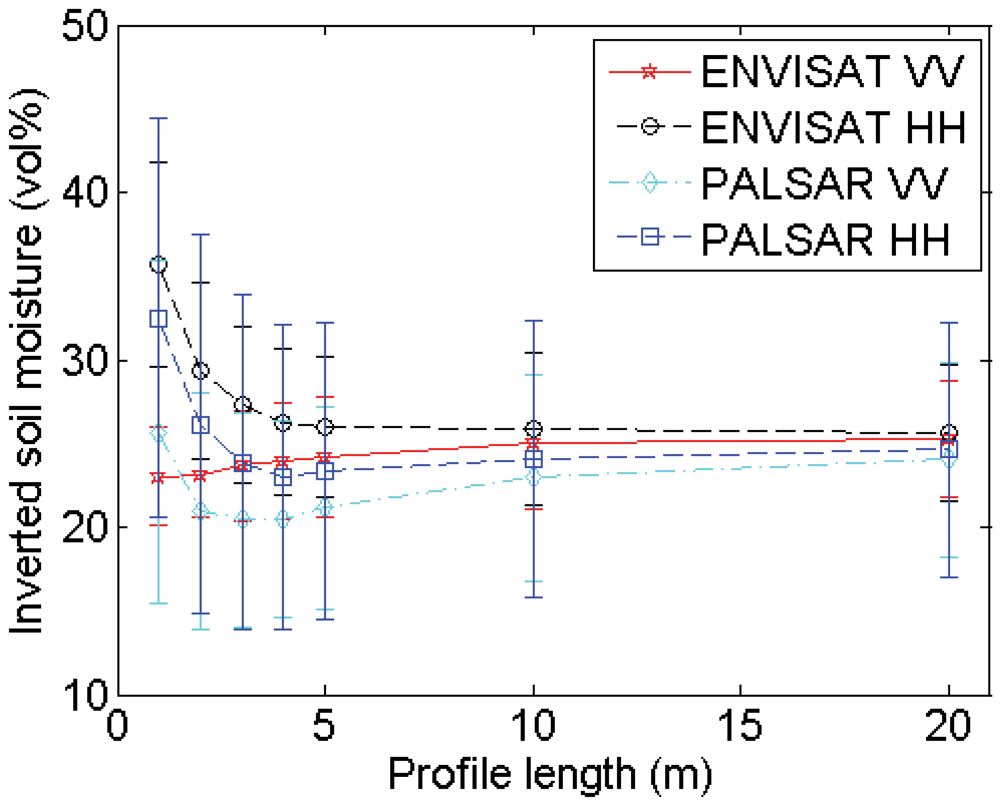
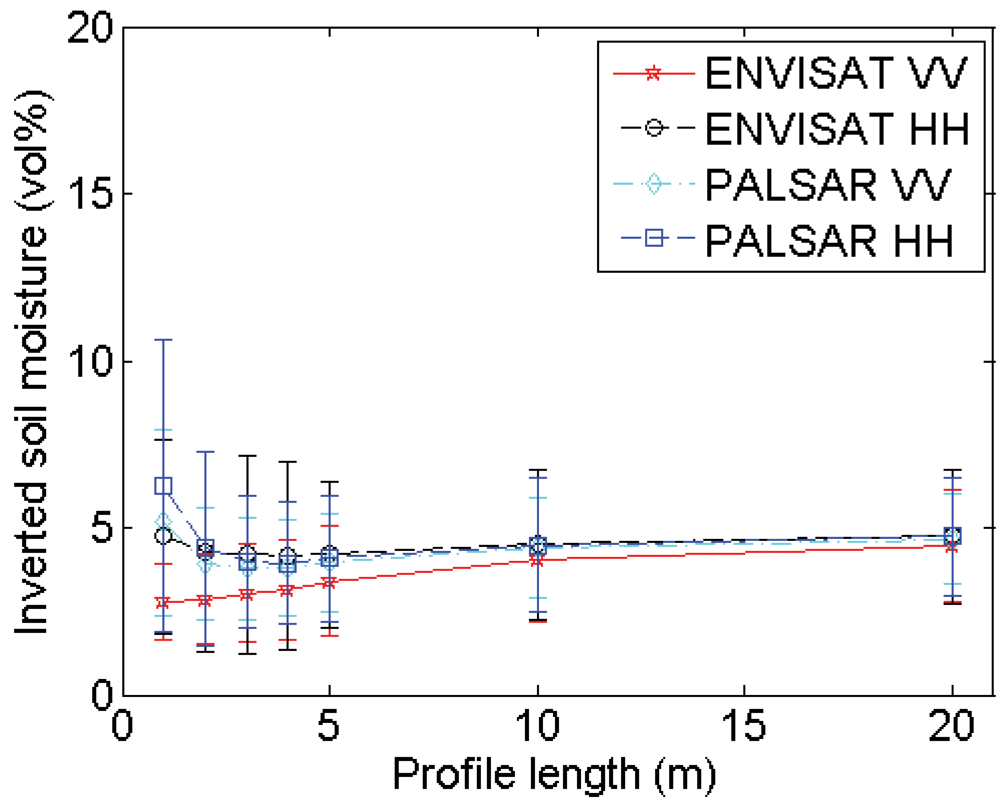
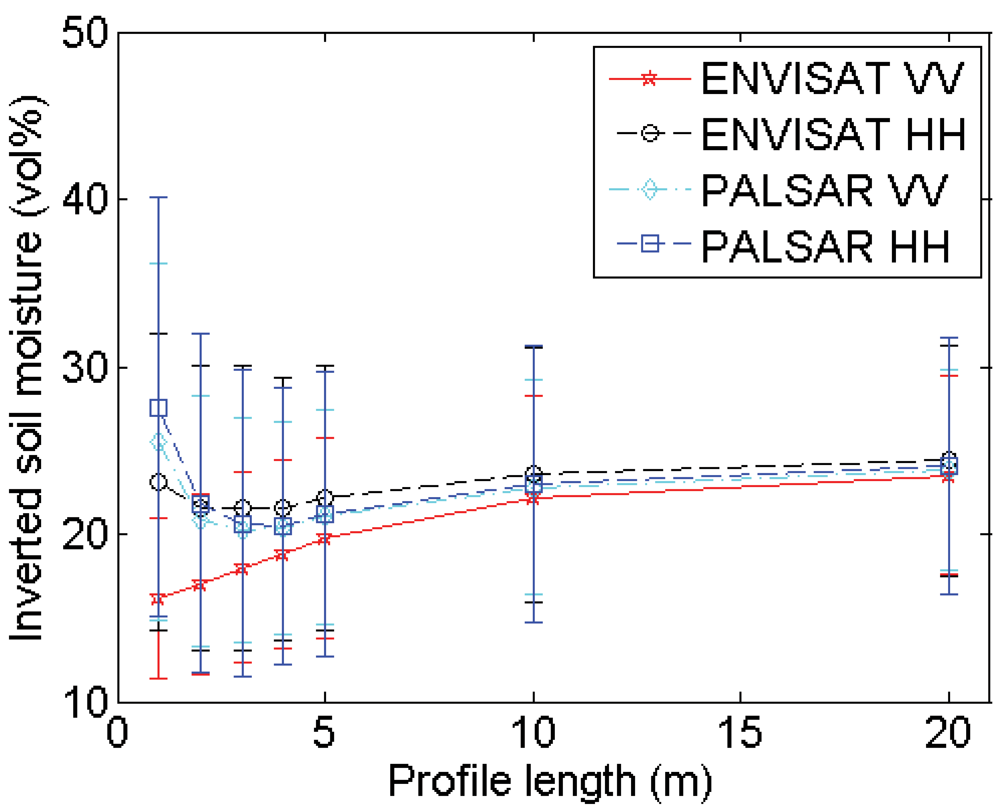
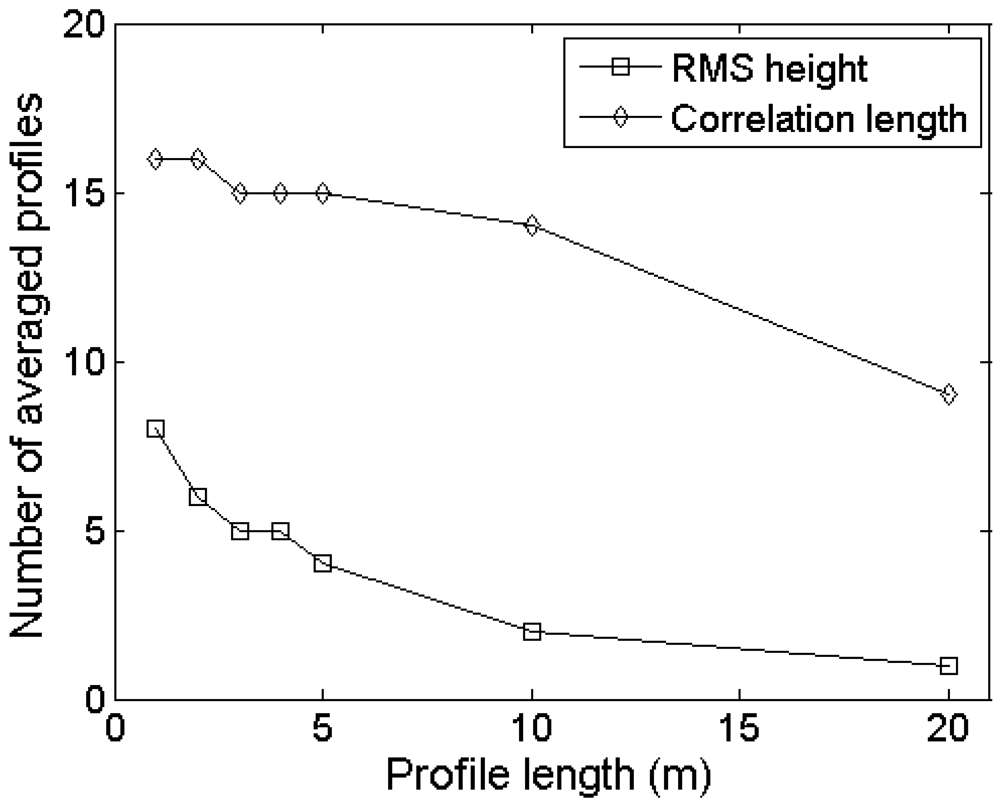
4.2. Profile length
Experimental setup
Errors on roughness parameterization
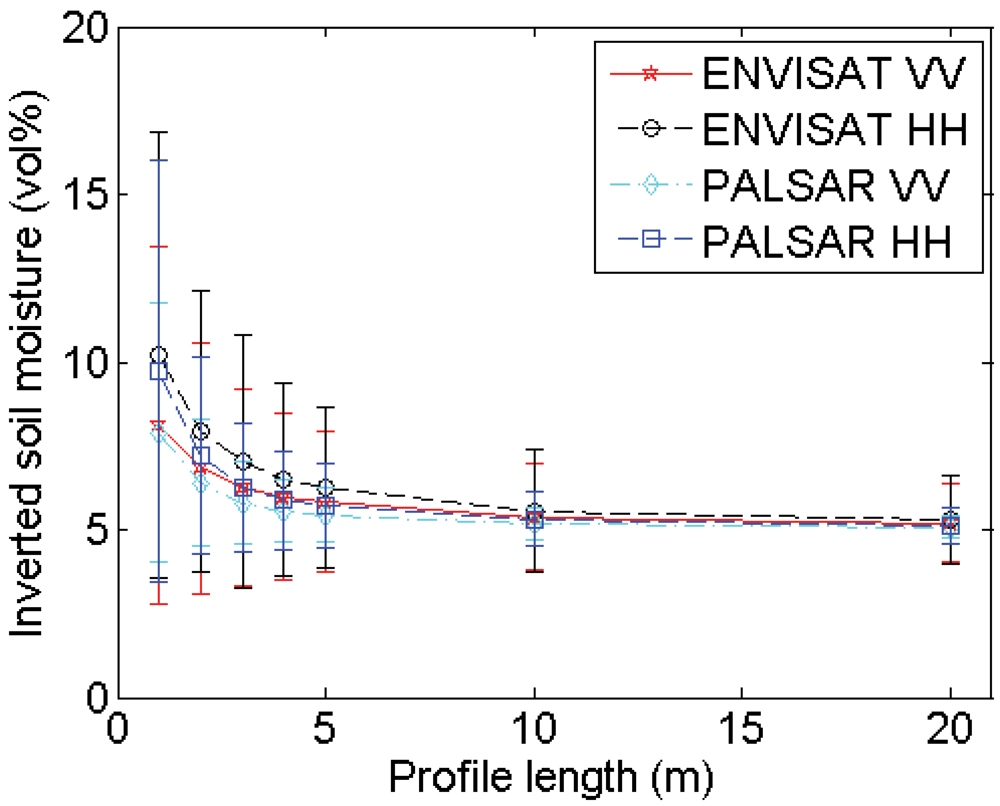
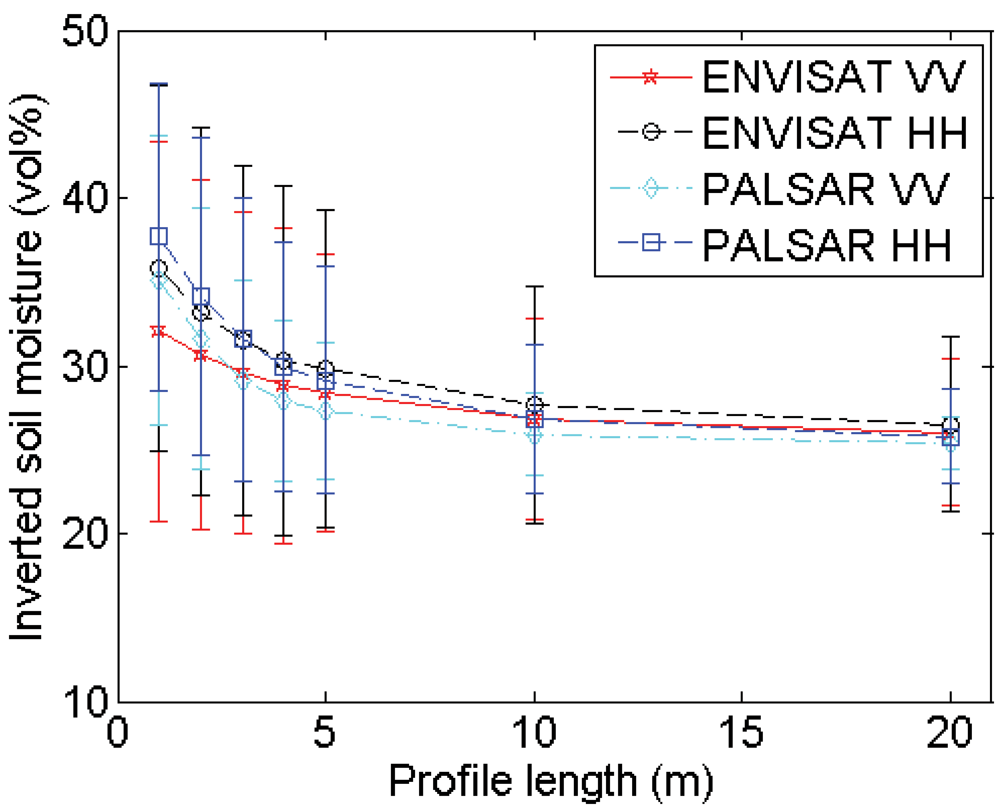
Errors on soil moisture retrieval
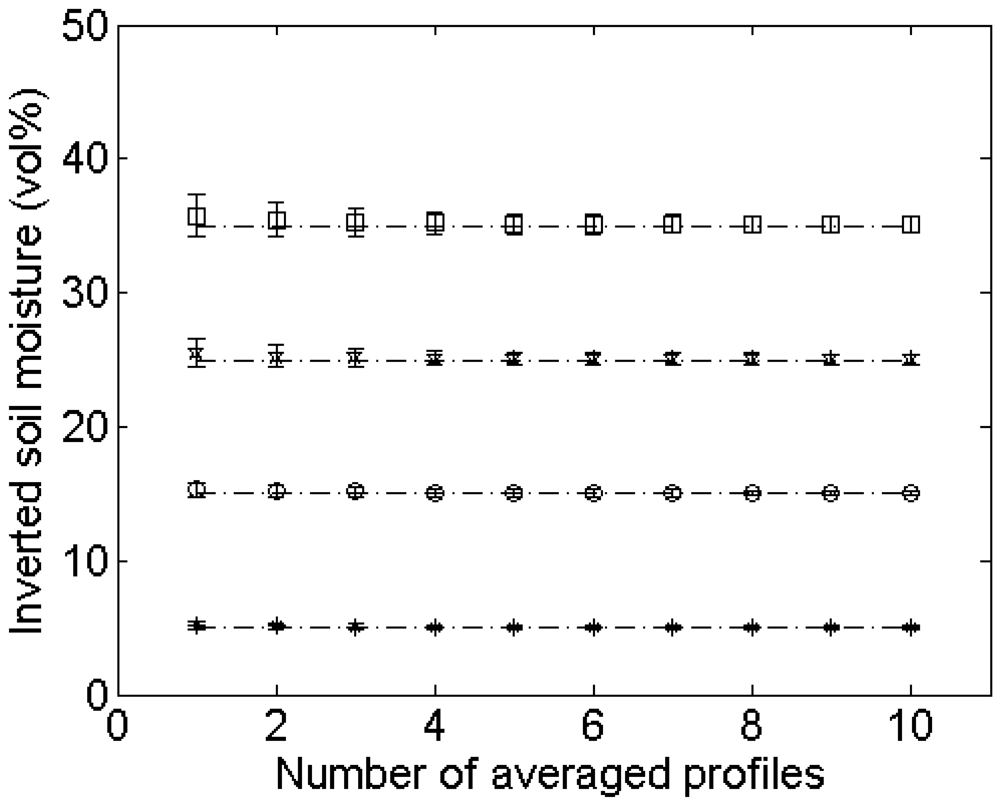
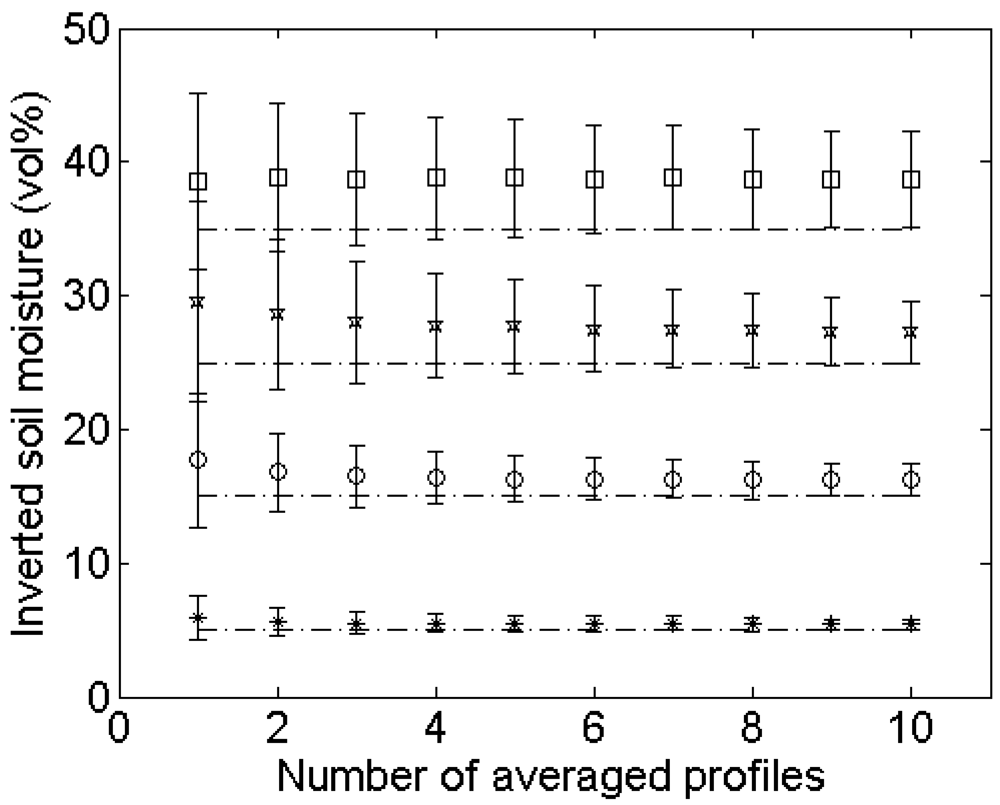
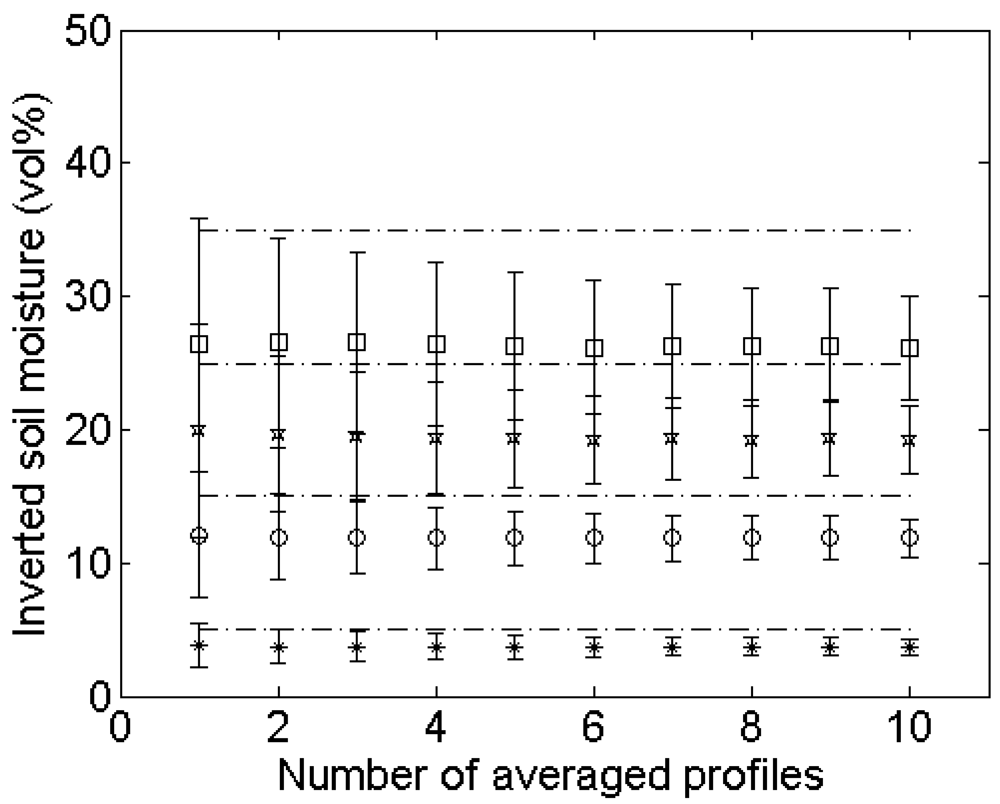
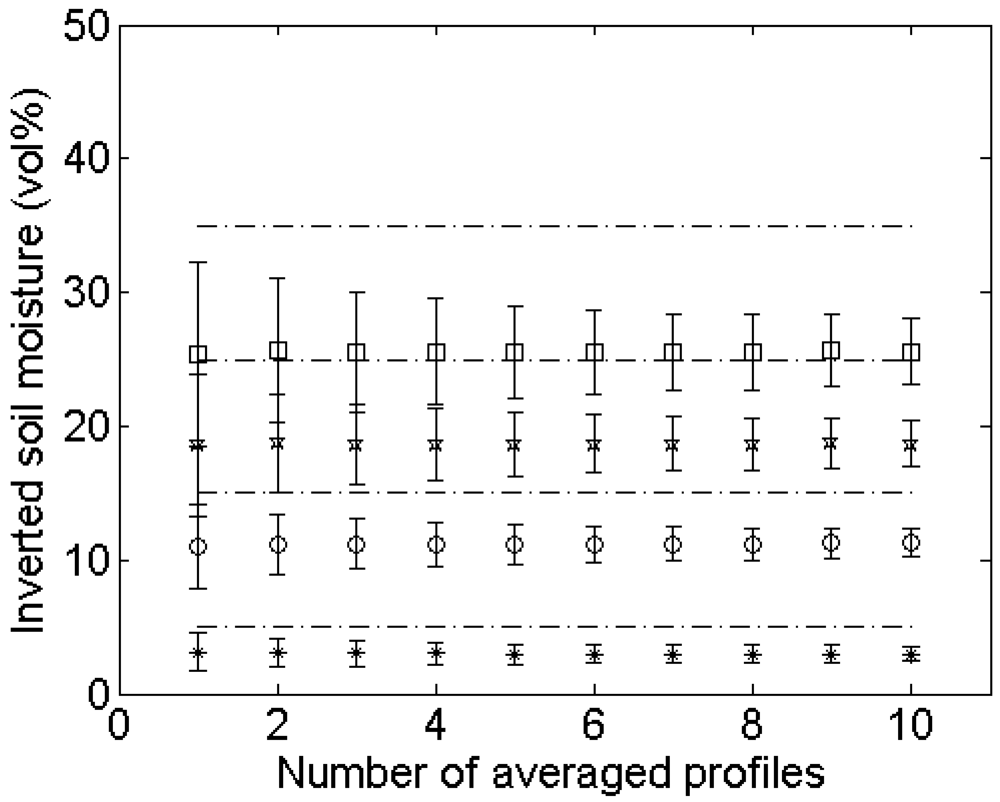
4.3. Number of profile measurements
Experimental setup
Errors on roughness parameterization
Errors on soil moisture retrieval
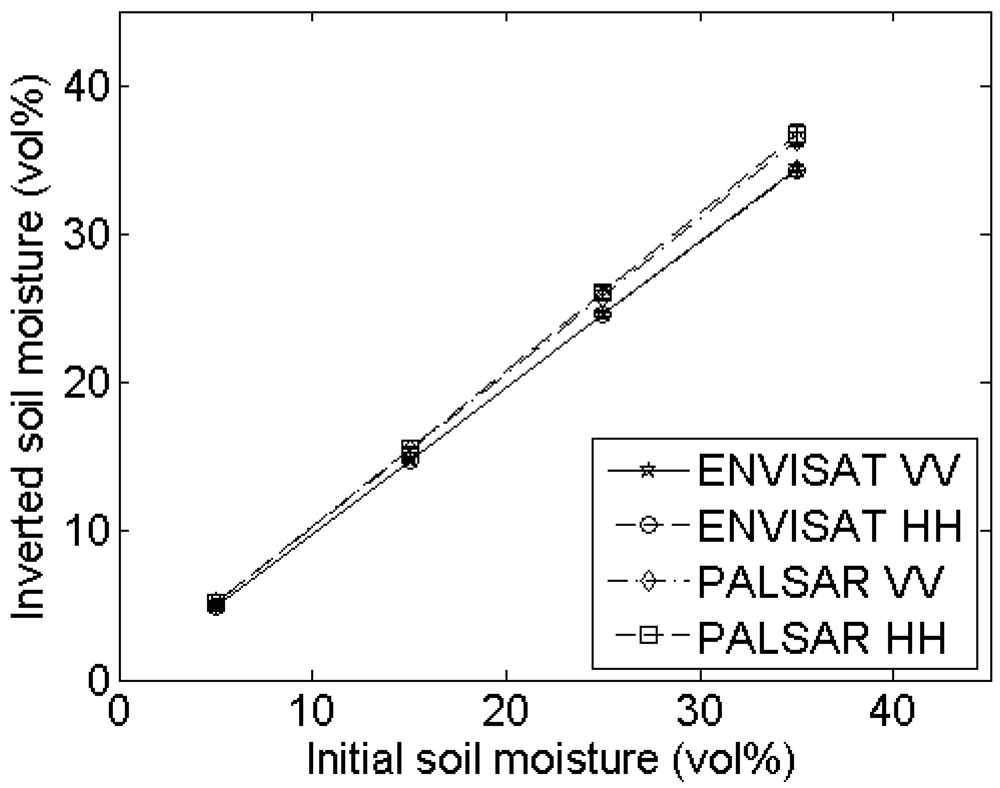
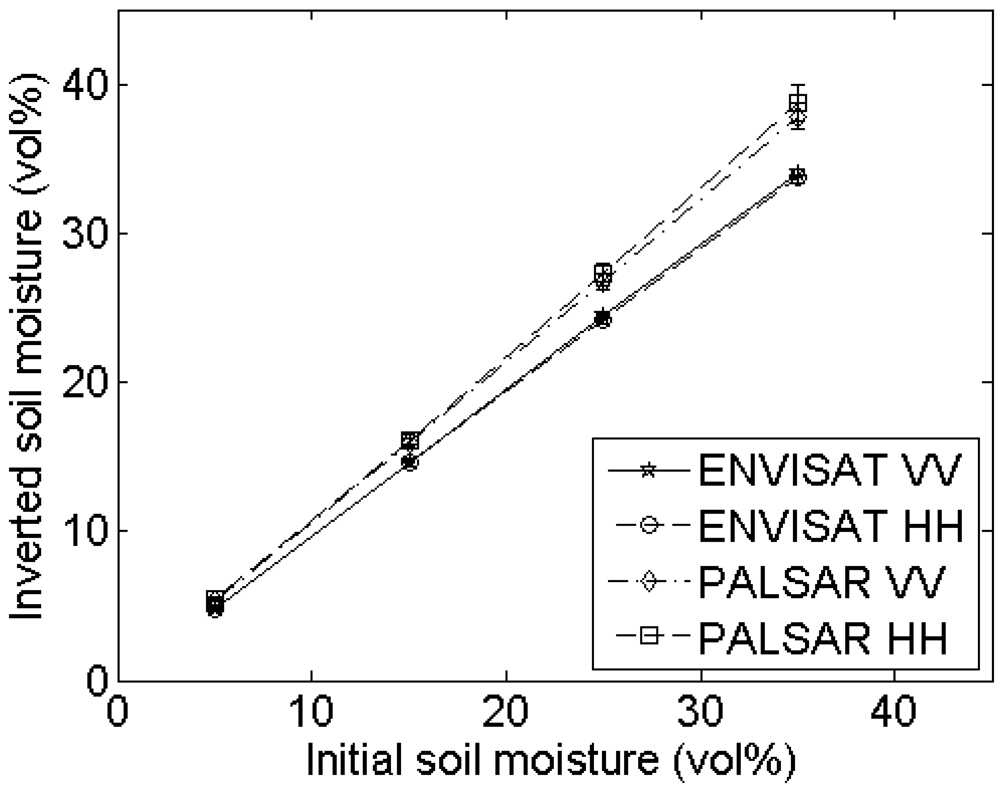
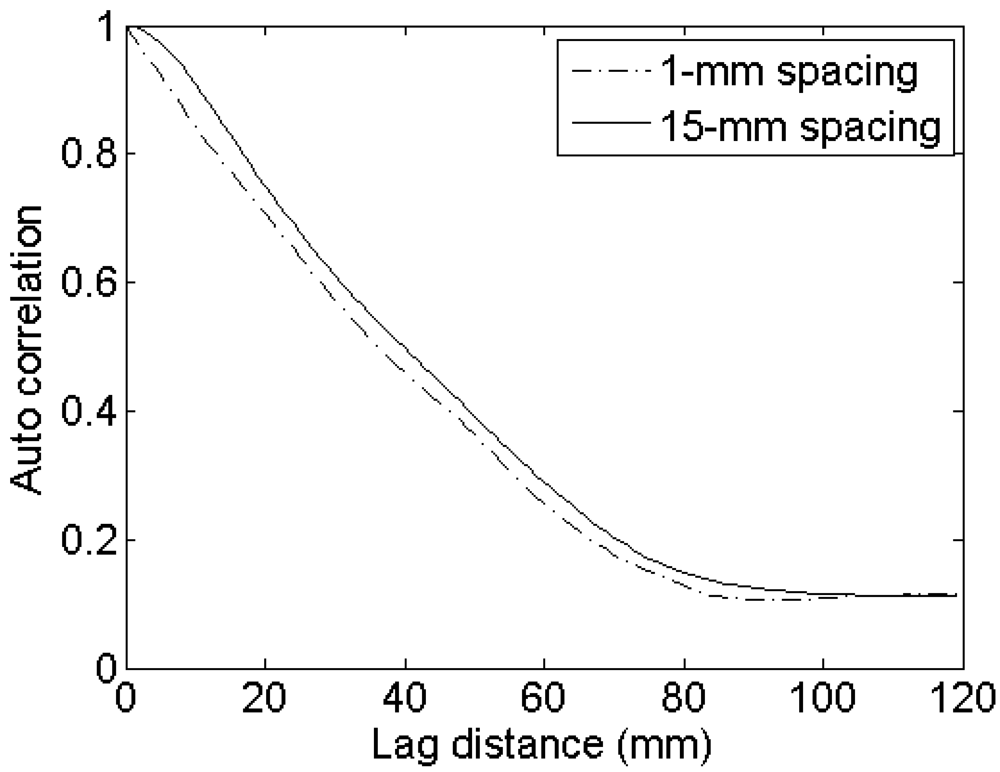
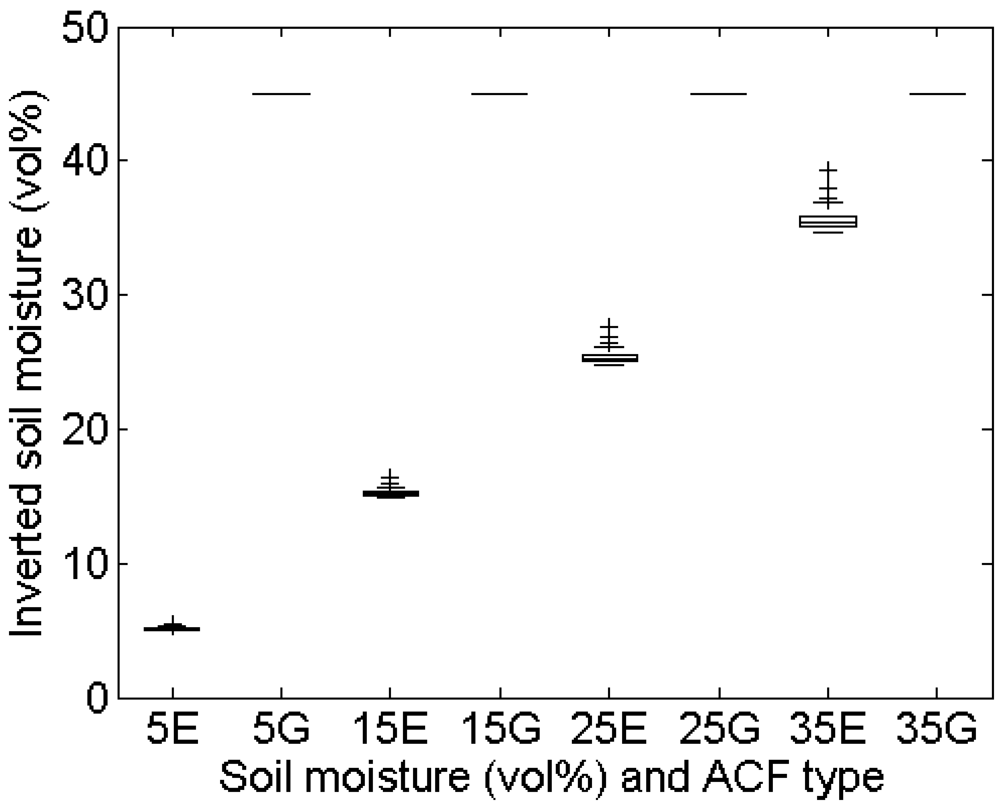
4.4. Spacing between height points
Experimental setup
Errors on roughness parameterization
Errors on soil moisture retrieval
4.5. Instrument accuracy
Experimental setup
Errors on roughness parameterization
Errors on soil moisture retrieval
4.6. Trend removal
Experimental setup
Errors on roughness parameterization
Errors on soil moisture retrieval
5. Conclusions
Acknowledgments
References and Notes
- Kozlov, A.I.; Ligthart, L.P.; Logvin, A.I. Mathematical and Physical Modelling of Microwave Scattering and Polarimetric Remote Sensing; Kluwer Academic Publishers: Dordrecht, The Netherlands, 2001. [Google Scholar]
- Dobson, M.C.; Ulaby, F.T.; Hallikainen, M.T.; El-Rayes, M.S. Microwave dielectric behavior of wet soils: Part II - Dielectric mixing models. IEEE Trans. Geosci. Remote Sensing 1985, 23, 35–46. [Google Scholar]
- Hallikainen, M.T.; Ulaby, F.T.; Dobson, M.C.; El-Rayes, M.A.; Wu, L.K. Microwave dielectric behavior of wet soils: Part I - Empirical models and experimental observations. IEEE Trans. Geosci. Remote Sensing 1985, 23, 25–34. [Google Scholar]
- Ogilvy, J.A. Theory of Wave Scattering from Random Rough Surfaces; IOP Publishing Ltd: Redcliffe Way, Bristol, UK, 1991. [Google Scholar]
- Jester, W.; Klik, A. Soil surface roughness measurement-methods, applicability, and surface representation. CATENA 2005, 64, 174–192. [Google Scholar]
- Mattia, F.; Davidson, M.W.J.; Le Toan, T.; D'Haese, C.M.F.; Verhoest, N.E.C.; Gatti, A.M.; Borgeaud, M. A comparison between soil roughness statistics used in surface scattering models derived from mechanical and laser profilers. IEEE Trans. Geosci. Remote Sensing 2003, 41, 1659–1671. [Google Scholar]
- Davidson, M.W.J.; Le Toan, T.; Mattia, F.; Satalino, G.; Manninen, T.; Borgeaud, M. On the characterization of agricultural soil roughness for radar remote sensing studies. IEEE Trans. Geosci. Remote Sensing 2000, 38, 630–640. [Google Scholar]
- Callens, M.; Verhoest, N.E.C.; Davidson, M.W.J. Parameterization of tillage-induced single-scale soil roughness from 4-m profiles. IEEE Trans. Geosci. Remote Sensing 2006, 44, 878–888. [Google Scholar]
- Bryant, R.; Moran, M.S.; Thoma, D.P.; Holifield Collins, C.D.; Skirvin, S.; Rahman, M.; Slocum, K.; Starks, P.; Bosch, D.; Gonzlez Dugo, M.P. Measuring surface roughness height to parameterize radar backscatter models for retrieval of surface soil moisture. IEEE Trans. Geosci. Remote Sensing Lett. 2007, 4, 137–141. [Google Scholar]
- Ulaby, F.T.; Moore, R.K.; Fung, A.K. Microwave Remote Sensing: Active and Passive; Volume II, Artech House: Boston, MA, 1982. [Google Scholar]
- Oh, Y.; Kay, Y.C. Condition for precise measurement of soil surface roughness. IEEE Trans. Geosci. Remote Sensing 1998, 36, 691–695. [Google Scholar]
- Baghdadi, N.; Cerdan, O.; Zribi, M.; Auzet, V.; Darboux, F.; El Hajj, M.; Kheir, R.B. Operational performance of current synthetic aperture radar sensors in mapping soil surface characteristics in agricultural environments: application to hydrological and erosion modelling. Hydrological Processes 2008, 22, 9–20. [Google Scholar]
- Baghdadi, N.; Paillou, P.; Grandjean, G.; Dubois, P.; Davidson, M.W.J. Relationship between profile length and roughness variables for natural surfaces. International Journal of Remote Sensing 2000, 21, 3375–3381. [Google Scholar]
- Verhoest, N.E.C.; Lievens, H.; Wagner, W.; Álvarez-Mozos, J.; Moran, M.S.; Mattia, F. On the soil roughness parameterization problem in soil moisture retrieval of bare surfaces from synthetic aperture radar. Sensors 2008, 8, 4213–4248. [Google Scholar]
- Fung, A.K.; Li, Z.; Chen, K.S. Backscattering from a randomly rough dielectric surface. IEEE Trans. Geosci. Remote Sensing 1992, 30, 356–369. [Google Scholar]
- Fung, A.K. Microwave Scattering and Emission Models and Their Applications; Artech House: Boston, MA, 1994. [Google Scholar]
- Weimann, A.; Von Schönemark, M.; Schumann, A.; Jorm, P.; Gunter, R. Soil moisture estimation with ERS-1 SAR in the East German loess soil area. International Journal of Remote Sensing 1998, 19, 237–243. [Google Scholar]
- Zribi, M.; Baghdadi, N.; Holah, N.; Fafin, O. New methodology for soil surface moisture estimation and its application to envisat-asar multi-incidence data inversion. Remote Sensing of Environment 2005, 96, 485–496. [Google Scholar]
- Oh, Y.; Sarabandi, K.; Ulaby, F.T. An empirical model and an inversion technique for radar scattering from bare soil surfaces. IEEE Trans. Geosci. Remote Sensing 1992, 30, 370–381. [Google Scholar]
- Dubois, P.C.; van Zyl, J.; Engman, E.T. Measuring soil moisture with imaging radars. IEEE Trans. Geosci. Remote Sensing 1995a, 33, 915–926. [Google Scholar]
- Dubois, P.C.; van Zyl, J.; Engman, E.T. Corrections to ‘measuring soil moisture with imaging radars’. IEEE Trans. Geosci. Remote Sensing 1995b, 33, 1340. [Google Scholar]
- Rice, S.O. Reflection of electromagnetic waves from slightly rough surfaces. Comm. Pure Appl. Math. 1951, 4, 361–378. [Google Scholar]
- Beckman, P.; Spizzichino, A. The Scattering of Electromagnetic Waves from Rough Surfaces; Pergamon: New York, USA, 1963. [Google Scholar]
- Moran, M.S.; Peters-Lidard, C.D.; Watts, J.M.; McElroy, S. Estimating soil moisture at the watershed scale with satellite-based radar and land surface models. Canadian J. Remote Sens. 2004, 30, 805–826. [Google Scholar]
- Ogilvy, A.; Foster, J.M. Rough surfaces: Gaussian or exponential statistics? J. Phys. D: Appl. Phys. 1998, 22, 1243–1251. [Google Scholar]
- Rahman, M.; Moran, M.S.; Thoma, D.P.; Bryant, R.; Sano, E.E.; Holifield Collins, C.D.; Skirvin, S.; Kershner, C.; Orr, B.J. A derivation of roughness correlation length for parameterizing radar backscatter models. Int. J. Remote Sens. 2007, 28, 3994–4012. [Google Scholar]
- Satalino, G.; Mattia, F.; Davidson, M.W.J.; Le Toan, T.; Pasquariello, G.; Borgeaud, M. On current limits of soil moisture retrieval from ERS-SAR data. IEEE Trans. Geosci. Remote Sensing 2002, 40, 2438–2447. [Google Scholar]
- Oh, Y. Quantitative retrieval of soil moisture content and surface roughness from mulitipolarized radar observations of bare soil surfaces. IEEE Trans. Geosci. Remote Sensing 2004, 42, 596–601. [Google Scholar]
- Baghdadi, N.; Holah, N.; Zribi, M. Soil moisture estimation using multi-incidence and multi-polarization ASAR SAR data. Int. J. Remote Sens. 2006, 27, 1907–1920. [Google Scholar]
- Alvarez-Mozos, J.; Casalí, J.; González-Audícana, M.; Verhoest, N.E.C. Assessment of the operational applicability of RADARSAT-1 data for surface soil moisture estimation. IEEE Trans. Geosci. Remote Sensing 2006, 44, 913–924. [Google Scholar]
- Verhoest, N.E.C.; De Baets, B.; Mattia, F.; Satalino, G.; Lucau, C.; Defourny, P. A possibilistic approach to soil moisture retrieval from ERS SAR backscattering under soil roughness uncertainty. Water Resour. Res. 2007, 43, W07435. [Google Scholar]
- Verhoest, N.E.C.; De Baets, B.; Vernieuwe, H. A Takagi-Sugeno fuzzy rule-based model for soil moisture retrieval from SAR under soil roughness uncertainty. IEEE Trans. Geosci. Remote Sensing 2007, 45, 1351–1360. [Google Scholar]
- Baghdadi, N.; King, C.; Bourguignon, A.; Remond, A. Potential of ERS and RADARSAT data for surface roughness monitoring over bare agricultural fields: application to catchments in Northern France. Int. J. Remote Sens. 2002, 23, 3427–3442. [Google Scholar]
- Altese, E.; Bolognani, O.; Mancini, M.; Troch, P.A. Retrieving soil moisture over bare soils from ERS-1 synthetic aperture radar data: Sensitivity analysis based on a theoretical surface scattering model and field data. Water Resour. Res. 1996, 32, 653–662. [Google Scholar]
- Box, G.E.P.; Jenkins, G.M.; Reinsel, G.C. Time Series Analysis, Forecasting and Control; Prentice Hall, Inc., 1994. [Google Scholar]
- Oh, Y.; Hong, J.Y. Effect of surface profile length on the backscattering coefficients of bare surfaces. IEEE Trans. Geosci. Remote Sensing 2007, 45, 632–638. [Google Scholar]
- Baghdadi, N.; Gherboudj, I.; Zribi, M.; Sahebi, M.; King, C.; Bonn, F. Semi-empirical calibration of the IEM backscattering model using radar images and moisture and roughness field measurements. Int. J. Remote Sens. 2004, 25, 3593–3623. [Google Scholar]
- Ulaby, F.T.; Moore, R.K.; Fung, A.K. Microwave Remote Sensing: Active and Passive; Artech House: Boston, MA, 1986; Volume 3. [Google Scholar]
- D'Haese, C.; Verhoest, N.E.C.; De Troch, F. Comparison and evaluation of two soil surface roughness measuring techniques: The meshboard method and the ESA - CESBIO laserprofiler.; Technical report, Laboratory of Hydrology and Water Management - Ghent University: Ghent, Belgium, 2000. [Google Scholar]
- Archer, D.J.; Wadge, G. On the use of theoretical models for the retrieval of surface roughness from playa surfaces. Proc. of the 2nd International Workshop on Retrieval of Bio- and Geo-physical Parameters from SAR Data for Land Applications, Noordwijk, The Netherlands; 1998. [Google Scholar]


| Model | Parameter | Value |
|---|---|---|
| Integral Equation Model | ||
| ENVISAT ASAR configuration | Frequency | 5.3 GHz (C-band) |
| Polarization | HH or VV | |
| Incidence angle | 23° | |
| ALOS PALSAR configuration | Frequency | 1.27 GHz (L-band) |
| Polarization | HH or VV | |
| Incidence angle | 34.3° | |
| 4-Component Dielectric Mixing Model | Bulk density | 1.2 g/cm3 |
| Specific density | 2.65 g/cm3 | |
| Sand content | 15% | |
| Clay content | 11.4% | |
| Temperature | 15°C | |
| Sample spacing | |||||
|---|---|---|---|---|---|
| ‘Truth’ (1 mm) | 2mm | 5mm | 10mm | 15mm | |
| s (cm) | 1 | 0.99 (0.00) | 0.98 (0.00) | 0.97 (0.01) | 0.96 (0.02) |
| l (cm) | 5 | 5.02 (0.04) | 5.15 (0.11) | 5.34 (0.22) | 5.47 (0.40) |
| s (cm) | 1 | 1.00 (0.00) | 1.00 (0.00) | 1.00 (0.00) | 0.99 (0.00) |
| l (cm) | 40 | 40.02 (0.04) | 40.07 (0.21) | 40.20 (0.41) | 40.23 (0.37) |
| s (cm) | 2 | 1.99 (0.01) | 1.97 (0.01) | 1.93 (0.02) | 1.91 (0.01) |
| l (cm) | 5 | 5.07 (0.05) | 5.17 (0.08) | 5.43 (0.19) | 5.76 (0.52) |
| s (cm) | 2 | 2.00 (0.00) | 2.00 (0.00) | 2.00 (0.01) | 1.99 (0.01) |
| l (cm) | 40 | 40.03 (0.05) | 40.16 (0.28) | 40.30 (0.45) | 40.26 (0.58) |
| Correct (s,l) | RMSE on s or l due to | |||||
|---|---|---|---|---|---|---|
| 1mm noise | 2mm noise | 5mm noise | ||||
| s (cm) | l (cm) | s (cm) | l (cm) | s (cm) | l (cm) | |
| (1 cm,5 cm) | 0.0019 | 0.0316 | 0.0074 | 0.0775 | 0.0443 | 0.3782 |
| (1 cm,40 cm) | 0.0017 | 0.1673 | 0.0068 | 0.4764 | 0.0421 | 2.9972 |
| (2 cm,5 cm) | 0.0015 | 0.0447 | 0.0043 | 0.0316 | 0.0215 | 0.1265 |
| (2 cm,40 cm) | 0.0009 | 0.0707 | 0.0035 | 0.1871 | 0.0219 | 0.9301 |
| (s,l) of original profile | Soil moisture content (vol%) | RMSE (vol%) of retrieved soil moisture due to | |||
|---|---|---|---|---|---|
| 1 mm noise | 2 mm noise | 5 mm noise | |||
| (1 cm,5 cm) | 5 | 0.04 | 0.11 | 0.54 | |
| (1 cm,5 cm) | 15 | 0.11 | 0.30 | 1.39 | |
| (1 cm,5 cm) | 25 | 0.21 | 0.57 | 2.61 | |
| (1 cm,5 cm) | 35 | 0.34 | 0.92 | 4.15 | |
| (1 cm,40 cm) | 35 | 0.39 | 2.08 | 8.31 | |
| (2 cm,5 cm) | 35 | 0.24 | 0.26 | 0.51 | |
| (2 cm,40 cm) | 35 | 0.23 | 0.46 | 2.76 | |
| Correct roughness values | ||||||||
|---|---|---|---|---|---|---|---|---|
| s (cm) | l (cm) | s (cm) | l (cm) | s (cm) | l (cm) | s (cm) | l (cm) | |
| 1 | 5 | 1 | 40 | 2 | 5 | 2 | 40 | |
| Detrending type | Linear trended surface | |||||||
| Linear 4-m | 0.99 (0.01) | 4.93 (0.13) | 0.91 (0.07) | 30.09 (7.48) | 1.97 (0.03) | 4.76 (0.25) | 1.80 (0.18) | 31.57 (6.00) |
| Piecewise 1-m | 0.92 (0.03) | 3.80 (0.45) | 0.51 (0.04) | 8.31 (1.34) | 1.85 (0.06) | 3.77 (0.40) | 0.98 (0.12) | 7.45 (1.12) |
| Second-order | 0.98 (0.02) | 4.67 (0.29) | 0.81 (0.10) | 24.22 (7.40) | 1.94 (0.04) | 4.51 (0.26) | 1.57 (0.19) | 22.00 (7.58) |
| Third-order | 0.96 (0.02) | 4.36 (0.30) | 0.64 (0.05) | 15.02 (3.96) | 1.93 (0.03) | 4.37 (0.26) | 1.41 (0.16) | 17.84 (6.18) |
| Cosine trended surface | ||||||||
| Linear 4-m | 2.64 (0.13) | 50.07 (2.25) | 2.78 (0.42) | 54.30 (4.68) | 3.07 (0.26) | 28.13 (8.31) | 3.01 (0.74) | 44.81 (7.06) |
| Piecewise 1-m | 0.95 (0.04) | 4.13 (0.49) | 0.58 (0.06) | 9.40 (1.47) | 1.85 (0.05) | 3.79 (0.36) | 1.00 (0.10) | 7.79 (1.47) |
| Second-order | 1.32 (0.13) | 13.48 (6.67) | 1.10 (0.35) | 25.47 (8.16) | 2.17 (0.13) | 7.19 (2.03) | 1.88 (0.27) | 28.38 (8.27) |
| Third-order | 1.04 (0.04) | 5.33 (0.53) | 0.79 (0.12) | 18.16 (4.72) | 1.95 (0.05) | 4.53 (0.30) | 1.47 (0.12) | 18.81 (5.13) |
© 2009 by the authors; licensee Molecular Diversity Preservation International, Basel, Switzerland. This article is an open access article distributed under the terms and conditions of the Creative Commons Attribution license (http://creativecommons.org/licenses/by/3.0/).
Share and Cite
Lievens, H.; Vernieuwe, H.; Álvarez-Mozos, J.; De Baets, B.; Verhoest, N.E.C. Error in Radar-Derived Soil Moisture due to Roughness Parameterization: An Analysis Based on Synthetical Surface Profiles. Sensors 2009, 9, 1067-1093. https://doi.org/10.3390/s90201067
Lievens H, Vernieuwe H, Álvarez-Mozos J, De Baets B, Verhoest NEC. Error in Radar-Derived Soil Moisture due to Roughness Parameterization: An Analysis Based on Synthetical Surface Profiles. Sensors. 2009; 9(2):1067-1093. https://doi.org/10.3390/s90201067
Chicago/Turabian StyleLievens, Hans, Hilde Vernieuwe, Jesús Álvarez-Mozos, Bernard De Baets, and Niko E.C. Verhoest. 2009. "Error in Radar-Derived Soil Moisture due to Roughness Parameterization: An Analysis Based on Synthetical Surface Profiles" Sensors 9, no. 2: 1067-1093. https://doi.org/10.3390/s90201067