Article

H2 Sensing Response of Flame-spray-made Ru/SnO2 Thick Films Fabricated from Spin-Coated Nanoparticles

by
Chaikarn Liewhiran
1,
Nittaya Tamaekong
2,
Anurat Wisitsoraat
3 and
Sukon Phanichphant
2,*
1
Department of Physics and Materials Science, Faculty of Science, Chiang Mai University, Chiang Mai, 50202, Thailand
2
Nanoscience Research Laboratory, Department of Chemistry, Faculty of Science, Chiang Mai University, Chiang Mai, 50202, Thailand
3
National Electronics and Computer Technology Center, Pathumthani, 12120, Thailand
*
Author to whom correspondence should be addressed.
Sensors 2009, 9(11), 8996-9010; https://doi.org/10.3390/s91108996
Submission received: 7 August 2009 / Revised: 21 October 2009 / Accepted: 22 October 2009 / Published: 11 November 2009
(This article belongs to the Special Issue Gas Sensors 2009)

Abstract

:
High specific surface area (SSABET: 141.6 m2/g) SnO2 nanoparticles doped with 0.2–3 wt% Ru were successfully produced in a single step by flame spray pyrolysis (FSP). The phase and crystallite size were analyzed by XRD. The specific surface area (SSABET) of the nanoparticles was measured by nitrogen adsorption (BET analysis). As the Ru concentration increased, the SSABET was found to linearly decrease, while the average BET-equivalent particle diameter (dBET) increased. FSP yielded small Ru particles attached to the surface of the supporting SnO2 nanoparticles, indicating a high SSABET. The morphology and accurate size of the primary particles were further investigated by TEM. The crystallite sizes of the spherical, hexagonal, and rectangular SnO2 particles were in the range of 3–10 nm. SnO2 nanorods were found to range from 3–5 nm in width and 5–20 nm in length. Sensing films were prepared by the spin coating technique. The gas sensing of H2 (500–10,000 ppm) was studied at the operating temperatures ranging from 200–350 °C in presence of dry air. After the sensing tests, the morphology and the cross-section of sensing film were analyzed by SEM and EDS analyses. The 0.2%Ru-dispersed on SnO2 sensing film showed the highest sensitivity and a very fast response time (6 s) compared to a pure SnO2 sensing film, with a highest H2 concentration of 1 vol% at 350 °C and a low H2 detection limit of 500 ppm at 200 °C.

1. Introduction

SnO2 is one of the most promising materials for sensors and it has attracted the attention of scientists interested in gas sensing applications under atmospheric conditions. Semiconducting metal oxides in general, and SnO2 in particular, have been investigated extensively for the purpose of practical applications such as gas leak detecting and environmental monitoring. It is a wide band gap (3.6 eV) n-type semiconductor and the best-understood prototype of oxide-based gas sensors for the detection of reducing gases (like CO [1-6], H2 [6-12], SO2 [13,14], NH3 [15,16], H2S [11,17], C2H5OH [18]) or oxidizing gases (like NO2 [1,5,12], O2 [19,20]) in air. The detection of H2 gas in different industrial applications is especially important for safety reasons. The development of a gas sensor for 10–10,000 ppm of H2 gas is also of high interest since H2 is one of the main gases evolving under pyrolysis in the initial stage of combustion. H2 gas leaks easily from gas lines and systems and is one of the most explosive gases.
The electrical properties of nanocrystalline SnO2 strongly depend on crystallite size and surface state produced by gas adsorption which results in the space charge appearance and band modulation [5]. The flame aerosol synthesis method is one of the most promising routes for the formation of single and multi-component functional nanoparticles at low cost and high production rate from gases in a flame. The sizes of the particles range from a few to several hundred nanometers in diameter, depending on the material and process conditions. The FSP process was systematically investigated using an external-mixing gas-assisted atomizer supported by premixed methane and oxygen flamelets [21-23]. In flame reactors, the energy of the flame is used to drive chemical reactions of precursors resulting in clusters which further grow to nanoparticles by surface growth and/or coagulation and coalescence at high temperatures. Therefore, the FSP is a very promising technique for sensor material fabrication since it enables primary particle and crystal size control [21-24], which are important to improve the sensitivity, as well as the controlled in situ deposition of noble metal clusters [2]. FSP also has the advantage of allowing one to completely manufacture the nanopowder in a single high-temperature step without affecting the microstructure and noble metal particle size in a subsequent annealing process [25]. Moreover, the importance of the size control, the required large and easily accessible surface area (large pore size, no micropores) the desired high crystallinity, the efficiency of noble metal doping (i.e., Pt, Pd, and Ru) and competitive production rates put high demands on any chosen method of nanoparticle production for sensor materials.
The gas sensors based on SnO2 and metal-doped SnO2 nanostructures were found to be good candidates for detecting both reducing and oxidizing gases of various concentrations. Many researchers have reported that pure SnO2 and metal-doped SnO2 could be widely used to detect H2 vapor [6-12]. A summary comparing gas sensing with pure SnO2 and metal-doped SnO2 prepared by several synthetic methods is shown in Table 1. The effect of catalytic Ru doping, as well as the sensing temperature, on the sensor characteristics of sensing films were reported. It has been shown that the sensor characteristics of sensing films are affected by the particles morphology, Ru doping levels, and the operating temperatures, are all important parameters that affect the gas sensing properties in terms of high sensitivity, fast response and recovery time. FSP and spin coating technique have several advantages in producing the nano-sized particles and regular sensing films suitable for the gas sensor. Especially, the Ru additives increase the rate of specific reactions on the surface of SnO2 grain due to spill-over effect of modification of surface energy states. Also, Ru metals were intentionally introduced for certain gases, promoting the receptor function and thus improving the sensing behaviors in terms of the selectivity and time factors. Therefore in the present study, it was of interest to apply FSP for a new production of Ru/SnO2 nanoparticles for use as H2 gas sensor.

2. Experimental

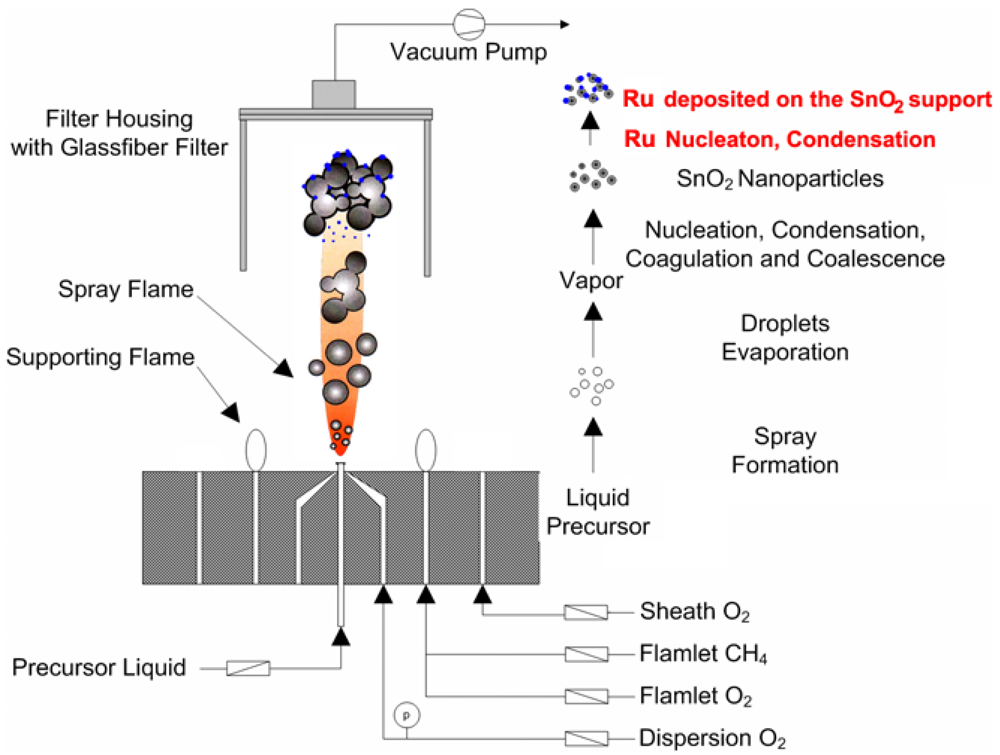
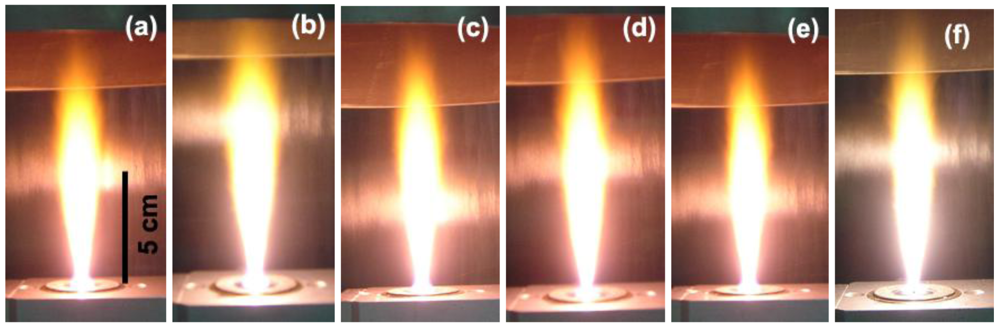
2.1. Flame Synthesis of Nanopowders

The experimental setup for the synthesis of pure SnO2, 0.2–3 wt%Ru/SnO2 nanopowders by FSP is shown in Figure 1. The flame-spray-made (5/5) pure SnO2 was designated as P0 while the SnO2 nanopowders doped with 0.2, 0.6, 1, 2, and 3 wt%Ru were designated as P0.2, P0.6, P1, P2, and P3, respectively. Precursor solutions (0.5 M) were prepared by dissolving appropriate amounts of tin (II) 2-ethylhexanoate (Aldrich, 95%) and ruthenium (III) acetylacetonate (Aldrich, 97%) used as Sn and Ru precursors in xylene (Carlo Erba, 98.5%), respectively. In a typical run, the precursor mixture was fed into a nozzle at a constant feed rate of 5 mL/min using a syringe pump. At the end of the nozzle the precursor solution was dispersed by 4.30 L/min oxygen forming a spray with a pressure drop at the capillary tip kept constant at 1.5 bars by adjusting the orifice gap area. A sheath gas flow of 3.92 L/min of O2 was issued concentrically around the nozzle to stabilize and contain the spray flame. The spray was ignited by supporting flamelets fed with oxygen (2.46 L/min) and methane (1.19 L/min) which are positioned in a ring around the nozzle outlet. The observed flame height was approximately 10-12 cm, and it increased slightly with increasing combustion enthalpy. The combustion enthalpies are directly dependent on the particular solvent, starting materials, and dopants used. Pure SnO2 samples show an light orange and Ru doped samples show light pink color in the base and middle of the flame, and also light orange on the top of the flame, as shown in Figure 2. After evaporation and combustion of precursor droplets, particles are formed by nucleation, condensation, coagulation, coalescence, and Ru deposit on the SnO2 support. Finally, the nanoparticles were collected on a glass microfibre filters (Whatmann GF/A, 25.7 cm in diameter) with the aid of a vacuum pump (Busch, Seco SV 1040C).

2.2. Powder Characterizations

The powder phases were analyzed by X-ray diffraction (XRD) [Phillips X-′pert] using CuKα radiation (20 kV, 20 mA) with a scanning speed of 5°/minute. The specific surface areas of the nanopowders were obtained from BET measurements [Autosorb 1 MP, Quantachrome]. All samples were degassed at 120 °C for 2 h prior to analysis. The diameter of particles were calculated from dBET = 6/SSABET × ρsample, where SSABET is the specific surface area (m2/g), ρsamples are the average density of SnO2 (ρSnO2 = 6.85 g/cm3 [1]) and the density of ruthenium (ρRu = 10.65 g/cm3 taken into account for their weight content of different doping [26]). The accurate morphologies of the nanoparticles and cross-section structures of sensor were analyzed by TEM [JSM-2010, JEOL], SEM [JSM-6335F, JEOL], and EDS analyses.

2.3. Paste and Sensor Preparations

An appropriate quantity of 0.28 mL homogeneous mixed solution was prepared by stirring and heating at 80 °C for 12 hr with ethyl cellulose (Fluka, 30–70 mPa.s) as the temporary binder and terpineol (Aldrich, 90%) as a solvent. The liquid mixture was combined with 60 mg samples of the P0, P0.2, P1, and P3 nanopowders and mixed for 30 min to form a paste prior to spin-coating. The resulting paste was firstly spin-coated at 700 rpm for 10 s, and then subsequently at 3,000 rpm for 30 s on the Al2O3 substrates interdigitated with Au electrodes (0.5 × 0.5 cm) to deposit sensing films. The resulting substrates were annealed in an oven at 150 °C for 1 h with an annealing rate of 1 °C/min and at 400 °C for 1h with an annealing rate of 1 °C/min for binder removal prior to the sensing test [28].

2.4. Sensor Measurement

The sensor characteristics of sensing films were characterized toward the high concentration of H2 gas (500–10,000 ppm). The flow through technique was used to test the gas-sensing properties of sensing films. A constant flux of synthetic air of 2 L/min as gas carrier was flown to mix with the desired concentration of pollutants dispersed in synthetic air. All measurements were conducted in a temperature-stabilized sealed chamber at 20 °C under controlled humidity. The gas flow rates were precisely manipulated using a computer controlled multi-channel mass flow controller. The external NiCr heater was heated by a regulated DC power supply to different operating temperatures. The operating temperature was varied from 200 °C to 350 °C. The resistances of various sensors were continuously monitored with a computer-controlled system by voltage-amperometric technique with 10 V DC bias and current measurement through a picoammeter. The sensor was exposed to a gas sample for ∼5 minutes for each gas concentration testing and then the air flux was restored for 15 minutes. The sensitivity (S) is defined in the following as the resistance ratio Ra/Rg [11,27-30], where Ra is the resistance in dry air, and Rg is the resistance in the test gas. The response time (Tres) is defined as the time required until 90% of the response signal is reached. The recovery time (Trec) denotes the time needed until 90% of the original baseline signal is recovered. After the sensors fabricated using samples P0, P0.2, P1, and P3 had been tested with varied the operating temperatures, they were designated as S0, S0.2, S1, and S3, respectively. Finally, the morphologies, film thickness of sensing layers and elemental compositions were further analyzed by SEM and EDS line-scan mode analyses.

3. Results and Discussion

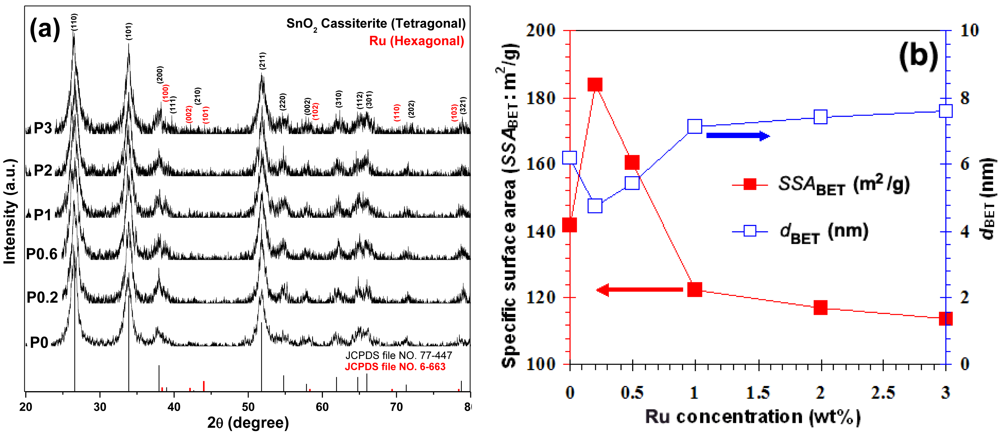
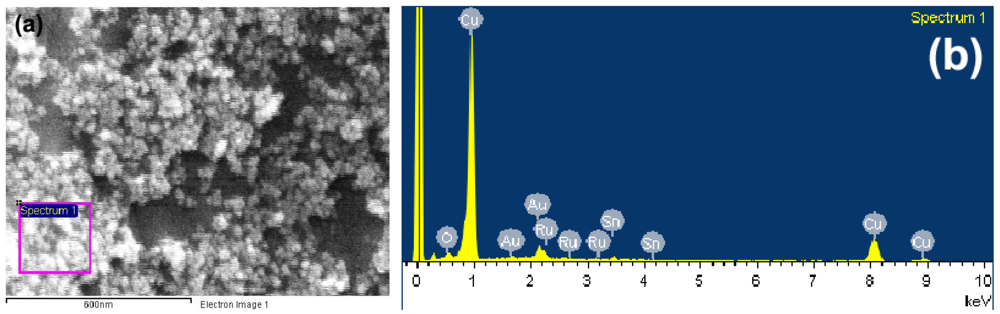
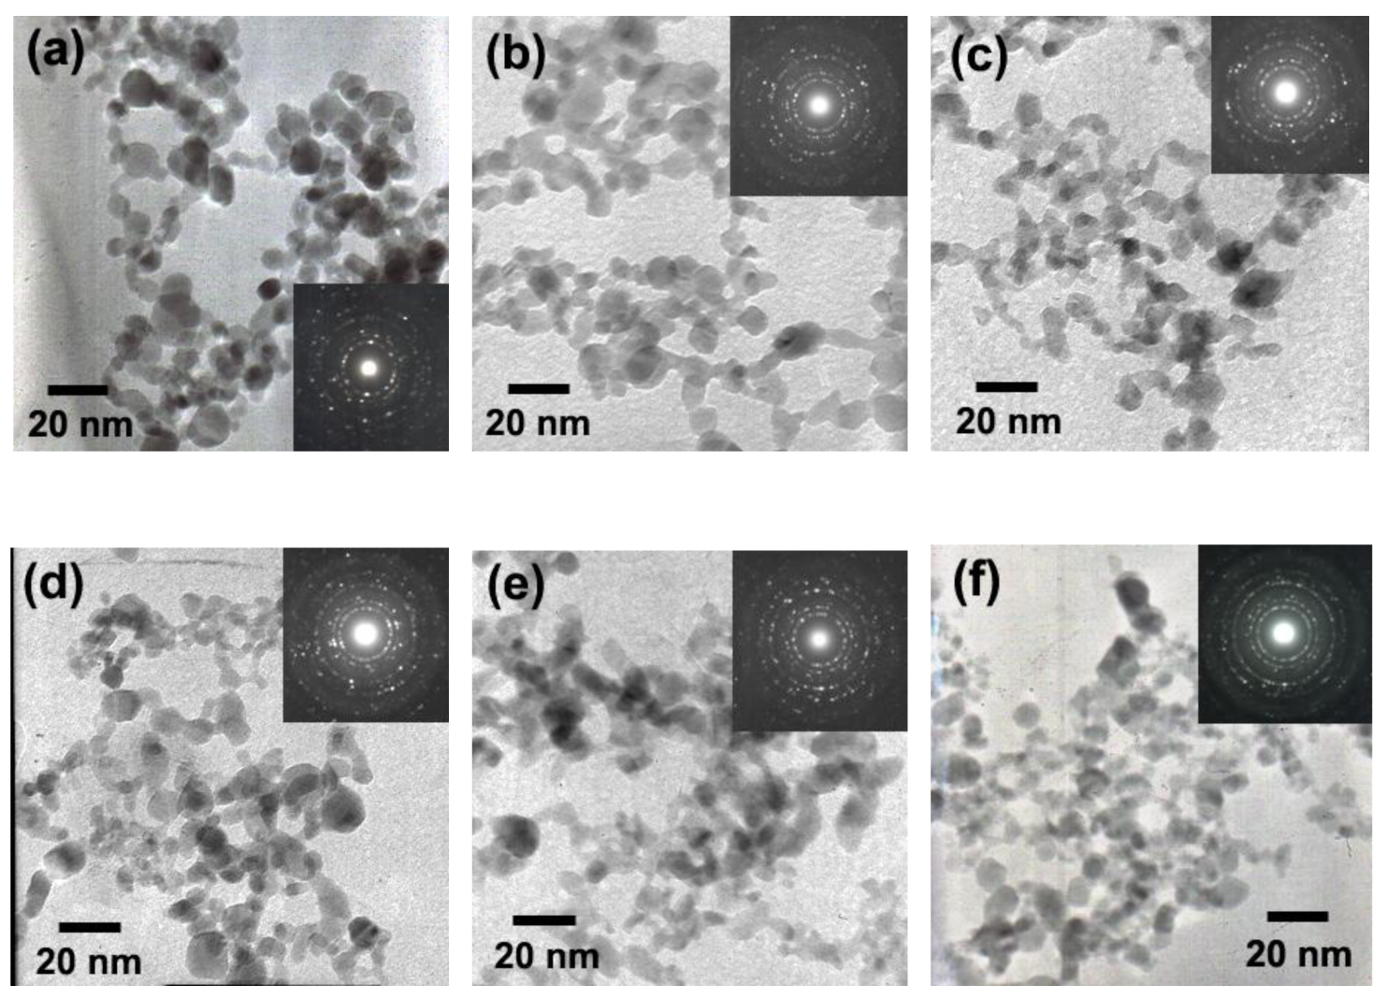
3.1. Nanopowder Properties

Figure 3(a) shows the XRD patterns of flame-spray-made pure SnO2 and 0.2–3 wt%Pd/SnO2 nanopowders. All samples were highly crystalline, and all peaks can be confirmed to be the cassiterite-tetragonal phase of SnO2, which matched well with the JCPDS file No. 77-447. Ru peaks were not found in these patterns (JCPDS file No. 6-663). It can be assumed that the amount of Ru concentration was very low, which affected the appearance of the Ru peaks.
The diffraction peak for 0.2 wt% Ru/SnO2 nanopowder was the broadest compared to other doping levels, suggesting relatively well-dispersed smaller Ru particles. As the Ru concentration increased, all peaks were slightly sharpened and increased in intensity, indicating that the poor-dispersion of larger Ru particles leads to rough agglomeration at higher Ru doping levels. These results were consistent with the BET data, as shown in Figure 3(b). The specific surface area (SSABET) drastically increased from 141.6 m2/g (bare SnO2) to 183.8 m2/g (0.2 wt%Ru/SnO2). When the Ru concentration increased (0.2 to 3 wt%Ru), the SSABET were found to linearly decrease (183.8 to 113.5 m2/g), with an increase in the average BET-equivalent particle diameter (dBET) (bare SnO2: 6.2 nm, 0.2–3 wt%Ru/SnO2: 4.7 to 7.6 nm). This trend was consistent with Niranjan et al. [11] who studied the effect of Ru concentration on crystalline SnO2 nanoparticles. To explain this result, it can be speculated as follows: during the processes of Ru particle formation and deposition on the particle support (SnO2) in the flame, the Ru created a new nucleation center, which in turn changed the nucleation type from homogeneous to heterogeneous, and deteriorated the deposition formation leading to the agglomeration of the tiny Ru particles at high doping levels. This can be confirmed from the accurate morphology by TEM bright-field images. The FSP afforded small Ru particles attached to the surface of the supporting SnO2 nanoparticles indicating a high SSABET. The well-dispersed flame-made 0.2 wt%Ru/SnO2 nanoparticles were confined to the SnO2 surface. The larger crystallite diameters indicate clumping and clusters of Ru, translating into a poor dispersion of the Ru nanoparticles on SnO2 support which affected to the decrease of the SSABET. The SEM micrograph [Figure 4(a)] and the elemental compositions of the agglomerated nanoparticles formed with the sample with the highest Ru concentration (P3) are shown by the EDS spectra in Figure 4(b). Interestingly, the analyzed square regions [Figure 4(b)] were composed of the agglomerated nanoparticles, the copper grid, and gold sputtering prior to an analysis. The EDS spectra showed elemental compositions rich in copper (Cu), caused by the contamination of copper foil, poor gold (Au) caused by the contamination of gold sputtering which used to prepared the samples prior to an analyzing, tin (Sn), oxygen (O), and poor ruthenium (Ru) elements.
Figure 5 (a–f) show TEM bright-field images of P0-P3. The corresponding diffraction patterns are shown in the insets. The diffraction patterns illustrated spot patterns corresponding to the tetragonal-cassiterite structure of SnO2, indicating the SnO2 nanoparticles were highly crystalline, in good agreement with the XRD data. The TEM bright-field images of the FSP (5/5)-made nanoparticles, indicate polyhedral aggregates of primary particles. The morphologies of flame made (5/5) SnO2 and 0.2–3 wt% Ru/SnO2 nanoparticles contained mainly spherical particles, with diameters ranging from 3–10 nm, with occasional rectangular, hexagonal (3–10 nm) and rod-like (3–5 nm in width, and 5–20 nm in length) particles. Ru nanoparticles were not found in these micrographs. This is because Ru is very small when compared with the size of SnO2 nano-support. The primary particle diameters observed by TEM were consistent with the dBET. From these data, it can be clearly seen that the amount of Ru concentrations would not affect to change the size of SnO2 nanoparticles. We could assume this doping formation from the Hume-Rothery rules [31-33], which commonly used to explain the solid mixtures called solid solutions.
In the doping of materials, atoms of the solvent (host material; Sn) are successfully replaced by the solute-atoms (the doping atom; Ru) from their lattice positions (interstitial solid solutions are not discussed here). In the other words, one material gets dissolved in the other, without disturbing the crystal structure, except for lattice distortions (expansions or compressions). For the formation of solid solutions, according to the Hume-Rothery rules, some criteria have to be fulfilled: (1) the atomic radii of the solute (Ru = 178 pm) [34] and solvent (Sn = 145 pm) [34] atoms must differ by no more than 15% (∼22.75%). If not, it is likely to have a low solubility. This is the first rule which must be considered. The atomic size factor was said to be unfavorable; (2) the solute and solvent should have similar electronegativity (Ru = 2.2, Sn = 1.8) [33], compared to the host. If the electronegativity difference is too great, the metals will tend to form intermetallic compounds instead of solid solutions. Its solubility in the host would therefore be limited, because of the so-called electronegative valency effect; (3) a metal with lower valency is more likely to dissolve one which has a higher valency, than vice versa (relative valency effect). The valence electrons are the electrons in the last shell or energy level of an atom. Maximum solubility occurs when the solvent (Sn) [35] and solute (Ru) [36,37] have the same valency. Moreover, the thermodynamic instability of the lower oxidation states of Ru was discussed by Wiley et al. [36-38] to explain their inability to synthesize oxygen deficient Ru-bearing perovskites for catalysis. Although spectroscopic data indicated that other oxidation states (Ru2+, Ru3+, Ru5+) could exist in oxides, species other than Ru4+ generally occurred in mixed-valence phases dominated by Ru4+. Exceptions exist, however, and Ru5+ and even Ru7+ occurred in oxide compounds where there were essential structural constituents and the only Ru species. For this reason, a more precise generalization that Ru4+ was the lowest valence in oxides which was not induced by the special defect equilibrium. Metals with lower valency will tend to dissolve metals with higher valency; and (4) the crystal structures of solute (Ru = hexagonal) and solvent (Sn = tetragonal) must match. Thus the size of particles in the doped sample were not affected by Ru due to the fact that Ru could not get in solid solution into the unit cell of SnO2 crystal structure.

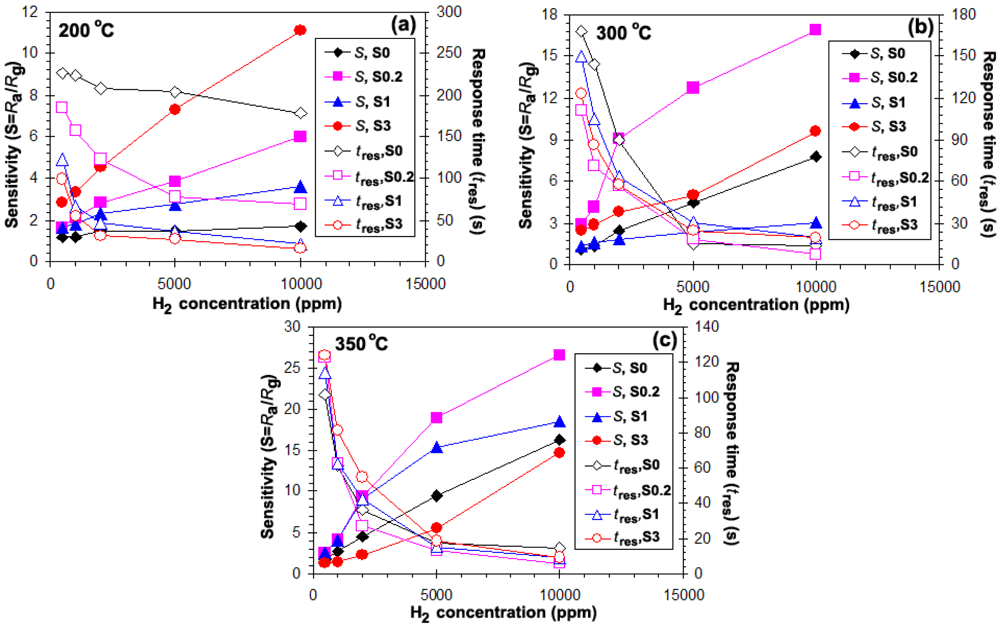
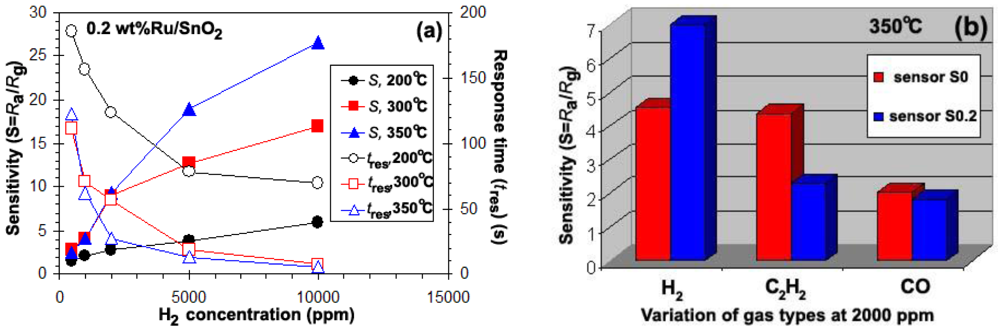
3.2. Gas Sensing Properties

Figures 6(a-c) show the plot of sensitivity (S) and response times (Tres) versus hydrogen concentrations ranging from 500–10,000 ppm for the sensors S0, S0.2, S1, and S3 during a forward cycle at operating temperature ranging from 200–350 °C. It was found that the sensitivity increased with operating temperature to the maximum at 350 °C [Figure 6(c)]. Interestingly, the temperature of maximum sensitivity was found to shift towards lower Ru concentrations, which can be attributed to the effect of particles size and the specific surface area, as a result of a well-dispersed Ru incorporation into the SnO2 matrix. At the operating temperature of 200 °C, the sensitivity of all Ru doping materials was seen to be higher than that of pure SnO2. The sensitivity (filled symbols, left axis) increased and the response time (open symbols, right axis) decreased with increasing H2 concentrations. Moreover, it was found that the highest Ru concentration (3 wt%) showed the best sensing performance in terms of sensitivity (S = 8.6) and response time. The response time of a 3 wt% Ru/SnO2 sensor for 10,000 ppm at 200 °C was 16 s (open circles, right axis), which was better than pure SnO2 (178 s) (open diamonds, right axis) and the other doping levels (0.2 wt% Ru/SnO2 = 70 s (open rectangles, right axis), and 1 wt% Ru/SnO2 = 22 s (open triangles, right axis)). On the other hand, both the operating temperatures of 300 °C and 350 °C had better sensing performance than 200 °C in terms of sensitivity (filled symbols, left axis) and faster response time (open symbols, right axis). Also, in the case of Ru doping the best performance was achieved at a sensor operating temperature of 350 °C. However, the situation was completely different when more Ru was added. Here, 1 wt% (300 °C) and 3 wt% Ru/SnO2 (350 °C) also displayed evidently reduced sensing performance in terms of sensitivity. Note that these tests were performed with a set of four sensors placed in the chamber. The sensitivities of all sensors were found to increase rather linearly with increasing H2 concentrations. As the Ru concentration increased from 0.2 to 3 wt%Ru, the lowest Ru concentration (S0.2) the sensor behaviors improved in terms of the best sensitivity (to 10,000 ppm, S = 27) (filled rectangles, left axis) and very fast response times (Tres = 6 s) (open rectangles, right axis) at 350 °C, which evidently were better than S1, and S3. The sensor S0.2 showed very fast response to H2 gas, whereas the response of the pure SnO2 sensor (S0) was somewhat sluggish. Figures 6(b) and 6(c) indicate the dependence of the sensitivity on the Ru concentration at an operating temperature of 300 °C and 350 °C, respectively. The amount and distribution of Ru species in the SnO2 support were important parameters governing the sensitivity, being maximum (S = 27) at 350 °C for a SnO2 containing 0.2 wt% Ru. The sensitivity consistently increased with increasing H2 concentration. The role of the Ru in enhancing the sensitivity and response rate of the sensor could be due to the electronic interaction between the sensitizer and the semi-conducting material. Ru acts as a catalyst and enhances the reaction rate, especially because χo − χRu < χo − χSn, where χo represents the electronegativity value (χo, χSn, χRu = 3.5, 1.8, 2.2, respectively) [11]. Thus, when oxygen is adsorbed on the Ru zones of strong localization at elevated temperatures, the potential between the SnO2 grains may be raised and as a result, the total resistance increases as compared with the sample without Ru. The decrease of the amount of Ru concentration leads to well-dispersed Ru on the SnO2 surface arising from the chemisorbed oxygen species. Moreover, Figure 7(a) shows the response to high concentrations of H2 (500–10,000 ppm) of sensors which were functionalized in situ with 0.2 wt% Ru. Doping the SnO2 with 0.2 wt% Ru results in a much steeper calibration curve and the highest sensor signal compared to pure SnO2 [see Figure 7(a)]. The higher sensor signal, and especially the higher sensitivity (i.e., the steeper response curve), demonstrate an enhanced sensor performance.
Figure 6 shows the selectivity histogram for 0.2 vol% of different gases at an operating temperature of 350 °C. The sensors S0 and S0.2 exhibited similar selectivity towards the flammable H2 and C2H2 gases and toxic CO gas. This can be attributed to the identical reducing behavior of both gas types. The S0.2 sensor has a good gas selectivity for 0.2 vol% H2 of 7 at 350 °C. The sensitivity of S0.2 sensor of C2H2 and CO gases were 2.3 and 1.8 at 0.2 vol% H2 at 350 °C. Thus, the gas sensitivity of S0.2 sensor was higher than that of C2H2 and CO gases. The H2 selectivity of S0.2 sensor was substantially higher compared to pure SnO2 gas sensor (S0). On the other hand, C2H2 and CO gases sensitivity/selectivity of S0.2 sensor was also evidently deteriorated compared to that of pure SnO2 gas sensor (S0). Ru cannot improve the sensing performance and is unsuitable for use as dopant in SnO2 sensor for both C2H2 and CO gases. This is because the absorption configurations of the gas molecules and the surface fragmentation reactions on the Ru sites are responsible for the similar sensitivity values towards all gases.

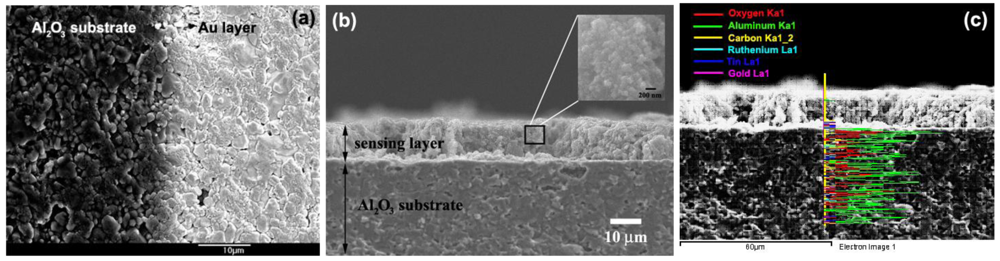
3.3. SEM-Film Thickness Sensing Layer

The microstructures of high density Al2O3 (dark view) substrate interdigitated with Au electrodes (bright view) was evidently seen as the phase boundaries in Figure 8(a). The cross-section, film thickness, and surface morphology of the sensing film layer (S0.2) after a sensing test at 200–350 °C were observed using SEM analysis as shown in Figure 8(b). The film thickness of sensing film was about 10 μm, which was of tremendous benefit to the H2 gas sensing properties. The microstructure of high density Al2O3 substrate was visible. The square emphasized the investigation selected area at high magnification to an aggregated of primary particles after sensing test. The particle sizes of nanoparticles slightly changed after annealing and sensing test were also shown in the inset. In addition, the trends in the elemental composition of the agglomerated nanoparticles formed of sample P0.2 was shown by the EDS line scan mode in Figure 8(c). Interestingly, the analyzed regions composed of the nanoparticles, the copper grid, and gold sputtering prior to an analysis. The line scan across the agglomerate for sensor P0.2 is indicated in Figure 8(c). The elemental-line histograms are shown as a series of solid lines corresponding to a rich in copper (Cu) caused by the contamination of copper grid, poor gold (Au), tin (Sn), oxygen (O), and ruthenium (Ru) elements. After annealing process, a denser film layer was formed. Regularities and preciseness in the film thickness stem from the spin coating technique.

4. Conclusions

FSP was successfully performed for the synthesis of pristine SnO2 and 0.2–3 wt% Ru/SnO2 nanopowders for a H2 gas sensing application. The effect of Ru content on the doping of SnO2 nanoparticles can be assumed according to the Hume-Rothery rules. It was noticed that the Ru could not form into the crystal structure of SnO2 in solid solution, thus the size of particles in the doped samples were not affected by the Ru atoms. The fabricated sensors were prepared by the spin coating technique. It can be concluded that the highest sensitivity and very fast responses to H2 gas were obtained by the incorporation at the lowest concentration of Ru (0.2 wt%) and the highest operating temperature (350 °C). The response time was within 6 s for 1 vol% H2 in presence of dry air. The 0.2 wt%Ru/SnO2 sensor has good gas selectivity for 0.2 vol% H2 at 350 °C.

Acknowledgments

The authors gratefully acknowledge the financial support from the Thailand Research Fund; the Office of Commission on Higher Education; PERCH-CIC; National Nanotechnology Center (NANOTEC), NSTDA, Ministry of Science and Technology, through its program of Center of Excellence Network, Thailand and Service Center (EMRSc), Chiang Mai University, Thailand for experimental facilities and the NECTEC laboratory for the sensor experiments.

References and Notes

  1. Sahm, T; Mädler, L.; Gurlo, A.; Barsan, N.; Pratsinis, S.E.; Weimar, U. Flame spray synthesis of tin dioxide nanoparticles for gas sensing. Sens. Actuat. B-Chem. 2004, 98, 148–153. [Google Scholar]
  2. Mädler, L.; Roessler, A.; Pratsinis, S.E.; Sahm, T.; Gurlo, A.; Barsan, N.; Weimar, U. Direct formation of highly porous gas-sensing films by in situ thermophoretic deposition of flame-made Pt/SnO2 nanoparticles. Sens. Actuat. B-Chem. 2005, 114, 283–295. [Google Scholar]
  3. Mädler, L.; Sahm, T.; Gurlo, A.; Grunwaldt, J.-D.; Barsan, N.; Weimar, U.; Pratsinis, S.E. Sensing low concentrations of CO using flame-spray-made Pt/SnO2 nanoparticles. J. Nanopart. Res. 2006, 8, 783–796. [Google Scholar]
  4. Ponce, M.A.; Castro, M.S.; Aldao, C.M. Resistance and capacitance analysis of Pd-doped and undoped SnO2 thick films sensors exposed to CO atmospheres. Ceram. Inter. 2006, 32, 733–737. [Google Scholar]
  5. Safonova, O.V.; Rumyantseva, M.N.; Ryabova, L.I.; Labeau, M.; Delabouglise, G.; Gaskov, A.M. Effect of combined Pd and Cu doping on microstructure, electrical and gas sensor properties of nanocrystalline tin dioxide. Mater. Sci. Eng. 2001, B85, 43–49. [Google Scholar]
  6. Baik, N.S.; Sakai, G.; Miura, N.; Yamazoe, N. Hydrothermally treated sol solution of tin oxide for thin-film gas sensor. Sens. Actuat. B-Chem. 2000, 63, 74–79. [Google Scholar]
  7. Katsuki, A.; Fukui, K. H2 selective gas sensor based on SnO2. Sens. Actuat. B-Chem. 1998, 52, 30–37. [Google Scholar]
  8. Chi-Hwan, H.; Sang-Do, H.; Singh, I.; Toupance, T. Micro-bead of nano-crystalline F-doped SnO2 as a sensitive hydrogen gas sensor H2 selective gas sensor based on SnO2. Sens. Actuat. B-Chem. 2005, 109, 264–269. [Google Scholar]
  9. Salehi, A. Selectivity enhancement of indium-doped SnO2 gas sensors. Thin Solid Films. 2002, 416, 260–263. [Google Scholar]
  10. Ryzhikov, A.S.; Shatokhin, A.N.; Putilin, F.N.; Rumyantseva, M.N.; Gaskov, A.M.; Labeau, M. Hydrogen sensitivity of SnO2 thin films doped with Pt by laser ablation. Surf. Coat. Technol. 2005, 107, 387–391. [Google Scholar]
  11. Niranjan, R.S.; Hwang, Y.K.; Kim, D.-K.; Jhung, S.H.; Chang, J.-S.; Mulla, I.S. Nanostructured tin oxide: Synthesis and gas-sensing properties. Mater. Chem. Phys. 2005, 92, 384–388. [Google Scholar]
  12. Hyodo, T.; Sasahara, K.; Shimizu, Y.; Egashira, M. Preparation of macroporous SnO2 films using PMMA microspheres and their sensing properties to NOx and H2. Sens. Actuat. B-Chem. 2005, 106, 580–590. [Google Scholar]
  13. Bukun, N; Vinokurov, A.; Vinokurova, M.; Derlyukova, L.; Dobrovolsky, Y.; Levchenko, A. Chemisorption and electrochemical reactions of SO2 on modified SnO2 electrodes. Sens. Actuat. B-Chem. 2005, 106, 153–157. [Google Scholar]
  14. Lančok, J.; Santoni, A.; Penza, M.; Loreti, S.; Menicucci, I.; Minarini, C.; Jelinek, M. Tin oxide thin films prepared by laser-assisted metal-organic CVD: Structural and gas sensing properties. Surf. Coat. Technol. 2005, 200, 1057–1060. [Google Scholar]
  15. Wang, Y.D.; Wu, X.H.; Su, Q.; Li, Y.F.; Zhou, Z.L. Ammonia-sensing characteristics of Pt and SiO2 doped SnO2 materials. Solid-state Elec. 2001, 45, 347–350. [Google Scholar]
  16. Teeramonglonrasmee, A.; Sriyudthsak, M. Methanol and ammonia sensing characteristics of sol-gel derived thin film gas sensor. Sens. Actuat. B-Chem. 2000, 66, 256–259. [Google Scholar]
  17. Jin, C.; Yamazaki, T.; Ito, K.; Kikuta, T.; Nakatani, N. H2S sensing properties of porous SnO2 sputerred films coated with various doping films. Vacuum. 2006, 80, 723–725. [Google Scholar]
  18. Rella, R.; Serra, A.; Siciliano, P.; Vasanelli, L.; De, G.; Licciulli, A.; Quirini, A. Tin oxide-based gas sensors prepared by the sol-gel process. Sens. Actuat. B-Chem. 1997, 44, 462–467. [Google Scholar]
  19. Tiburcio-Silver, A.; Sánchez-Juárez, A. SnO2:Ga thin films as oxygen gas sensor. Mater. Sci. Eng. 2004, 110, 268–271. [Google Scholar]
  20. Maffeïs, T.G.G.; Owen, G.T.; Penny, M.W.; Starke, T.K.H.; Clark, S.A.; Ferkel, H.; Wilks, S.P. Nano-crystalline SnO2 gas sensor response to O2 and CH4 at elevated temperature investigated by XPS. Surf. Sci. 2002, 520, 29–34. [Google Scholar]
  21. Pratsinis, S.E. Flame aerosol synthesis of ceramic powders. Prog. Energ. Combust. 1998, 24, 197–219. [Google Scholar]
  22. Mädler, L.; Kammler, H.K.; Mueller, R.; Pratsinis, S.E. Controlled synthesis of nanostructured particles by flame spray pyrolysis. J. Aeros. Sci. 2002, 33, 369–389. [Google Scholar]
  23. Mueller, R.; Mädler, L.; Pratsinis, S.E. Nanoparticle synthesis at high production rates by flame spray pyrolysis. Chem. Eng. Sci. 2003, 58, 1969–1976. [Google Scholar]
  24. Mädler, L.; Stark, W.J.; Pratsinis, S.E. Rapid synthesis of stable ZnO quantum dots. J. Appl. Phys. 2002, 92, 6537–6540. [Google Scholar]
  25. Kammler, H.K.; Mädler, L.; Pratsinis, S.E. Flame synthesis of nanoparticles. Chem. Eng. Tech. 2001, 24, 583–596. [Google Scholar]
  26. Lide, D. R. Properties of the elements and inorganic compounds. In CRC Handbook of Chemistry and Physics., 87th ed.; Taylor & Francis: New York, NY, USA, 2006; pp. 4–141. [Google Scholar]
  27. Liewhiran, C.; Phanichphant, S. Influence of thickness on ethanol sensing characteristics of doctor-bladed thick film from flame-made ZnO nanoparticles. Sensors. 2007, 7, 185–201. [Google Scholar]
  28. Liewhiran, C.; Phanichphant, S. Improvement of flame-made nanoparticulate thick film morphology for ethanol sensing. Sensors. 2007, 7, 650–675. [Google Scholar]
  29. Liewhiran, C.; Phanichphant, S. Effects of palladium loading on the response of a thick film flame-made zno gas sensor for detection of ethanol vapor. Sensors. 2007, 7, 1159–1184. [Google Scholar]
  30. Liewhiran, C.; Phanichphant, S. Doctor-bladed thick films of flame-made Pd/ZnO nanoparticles for ethanol sensing. Curr. Appl. Phys. 2008, 8, 336–339. [Google Scholar]
  31. Takeuchi, T.; Sato, H.; Mizutani, U. Investigation of Hume-Rothery stabilization mechanism from an initio band calculation for different electron compounds: Cu5Zn8 and Al-Mg-Zn, Al-Cu-Ru-Si approximants. J. Alloy. Compd. 2002, 342, 355–359. [Google Scholar]
  32. Kreiner, G.; Moguilnikov, Y.; Burkhardt, U.; Schäpers, M. Hume-Rothery controlled formation of structurally complex alloy phases in the ternary Ga-Mg-Pd system. J. Non-Cryst. Solids. 2004, 334-335, 17–22. [Google Scholar]
  33. Tsai, A.-P. A test of Hume-Rothery rules for stable quasicrystals. J. Non-Cryst. Solids. 2004, 334-335, 317–222. [Google Scholar]
  34. Clementi, E.; Raimondi, D.L.; Reinhardt, W.P. Atomic Screening Constants from SCF Functions. II. Atoms with 37 to 86 Electrons. J. Chem. Phys. 1967, 47, 1300–1307. [Google Scholar]
  35. Lide, D.R. Properties of solid. In CRC Handbook of Chemistry and Physics., 87th ed.; Taylor & Francis: New York, NY, USA, 2006; pp. 12–209. [Google Scholar]
  36. Capobianco, C.J. Ruthenium solubility in hematite. Amer. Mineral. 1998, 83, 1152–1160. [Google Scholar]
  37. Wiley, J.B.; Poeppelmeier, K.R. Reduction chemistry of platinum group metal perovskites. Mater. Res. Bull. 1991, 26, 1201–1210. [Google Scholar]
  38. Kaim, W.; Sarkar, B. Mixed valency in ruthenium complexes-coordinative aspects. Coordin. Chem. Rev. 2007, 251, 584–594. [Google Scholar]
Figure 1. Schematic of the FSP experimental set up for the synthesis of samples P0-P3.
Sensors 09 08996f1
Figure 2. Spray flame of: (a) pure SnO2, (b–f) 0.2–3 wt% Ru/SnO2 nanoparticles producing 5 ml/min of liquid precursor feed rate and dispersed by O2 (5 l/min) at 1.5 bar pressure drop across the nozzle tip. The flame heights were observed ranging from 10–12 cm with slight increasing the combustion enthalpy and Ru concentrations.
Sensors 09 08996f2
Figure 3. (a) XRD and (b) BET data of flame-made (5/5) 0–3 wt%Ru/SnO2 as-prepared (P0-P3).
Sensors 09 08996f3
Figure 4. (a) SEM micrographs of P3 samples. The EDS spectra for the square region indicated in (b) P3 sample contain Ru deposited on SnO2 support spin-coated on the Au/Al2O3 substrate.
Sensors 09 08996f4
Figure 5. (a) shows TEM bright-field images of highly crystalline flame-made (5/5) SnO2 nanoparticles (P0) and (b–f) 0.2–3 wt%Ru/SnO2 nanoparticles (P0.2-P3) with the same magnifications. Insets show the corresponding diffraction patterns of the nanoparticles.
Sensors 09 08996f5
Figure 6. (a–c) Sensing performance in the terms of the sensitivity (filled symbols, left axis) and corresponding response times (open symbols, right axis) of pure SnO2 (S0) sensors and doped with 0.2, 1, 3 wt% (S0.2, S1, S3) sensors as a function of H2 concentration in dry air at (a) 200, (b) 300, and (c) 350 °C. The sensitivity increased and the response times decreased with increasing H2 concentration.
Sensors 09 08996f6
Figure 7. (a) Sensing performance in the terms of the sensitivity (filled symbols, left axis) and corresponding response times (open symbols, right axis) of 0.2 wt%Ru/SnO2 (S0.2) sensors as a function of H2 concentration in dry air at 200 °C (circles), 300 °C (rectangles), and 350 °C (triangles). The sensitivity increased and the response times decreased with increasing H2 concentration and operating temperature. (b) Selectivity histogram of pure SnO2 and containing 0.2 wt%Ru for different gases (0.2%vol) at 350 °C.
Sensors 09 08996f7
Figure 8. (a) the phase boundaries of microstructures of high density Al2O3 (dark view, left) substrate interdigitated with Au electrodes (bright view, right), (b) The film thickness was approximately 10 μm (P0.2) spin-coated onto Au/Al2O3 substrate (side view) cross-section after sensing at 350 °C in dry air (S0.2). The square emphasizes how the particle sizes are slightly changed after the annealing and sensing test was also shown in the inset and (c) EDS elemental-line scan analysis.
Sensors 09 08996f8
Table 1. Summary on comparison of metal-doped SnO2 with several methods for gas sensing.
AuthorsMethodDoping levelGas ConcentrationSensing performances
Sahm et al. [1]FSP (nanopowders)
Drop coating (sensors)
Pure SnO2NO2 (10–5,000 ppb),
CO (500–10,000 ppm),
propanol (10–300 ppm)
NO2; Sensitivity: ∼20 to 5,000 ppb at 220 °C
Propanal; Sensitivity: ∼300 to 150 ppm at 220 °C
Mädler et al. [2]FSP (nanopowders)
Thermophoretic deposition (sensors)
0.2 wt%Pt/SnO2CO; 50 ppmSensitivity: 8 to 50 ppm at 350 °C
Salehi [9]Evaporation, Chemical Vapor Deposition, Spray Pyrolysis, SputteringIn/SnO2H2; 500–3,000 ppmResponse to 7% H2 at 200 °C of 0.5 s
Ryzhikov et al. [10]Magnetron Sputtering: Sensing film;
Laser Ablation: Doping process
Pt/SnO2H2; 20–20,000 ppmSensitivity: 630 to 1,000 ppm at 300 °C
Niranjan et al. [11]Modified Pechini Route0.2–0.7 wt%Ru/SnO2H2; 700 vol ppm0.6 wt%Ru/SnO2 Sensitivity: 150 at 275 °C
Response time: 3 s at 275 °C
Recovery time: 5–10 min at 275 °C

