An Approach for Rapid Assessment of Seismic Hazards in Turkey by Continuous GPS Data

Abstract
:1. Introduction
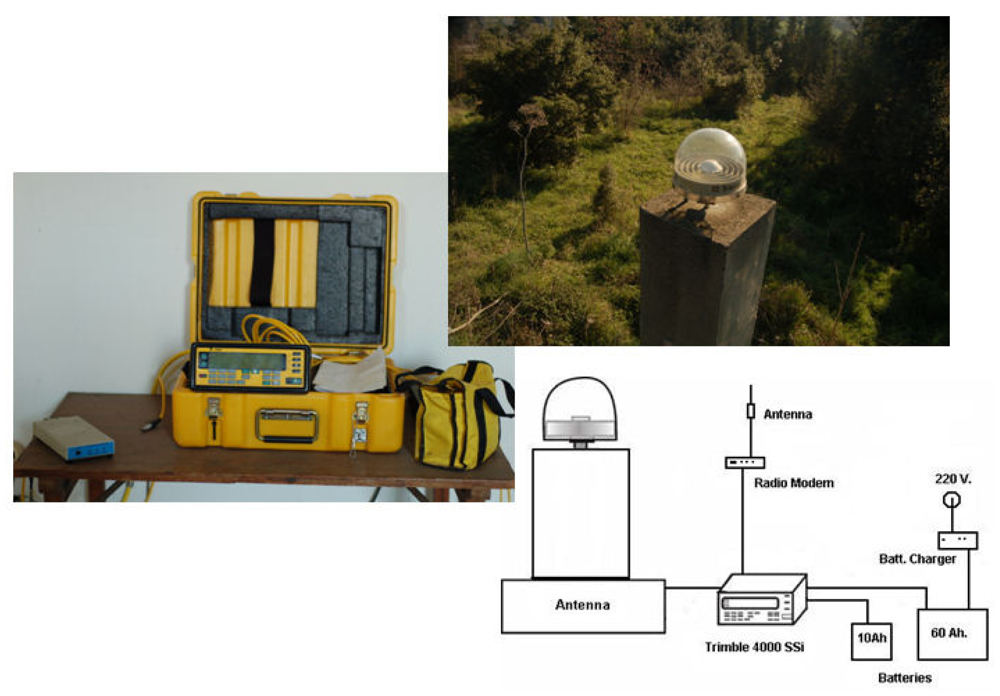
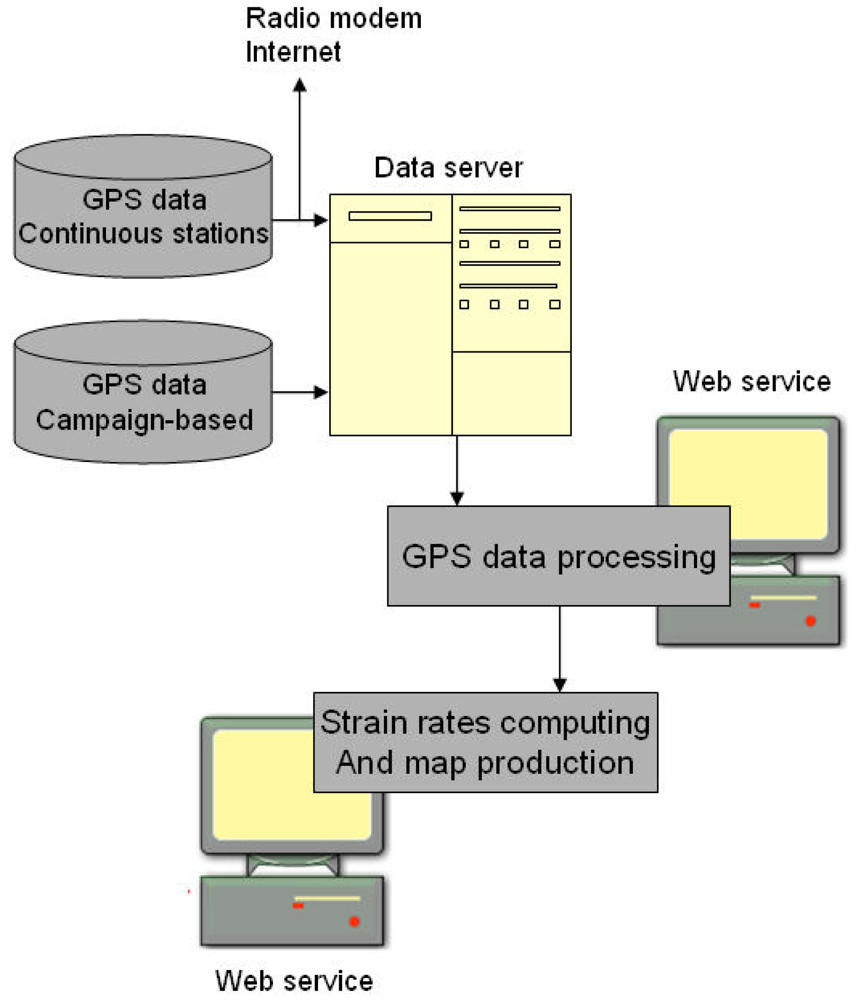
2. Continuous GPS Sensors
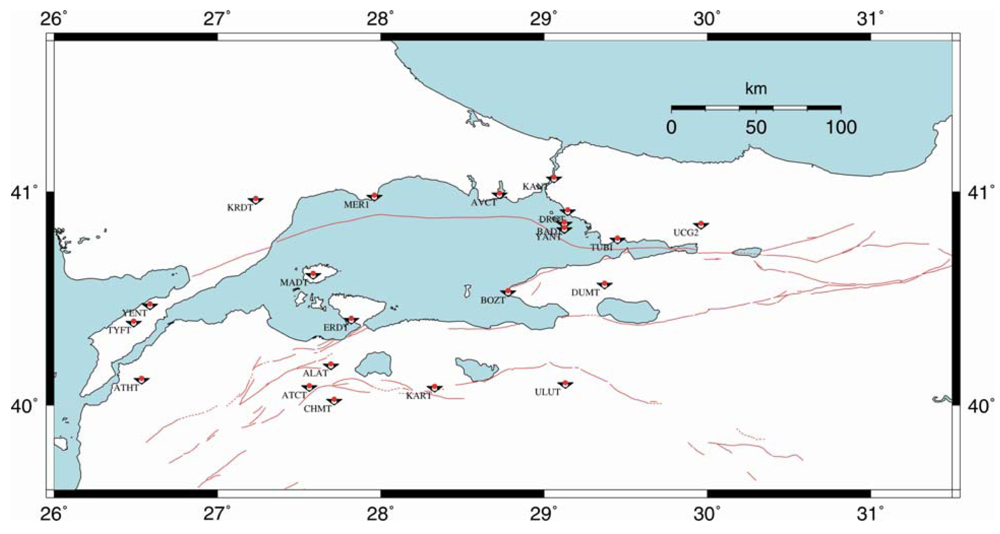
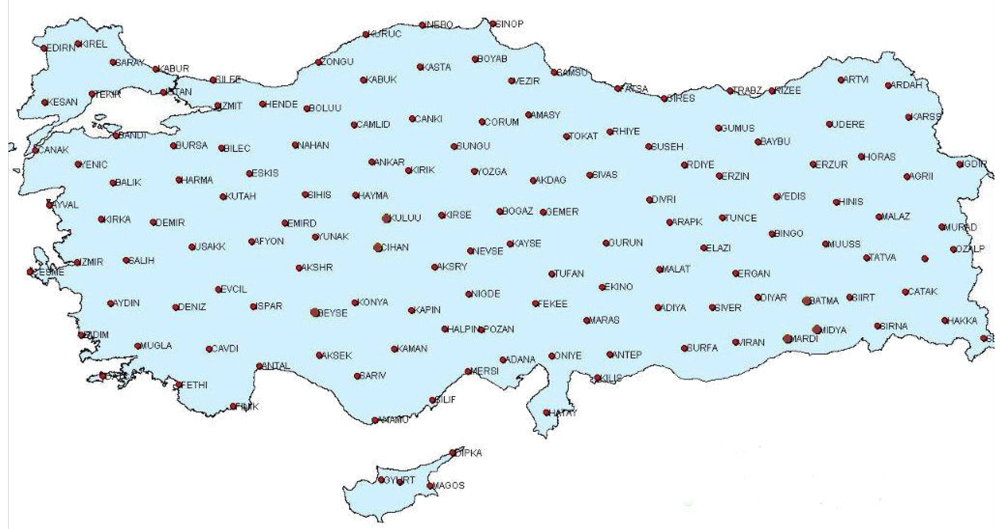
3. Case Study: Seismic Hazard Assessment by Strain Using Continuous GPS Data
4. Results
5. Discussion
Acknowledgments
References and Notes
- United Nations Development Programme Home Page. http://www.undp.org (accessed January 22, 2008).
- Ergintav, S.; Burgmann, R.; McClusky, S.; Cakmak, R.; Reilinger, R.; Lenk, O.; Barka, A.; Ozener, H. Postseismic Deformation Near the Izmit Earthquake (08/17/1999, M = 7.5) Rupture Zone. Bull. Seismol. Soc. Amer. 2002, 92, 194–207. [Google Scholar]
- Uzel, T; Eren, K. CORS-TR Project (Summary): Establishment of International CORS System and Determination of Datum Transformation Parameters. Istanbul Kultur University. http://cors-tr.iku.edu.tr (accessed January 23, 2008).
- Delin, K.A. The Sensor Web: A Macro-Instrument for Coordinated Sensing. Sensors 2002, 2, 270–285. [Google Scholar]
- Sensor Web at Geomatics University of Calgary Home Page. http://sensorweb.geomatics.ucalgary.ca (accessed February 4, 2008).
- Haines, A.J.; Holt, W.E. A Procedure to Obtain the Complete Horizontal Motions Within Zones of Distributed Deformation From the Inversion of Strain Rate Data. J. Geophys. Res. 1993, 98, 12057–12082. [Google Scholar]
- Haines, A.J.; Jackson, J.A.; Holt, W.E.; Agnew, D.C. Representing Distributed Deformation by Continuous Velocity Field; Institute of Geological & Nuclear Sciences: Wellington, New Zealand, 1998; Volume 5, pp. 1–121. [Google Scholar]
- Ambraseys, N.N.; Finkel, C.F. The Seismicity of Turkey and Adjacent Areas, A Historical Review; Eren: Istanbul, Turkey, 1995; pp. 1500–1800. [Google Scholar]
- Global CMT Web Page. http://www.globalcmt.org (accessed January 23, 2008).
- KOERI Earthquake Catalog, Bogazici University, Kandilli Observatory and Earthquake Research Institute, National Earthquake Monitoring Center, Waveform Data Request System. May 2006. http://barbar.koeri.boun.edu.tr/sismo/zKDRS/bilgi.htm (accessed January 23, 2008).
- Ergintav, S.; Dogan, U.; Gerstenecker, C.; Cakmak, R.; Belgen, A.; Demirel, H.; Aydin, C.; Reilinger, R. A Snapshot (2003–2005) of the 3D Postseismic Deformation for the 1999, Mw = 7.4 Izmit Earthquake in the Marmara Region, Turkey, by First Results of Joint Gravity and GPS Monitoring. J. Geodynamics 2007, 44, 1–18. [Google Scholar]
- King, R.W.; Bock, Y. Documentation for the GAMIT GPS Analysis Software; Massachusetts Institute of Technology: Cambridge, MA, USA, 2004. [Google Scholar]
- Herring, T.A. GLOBK Global Kalman Filter VLBI and GPS Analysis Program; Massachusetts Institute of Technology: Cambridge, MA, USA, 2004. [Google Scholar]


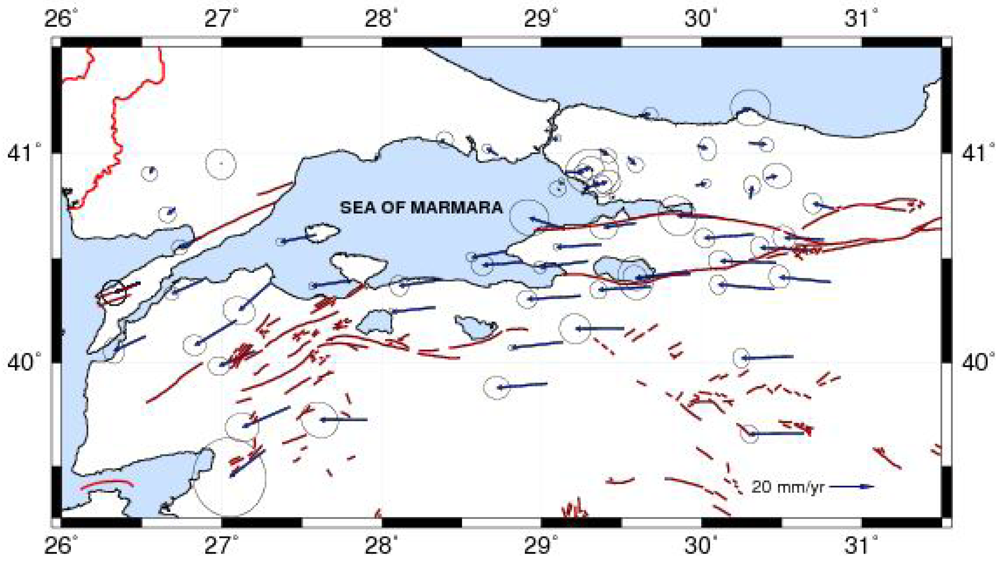
| Site | Longitude (°) | Latitude (°) | Evel (mm/yr) | Nvel (mm/yr) | Esig (mm/yr) | Nsig (mm/yr) | RHO |
|---|---|---|---|---|---|---|---|
| ALAP | 31.417 | 41.201 | 7.42 | 5.23 | 4.35 | 3.08 | -0.076 |
| AKKO | 31.198 | 41.045 | 7.05 | 9.77 | 3.08 | 2.65 | -0.093 |
| CMLN | 30.916 | 40.118 | -24.81 | 2.19 | 0.97 | 0.82 | -0.063 |
| KDER | 30.827 | 40.735 | -9.62 | 2.49 | 0.94 | 0.88 | -0.067 |
| TEBA | 30.804 | 40.386 | -23.00 | 2.25 | 1.07 | 0.94 | -0.052 |
| AGOK | 30.761 | 40.589 | -17.73 | 0.78 | 1.10 | 1.05 | -0.103 |
| AGUZ | 30.680 | 40.538 | -22.79 | 1.20 | 0.98 | 0.88 | -0.083 |
| ESKI | 30.637 | 39.658 | -24.38 | -0.35 | 0.81 | 0.81 | -0.118 |
| MHGZ | 30.570 | 40.028 | -23.34 | -0.65 | 0.91 | 0.76 | -0.048 |
| DGCT | 30.462 | 40.478 | -25.01 | 0.82 | 0.93 | 1.08 | -0.073 |
| SEYH | 30.453 | 40.351 | -25.32 | 2.15 | 0.90 | 0.76 | -0.051 |
| CALT | 30.405 | 40.880 | 4.76 | 1.19 | 1.12 | 1.34 | -0.080 |
| SEFI | 30.325 | 40.612 | -22.25 | -1.63 | 0.88 | 0.96 | -0.107 |
| KAZI | 30.303 | 40.785 | 0.79 | 5.83 | 0.85 | 0.79 | -0.047 |
| KANR | 30.294 | 41.048 | 7.88 | -0.81 | 0.66 | 0.67 | -0.094 |
| KFKT | 30.229 | 41.187 | 5.40 | 2.48 | 1.67 | 1.83 | -0.029 |
| SMAS | 30.134 | 40.690 | -20.73 | 1.08 | 1.83 | 1.75 | -0.091 |
| AKCO | 29.973 | 41.034 | 4.48 | -1.41 | 1.10 | 0.78 | -0.056 |
| UCG2 | 29.962 | 40.846 | 4.71 | 0.98 | 0.40 | 0.41 | -0.038 |
| IUCK | 29.929 | 40.425 | -24.64 | -1.89 | 1.99 | 1.63 | -0.062 |
| IGAZ | 29.908 | 40.438 | -23.31 | -3.09 | 1.16 | 1.10 | -0.097 |
| DERB | 29.681 | 40.362 | -23.49 | -1.42 | 0.82 | 0.76 | -0.067 |
| SILE | 29.623 | 41.179 | 4.04 | 0.37 | 0.63 | 0.67 | -0.063 |
| OLUK | 29.585 | 40.667 | -14.29 | -1.96 | 1.10 | 1.26 | -0.061 |
| OVCT | 29.539 | 40.980 | 3.41 | -3.46 | 0.68 | 0.75 | -0.038 |
| HMZA | 29.514 | 40.164 | -22.00 | -0.24 | 1.37 | 1.42 | -0.029 |
| TUBI | 29.451 | 40.787 | -1.15 | 0.80 | 0.29 | 0.26 | -0.037 |
| DUMT | 29.372 | 40.566 | -20.16 | -1.16 | 0.32 | 0.31 | -0.039 |
| KRDM | 29.362 | 41.017 | 3.79 | -2.90 | 0.67 | 0.74 | -0.057 |
| IBBT | 29.321 | 40.866 | 2.82 | -2.22 | 1.02 | 1.18 | 0.014 |
| HART | 29.310 | 40.927 | 0.42 | -1.60 | 2.10 | 2.43 | -0.029 |
| KUTE | 29.288 | 40.485 | -21.64 | -2.77 | 0.55 | 0.59 | -0.043 |
| KAMT | 29.273 | 40.834 | 9.78 | 2.75 | 1.09 | 1.23 | 0.030 |
| ERCT | 29.243 | 40.319 | -24.05 | -1.44 | 0.81 | 0.91 | -0.028 |
| YACT | 29.238 | 40.917 | 4.94 | 1.14 | 1.03 | 1.19 | 0.000 |
| DRGT | 29.145 | 40.909 | 8.18 | -0.27 | 0.77 | 0.85 | -0.033 |
| CINA | 29.143 | 40.639 | -15.87 | 5.07 | 1.66 | 1.81 | -0.091 |
| ULUT | 29.131 | 40.098 | -23.02 | -2.59 | 0.30 | 0.28 | -0.041 |
| BAD1 | 29.118 | 40.852 | 0.26 | 1.21 | 0.31 | 0.29 | -0.037 |
| YANT | 29.113 | 40.820 | -1.05 | 0.96 | 0.70 | 0.76 | -0.050 |
| KANT | 29.061 | 41.061 | 2.90 | 0.87 | 0.31 | 0.30 | -0.038 |
| BLOT | 29.033 | 39.899 | -22.61 | -1.93 | 1.03 | 1.19 | -0.021 |
| ISTA | 29.019 | 41.104 | 1.84 | 0.35 | 0.29 | 0.27 | -0.037 |
| FIST | 28.882 | 40.481 | -18.27 | -1.47 | 0.92 | 1.01 | -0.014 |
| BOZT | 28.782 | 40.534 | -15.92 | -2.82 | 0.46 | 0.48 | -0.042 |
| AVCT | 28.724 | 40.989 | -4.900 | 3.10 | 0.41 | 0.42 | -0.053 |
| YENN | 28.373 | 40.398 | -19.10 | -2.82 | 0.93 | 0.85 | -0.069 |
| SELP | 28.365 | 41.052 | 2.09 | 1.01 | 0.75 | 0.76 | -0.051 |
| KART | 28.333 | 40.265 | -19.73 | -2.10 | 0.28 | 0.26 | -0.043 |
| MER1 | 27.962 | 40.967 | 1.07 | 1.88 | 0.29 | 0.26 | -0.035 |
| BALI | 27.906 | 39.722 | -21.20 | 0.08 | 1.65 | 1.69 | -0.104 |
| ERDT | 27.808 | 40.393 | -17.65 | -2.56 | 0.31 | 0.30 | -0.043 |
| MADT | 27.587 | 40.611 | -15.91 | -3.29 | 0.37 | 0.38 | -0.036 |
| ALAN | 27.424 | 39.785 | -21.26 | -9.15 | 1.31 | 1.54 | -0.013 |
| KABI | 27.301 | 40.381 | -13.88 | -12.43 | 1.28 | 1.45 | -0.106 |
| EGMI | 27.269 | 39.577 | -15.95 | -12.24 | 3.61 | 3.33 | -0.020 |
| ASMT | 27.204 | 40.054 | -16.01 | -6.70 | 0.87 | 0.97 | -0.046 |
| BKCT | 27.091 | 40.203 | -18.83 | -11.33 | 0.93 | 1.05 | -0.037 |
| KRDT | 26.999 | 40.951 | -0.44 | -0.37 | 1.39 | 1.37 | -0.051 |
| SEVK | 26.880 | 40.396 | -13.90 | -6.14 | 0.61 | 0.67 | -0.029 |
| KVAK | 26.871 | 40.601 | -9.59 | -4.65 | 0.69 | 0.73 | -0.004 |
| DOKU | 26.706 | 40.739 | -3.45 | -3.01 | 0.71 | 0.80 | -0.048 |
| BGNT | 26.570 | 40.932 | -1.56 | -2.86 | 0.66 | 0.72 | -0.037 |
| ATHT | 26.524 | 40.126 | -14.28 | -6.59 | 1.17 | 0.96 | -0.042 |
| TYFT | 26.487 | 40.383 | -11.54 | -4.66 | 1.12 | 1.10 | -0.050 |
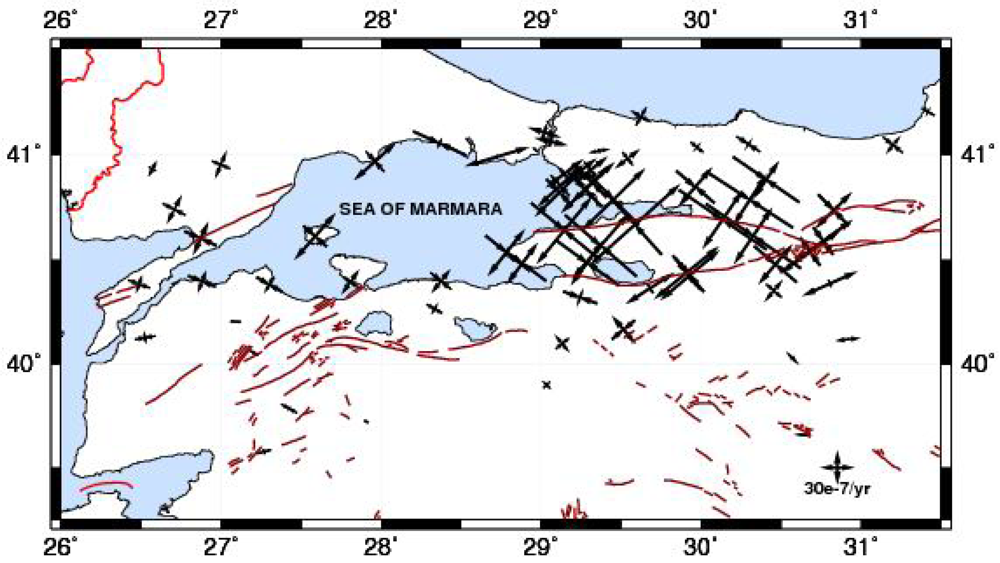
| Site | Longitude (°) | Latitude (°) | ε1 (10-7 year-1) | ε2 (10-7 year-1) | Azimuth (°) |
|---|---|---|---|---|---|
| ALAP | 31.417 | 41.201 | 0.20 | -0.47 | 27.579 |
| AKKO | 31.198 | 41.045 | 0.63 | -0.81 | 39.005 |
| CMLN | 30.916 | 40.118 | 0.69 | -0.03 | 83.628 |
| KDER | 30.827 | 40.735 | 1.59 | -1.46 | 45.174 |
| TEBA | 30.804 | 40.386 | 1.87 | -0.22 | 65.961 |
| AGOK | 30.761 | 40.589 | 2.30 | -1.10 | 54.433 |
| AGUZ | 30.680 | 40.538 | 2.35 | -1.11 | 54.292 |
| ESKI | 30.637 | 39.658 | 0.42 | -0.05 | 92.415 |
| MHGZ | 30.570 | 40.028 | 0.44 | -0.11 | 135.090 |
| DGCT | 30.462 | 40.478 | 1.61 | -1.86 | 40.386 |
| SEYH | 30.453 | 40.351 | 0.80 | -0.64 | 39.668 |
| CALT | 30.405 | 40.880 | 1.39 | -2.67 | 34.398 |
| SEFI | 30.325 | 40.612 | 2.16 | -3.84 | 34.155 |
| KAZI | 30.303 | 40.785 | 1.88 | -3.45 | 32.962 |
| KANR | 30.294 | 41.048 | 0.26 | -0.94 | 32.693 |
| KFKT | 30.229 | 41.187 | 0.04 | -0.39 | 120.274 |
| SMAS | 30.134 | 40.690 | 2.22 | -3.52 | 34.370 |
| AKCO | 29.973 | 41.034 | 0.22 | -0.51 | 39.173 |
| UCG2 | 29.962 | 40.846 | 1.58 | -1.67 | 40.637 |
| IUCK | 29.929 | 40.425 | 2.46 | -1.44 | 49.743 |
| IGAZ | 29.908 | 40.438 | 2.66 | -1.44 | 50.756 |
| DERB | 29.681 | 40.362 | 1.78 | -0.36 | 57.058 |
| SILE | 29.623 | 41.179 | 0.69 | -0.65 | 119.909 |
| OLUK | 29.585 | 40.667 | 3.92 | -2.68 | 48.165 |
| OVCT | 29.539 | 40.980 | 0.90 | -0.53 | 52.214 |
| HMZA | 29.514 | 40.164 | 1.06 | -0.97 | 139.743 |
| TUBI | 29.451 | 40.787 | 2.82 | -2.39 | 45.442 |
| DUMT | 29.372 | 40.566 | 2.75 | -3.14 | 40.885 |
| KRDM | 29.362 | 41.017 | 0.58 | -0.11 | 79.503 |
| IBBT | 29.321 | 40.866 | 1.87 | -1.35 | 46.916 |
| HART | 29.310 | 40.927 | 12.71 | -0.66 | 51.748 |
| KUTE | 29.288 | 40.485 | 1.72 | -2.61 | 35.832 |
| KAMT | 29.273 | 40.834 | 2.10 | -1.57 | 45.480 |
| ERCT | 29.243 | 40.319 | 0.45 | -1.18 | 19.518 |
| YACT | 29.238 | 40.917 | 1.33 | -0.59 | 52.017 |
| DRGT | 29.145 | 40.909 | 1.43 | -0.45 | 52.840 |
| CINA | 29.143 | 40.639 | 2.76 | -2.86 | 39.432 |
| ULUT | 29.131 | 40.098 | 0.63 | -0.53 | 140.454 |
| BAD1 | 29.118 | 40.852 | 1.92 | -0.91 | 47.284 |
| YANT | 29.113 | 40.820 | 2.16 | -1.22 | 45.343 |
| KANT | 29.061 | 41.061 | 1.00 | -0.33 | 103.166 |
| BLOT | 29.033 | 39.899 | 0.30 | -0.27 | 134.063 |
| ISTA | 29.019 | 41.104 | 1.00 | -0.52 | 107.245 |
| FIST | 28.882 | 40.481 | 1.59 | -1.95 | 36.827 |
| BOZT | 28.782 | 40.534 | 1.85 | -1.78 | 38.365 |
| AVCT | 28.724 | 40.989 | 2.09 | 0.09 | 73.382 |
| YENN | 28.373 | 40.398 | 0.89 | -0.87 | 38.472 |
| SELP | 28.365 | 41.052 | 0.29 | -1.92 | 24.344 |
| KART | 28.333 | 40.265 | 0.32 | -0.56 | 29.569 |
| MER1 | 27.962 | 40.967 | 1.74 | -0.89 | 48.025 |
| BALI | 27.906 | 39.722 | 0.07 | -0.13 | 31.147 |
| ERDT | 27.808 | 40.393 | 0.88 | -0.58 | 35.586 |
| MADT | 27.587 | 40.611 | 1.94 | -1.01 | 41.376 |
| ALAN | 27.424 | 39.785 | 0.11 | -0.59 | 29.485 |
| KABI | 27.301 | 40.381 | 0.53 | -0.96 | 30.775 |
| EGMI | 27.269 | 39.577 | -0.15 | -0.45 | 166.474 |
| ASMT | 27.204 | 40.054 | -0.07 | -0.31 | 25.166 |
| BKCT | 27.091 | 40.203 | 0.03 | -0.31 | 1.916 |
| KRDT | 26.999 | 40.951 | 0.85 | -0.62 | 22.674 |
| SEVK | 26.880 | 40.396 | 0.66 | -0.97 | 20.530 |
| KVAK | 26.871 | 40.601 | 1.06 | -1.17 | 24.678 |
| DOKU | 26.706 | 40.739 | 0.92 | -0.83 | 27.207 |
| BGNT | 26.570 | 40.932 | 0.49 | -0.24 | 27.546 |
| ATHT | 26.524 | 40.126 | 0.30 | -0.67 | 169.609 |
| TYFT | 26.487 | 40.383 | 0.50 | -0.75 | 18.871 |
© 2009 by the authors; licensee Molecular Diversity Preservation International, Basel, Switzerland. This article is an open access article distributed under the terms and conditions of the Creative Commons Attribution license (http://creativecommons.org/licenses/by/3.0/).
Share and Cite
Ozener, H.; Dogru, A.; Unlutepe, A. An Approach for Rapid Assessment of Seismic Hazards in Turkey by Continuous GPS Data. Sensors 2009, 9, 602-615. https://doi.org/10.3390/s90100602
Ozener H, Dogru A, Unlutepe A. An Approach for Rapid Assessment of Seismic Hazards in Turkey by Continuous GPS Data. Sensors. 2009; 9(1):602-615. https://doi.org/10.3390/s90100602
Chicago/Turabian StyleOzener, Haluk, Asli Dogru, and Ahmet Unlutepe. 2009. "An Approach for Rapid Assessment of Seismic Hazards in Turkey by Continuous GPS Data" Sensors 9, no. 1: 602-615. https://doi.org/10.3390/s90100602