Article

Classifying Oriental Beech (Fagus orientalis Lipsky.) Forest Sites Using Direct, Indirect and Remote Sensing Methods: A Case Study from Turkey

Karadeniz Technical University, Faculty of Forestry 61080, Trabzon-Turkey
*
Author to whom correspondence should be addressed.
Sensors 2008, 8(4), 2526-2540; https://doi.org/10.3390/s8042526
Submission received: 25 February 2008 / Accepted: 3 April 2008 / Published: 9 April 2008

Abstract

:
Determining the productivity of forest sites through various classification techniques is important for making appropriate forest management decisions. Forest sites were classified using direct and indirect (site index) and remote sensing (Landsat 7 ETM and Quickbird satellite image) methods. In the direct method, forest site classifications were assigned according to edafic (soil properties), climate (precipitation and temperature) and topographic (altitude, slope, aspect and landform) factors. Five different forest site classes (dry, moderate fresh, fresh, moist and highly moist) were determined. In the indirect method, the guiding curve was used to generate anamorphic site index (SI) equations resulting in three classes; good (SI=I-II), medium (SI=III) and poor (SI=IV-V). Forest sites were also determined with a remote sensing method (RSM) using supervised classification of Landsat 7 ETM and Quickbird satellite images with a 0.67 kappa statistic value and 73.3% accuracy assessments; 0.88 kappa statistic value and 90.7% accuracy assessments, respectively. Forest sites polygon themes obtained from the three methods were overlaid and areas in the same classes were computed with Geographic Information Systems (GIS). The results indicated that direct and SI methods were consistent as a 3% dry site (19.0 ha) was exactly determined by both the direct and SI methods as a site class IV. Comparison of SI and RMS methods indicated a small difference as the area was highly homogeneous and unmanaged. While 15.4 ha area (open and degraded areas) was not determined by SI but RSM. A 19.0 ha (100%) poor site was determined by the SI method, 14.9 ha (78%) poor site was in Landsat 7 ETM satellite image and 17.4 ha (92%) poor site in Quickbird satellite image. The relationship between direct and SI methods were statistically analyzed using chi-square test. The test indicated a statistically significant relationships between forest sites determined by direct method and Quicbird satellite image (χ2 = 36.794; df = 16; p = 0.002), but no significant relationships with Landsat 7 ETM satellite image (χ2 = 22.291; df = 16; p = 0.134). Moderate association was found between SI method and direct method (χ2 = 16.724; df = 8; p = 0.033).

1. Introduction

The site refers to a geographic location that is considered homogeneous in terms of its physical and biological environment. In forestry, site is generally defined by the location's potential to maintain tree growth, often with a view to site-specific silviculture. Forest sites may be classified into site types according to their similarity regarding soils, topography, climate and vegetation. Forest site classification can provide a range of management aims, including ecological stratification for optimizing the evaluation of forest site productivity [1].
There are various ways to estimate the productivity of a site, and comparisons of their merits require some definitions and classification of major alternatives. So far, however, direct and SI methods have been most often used in forest management activities. While the site in the direct method is assessed through soil, topographic, climate and similar other conditions, in the indirect method, it is expressed in terms of SI, which is defined as the dominant height of a population of trees at a specific base or reference age [2]. Even though true site productivity may not be fully represented by SI, it is the most broadly used, accepted and multipurpose site productivity indicator for even-aged forests [2-7], probably the simplest method for estimating site productivity in terms of timber production [2]. Although SI is the most widely accepted method for estimating site productivity of even-aged forests, it does not reflect the forest sites appropriately, especially for treeless and degraded areas in Turkish forests [8-9].
It is essential to determine and limit forest sites by classifying and mapping the site attributes for sustainable management of forest resources. Without the site classification of land and the generation of the related forest site maps brings about failure of any forest management applications [10]. However, according to direct method, forest site classification process is highly time-demanding, expensive and hard to conduct for large areas. Thus, it necessitates the use of powerful information technologies such as GIS and Remote Sensing (RS) to help develop forest site maps, such information technologies should be utilized effectively.
This study focuses on identifying forest sites using direct, indirect and remote sensing methods in a research area of Sinop-Ayancık-Goldag Forest District located in northern part of Turkey. Part of the research relate to classifying and mapping the forest sites with the spatial analysis functions of GIS. Additionally, forest site productivity values determined by direct method, indirect method and RSM were compared and contrasted to evaluate the potential use of the methods.

2. Study Area

The study area was the Goldag forest planning unit with 600 ha, a part of Sinop-Ayancık province located in the central Black Sea Region, Turkey (647000-650000 E. 4629000-4632000 N. UTM ED 50 datum Zone 36 N, Figure 1). Elevation ranges from 500 m to 970 m with an average of 775 m. The study area is situated on a steep terrain, topographic surface with a slope ranging from 10% to 60%, with an average of 26%. Average annual temperature reaches a maximum of 27.6°C in the summer and a minimum of 13.8°C in the winter with an average annual temperature of 17.6°C. Average annual precipitation in the study area is 677.3 mm [11]. Generally, soils tend to be heavy clay type. The study area is covered with unmanaged, even-aged, pure stands of oriental beech (Fagus orientalis Lipsky.).

3. Dataset

The research accommodates both the satellite data and forest inventory data obtained from ground measurements for classifying and interpreting forest sites with respect to the degree of site productivity. The topographic features such as elevation-climate zone, aspect, slope and landform were used to delineate the sites. Forest site classification was performed based on edaphic (soil properties), topographic (altitude, slope, aspect and landform) and climate (precipitation and temperature) factors. As for the ground measurements, a total of 70 sample plots were established with 300 × 300 m grids and the necessary measurements were taken in each sample plot. In each sample plot, a soil pit was dug up to bedrock or to a minimum depth of 1 m. All soil profiles were described and classified. Approximately, 1 quart of rock-free soil was collected from each horizon in each soil pit. Soil samples were air-dried, ground and sieved through a 2 mm-mesh-sized sieve before further analysis. Also noted were some soil characteristics such as stone content, thickness of the horizons and physiological soil depth. Additionally, classical timber inventory measurements (stand age and height) were carried out in each sample plot. Forest cover type map at 1/25.000 scale for 1999 and medium (Landsat 7 ETM acquired on May 3, 2000) and high resolution (Quickbird acquired on June 18, 2004) satellite images were used to estimate the forest site.

4. Methods

4.1. Direct Method

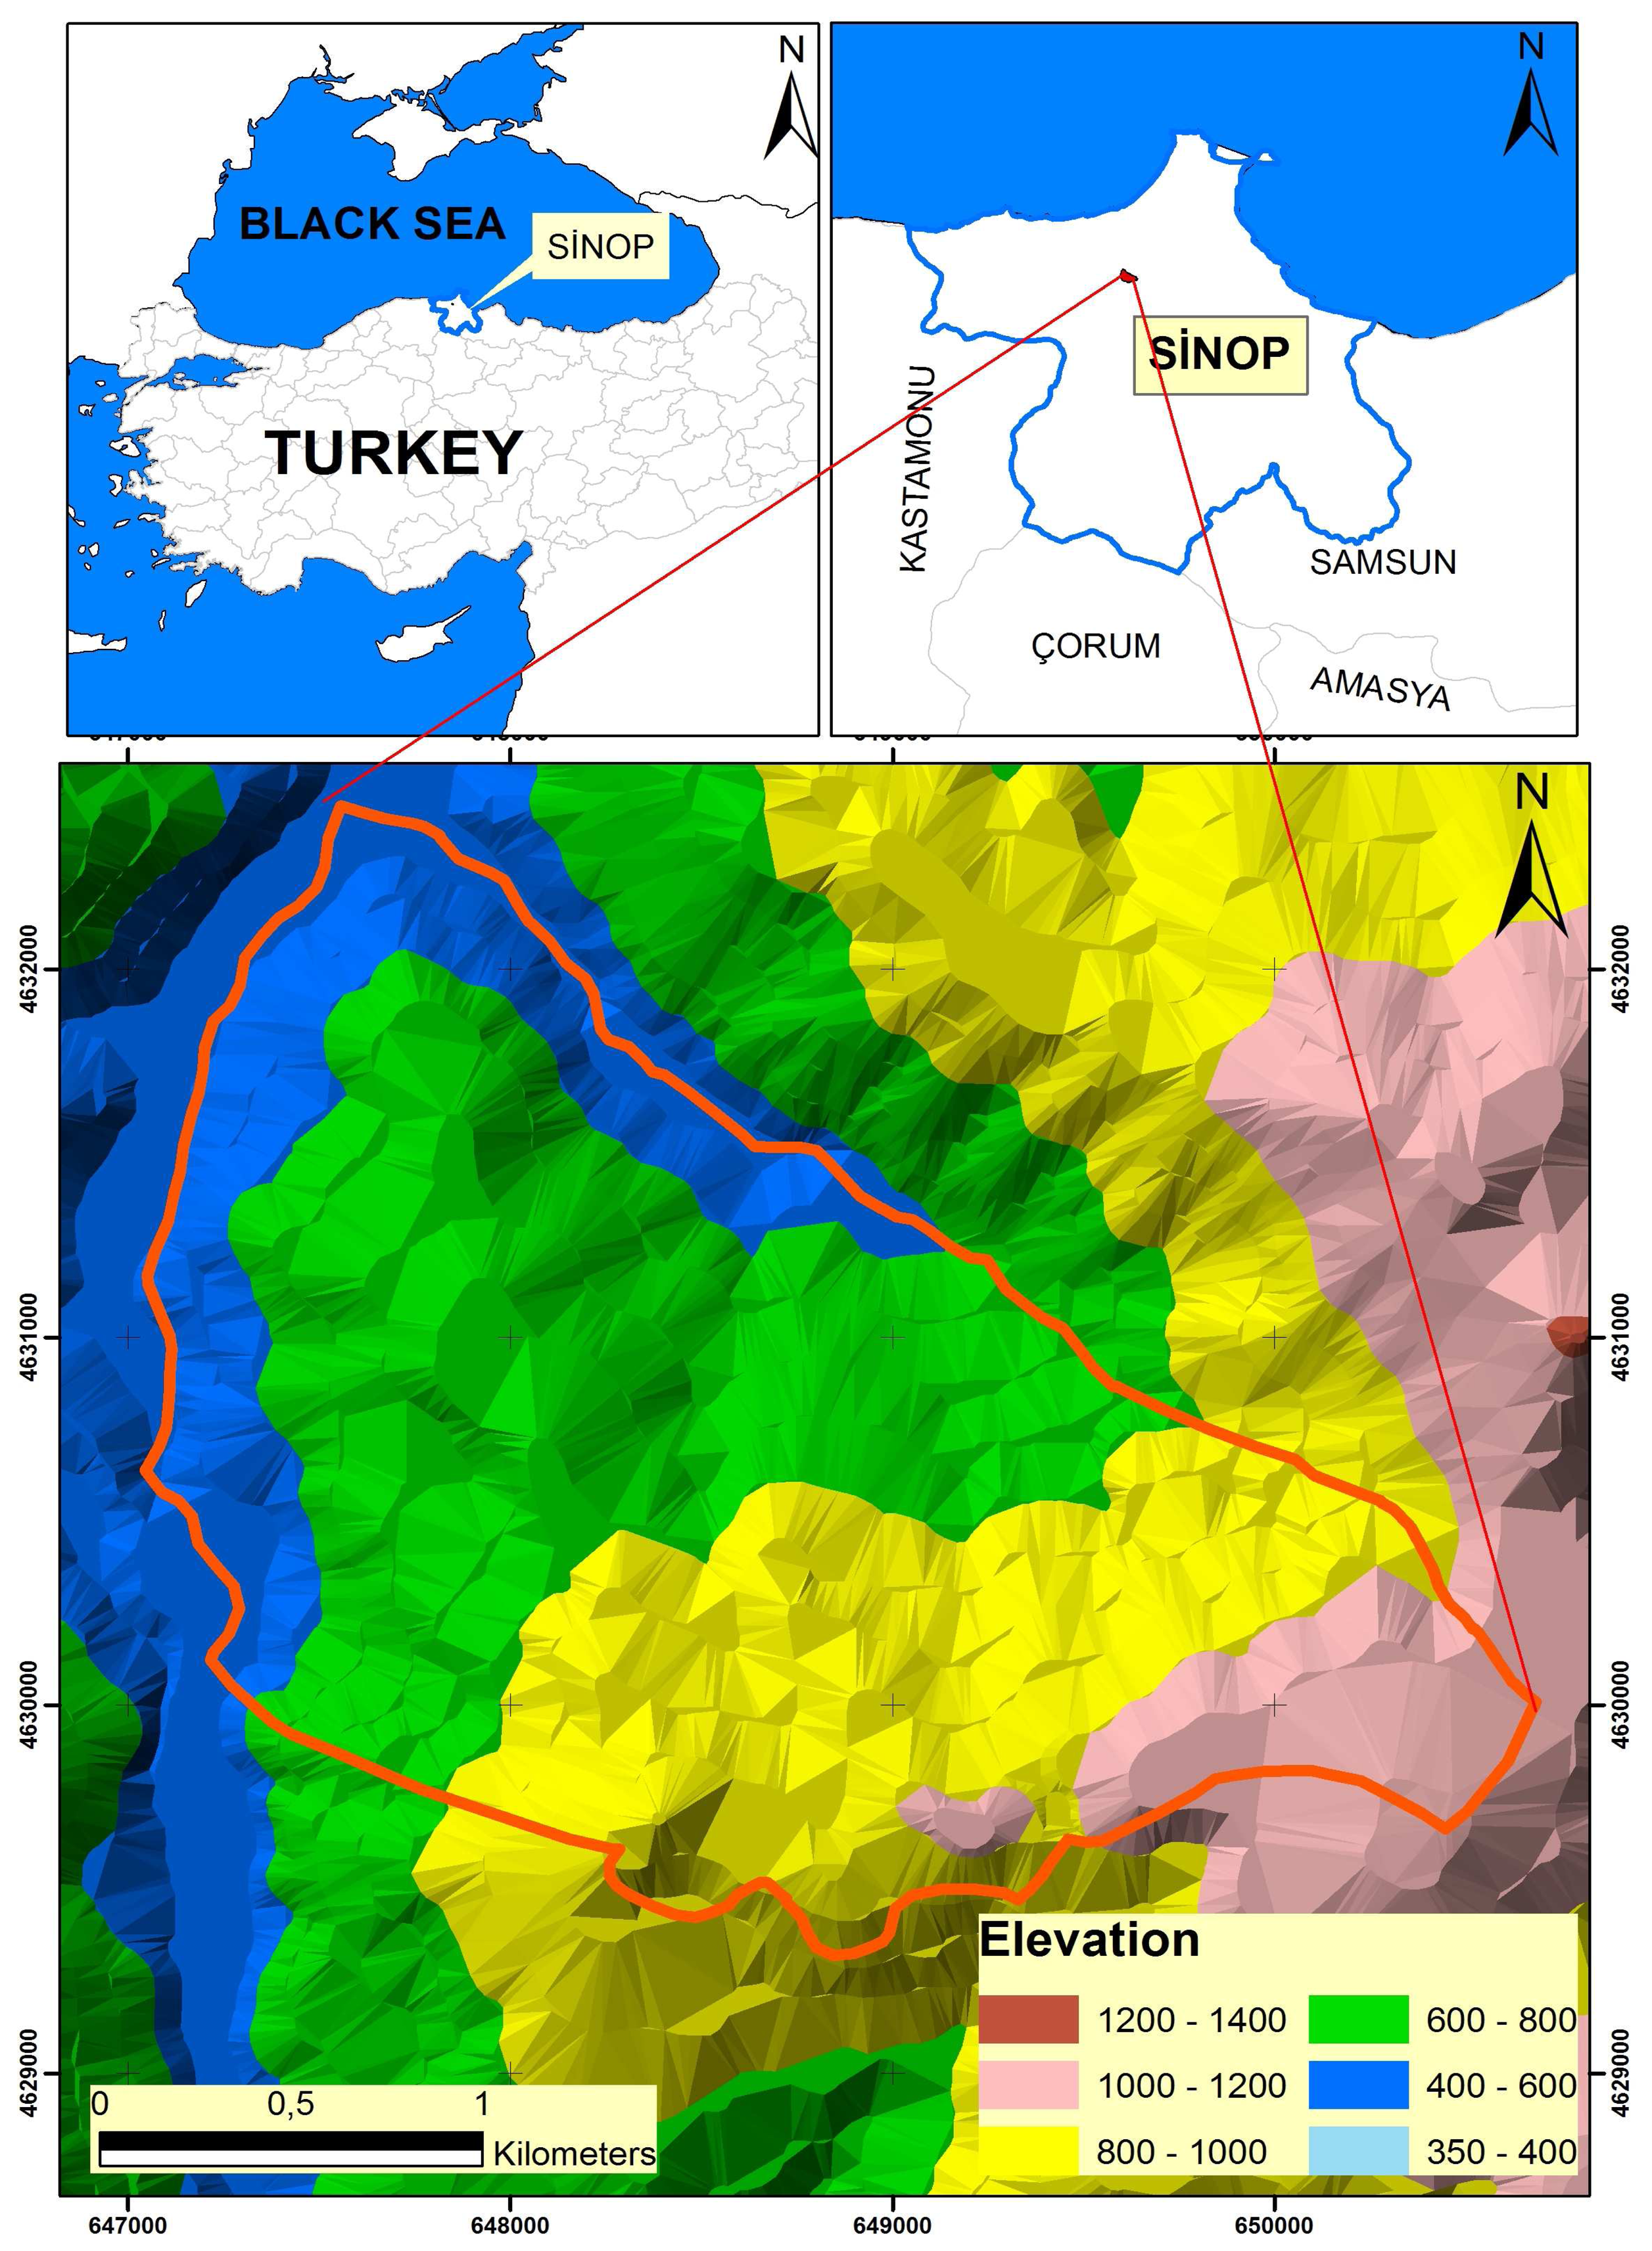
Direct method states that the site productivity depends not only on the soil factors but also on topography (aspect, altitude, slope and landform) and climatic data. Thus, forest site classification was conducted by combining edaphic, physiographic and climatic factors. As far as landform or physiographic classification is concerned, the research area was classified into five different elevation-climate zones (500-600m, 600-700m, 700-800m, 800-900m and 900-970m). Digital Elevation Models (DEM) contains the elevation of the terrain over a specified area, usually at a fixed grid, displaying slope, aspect and landform. The source of the DEM data (at 10×10 m pixel resolution) comes from the contour line map with 10 m intervals digitized from digital topographic maps, registered with 6–8 m root mean square (RMS) error with 3D modeling in GIS. The sample points in each of these zones were distributed according to physiographic structure of the area. The landform was stratified by slope and aspect subzones. East, north, north-west and north- east aspects were included in north aspect sub zone and the rest was grouped as south aspect subzone. The landscape surface was stratified into five surface subzones; ridge, top hillside, mid hillside, sub hillside and base land. The sample points were also grouped according to the physiographic stratification.
Soil classification was carried out in each elevation-climate zone using soil sample data Therefore, the soil was classified by bedrock type (clay stone), soil deepness [deep (75-100 cm) and quite deep (100-125 cm)], rockiness (sparsely distributed rocks and densely packed rocks) and soil texture, which describes the proportions of sand, silt and clay particles in the soil. The terms sand, silt and clay refer to different size fractions of the soil's mineral content. Texture is quoted as the percentage of each of these components or, more generally, by internationally recognized shorthand of terms such as loam, sandy clay loam or silt clay. Soil samples were classified as clay and heavy clay. Moreover, water holding capacity of soil samples was calculated using field capacity and wilting point for each horizon.
Two methods were used to classify and map forest sites. The first method is based on soil nutrient regime (SNR) where water deficit is nonexistent in summer months [12]. The second method uses soil moisture regime (SMR), where water deficit exists in summer months [13-15]. There were no meteorological stations in the study area to measure and gather the weather data specifically for each plot or stand. The climate related information of each sample area is harmonized according to its relative spatial location to the Sinop meteorological station, approximately 90 kilometers away from the study site. The temperature generally decreases about 0.6 °C in summer and 0.4 °C in winter for each 100 meter altitude, with an average decrease of 0.5 °C [16]. The mean temperature change of 0.5 °C was taken into consideration to determine the temperature for each sample plot in the study area. Furthermore, the average annual precipitation was calculated for each elevation-climate zone using the Shreiber formula as suggested by [17]:
Yh = Y o ± 54 h
Where Yh: Annual mean precipitation value calculated for the area without meteorological station; Yo: Annual mean precipitation value (mm) at meteorological station; h: Difference (hectometer) between the altitude of meteorological station and the mean altitude of area whose precipitation value is to be calculated.
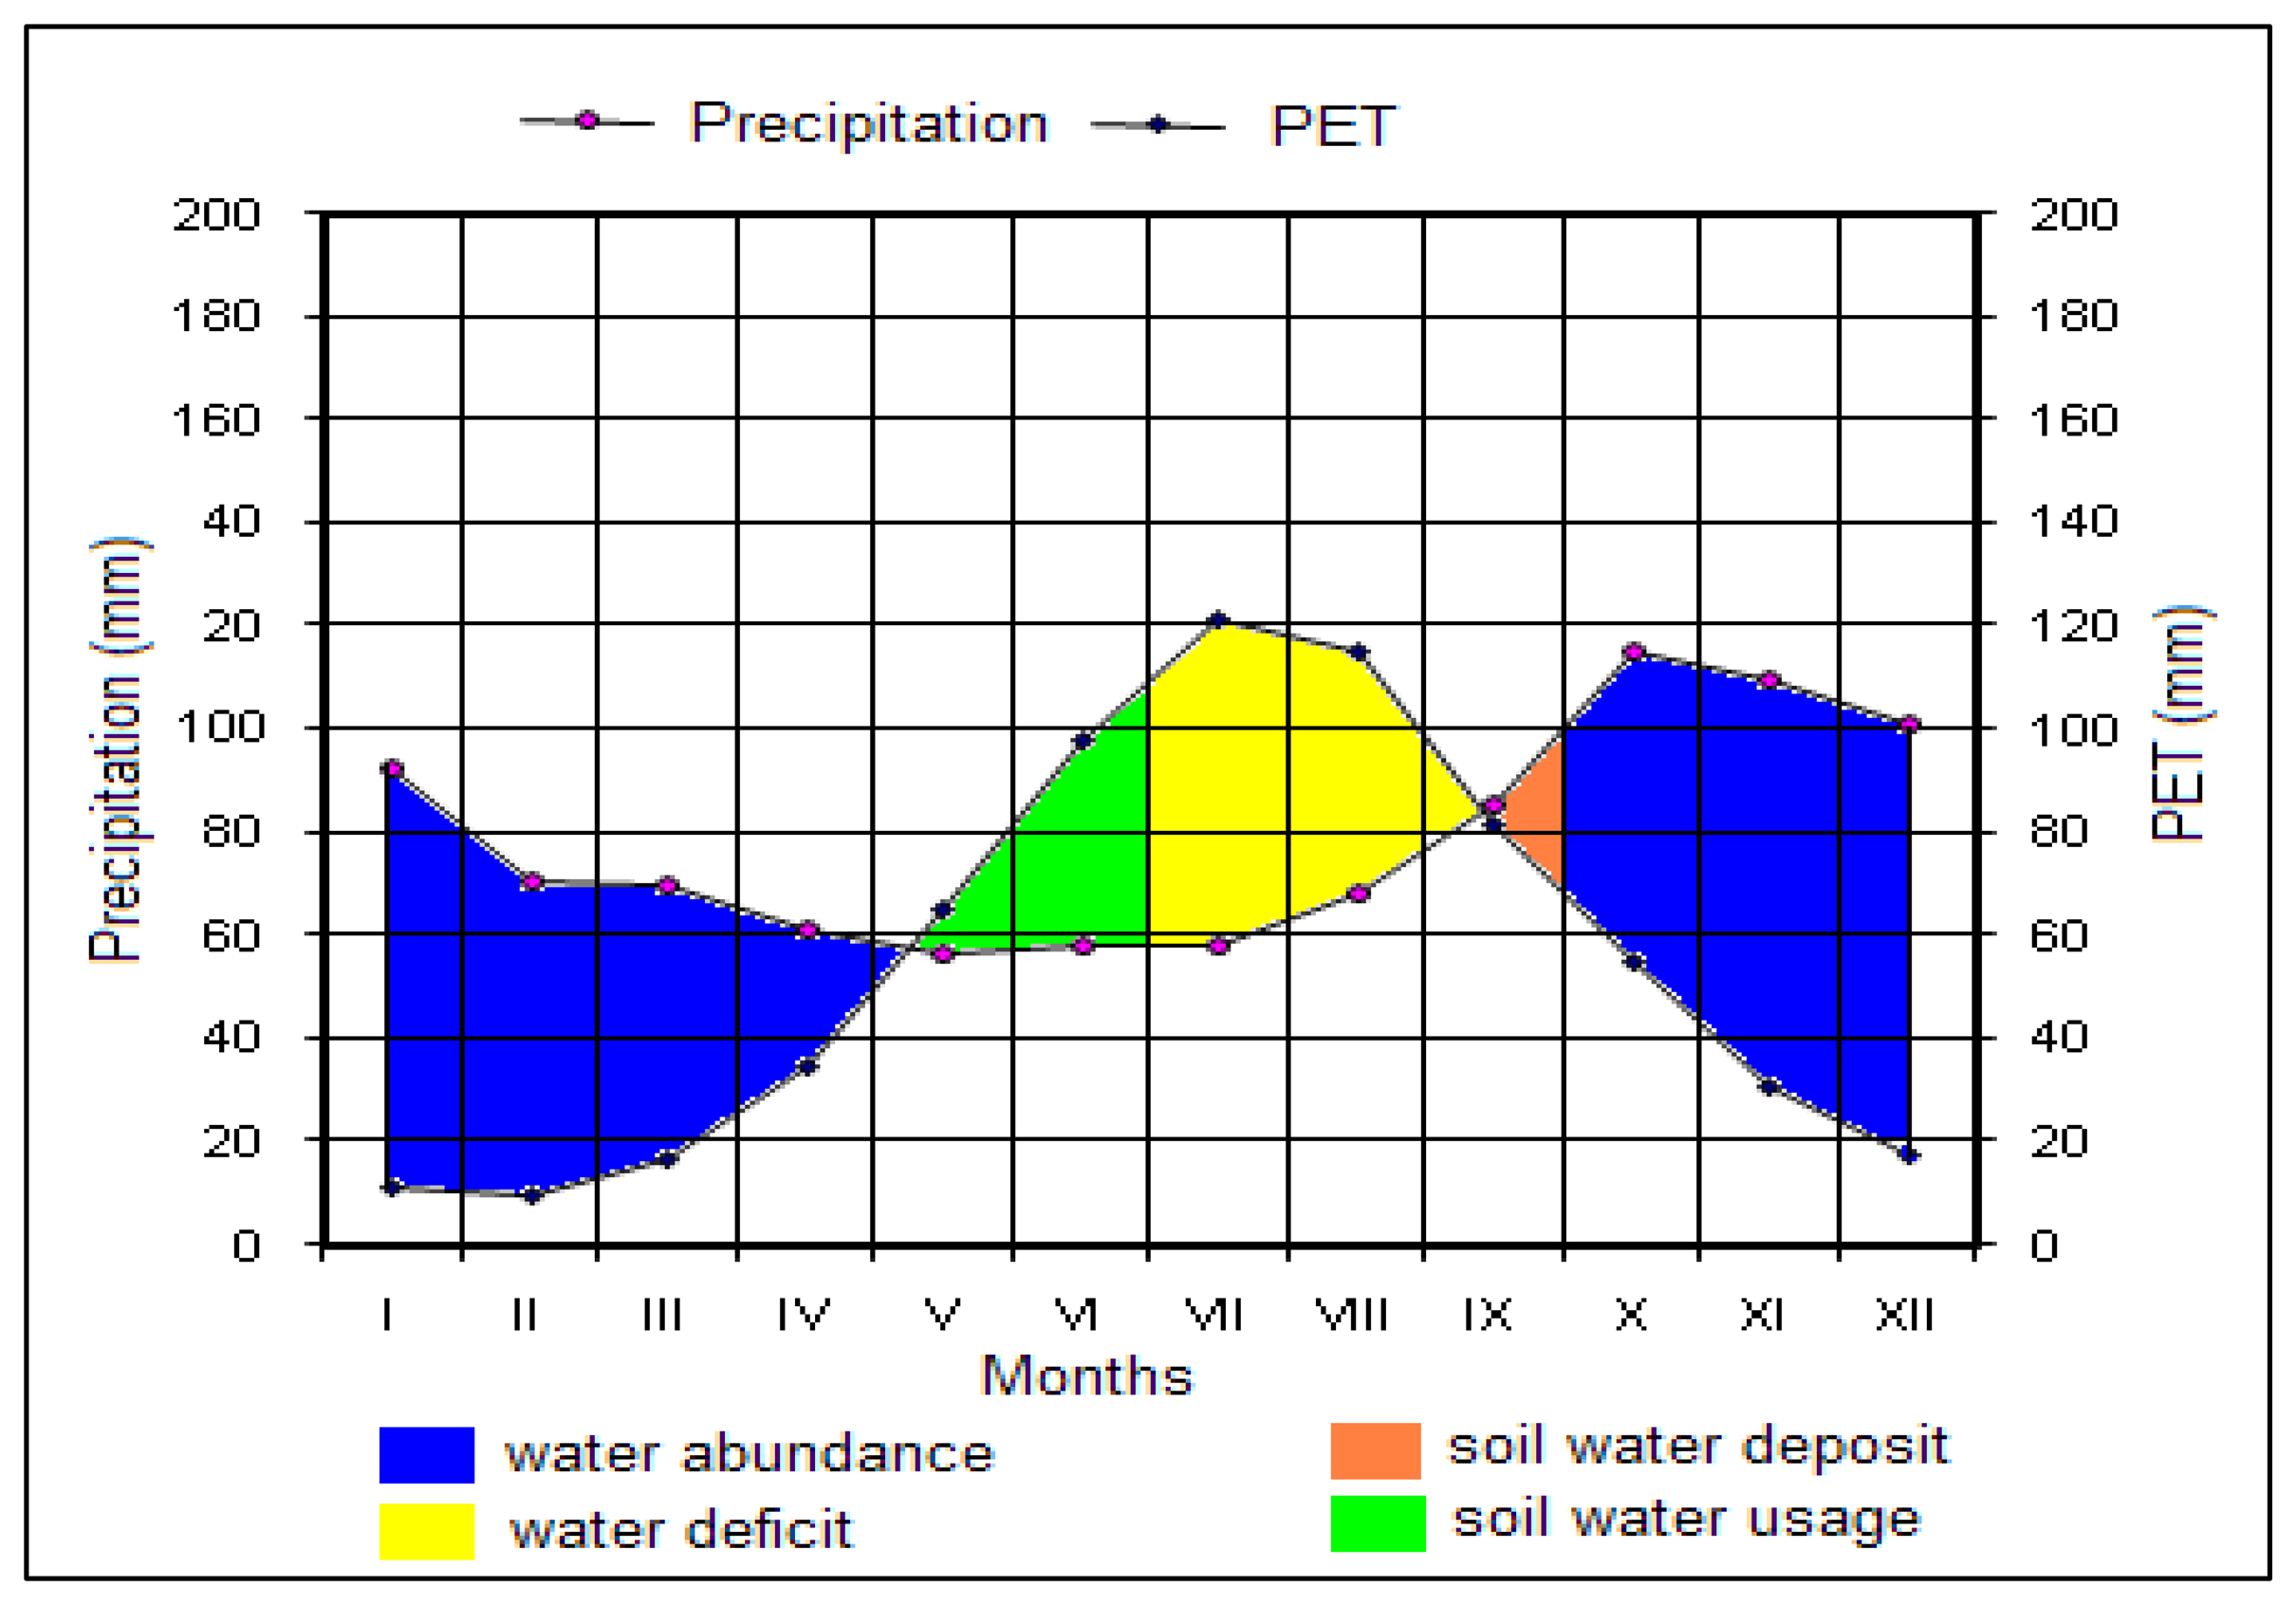
The research area was classified into five different elevation-climate zones with an average altitude. The precipitation and temperature data were adopted for each elevation-climate zone and climate analyses was carried out according to Thornthwaite method [18]. The analysis indicated that there was water shortage in each elevation climate zone in summer months. Therefore, SMR is used to classify the forest sites in the study area. The water deficit of the second elevation-climate zone was illustrated in Figure 2.
Later, the following eqution was used to calculate drought index of each elevation climate zone in the study area.
Im = 12 x AET / T om
where Im: drought index, AETm: monthly actual evapotranspiration (mm), Tom: total monthly maximum temperature (°C), and 12: annual coefficient. With equation 3, monthly index calculated and then annual index determined by averaging monthly index values. According to these index values, forest sites were determined (Table 1).
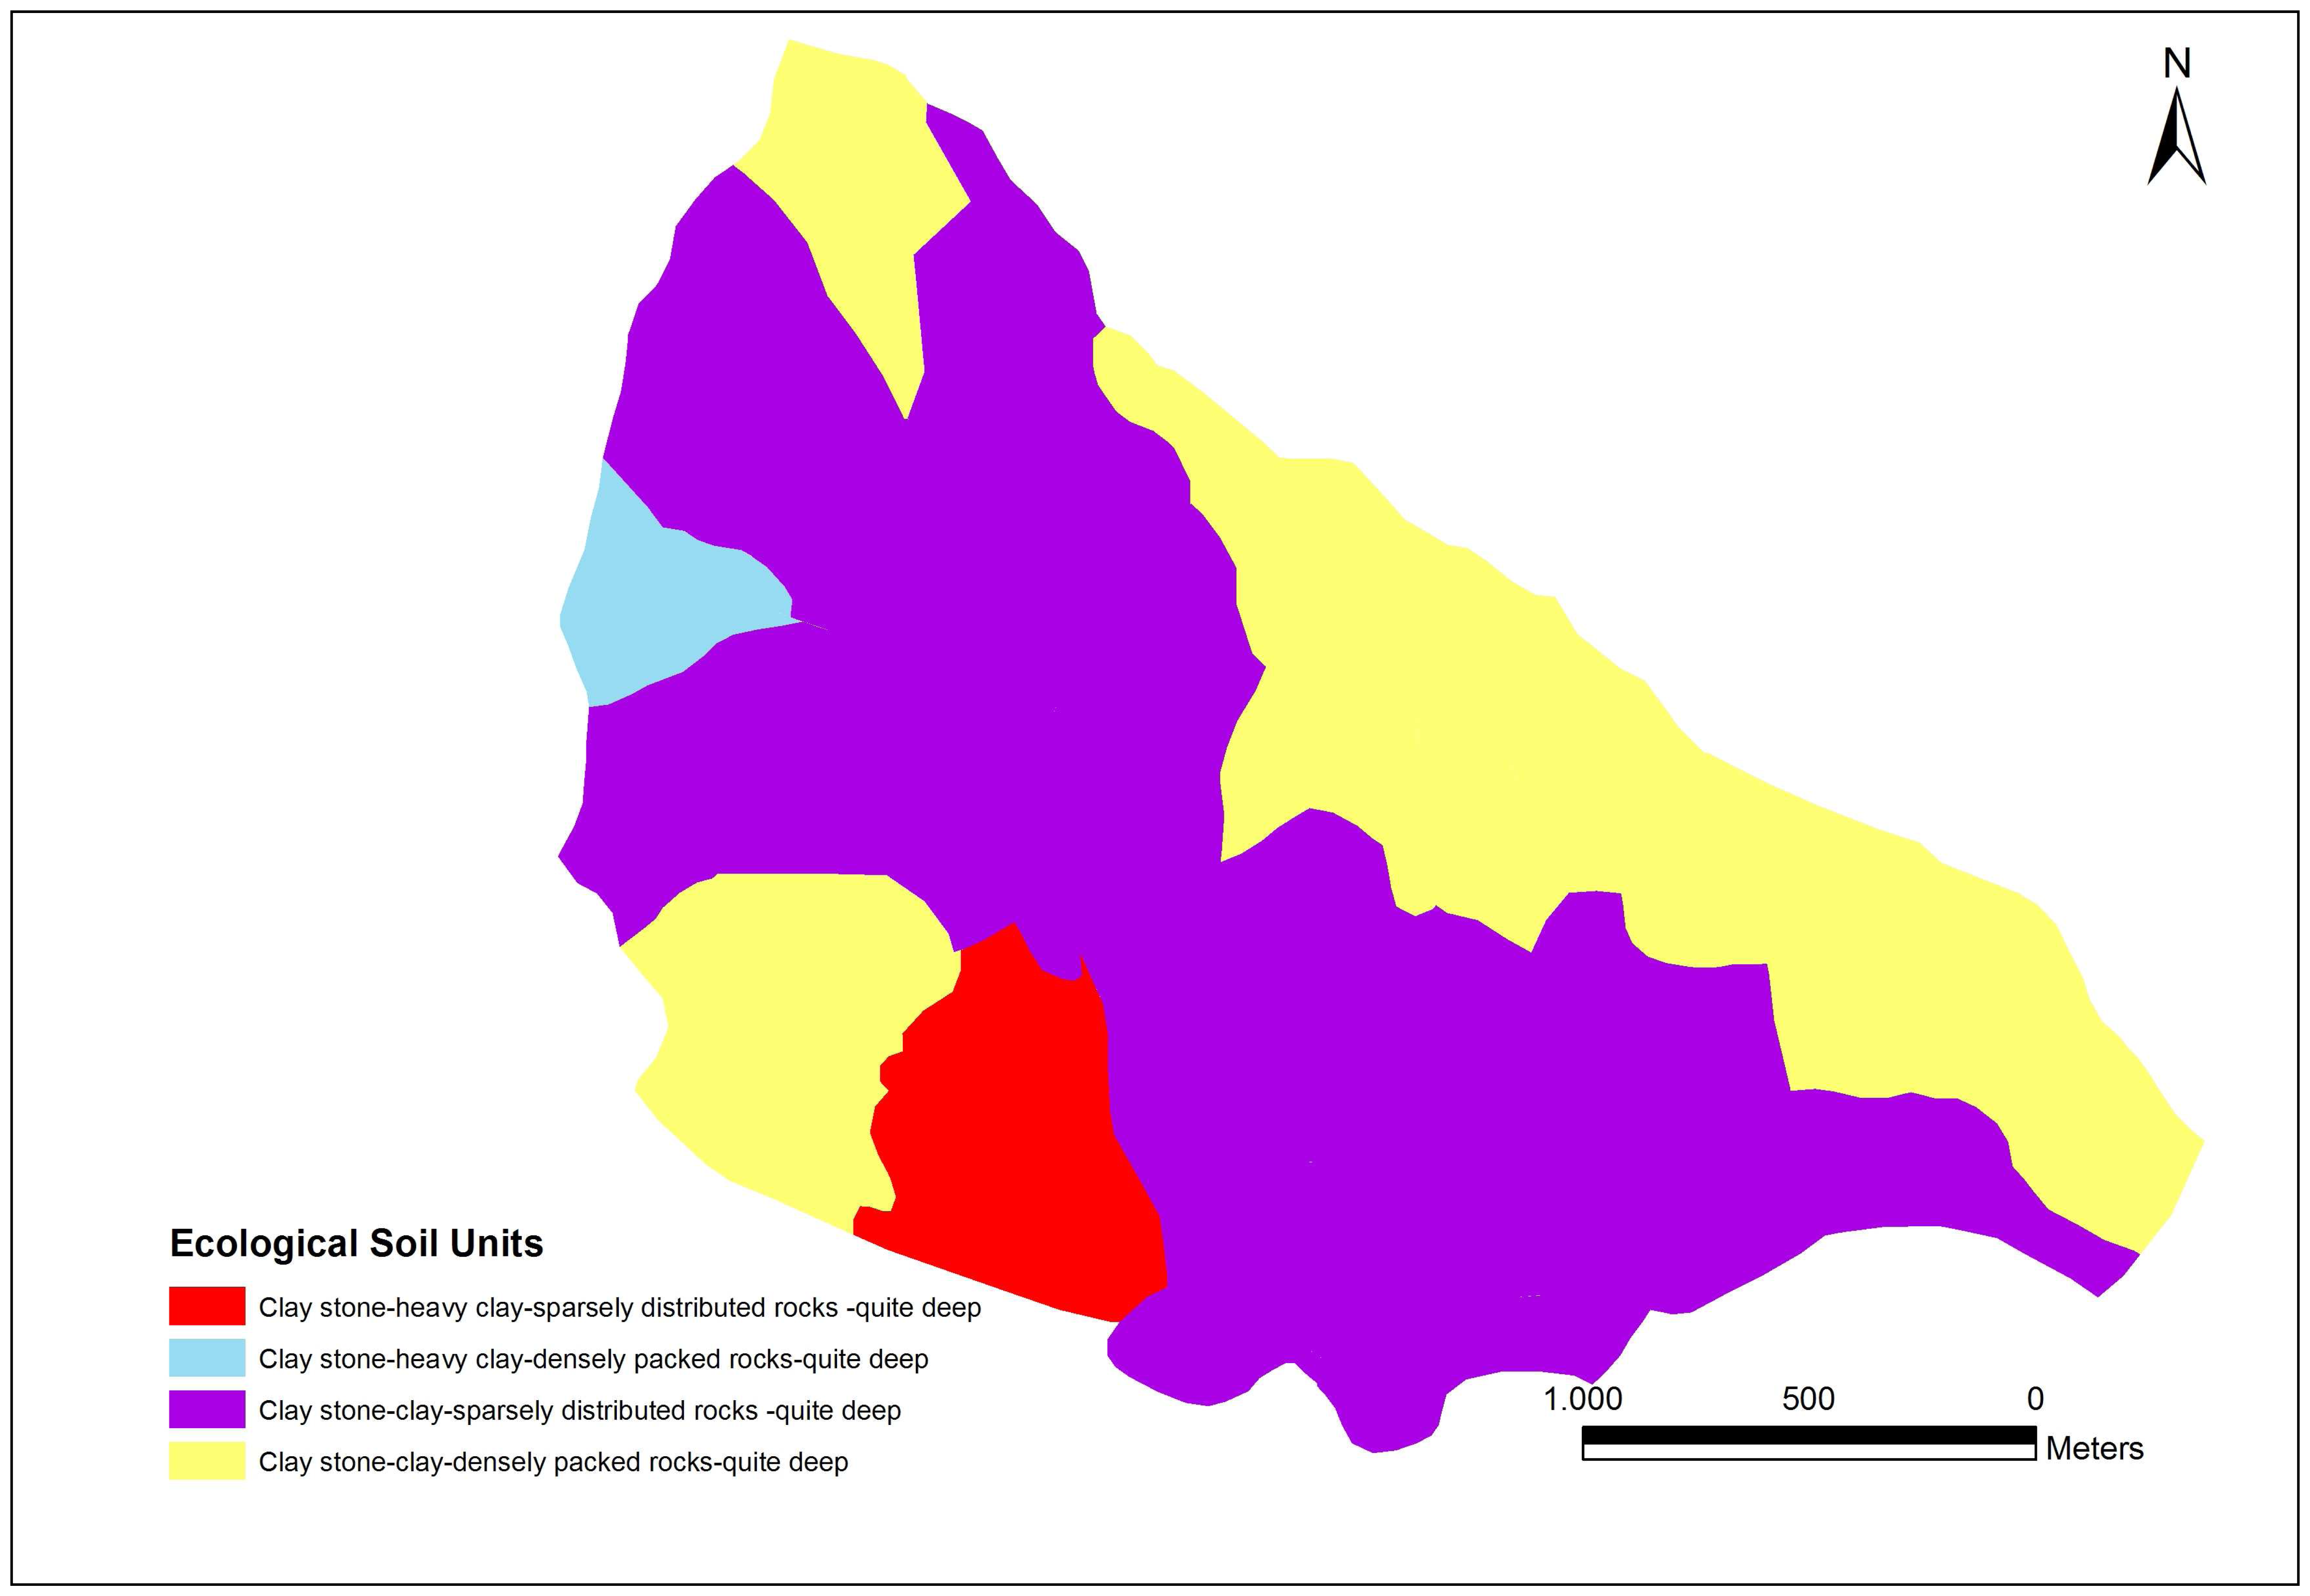
In direct method, the available water holding capacity of the soils is mainly taken into account as it is a very important parameter in forest sites; but by it is not adequate for mapping and distinguishing sites. Other factors such as altitude, aspect, slope and landform have to be taken into account. Therefore, main rock, soil type, soil skeleton with physiological soil depth as the most effective parameters were taken into consideration for forest site classification. Ecological soil units are determined using main rock, soil type, soil skeleton and physiological soil depth of sample plots. They were identifiable parameters having similar soil and productivity conditions because of similar climatic and geologic processes (Figure 3). The sample plots with similar properties were grouped into ecological soil units and average water holding capacity for each ecological unit was calculated based on horizon thickness, the amount of fine soil, field capacity and wilting point for each horizon. Total water holding capacity of soil profile was calculated by simply summing available water holding capacity of each horizon [19]. Forest sites were finalized and mapped using climate data in each elevation climate zones, mean water holding capacity of each ecological soil unit and topographic features.
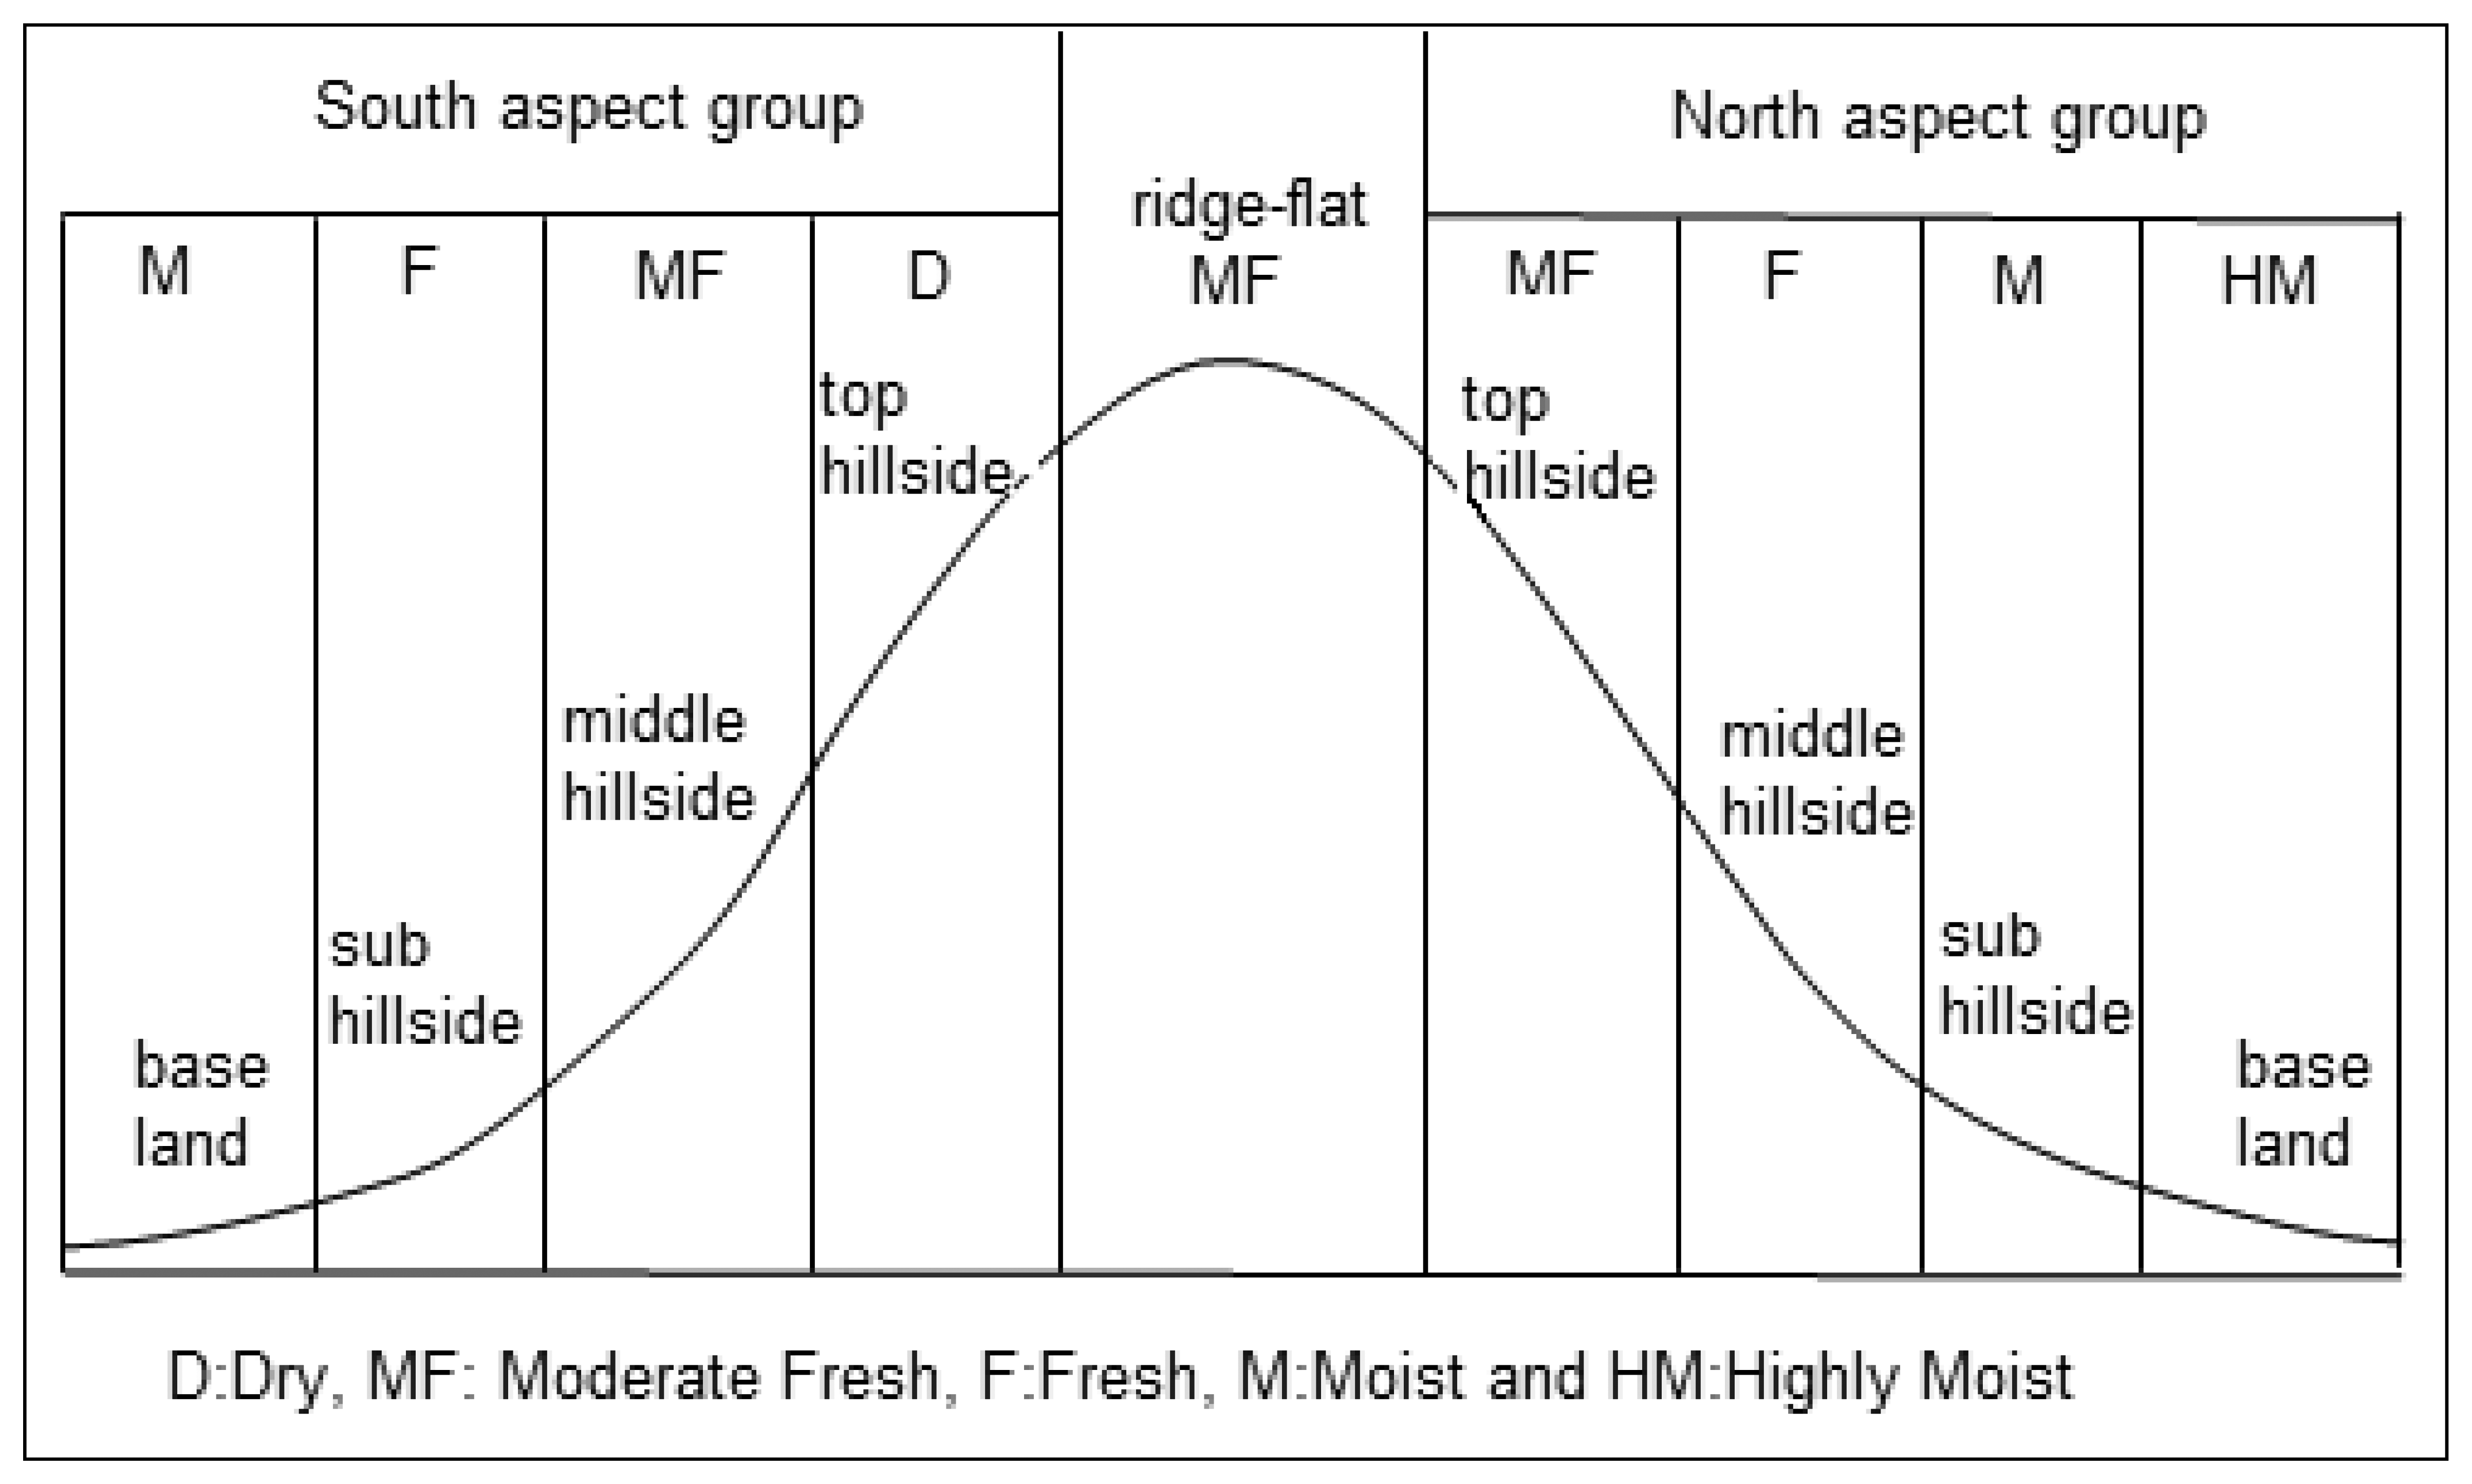
The drought index values calculated for each elevation climate zone are between 15 and 23, indicating the moderate fresh base site. Since this classification does not take aspect, slope and altitude into consideration, the drought index values, thus the base site, calculated according to ridge flat were adjusted by the spatial factors. Therefore, the adjustment method developed by Kantarci [19] for various base sites were used to determine forest sites across the forest landscape (Figure 4). For example, if the sample point is at the top of the hillside on a south-facing aspect, then the site is dry forest site according to the ridge-flat base site scheme in Figure 4.
The scheme in Figure 4 has been developed based on an ecological understanding of forest sites. Basically, the north and south aspect groups differ from each other in terms of water economics. Since the areas in south aspect group gets more direct and longer solar radiation in northern hemisphere, the areas are drier than those with similar ecological attributes [17]. This fact can be clearly seen in Figure 4. For example, while an area, which is located in the north aspect group, at top hillside is classified as moderate fresh forest site, the same area located in south aspect group would be classified as dry forest site.
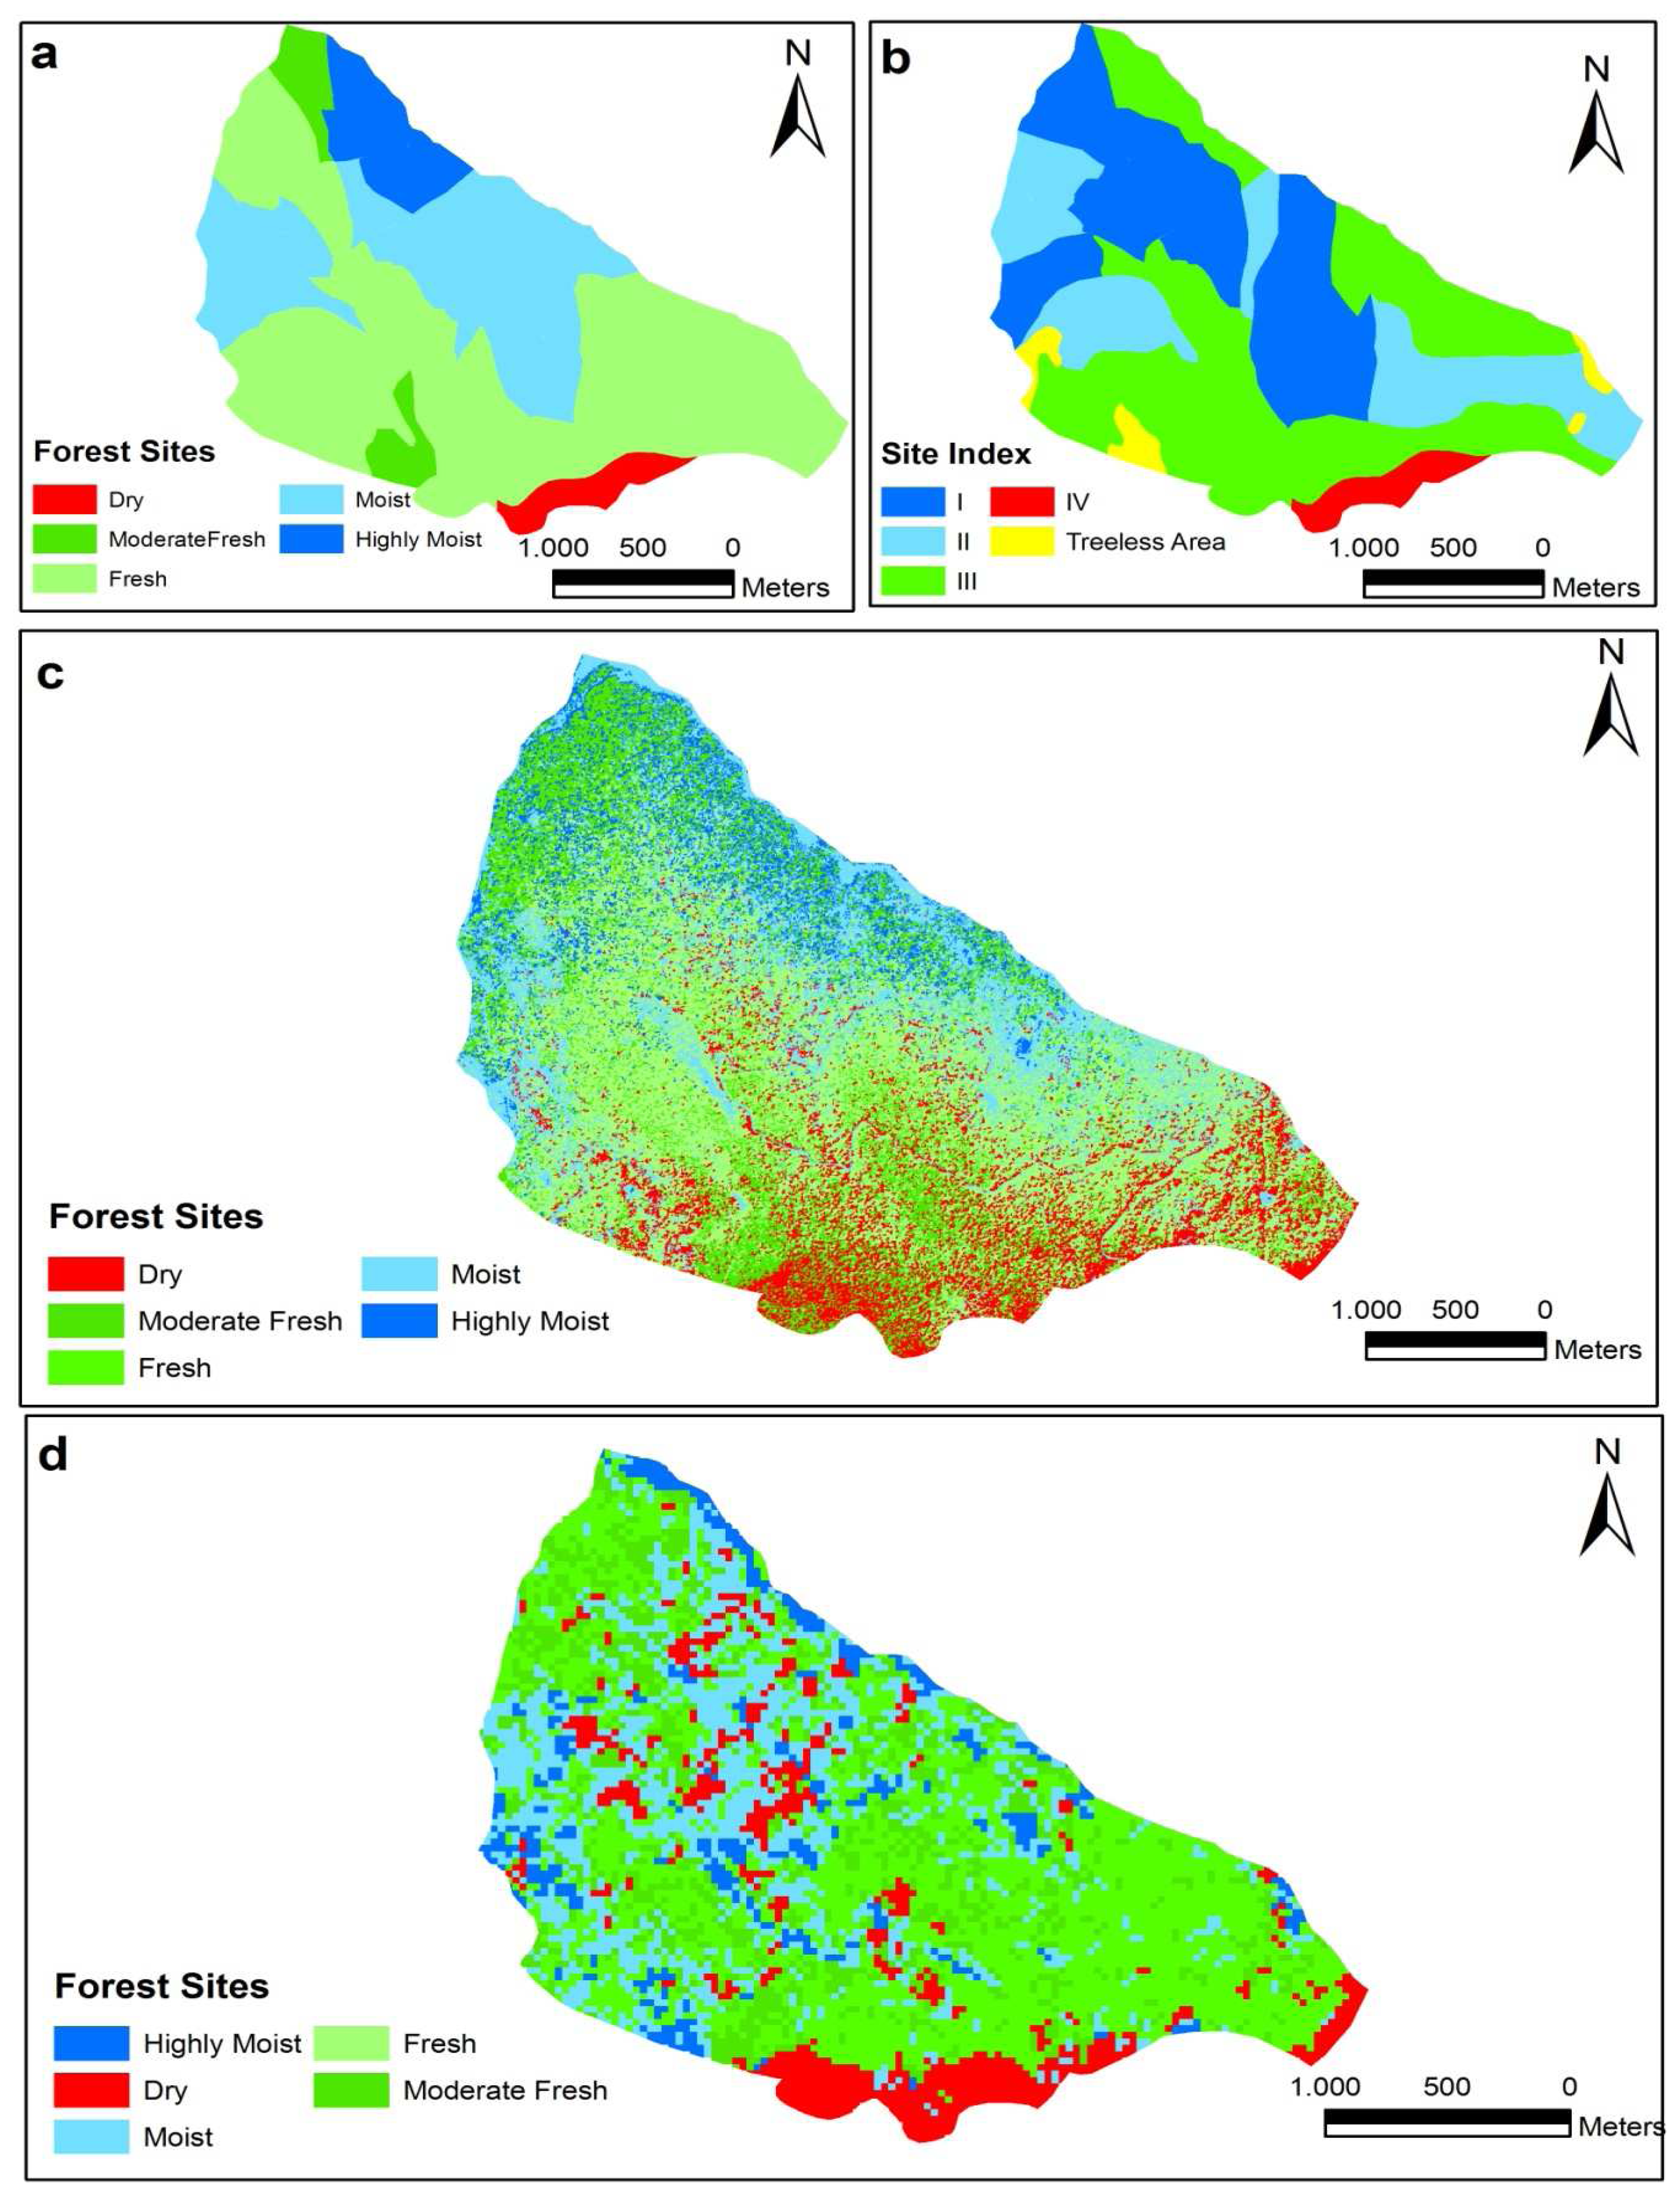
All the sample points are evaluated likewise and recorded in a database to delineate the forest sites across the research area using GIS functions. The study resulted in five different forest sites; dry, moderate fresh, fresh, moist and highly moist forest site (Figure 5-a). The dry sites are located in very steep slope on south aspect hillside. Water is at a low level, not enough to meet the need of forest trees over the growing period. In moderate fresh site, water deficit can occur or reach a level to cause droughtness in years with low precipitation. Even though this site is at the boundary of drought in water holding capacity, they are at steep slope on north aspect hillside. Because of local spatial factors, they are not taking water leakage from neighbor site. In fresh forest site, after rains, since the soil is fulfilling, water level at field capacity is held, spare of water has flown. They have location to not reinforcement of water and available water in soil is adequate amount at an important part of growing period. In moist forest site, if the moderate fresh and fresh forest sites can get reinforcement of water from at sub hillside, water collection line, valley and base, they are called “moist”. In highly moist forest site, this site areas which has continuous and height base water and which is side source and watery stream.

4.2. Indirect (SI) method

Practical foresters have used the relationship between tree height and age to quantify site productivity for different tree species. One way of doing this is to determine the SI, defined as the dominant height of a population of trees at a specific base or reference age. Although forest site productivity may not be fully represented by SI, this is the most widely used method for estimating the site productivity of even-aged forests [2]. In this study, forest site quality was estimated by the SI method.
It is commonly assumed that the influence of genetic and silvicultural factors on forest height growth remains low in single-species, even-aged, closed plantations [20]. In each sample plot, height and age were measured in free-growing dominant and co-dominant trees (100 dominant and co-dominant highest trees per hectare, for example, 4 highest trees in a 0.04 ha plot) which are the strongest competitors for light, moisture, nourishment and growing space without any obvious signs of growth abnormalities or damage [21]. The height was measured with a Sunto hypsometer, and the age at breast height (1.30 m above ground level) was measured with an increment borer. SI was calculated for each stand at the reference age of 100 years by site index curves developed by Carus [22] for Fagus orientalis.
According to indirect method, SI curves were generated by the guide-curve method. These curves are developed by first fitting an average height-over-age guide curve to these data and then constructing a series of higher or lower curves with the same shape as the guide curve. Such a process is called anamorphic curving [23]. Guide curves are first used to generate anamorphic SI equations, and then build SI curves. The site productivity was classified as poor = IV-V; medium = III and good = I-II. The SI map was created with GIS functions (Figure 5-b). The SI value calculated for each sample plot was related to the location of the plot and the borders of the sites were then delineated using the spatial analysis functions (proximity, nearest neighborhood) of GIS. The geographically adjacent (contiguous) sample plots with the same SI values were then combined using reclassification functions (eliminate) of the GIS to produce a map of forest SI values throughout the study area.

4.3. Remote Sensing Method

The data used in this research are forest cover type map at 1/25.000 scale for year 1999, Landsat 7 ETM satellite image acquired on May 3, 2000 and Quickbird satellite image acquired on June 18, 2004. The forest cover type map used as ground truthing was originally generated from both the stereo interpretation of infrared aerial photos with an average 1/16.000 scale and ground measurements of sample points distributed by 300×300 m grids in 1999.
Data processing involved a number of steps. First of all, the forest cover type map (1999) was drafted and spatial database was build with Arc/Info 9.2 [24]. Second, Landsat 7 ETM and Quickbird satellite images were rectified and classified using forest sites obtained from direct method. Third, Forest site polygon themes obtained from direct method, indirect method and RSM were overlaid and areas that are in the same classes in direct method, SI method and RSM were computed with GIS.
The site classification was carried out using ERDAS Imagine 9.0™ [25] using image processing. Subsets of satellite images were rectified using 1/25.000 scale Topographical Maps with UTM projection (ED 50 datum) using first order nearest neighbor rules. A total of 24 ground points were used to register.
In this study, we used 5, 4, 3 spectral bands for Landsat 7 ETM image and 3, 2, 1 spectral bands for Quickbird image combination in image classification. Ground reference data were gathered from more than 50 points as signatures for each satellite image. The training points were equally distributed to each forest site type with at least 10 points per forest site type. For the supervised classification of Landsat 7 ETM image, the forest sites map was used to create ground signatures. In order to classify forest site types from the images, signatures were taken from these ground corrected forest site map. Furthermore, these signatures were further controlled with image enhancement techniques such as Transformed Vegetation Index and Principle Components Analysis-PCA. These signatures were then used in a supervised maximum likelihood classification algorithm. Our classification is composed of five classes; dry forest site, moderate forest site, fresh site, moist and highly moist forest site. We used equal number of control points with at least 30 points for each class. The accuracy assessment of the image is checked and accepted if the accuracy is higher than 80%. After accuracy assessment, the image was clumped and eliminated 2×1 pixels for Landsat 7 ETM satellite image and 10×10 pixels for Quickbird satellite image and vectorized into polygon coverage. Before the classification, Quickbird satellite image was resembled 5×5 meters because of data dimension classified into five forest site classes successfully for areas which are determined according to direct method. Whole areas were classified into five classes (dry, moderate fresh, fresh, moist and highly moist forest site). As a result of image classification, values of accuracy assessment and Kappa statistics (Conditional Kappa for each category) respectively 73.3% and 0.67 for Landsat 7 ETM, 90.7% and 0.88 for Quickbird image. Similarly, Gunlu et al. [9] classified forest site classes in Maçka Ormanüstü Forest Planning Unit with 84.44% accuracy 0.77 Kappa statistics. The maps were generated supervised of classification were given in (Figures 5-c and 5-d).

4.4. Statistical Analysis

The relative success of three forest site classification methods was realized using statistical analysis. Here, for the nominal forest site classification data, dry, moderate fresh, fresh, moist and highly moist site classes were considered and a chi-square test in a n×m contingency table with Likelihood Ratio Correction by SPSS Cross-Tabulation procedure [26] was used to test for the hypothesis of independence of the rows and columns of a contingency table [27-28]. The contingency table was used to reveal the distribution of sample plots to forest sites determined by SI method and RSM against to direct method, and thus, evaluate the success of SI method and RSM in estimating forest site classes.

5. Results and Discussion

In this study, forest site map was generated using direct method, SI method and RSM. The supervised classification was applied to Landsat 7 ETM and Quickbird satellite images of the sample area using forest site map generated from the ground measurements. The classification resulted in development of forest site maps using classified images and the resultant forest site maps were compared for accuracy.
The classification results indicated the dry site of 19.0 ha, moderate fresh site of 29.2 ha, fresh site of 338.8 ha, moist site of 171.0 and highly moist site of 42.0 ha in direct method; sites I-II of 263.4 ha, site III of 302.2 ha, sites IV of 19.0 ha and treeless-degraded areas of 15.4 ha in SI method; dry site of 69.4 ha, moderate fresh site of 106.4 ha, fresh site of 244.8 ha, moist site of 134.2 and highly moist site of 45.2 ha in Landsat 7 ETM satellite image in Table 2; dry site of 99.1 ha, moderate fresh site of 73.4 ha, fresh site of 218.0 ha, moist site of 172.2 and highly moist site of 37.3 ha in Quickbird satellite image in Table 3. The open areas such as treeless and degraded areas (15.4 ha) were not determined by SI method but by direct method and RSM (Table 2 and Table 3).
Forest site classification indicated that direct and SI methods were consistent (Table 2). For example, 3% dry site (19.0 ha), fresh and moderate fresh sites of 61% (368.0 ha), moist and highly sites of 36% (213.0 ha) were determined by the direct method and site IV of 3% (19.0 ha), III of 50% (302.2 ha) and I-II of 44% (263.4 ha) by the SI method. Only 15.4 ha area was not determined by the SI method. Such results ascertain the consistency of two methods. However, some important differences were observed between direct and SI methods as indicated by other researches [8, 9]. The most important differences occur in managed forests and particularly in degraded forest areas. Almost half of forest areas is degraded in Turkey creating a serious problem in determining sites with appropriate SI values. As the target trees (dominant and co-dominant) in the degraded areas have been cut down either with management plan or irregular disturbances, it is almost impossible to find suitable (or target) trees to determine sites with SI method. In this study, no apparent differences were observed between the direct and SI method due to the fact that the area is not under heavy management over few decades and thus the target trees have not been cut down either with management plan or irregular disturbances. Therefore, it is possible to find appropriate trees to determine sites with SI method in the study area.
Comparison of the SI method and RSM reveals some important differences. For example, (15%) 15.4 ha area of fresh forest site was not determined by SI method but was by RSM. Likewise, 19.0 ha (100%) of 19.0 ha poor site was determined by SI method, 14.9 ha (78%) poor site was in Landsat 7 ETM satellite image and 17.4 ha (92%) poor site in Quickbird satellite image. Similarly, 240.5 ha (71%) of 338.8 ha moderate site was determined by SI method, 224.8 ha (66%) moderate in Landsat 7 ETM image and 195.2 ha (58%) moderate site in Quickbird image. Similar results were observed in other forest sites using Landsat 7 ETM satellite image and Quickbird satellite image as indicated in Table 2.
The relationships between forest sites determined by direct method and SI method were statistically analyzed with chi-square test. The area distribution of sites by SI method and RSM (Landsat 7 ETM satellite image and Quickbird satellite image) against the direct method was given by a contingency table. The chi-square test showed statistically significant high association between direct method and RSM based on Quickbird satellite image (χ2 = 36.794; df = 16; p = 0.002), for example 22 plots classified as MF site in direct method were predicted as mostly MF sites (9 plots) and F site (7 plots) by RSM based on Quickbird satellite image, and 12 plots classified as HM in direct method similarly predicted as mostly HM sites (6 plots) and M site (3 plots) by RSM on Quickbird satellite image in Table 4. Also, the chi-square test presented moderate association between direct method and indirect method based on SI curves developed by Carus (1998) (χ2 = 16.724; df = 8; p = 0.033), for example 22 plots classified as MF site in direct method were predicted as mostly poor site (14 plots), and 30 plots classified as M predicted as good (10 plots) and moderate (12 plots) site by indirect method based on SI curves. However, Landsat 7 ETM satellite image has no statistically significant association with direct method by the chi-square test (χ2 = 22.291; df = 16; p = 0.134), for example 22 plots were classified as MF in direct method predicted as D (5 plots), MF (5 plots), F (3 plots), M (5 plots) and MH (4 plots) site by Landsat 7 ETM satellite image, also 30 plots classified as M in direct methods predicted D (2 plots), MF (8 plots), F (10 plots), M (6 plots), HM (4 plots) by Landsat 7 ETM satellite image.

6. Conclusions

Forest sites were classified successfully by the direct and SI methods and RSM using supervised classification with a 0.67 kappa statistic value and 73.3% accuracy assessments; 0.88 kappa statistic value and 90.7% accuracy assessments, respectively. The study indicated that height of dominant trees (site index) was an adequate measure of site productivity in relatively unmanaged forest areas. However, as the target trees (dominant and co-dominant) in degraded areas have been cut down either with management plan or irregular disturbances, it is almost impossible to find suitable trees to classify sites with SI method. Although the direct method appears to be an appropriate method for classifying forest sites, particularly in degraded and open areas, it is obviously very time-consuming, difficult and expensive to carry out in larger areas. In this case, RSM with appropriate spatial, temporal, spectral and radiometric resolutions may be a good option for large areas when it is supported with sound field survey data.

Acknowledgments

We would like to extend our appreciation and thanks to Faruk Yılmaz and Engin Güvendi who assisted greatly in our field work.

References

  1. Skovsgaard, J.P.; Vanclay, J.K. Forest site productivity: a review of the evolution of dendrometric concepts for even-aged stands. Forestry 2007, 81, 13–31. [Google Scholar]
  2. Dieguez-Aranda, U.; Grandas-Arias, J.A.; Alvarez-Gonzalez, J.G.; Von Gadow, K. Site quality curves for Birch Stands in North-Western Spain. Silva Fenn. 2006, 40(4), 631–644. [Google Scholar]
  3. Hägglund, B. Evaluation of forest site productivity. Forestry. Abstr. 1981, 42, 515–527. [Google Scholar]
  4. Vanclay, J.K. Modelling Forest growth and yield: applications to mixed tropical forests; CAB International: Wallingford, 1994. [Google Scholar]
  5. Avery, T.E.; Burkhart, H.E. Forest Measurements, 5th edn; McGraw-Hill: New York, 2002. [Google Scholar]
  6. Skovsgaard, J.P. Forest measurements. Encycl. For. Sci. 2004, 2, 550–566. [Google Scholar]
  7. Burger, J.A. Soil and its relationship to forest productivity and health. Encycl. For. Sci. 2004, 3, 1189–1195. [Google Scholar]
  8. Altun, L.; Baskent, E.Z.; Gunlu, A.; Kadiogullari, A.İ. Classification and mapping forest sites using geographic information system (GIS): a case study in Artvin Province. Environ. Monitor. Assess. 2008, 137, 149–161. [Google Scholar]
  9. Gunlu, A.; Baskent, E.Z.; Kadiogullari, A.İ.; Altun, L. Forest site lassification using Landsat 7 ETM data; A case study of Maçka-Ormanüstü Forest, Turkey. Environ. Monitor. Assess. 2008. In press. [Google Scholar]
  10. Baskent, E.Z.; Barli, O.; Ayaz, H.; Bilgili, E.; Turna, I.; Ipek, A.; Altun, L. A new approach to restructure Turkish Forest Sector. Part I. Journal of Forest and Prey 2003, 6, 31–38. [Google Scholar]
  11. Anonymous. Sinop meteorology station climate data.; 2005. [Google Scholar]
  12. Altun, L. The role of site factors in distinguishing forest sites in Trabzon-Maçka Ormanustu forest. PhD thesis, Karadeniz Technical University, The Graduate School of Natural and Applied Sciences, Trabzon: Turkey, 1995. [Google Scholar]
  13. Kantarci, M.D. Investigating forest soil types and forest site classification mapping in Belgrad forests. Istanbul University; In Journal of Forestry Faculty; Istanbul: Turkey, 1980; p. 350. [Google Scholar]
  14. Bakkaloglu, M. Classification and mapping of forest sites in Gumushane-Karanlıkdere Forest District. PhD thesis, Karadeniz Technical University, The Graduate School of Natural and Applied Sciences, Trabzon: Turkey, 2003. [Google Scholar]
  15. Gunlu, A. A study about distinguishing and mapping forest site in Artvin-Genya mountain, Turkey. MScF thesis, Karadeniz Technical University, The Graduate School of Natural and Applied Sciences, Trabzon: Turkey, 2003. [Google Scholar]
  16. Cepel, N. Practical base of forest sites introduction and forest site map.; Kurtulmuş Press: Istanbul, Turkey, 1966. [Google Scholar]
  17. Cepel, N. Forest Ecology; Istanbul University, Faculty of Forestry: Istanbul: Turkey, 1988; p. 536. [Google Scholar]
  18. Erinc, S. Climatology and methods; Istanbul University, Oceanography and Geography Institute: Istanbul: Turkey, 1984; p. 540. [Google Scholar]
  19. Kantarci, M.D. Soil Science; Istanbul University, Faculty of Forestry: Istanbul, 2000; p. 420. [Google Scholar]
  20. Wang, G.G. Is height of dominant trees at a reference diameter an adequate measure of site quality? For. Ecol. Manage. 1998, 80, 95–105. [Google Scholar]
  21. Davis, L.S.; Johnson, K.N.; Bettinger, P.S.; Howard, T.E. Forest management, to sustain ecological, economic and social valuesMcGraw Hill Series in Forest Resources, 4th ed; New York, 2001. [Google Scholar]
  22. Carus, S. Increment and growth in even aged beech (Fagus orientalis Lippsky.) forests. Postgraduate Thesis, The Graduate School of Natural and Applied Sciences, Istanbul University, Istanbul, Turkey, 1998. [Google Scholar]
  23. Clutter, J.L.; Fortson, J.C.; Pienaar, L.V.; Brister, G.H.; Bailey, R.L. Timber Management: A Quantitative Approach; Wiley: New York, 1983. [Google Scholar]
  24. ESRI. Using ArcMap; Environmental Systems Research Inc.: Redlands, 1999. [Google Scholar]
  25. Erdas Field Guide, 6th ed; Erdas LLC: Atlanta, Georgia, 2002.
  26. SPSS Institute Inc. SPSS Base 15.0 User’s Guide; 2007. [Google Scholar]
  27. Norušis, M.J. Guide to Data Analysis; Prentice-Hall: Upper Saddle River, NJ, 1998. [Google Scholar]
  28. Siegel, S.; Castellan, N.J. Nonparametric Statistics for the Behavioural Sciences; McGraw-Hill: New York, 1988. [Google Scholar]
Figure 1. The geographic location of the study area surrounded with solid red lines.
Sensors 08 02526f1
Figure 2. The water balance of the second elevation climate zone over a year.
Sensors 08 02526f2
Figure 3. Ecological soil units map.
Sensors 08 02526f3
Figure 4. Forest site classes according to topographic factors.
Sensors 08 02526f4
Figure 5. Illustrations of forest sites determined with a) direct method, b) SI method, c) RSM (Quickbird satellite image) method and d) RSM (Landsat 7 ETM satellite image).
Sensors 08 02526f5
Table 1. Forest site classification and corresponding site index values.
Index valueForest site classificationSite index
< 8Very Dry (VD)IV-V
8-15Dry (D)

15-23Moderate Fresh (MF)III
23-40Fresh (F)

40-55Humid (H)I-II
>55Hygric (Hy)
Table 2. Distribution of forest sites determined by three methods; direct, SI and RS (Landsat 7 ETM satellite image).
Direct MethodTotal (ha)RSM
(Landsat 7 ETM satellite image)
SI Method**


Forest Site*Forest Site


DMFFMHMIIIIIIIVVND
D19.014.90.81.91.4----19.0-
MF29.22.510.411.23.21.910.7-18.5--
F338.832.856.7168.158.722.529.653.3240.5--15.4
M171.015.230.555.055.914.4125.224.221.6--

HM42.04.08.08.615.06.420.4-21.6--

Total (ha)600.069.4106.4244.8134.245.2185.977.5302.219.015.4
(*)Forest Site: Moist and Highly Moist (good site), fresh and moderate fresh site (moderate site), dry site (poor site)
(**)SI: I and II (good site), SI: III (moderate site) and SI: IV and V (poor site)., ND: Not Determined.
Table 3. Distribution of forest sites determined by three methods: direct, SI and RS (Quickbird satellite image).
Direct MethodForest SiteTotal (ha)RSM
(Quickbird satellite image)
SI Method

Forest Site


DMFFMHMIIIIIIIVVND
D19.017.41.6------19.0-
MF29.23.210.96.05.83.310.7-18.5--
F338.860.041.0154.275.87.829.653.3240.5--15.4
M171.018.513.852.470.715.6125.224.221.6--

HM42.0-6.15.419.910.620.4-21.6--

Total (ha)600.099.173.4218.0172.237.3185.977.5302.219.015.4
Table 4. Contingency table showing the distribution of sample plots by forest sites determined by three methods; direct, SI and RS (Landsat 7 ETM satellite image and Quickbird satellite image).
Direct MethodTotal (N)RSMSI Method

Landsat ETM satellite imageQuickbird satellite imageSite Class
Forest SiteForest Site

DMFFMHMDMFFMHMGood SiteModerate SitePoor Site
D11----1------1
MF2255354197415314
F5122--113--113
M30281064-4815310128
HM121-461-1236822
Total (N)70101519179315202210241828

