Suitability of MEMS Accelerometers for Condition Monitoring: An experimental study

School of Mechanical, Aerospace and Civil Engineering, University of Manchester, Manchester, M60 1QD, U.K.
*
Authors to whom correspondence should be addressed.
Sensors 2008, 8(2), 784-799; https://doi.org/10.3390/s8020784
Submission received: 30 November 2007
/
Accepted: 31 January 2008
/
Published: 6 February 2008
(This article belongs to the Special Issue Modeling, Testing and Reliability Issues in MEMS Engineering)
Abstract
:With increasing demands for wireless sensing nodes for assets control and condition monitoring; needs for alternatives to expensive conventional accelerometers in vibration measurements have been arisen. Micro-Electro Mechanical Systems (MEMS) accelerometer is one of the available options. The performances of three of the MEMS accelerometers from different manufacturers are investigated in this paper and compared to a well calibrated commercial accelerometer used as a reference for MEMS sensors performance evaluation. Tests were performed on a real CNC machine in a typical industrial environmental workshop and the achieved results are presented.
1. Introduction
Any major item of industrial machinery requires a certain degree of condition monitoring to enhance availability and plant safety. Often, one such monitoring technique is vibration based, that is, decisions regarding the repair or replacement of a machine part, overhauls, and standard maintenance are made on the basis of the measured condition of the machine. Proper machine condition monitoring procedures can result in lower maintenance costs and prolonged machine life.
Measuring vibration is very essential in detecting and diagnosing any deviation from normal conditions. The use of conventional piezoelectric accelerometers in vibration measurements is well known and accepted, but at high cost especially if simultaneous multiple data collection points are required e.g. wireless sensing networks; this is mainly because of their size, compatibility with the CMOS technology, cost and the price of the associated electronic signal conditioning circuits.
The recent advances in wireless and embedded system technologies such as Micro-Electro Mechanical systems (MEMS) sensors hold a great promise for the future of wireless smart vibration measurement based condition monitoring which are much cheaper alternatives. It has a built-in signal conditioning unit. The cost of MEMS accelerometer may be just 10% more or less compared to the commercially available cheapest conventional accelerometer together with the signal conditioning unit. According to mstNew of February 2007, in 2009, the total market for accelerometers is expected to have attained $ 630 million. The average price of MEMS accelerometer across all applications decreases, from an average of $ 2.50 in 2004 to less then $ 1.90 in 2009, with consumer applications driving to price erosion. There are a number of research studies in the literature [1-9] about MEMS accelerometers construction, mounting considerations, and measurement principle and performance evaluations.
MEMS-technology is widely used in some sectors such as automotive industry for measuring pressure, temperature and in air bags systems. However the use of the MEMS accelerometers for electromechanical plants condition monitoring is still limited to testing stage in the laboratory experiments; Sabin [10] has used the MEMS accelerometer together with a conventional accelerometer for measuring the vibration of a pump during its normal operation. Sabin [10] found that the frequency content from both sensors were in good agreement. However, no rigorous investigation has been done to compare the performance of these MEMS accelerometers which are used for measuring the different kinds of signals – sinusoidal, random, and impulsive signals [11]. Hence, the performance of three of these MEMS accelerometers compared with a well known commercial accelerometer to understand the usefulness of these MEMS accelerometers are discussed here through a simple test facility.
2. MEMS Accelerometer
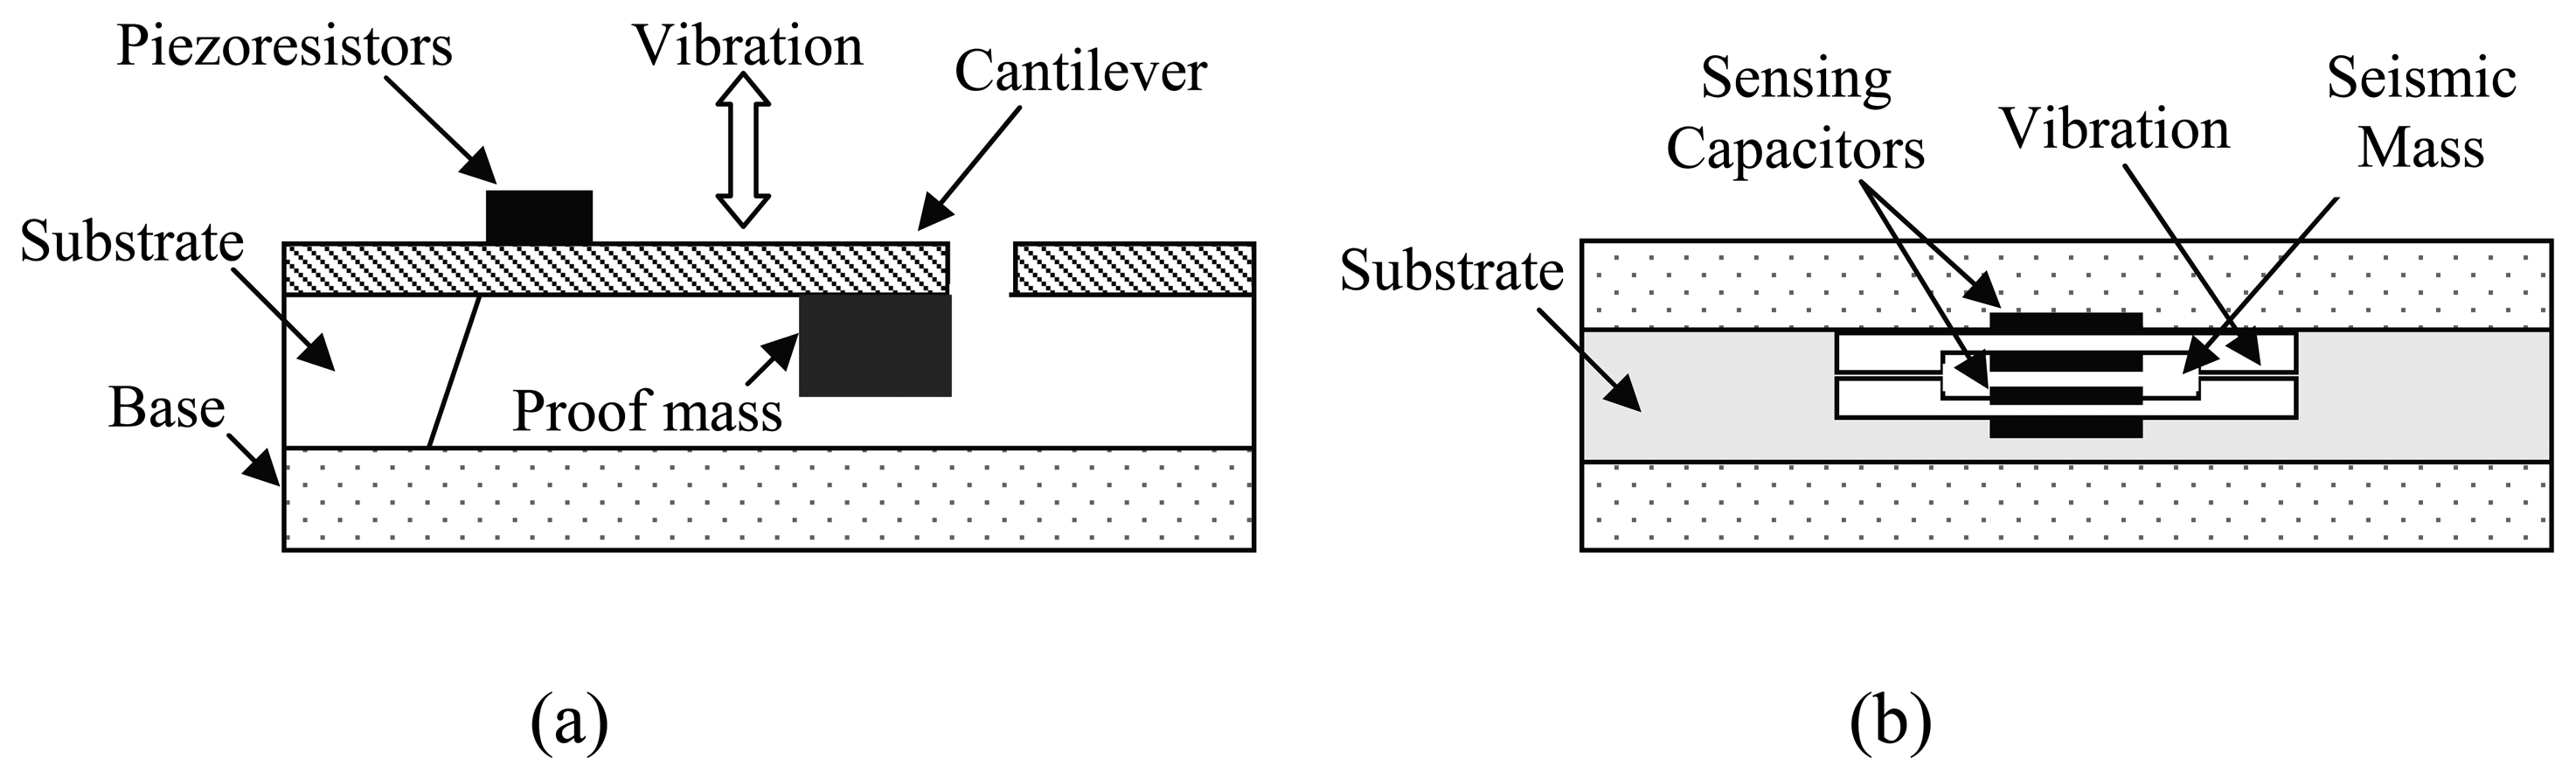
MEMS accelerometers are divided into two main types: Piezoresistive and capacitive based accelerometers [12]. Piezoresistive accelerometers consist of a single-degree of freedom system of a mass suspended by a spring. The MEMS accelerometer has also a cantilever beam with a proof mass at the beam tip and a Piezoresistive patch on the beam web. The schematic of a Piezoresistive MEMS accelerometer is shown in Figure 1(a). The inertia of the mass causes a change in the gap between the mass and the bulk of the device made of the silicon wafer when the device is subjected to acceleration. The mass may move out of the plane of the silicon wafer or in the plane (as is common in surface micro-machined devices). The electric signal generated from the Piezoresistive patch and the bulk device due to vibration is proportional to the acceleration of the vibrating object. Capacitive based MEMS accelerometers measure changes of the capacitance between a proof mass and a fixed conductive electrode separated by a narrow gap [13]. The schematic of a capacitive MEMS accelerometer is shown in Figure 1(b). Further information about the MEMS accelerometers working principles could be found in papers [1-7].
The choice of accelerometers depends on several factors and some of them are listed below:
- Sensitivity is the ratio of its electrical output to its mechanical input. The output usually is expressed in terms of voltage per unit of acceleration. The specification of sensitivity is sufficient for instruments which generate their own voltage independent of an external voltage power source. The sensitivity of an instrument requiring an external voltage usually is specified in terms of output voltage per unit of voltage supplied to the instrument per unit of displacement, velocity, or acceleration, e.g. milli-volts per volt per g of acceleration.
- Amplitude Limit specifies the maximum range of acceleration that can be measured by the accelerometer.
- Shock Limit is the maximum level of acceleration the accelerometer can withstand without causing damage to the unit.
- Natural Frequency is the frequency at which an undamped system with single degree of freedom will oscillate upon momentary displacement from its rest position. It determines the useful range of vibration measurement.
- Resolution is the smallest change in mechanical input (e.g. acceleration) for which a change in the electrical output is discernible. The resolution of an accelerometer is a function of the transduction element and the mechanical design. Recording equipment, indicating equipment, and other auxiliary equipment used with accelerometers often establish the resolution of the overall measurement system.
- Amplitude Linearity is the degree of accuracy that an accelerometer reports the output in voltage terms as it moves from being excited at the smallest detectable acceleration levels to the highest. This accuracy is qualified by its linearity, with a 1% deviation desirable.
- Frequency Range is the operating frequency range is the range over which the sensitivity of the transducer does not vary more than a stated percentage from the rated sensitivity. The range may be limited by the electrical or mechanical characteristics of the transducer or by its associated auxiliary equipment.
- Phase Shift is the time delay between the mechanical input and the corresponding electrical output signal of the instrumentation system.
More factors could also be considered such as the following:
- Environmental factors (such as temperature, humidity, electromagnetic noise tolerances, etc.)
- Sensor mounting options.
- Mounted resonant frequency.
- Grounding (isolated on non isolated).
- Transverse sensitivity.
- Mechanical resistance to wear, moisture, etc.
- Dimensions.
3. Test Setup
A schematic of the Test setup is shown in Figure 2. The setup consists of a small shaker linked to a shaker power amplifier, signal generator, and a PC based data acquisition for data collection and storage for further signal processing in MATLAB. Four accelerometers (one conventional accelerometer (piezo) and other three MEMS accelerometers (capacitive) were attached back to back on the armature attached to the shaker.
The conventional accelerometer and the MEMS accelerometers technical specifications are briefly listed in Table 1. The model numbers and the manufacturer's names of the MEMS accelerometers used in the experiments are deliberately not mentioned, as the intention is to share the experiences among several engineers and researchers involved in the area of vibration sensing and condition monitoring. Moreover, the MEMS accelerometers were packaged in metal containers with same size and weight (30g) to make them more robust for industrial use. The accelerometers were locked to the area of measurement using rapid glue. The MEMS mounting faces are circular. Their power supplies were stabilized to 5 volts using a solid state voltage regulator to avoid the power supply effects on the sensitivity. It is expected that such experience and observations presented in the paper would enhance the confidence level in performance evaluation and the reliability of the measured vibrations in future wireless sensing nodes.
4. Results and Discussion
In practical applications, accelerometers are usually used for measuring the periodic (sinusoidal, sweep-sine, step-sine, multi-sine, etc.), impulsive, and random signals, hence, these tests were carried out on the test setup shown in Figure 2 and results were compared. The responses of all accelerometers were collected simultaneously using BNC shielded cables and each output was connected to a four pole Butterworth response band pass filter of 7 to 3,000 Hz; to eliminate noise, interference and to avoid antialiasing. The data were collected at a sampling frequency of 9 kHz; averaged and Hanning windowing was employed for all tests.
4.1. Periodic Excitation
Sinusoidal signals were applied to the shaker at two frequencies 53Hz and 95Hz deliberately away from the line frequency of 50Hz and its harmonics. A number of experiments were performed at these two frequencies with different amplitude levels of shaker excitation and responses were simultaneously measured from all accelerometers.
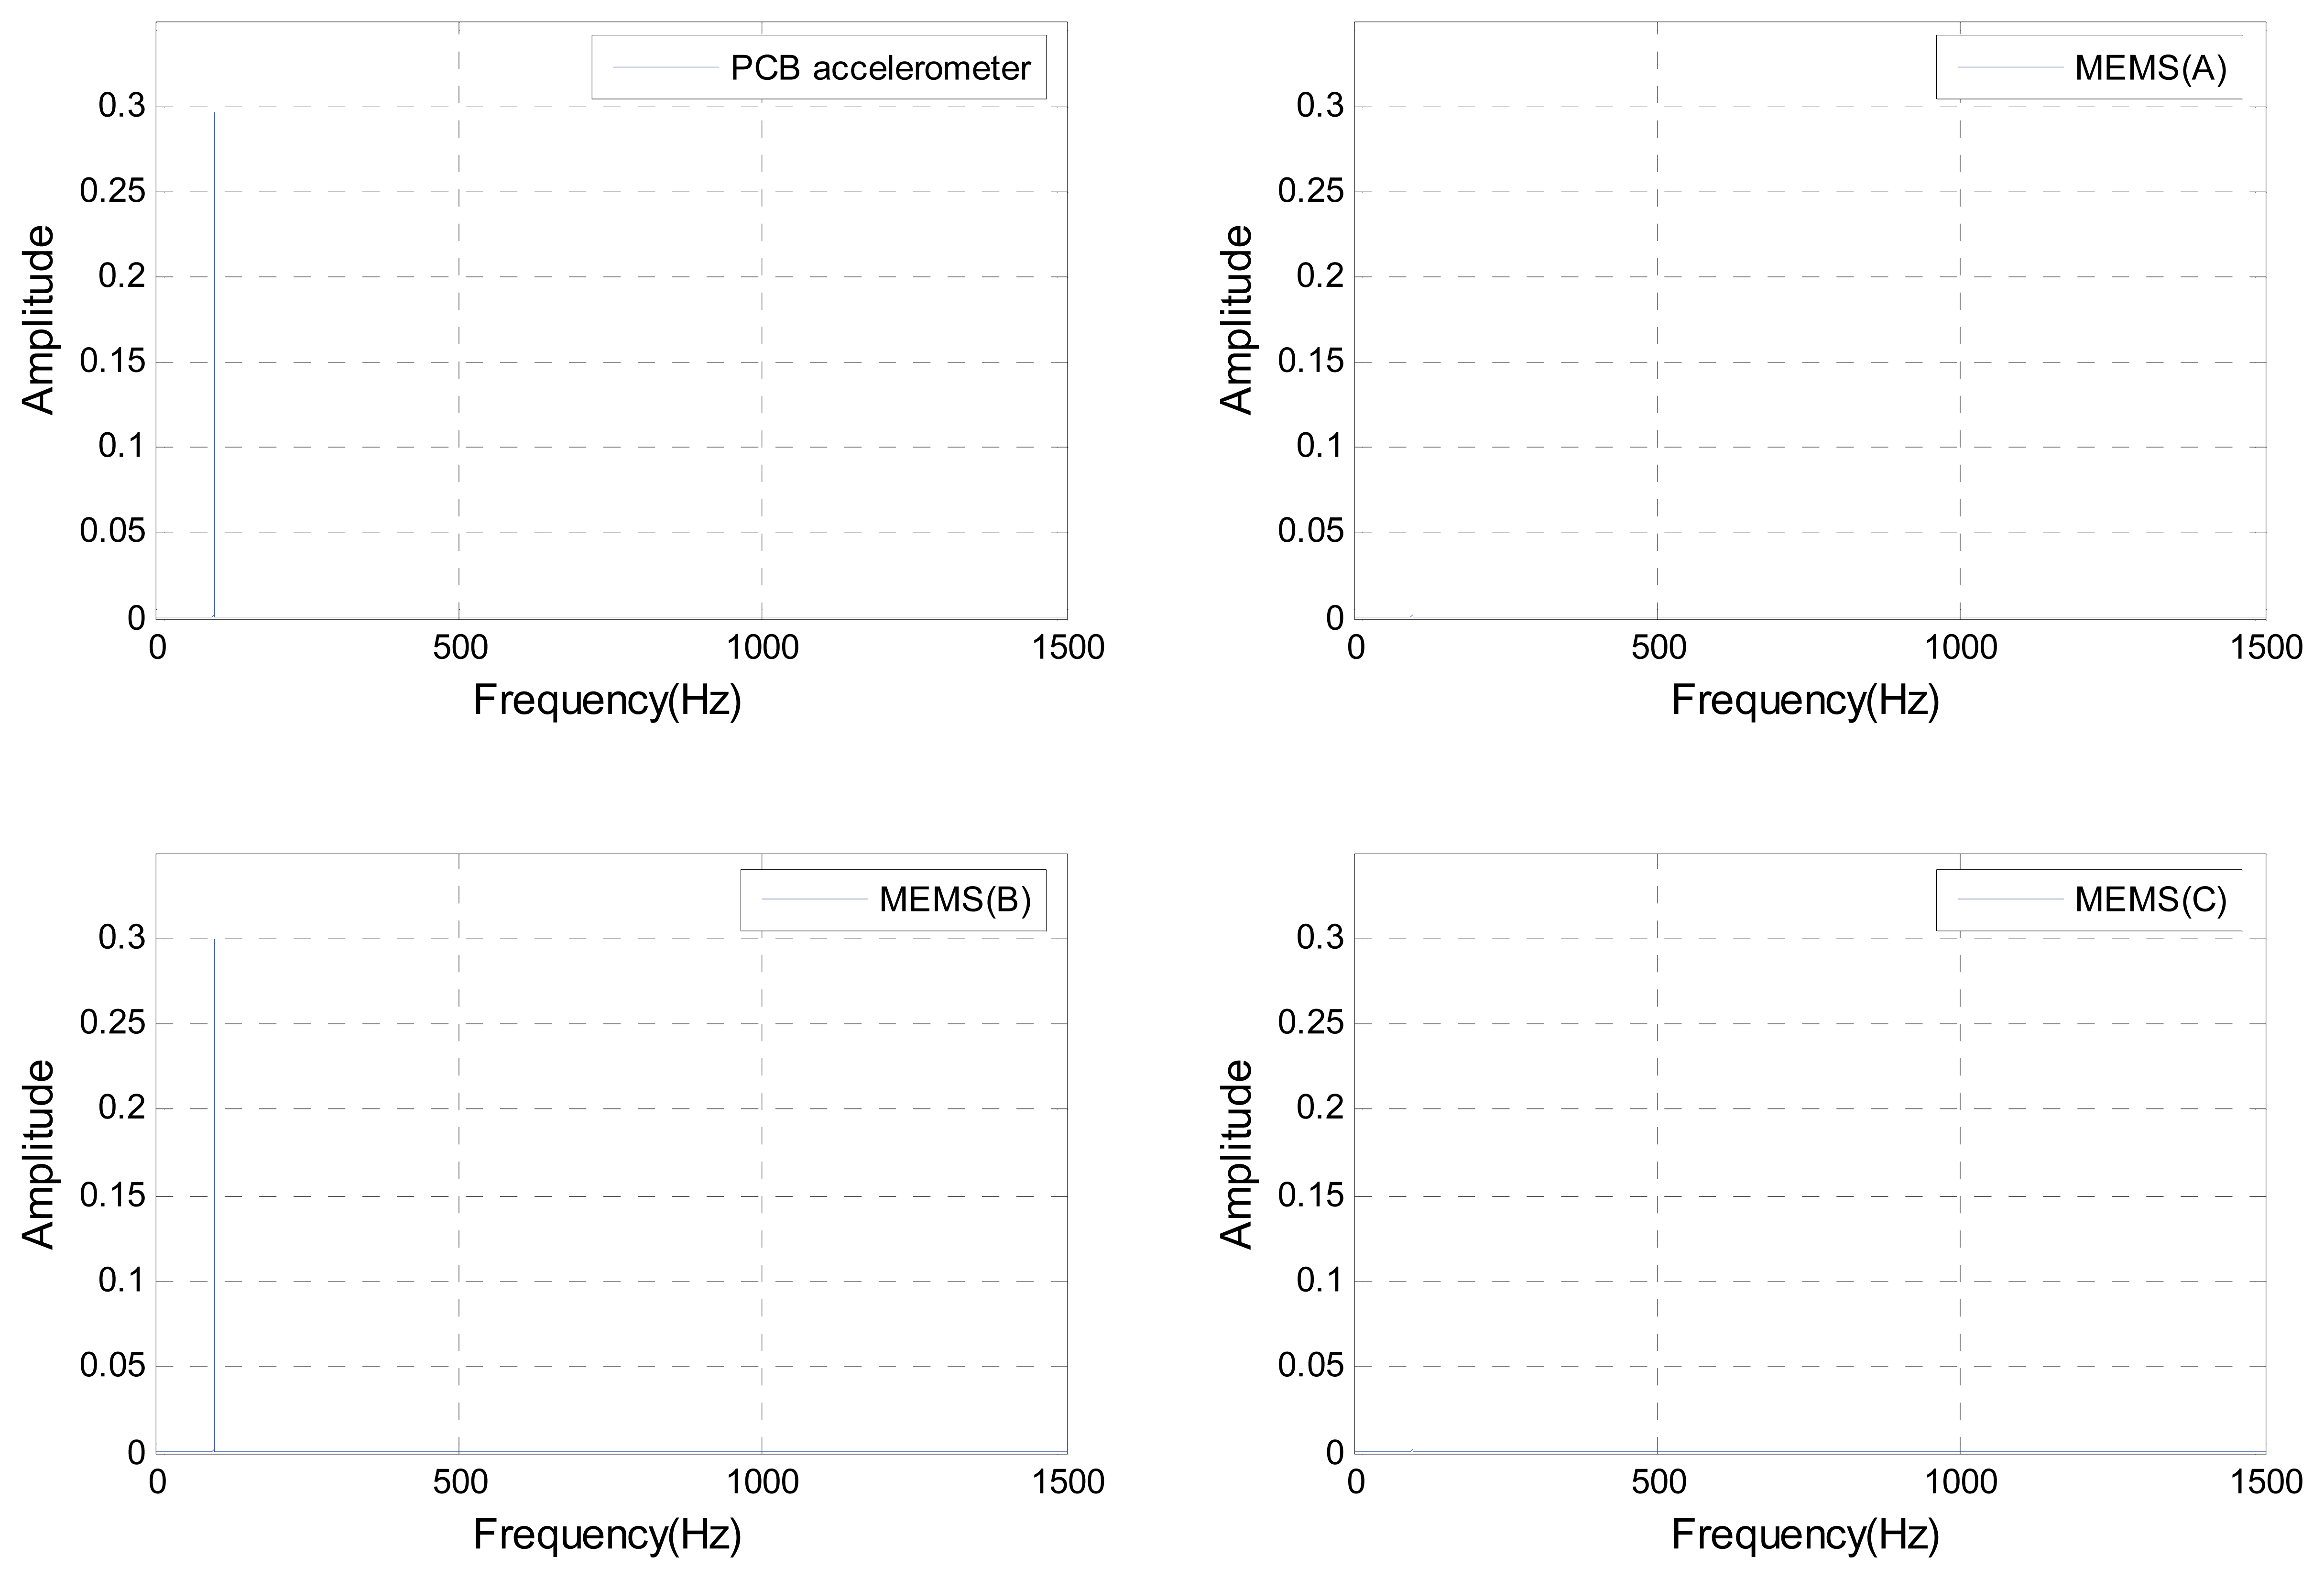
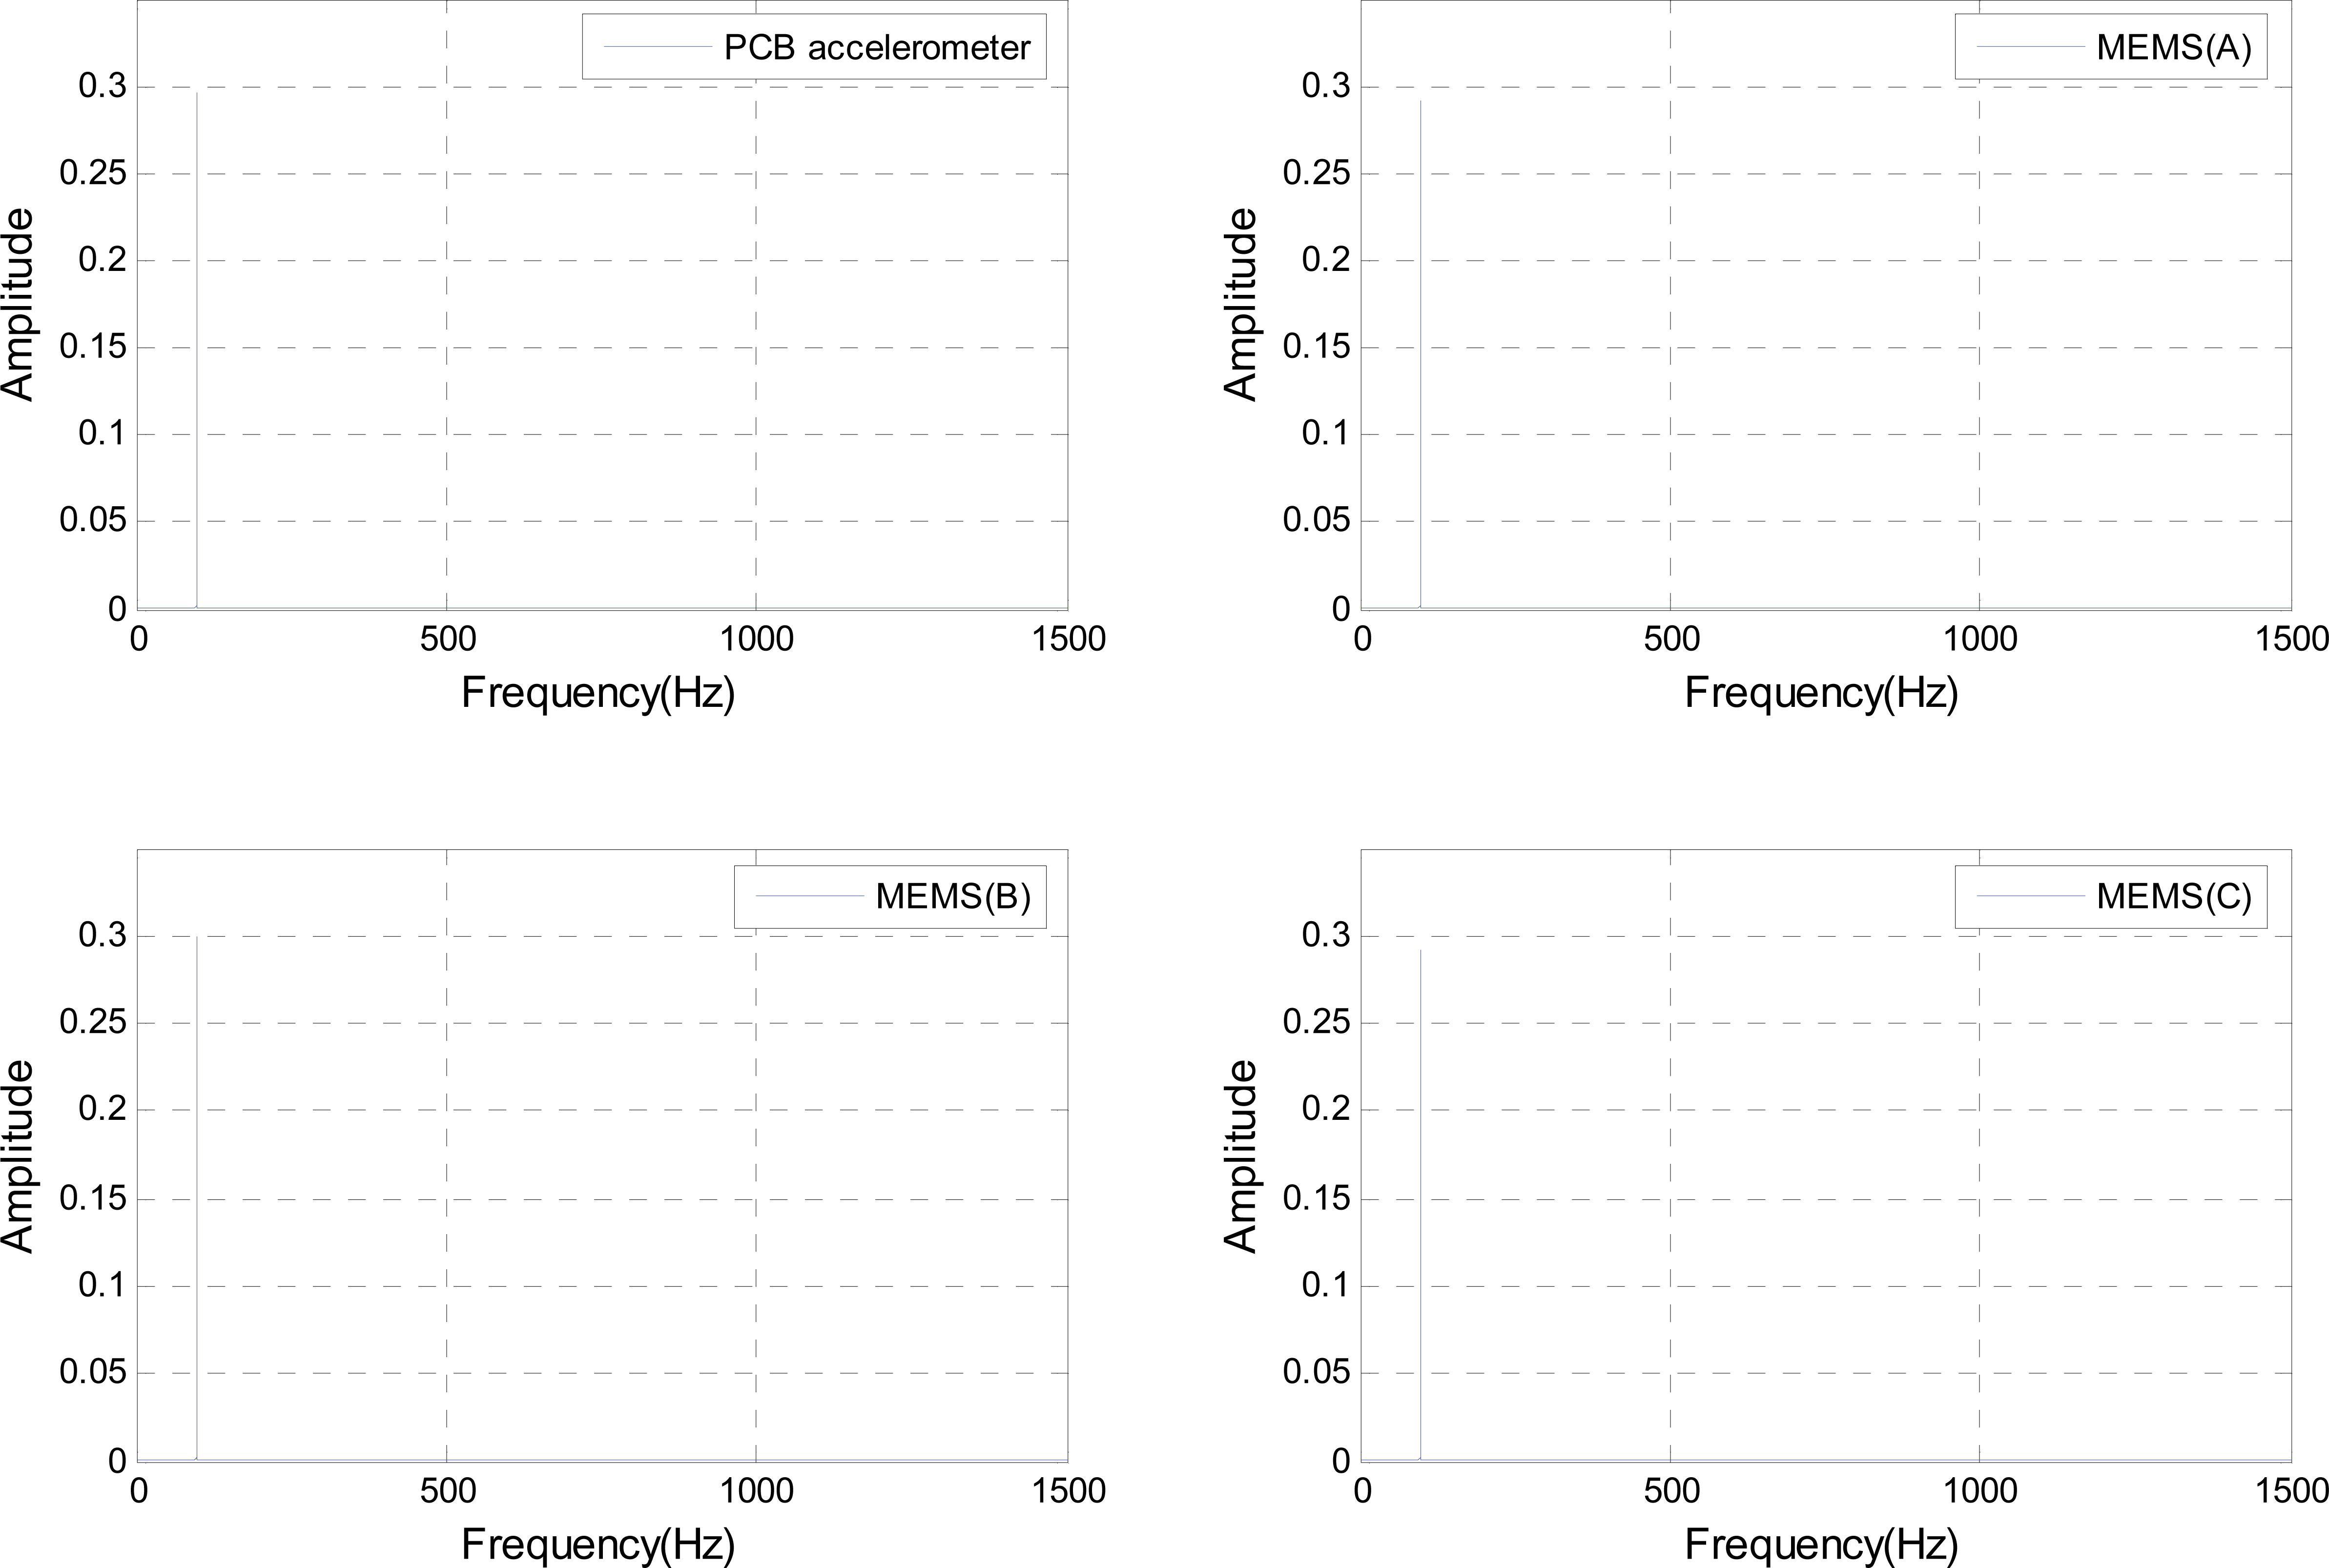
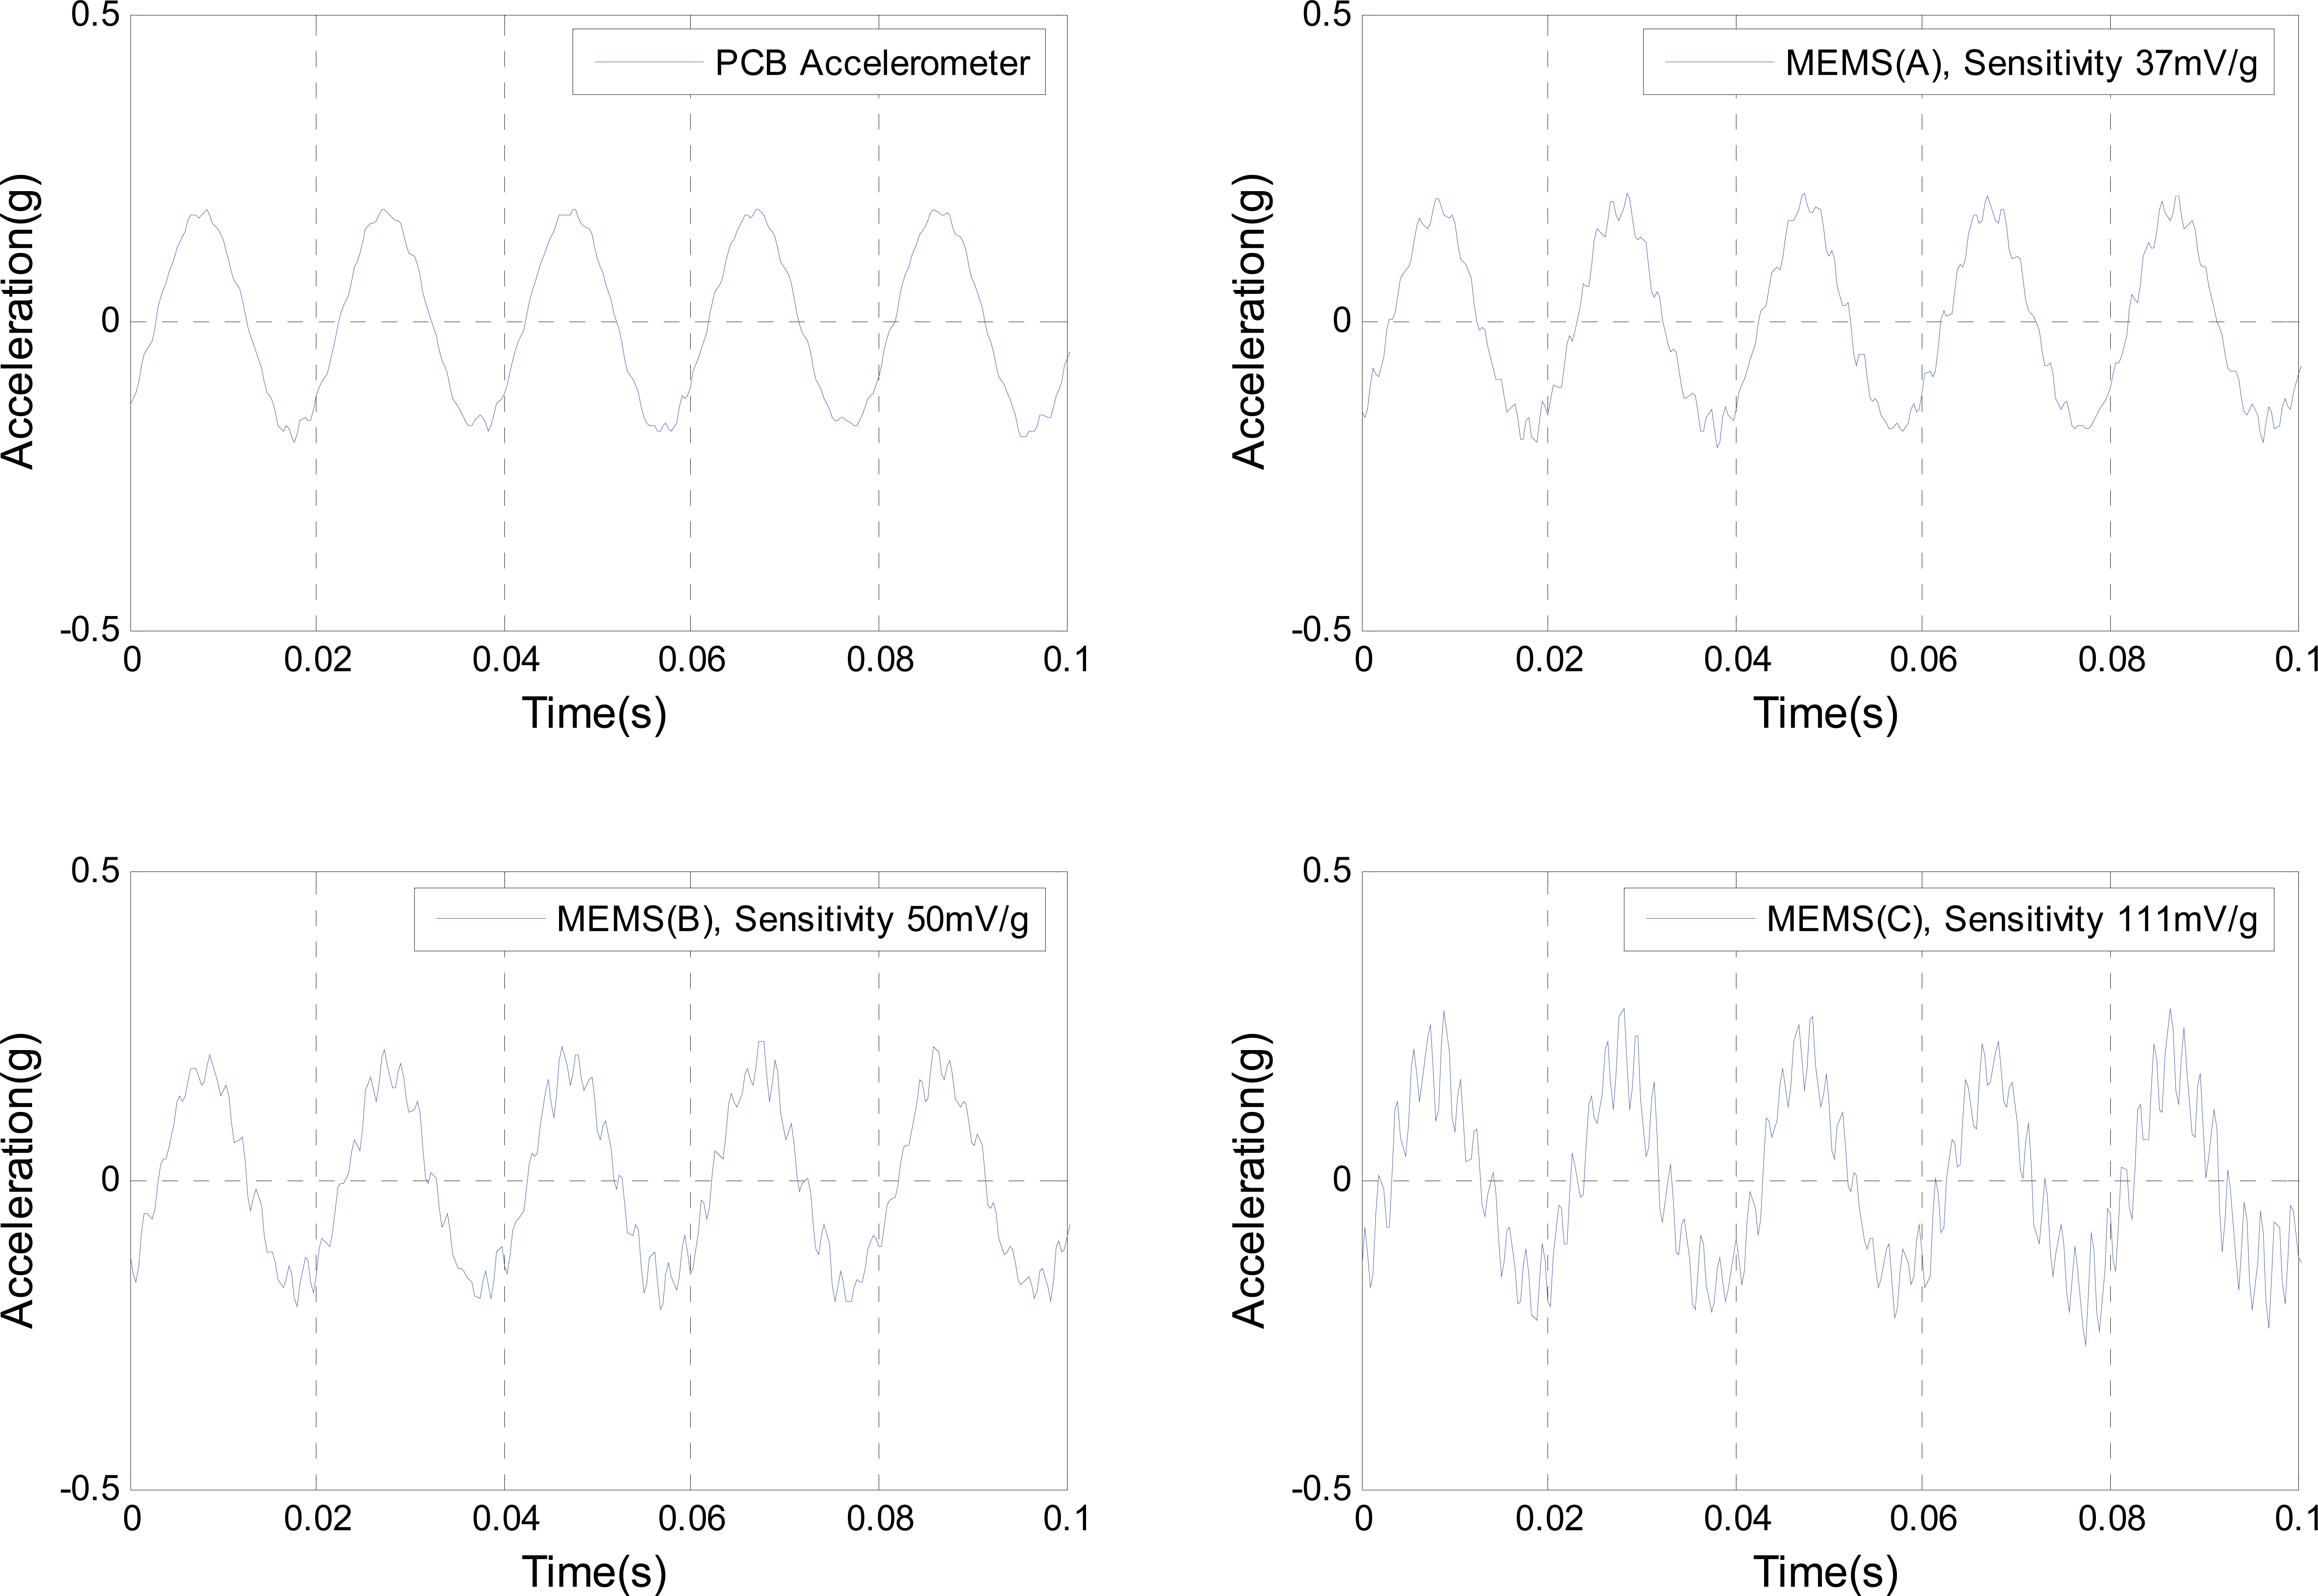
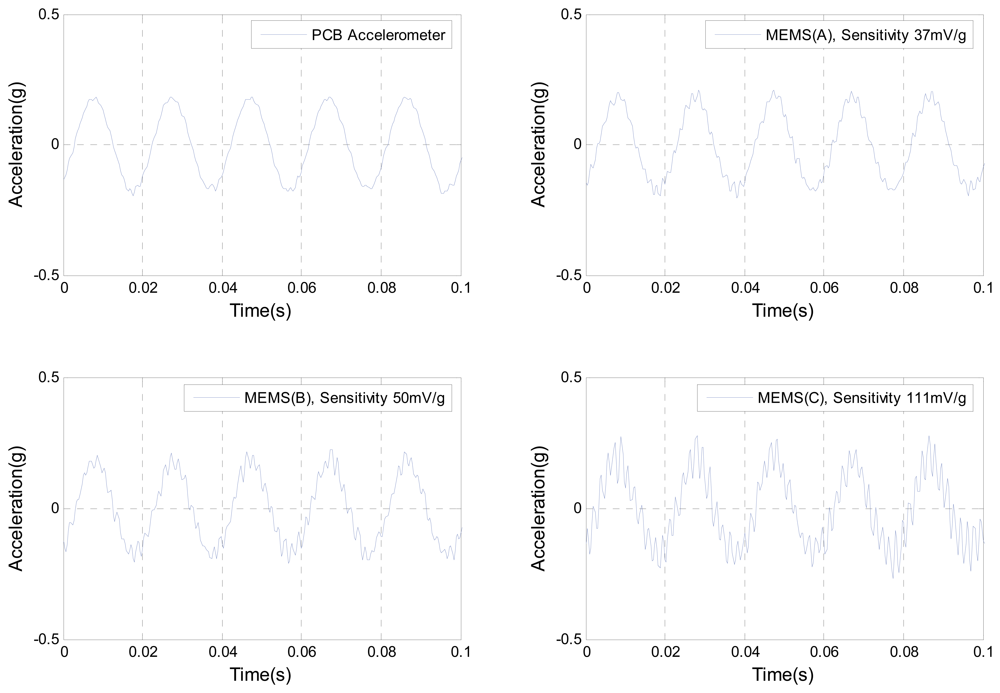
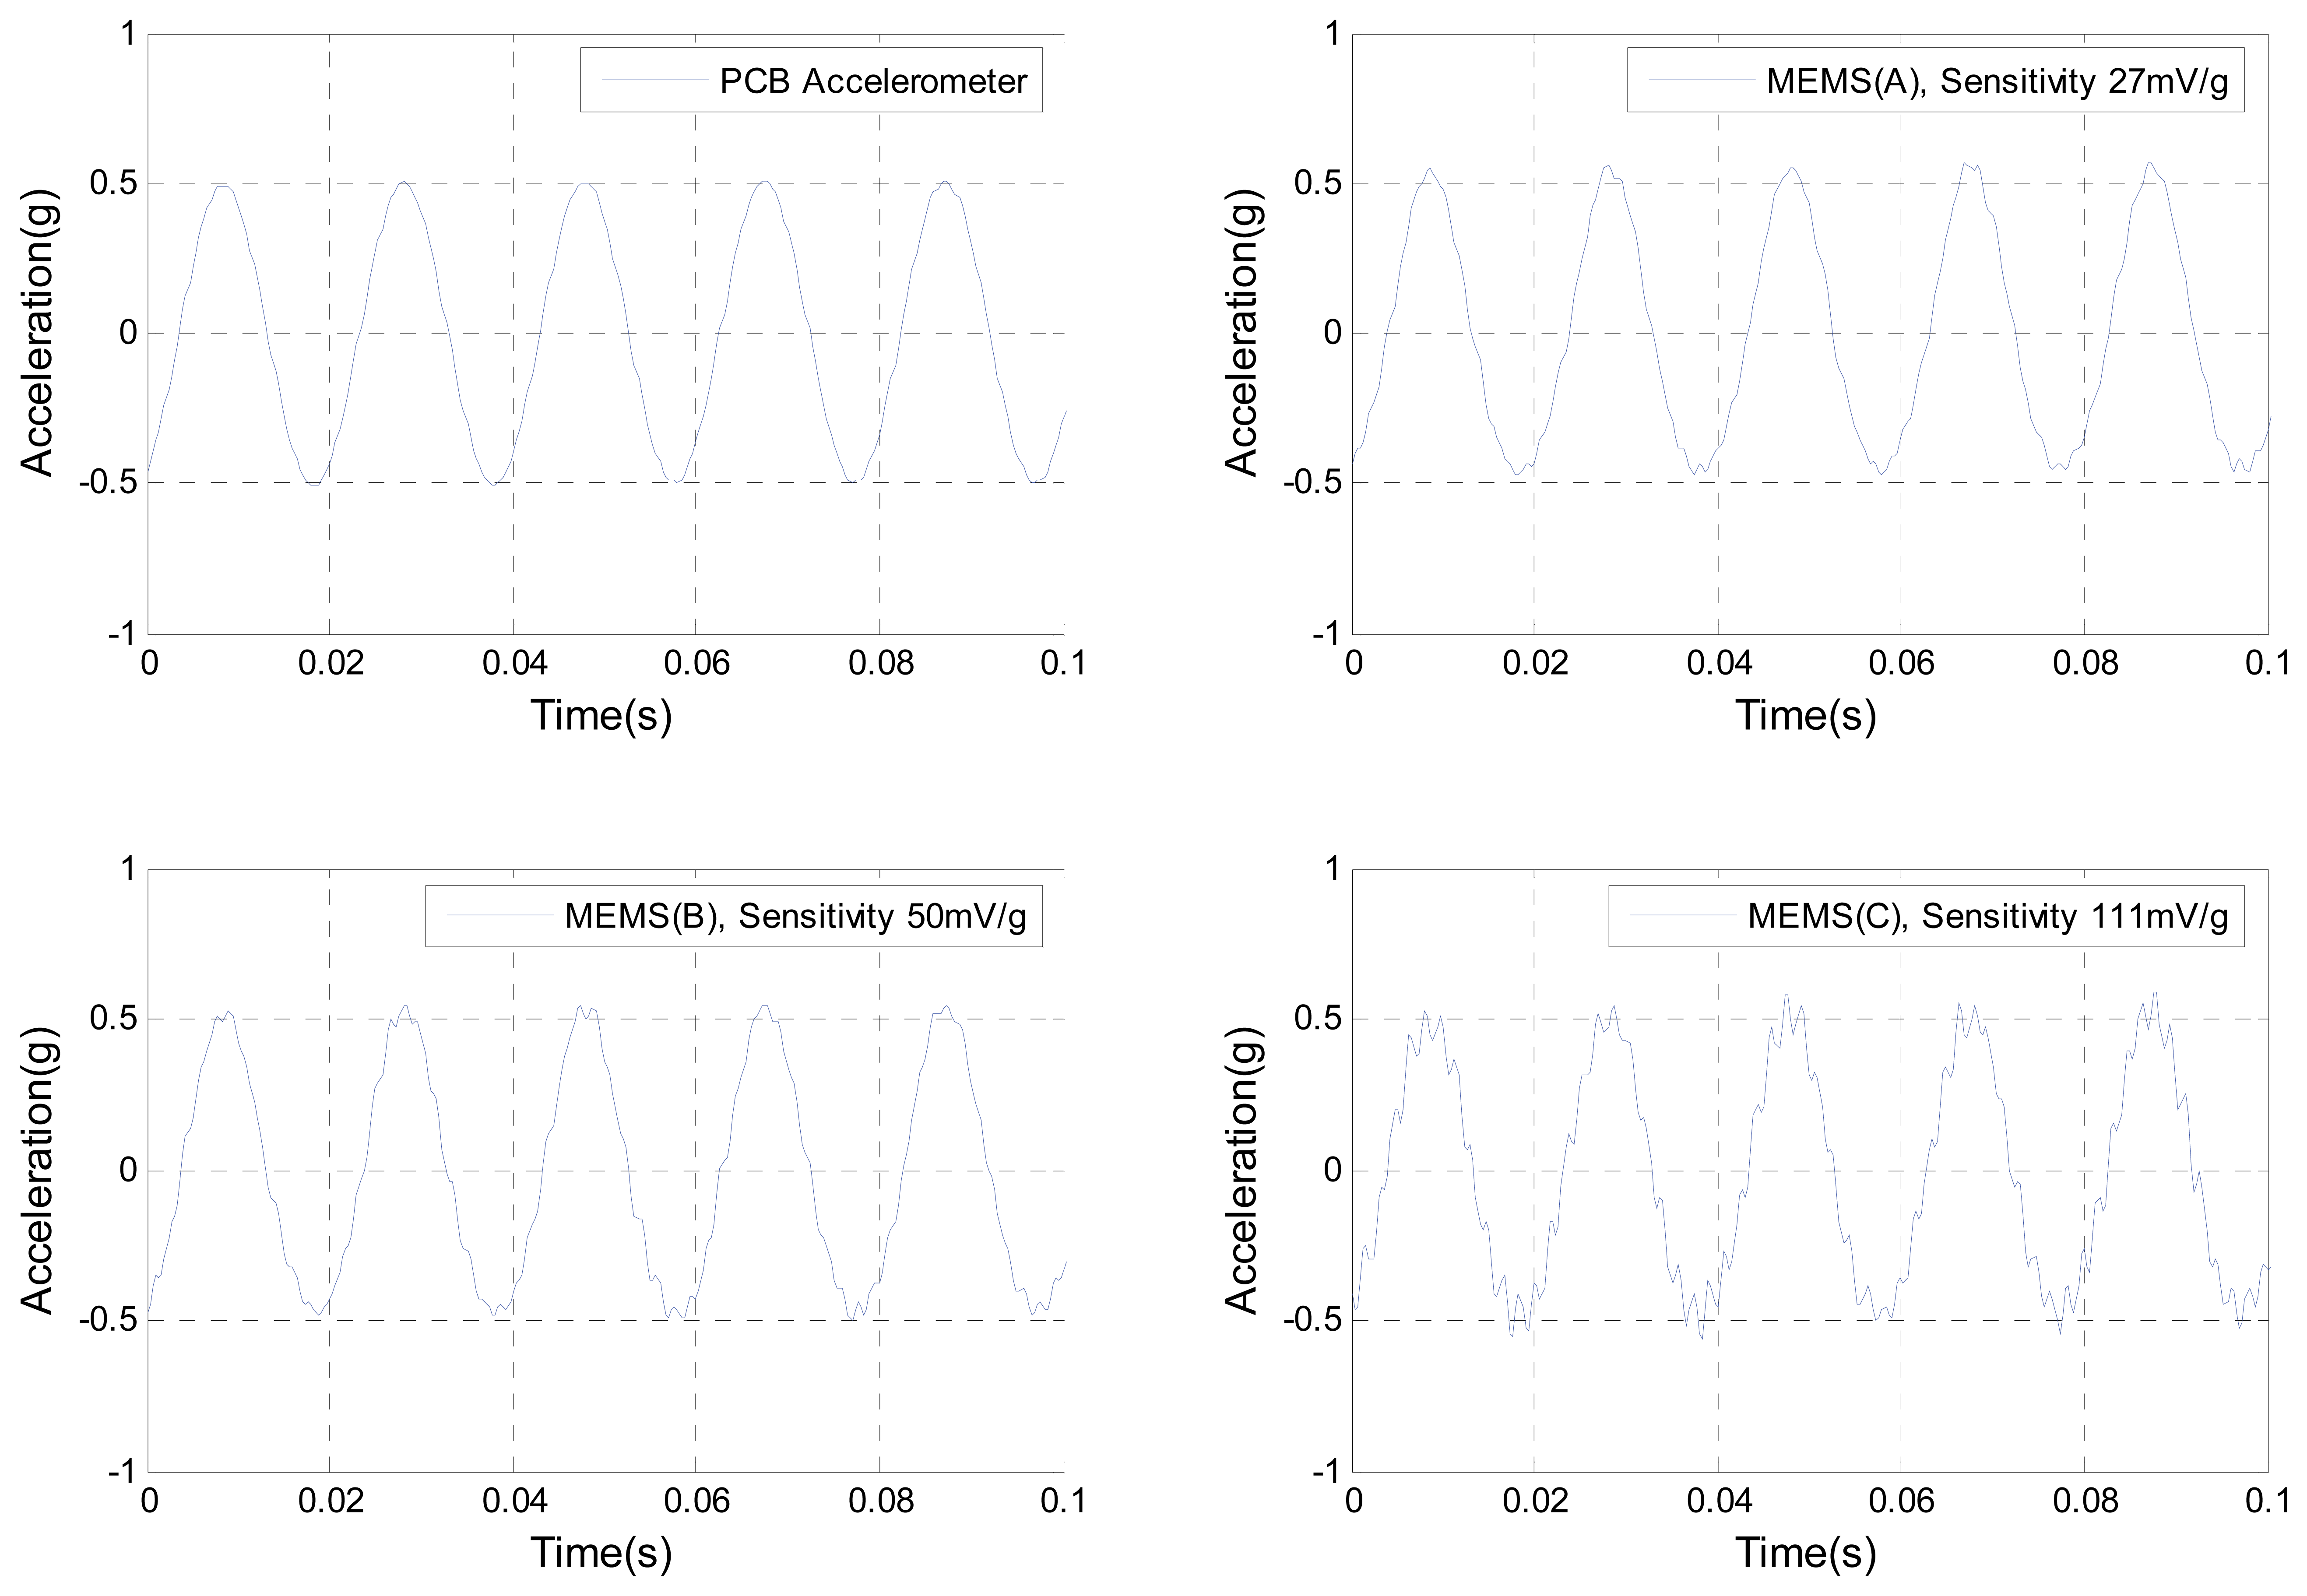
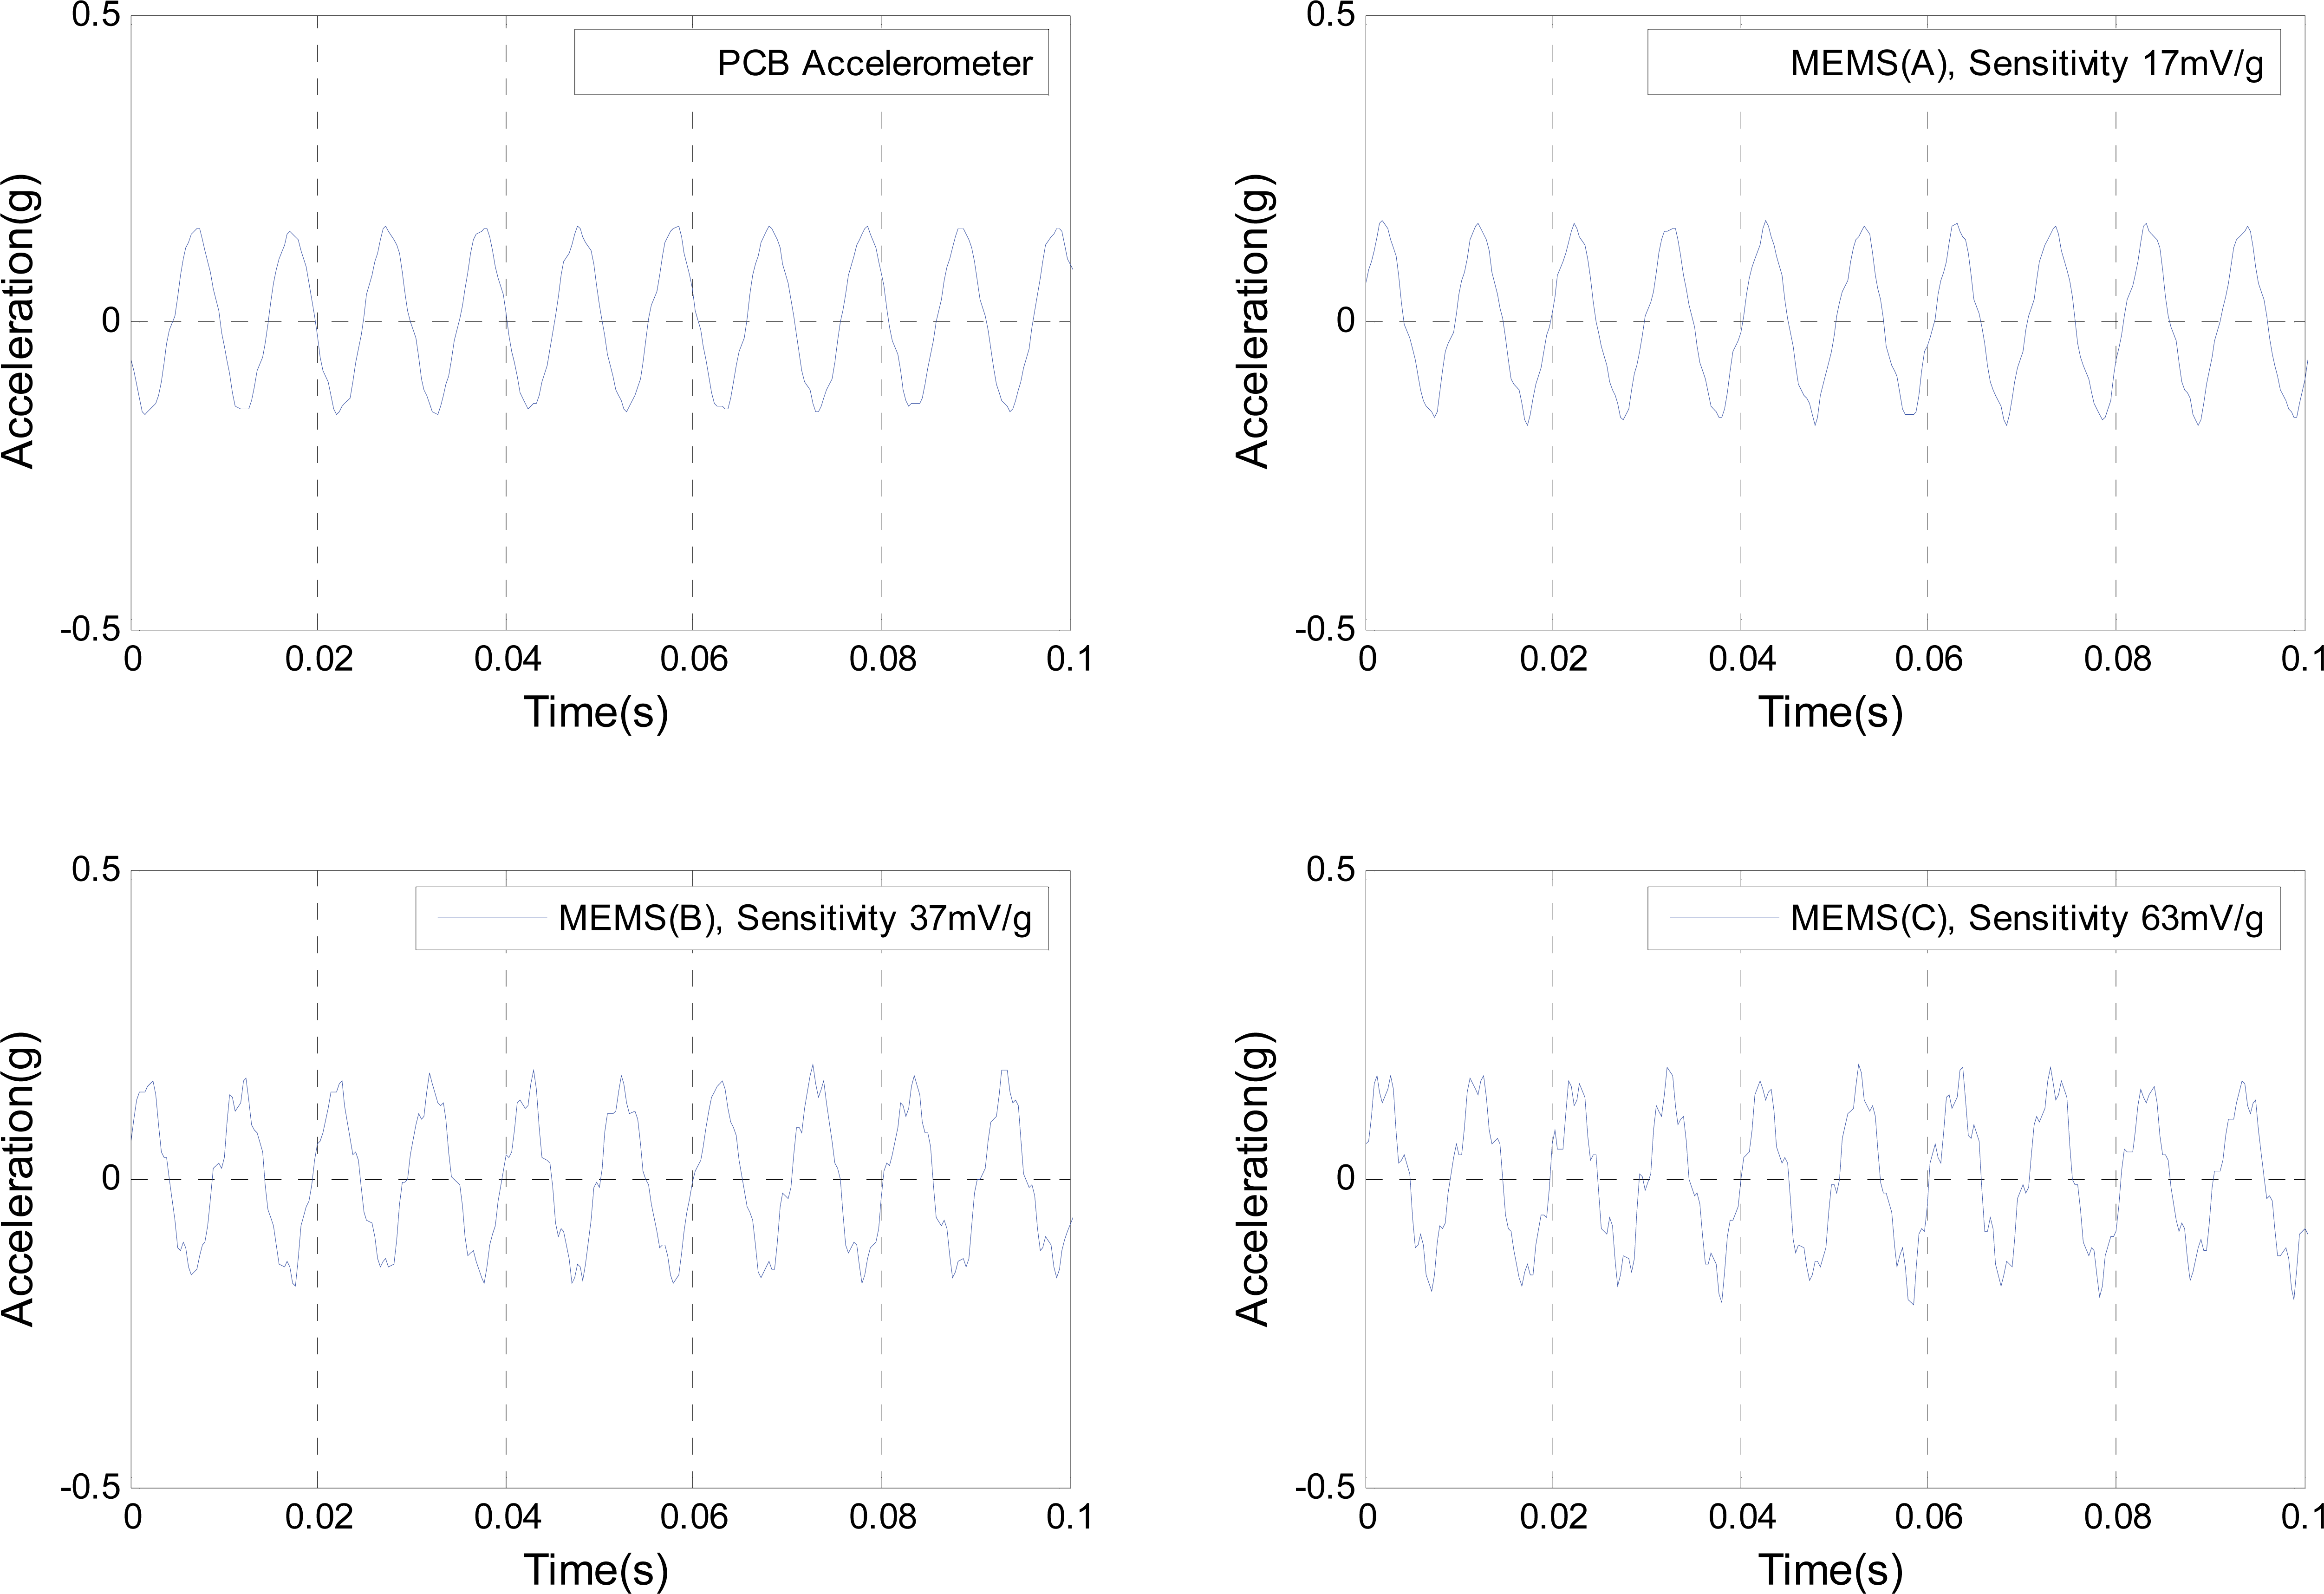
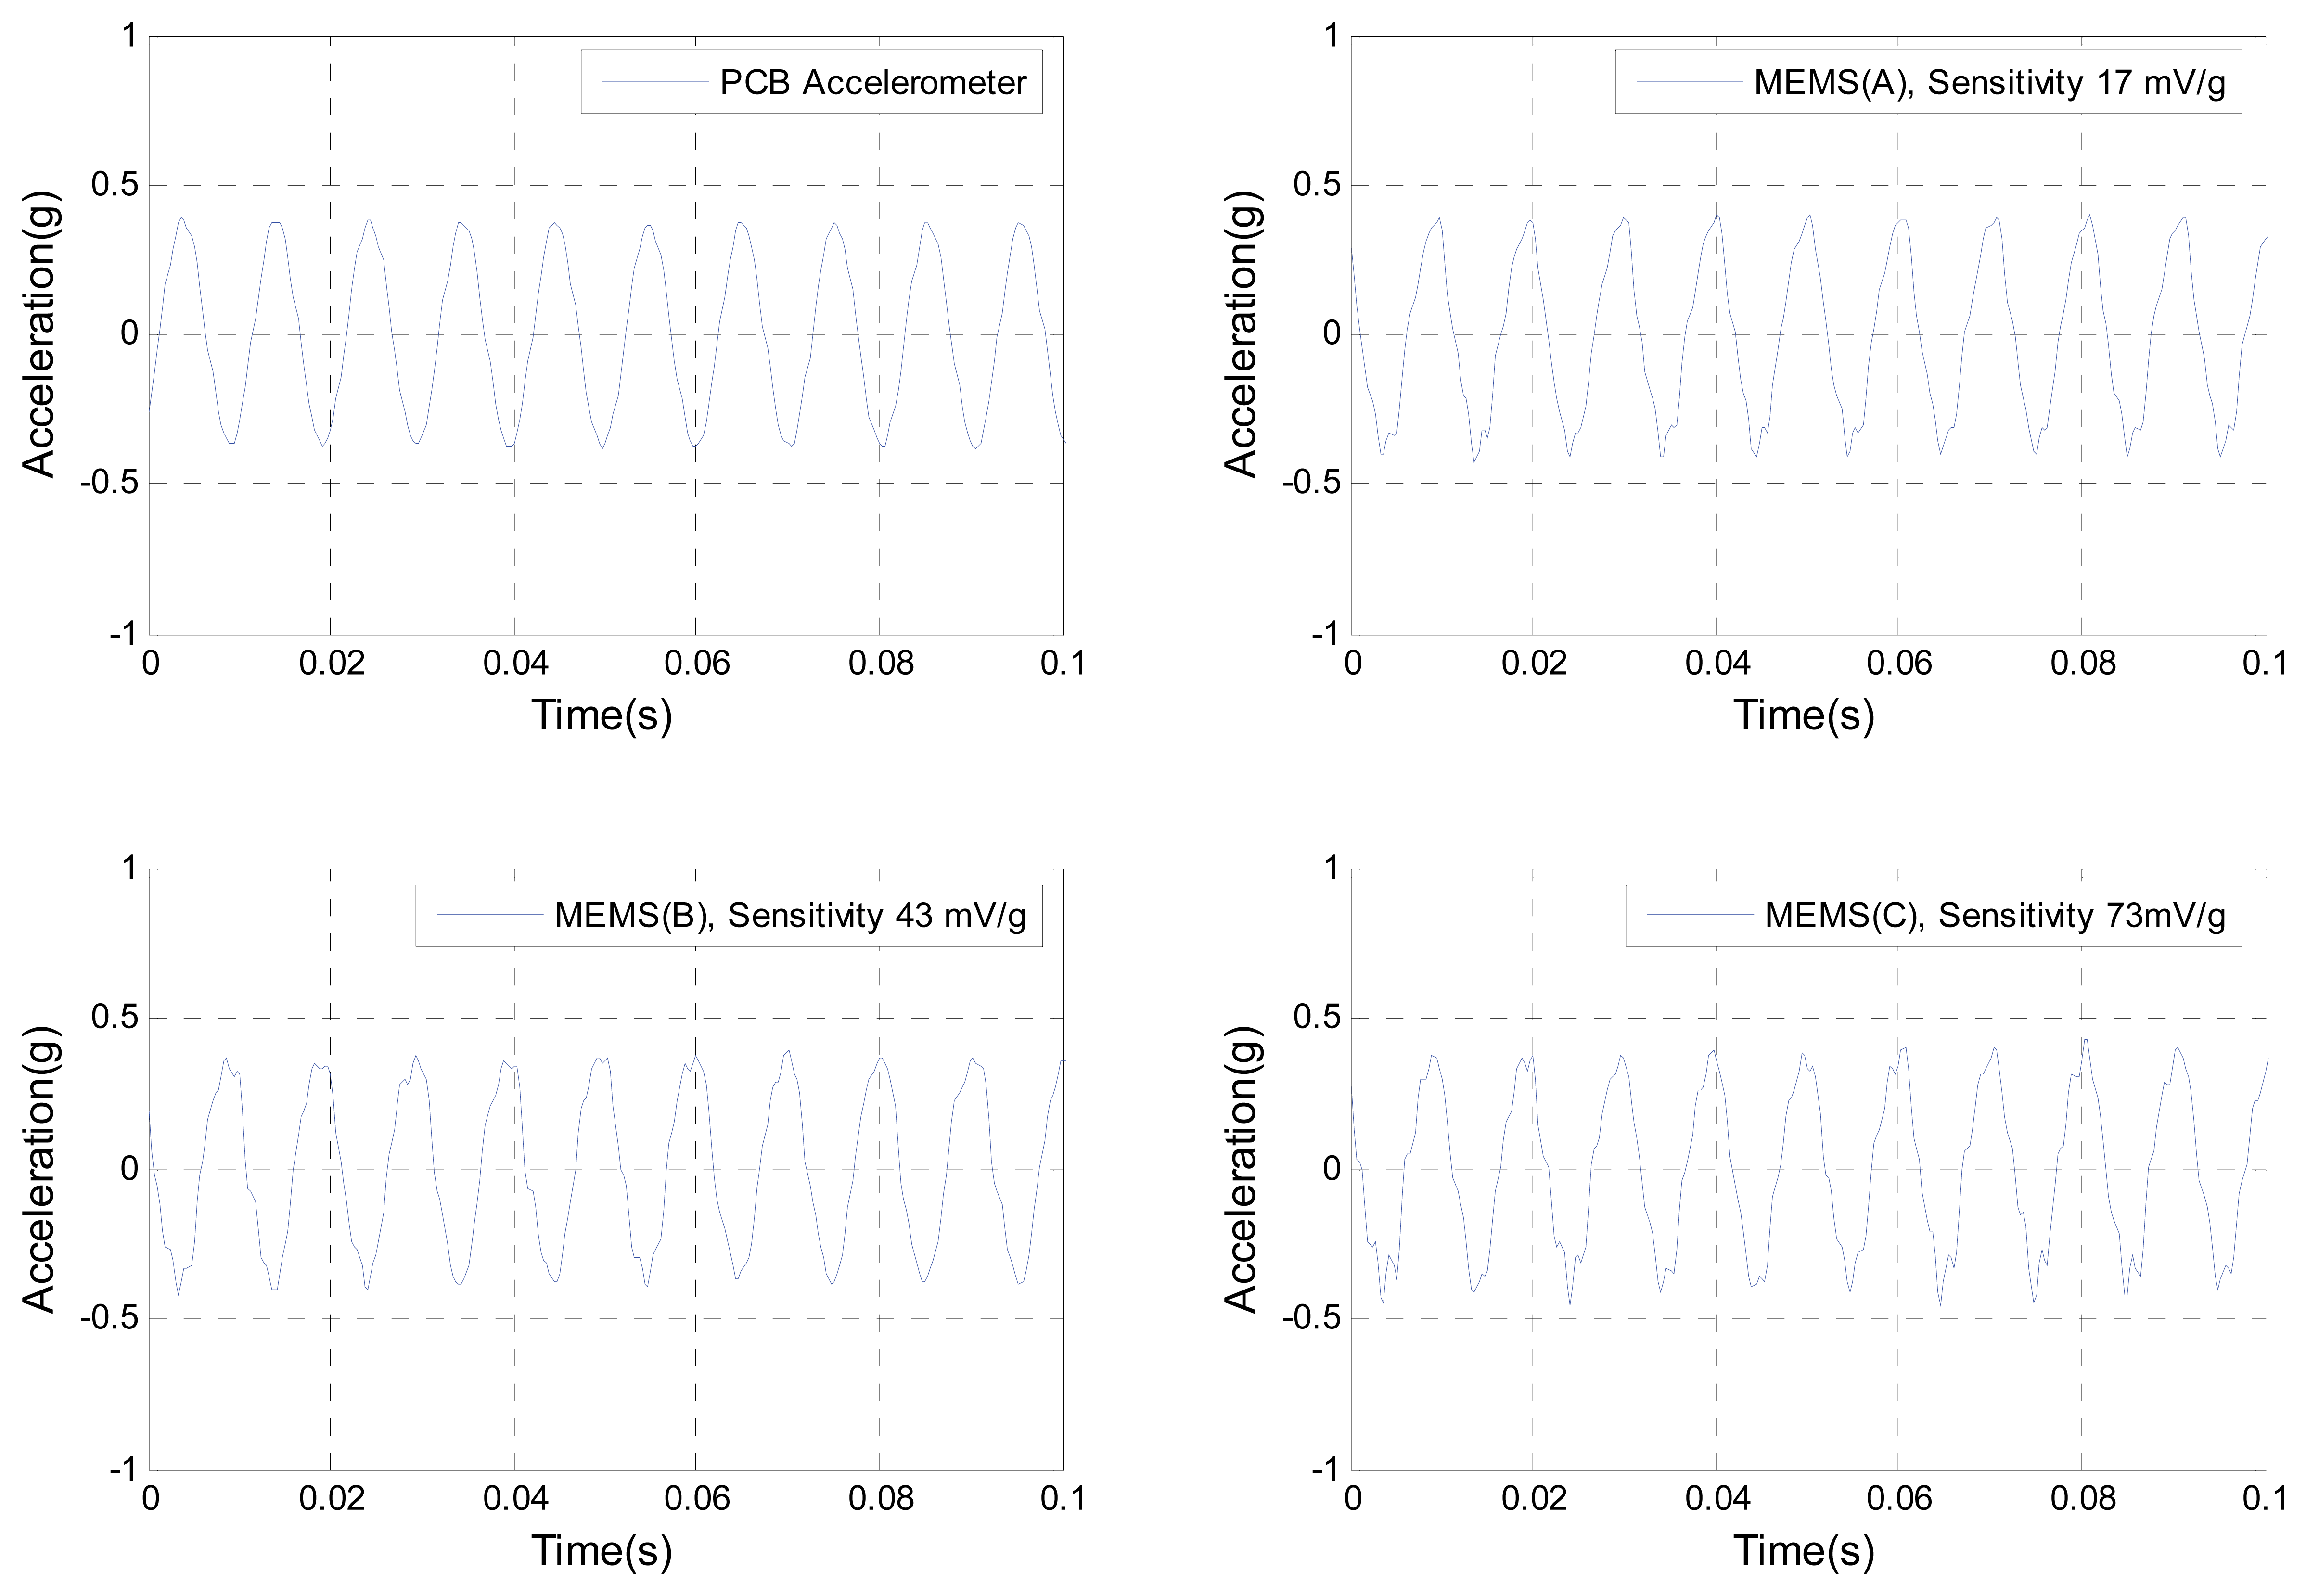
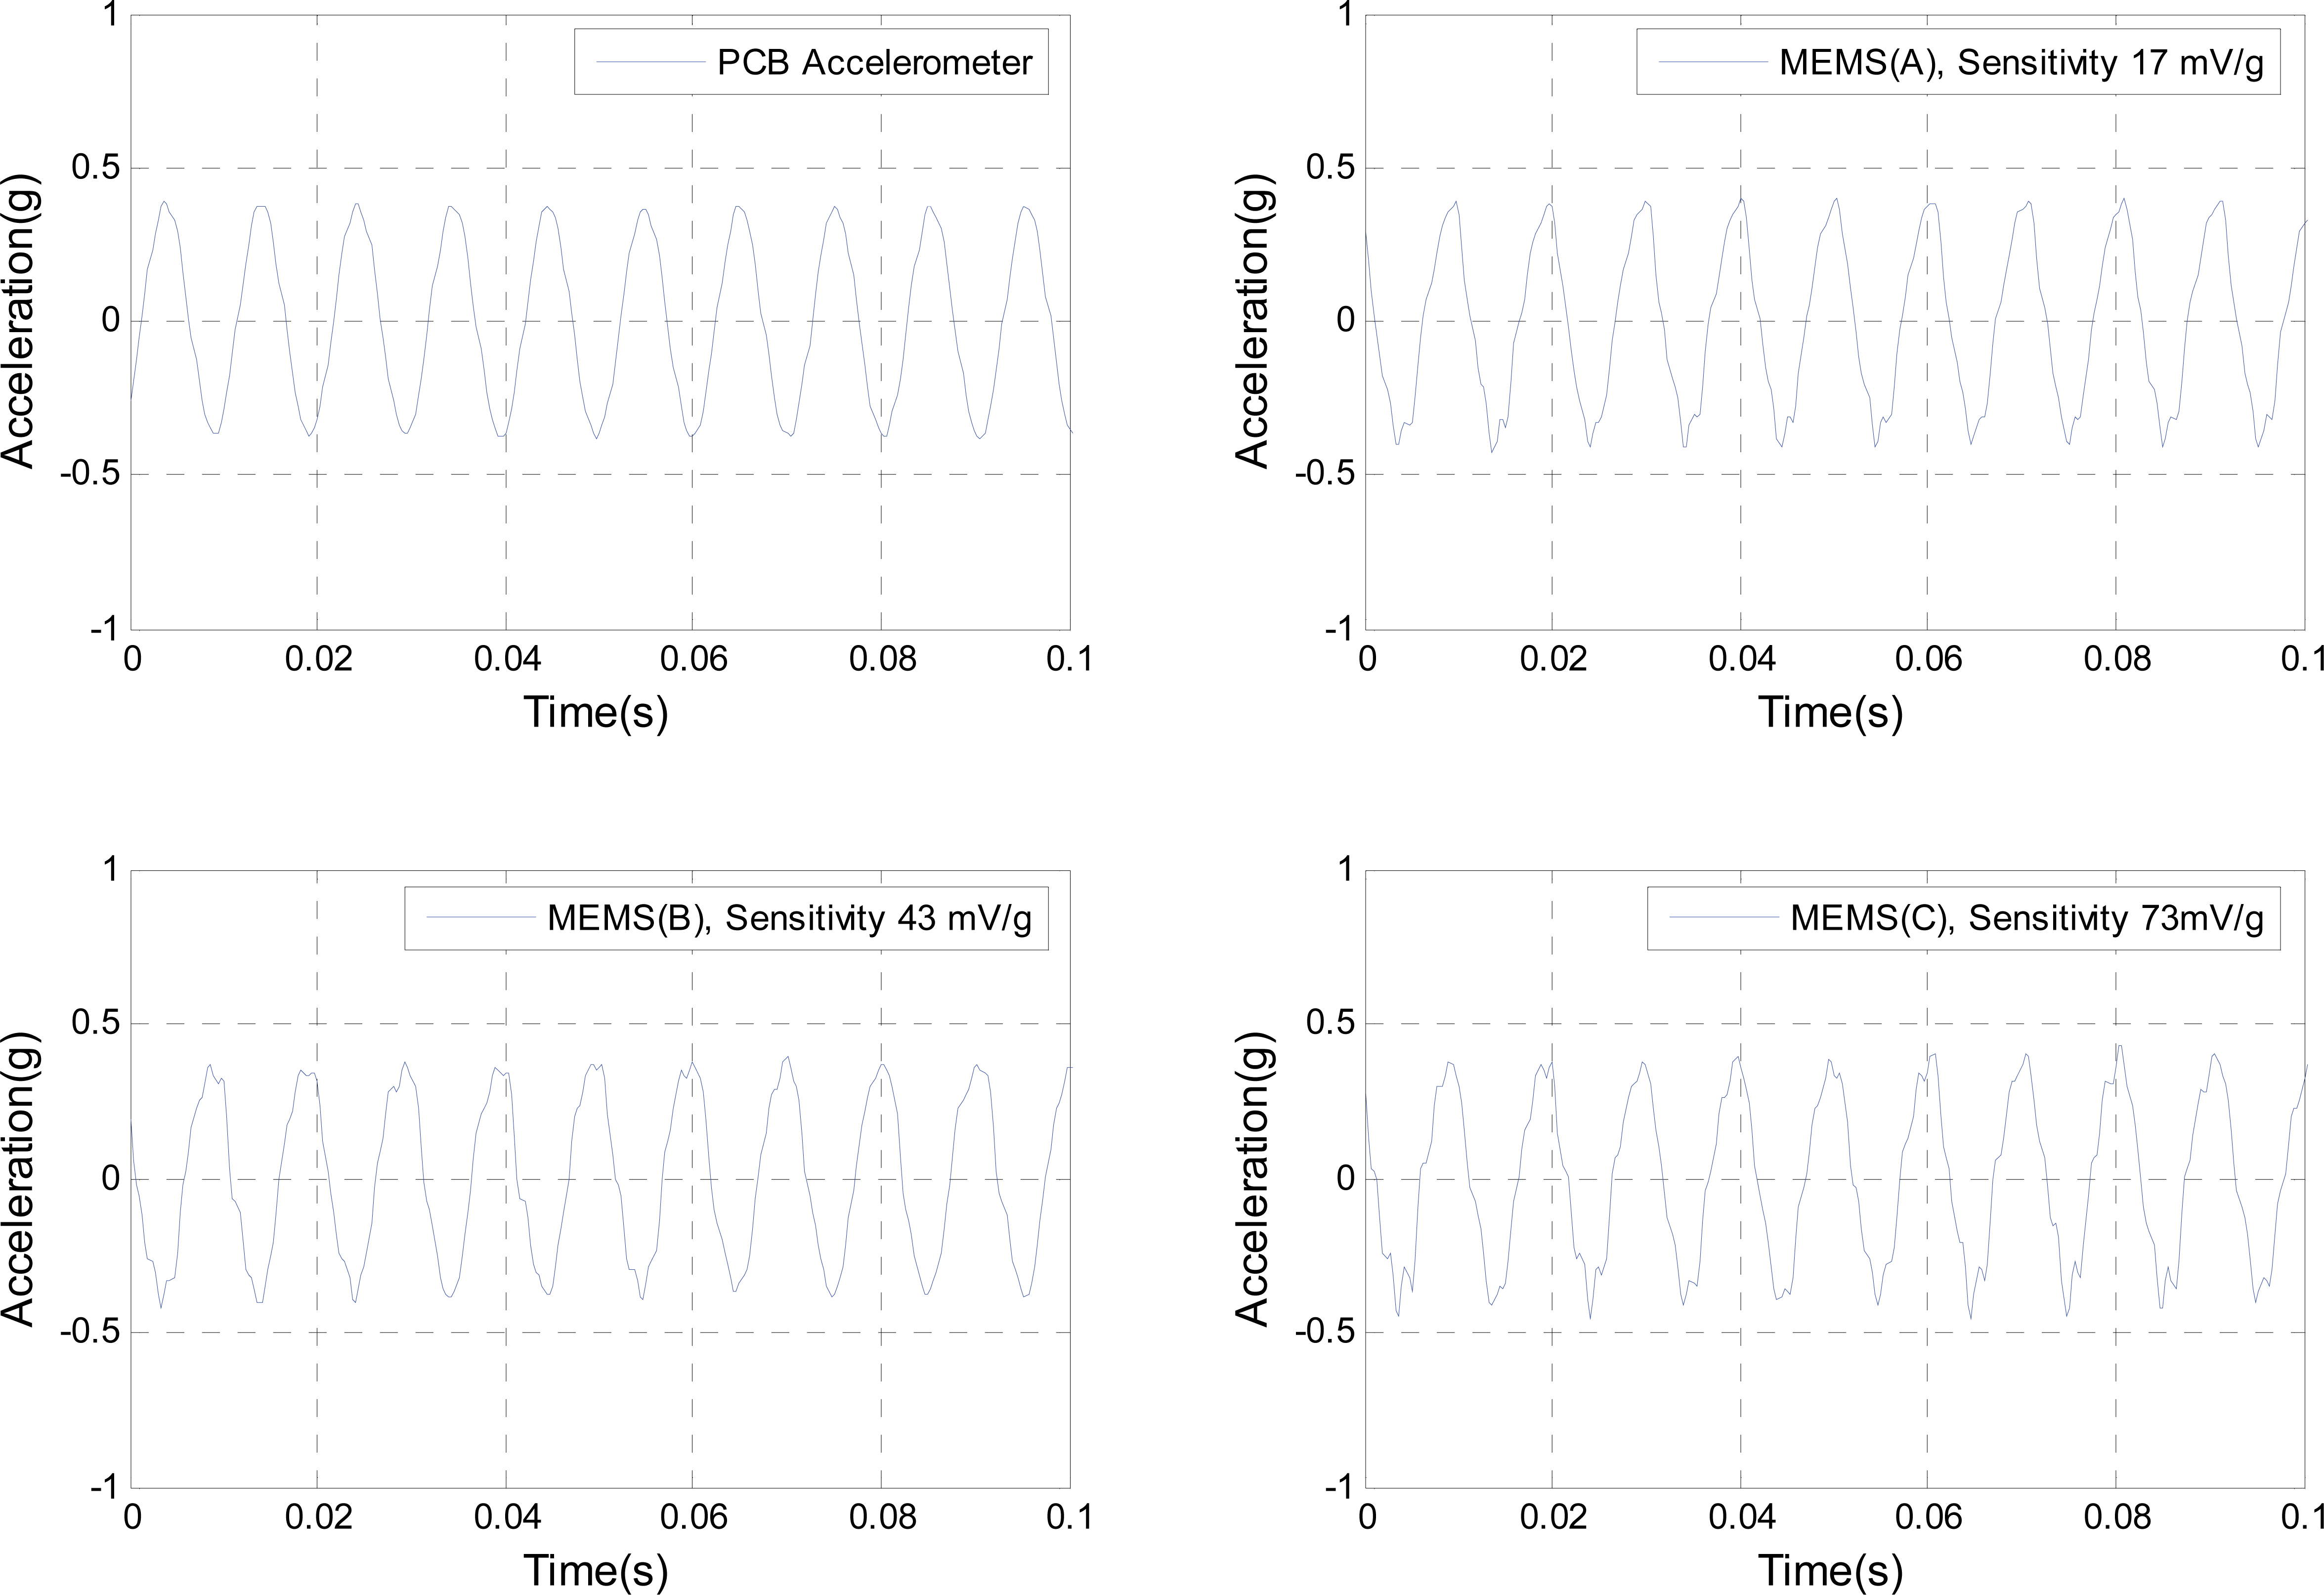
A few typical measured responses both in time and frequency domain are shown in Figures 3, 4, 5, 6, 7, 8, 9 and 10. No distortion is observed in the measured responses by the MEMS accelerometer (A), the sensitivity also almost stable, but MEMS (B) and (C) responses exhibit some distortion and this becomes bigger at lower frequency and g levels. There is also a significant shift in phase and the sensitivity compared to the reference accelerometer. In fact, the estimated sensitivity based on reference accelerometer seems to be varying from 37mV/g to 50mV/g for MEMS (B), and varies from 63mV/g to 111mV/g for MEMS (C). Phase shift is not constant with respect to the reference accelerometer responses which are clearly seen in the time response plots in Figures 3 to 10. It is noted the presence of a component at 600 Hz in all the responses; this is believed to be the test set up resonance.
4.2. Impulsive Excitation
In the same experimental setup, the impact excitation was given at the centre of the armature using a soft tip hammer within the frequency band of excitation up to 250-300Hz. Time domain responses of averaged three impacts for all accelerometers are shown in Figure 11. The measured responses are typically decay type responses as expected for the impact excitation by both accelerometers with maximum amplitude of 0.5g. However, the estimated MEMS accelerometers sensitivities once again are found to be 43, 53 and 119mV/g respectively which are close to the earlier estimated values for MEMS A and B, and different for MEMS C.
A slightly slower decay in the response seen in the MEMS accelerometers compared to the reference accelerometer is also observed. To understand this typical behavior of the MEMS accelerometer, the averaged spectra of the 3 decay responses were computed for both accelerometers and compared as shown in Figure 12. The presence of the frequency peaks is consistent in MEMS A and B responses with the reference accelerometer; however the peaks amplitudes are not exactly the same. For MEMS C the frequency components and their amplitudes are not the same.
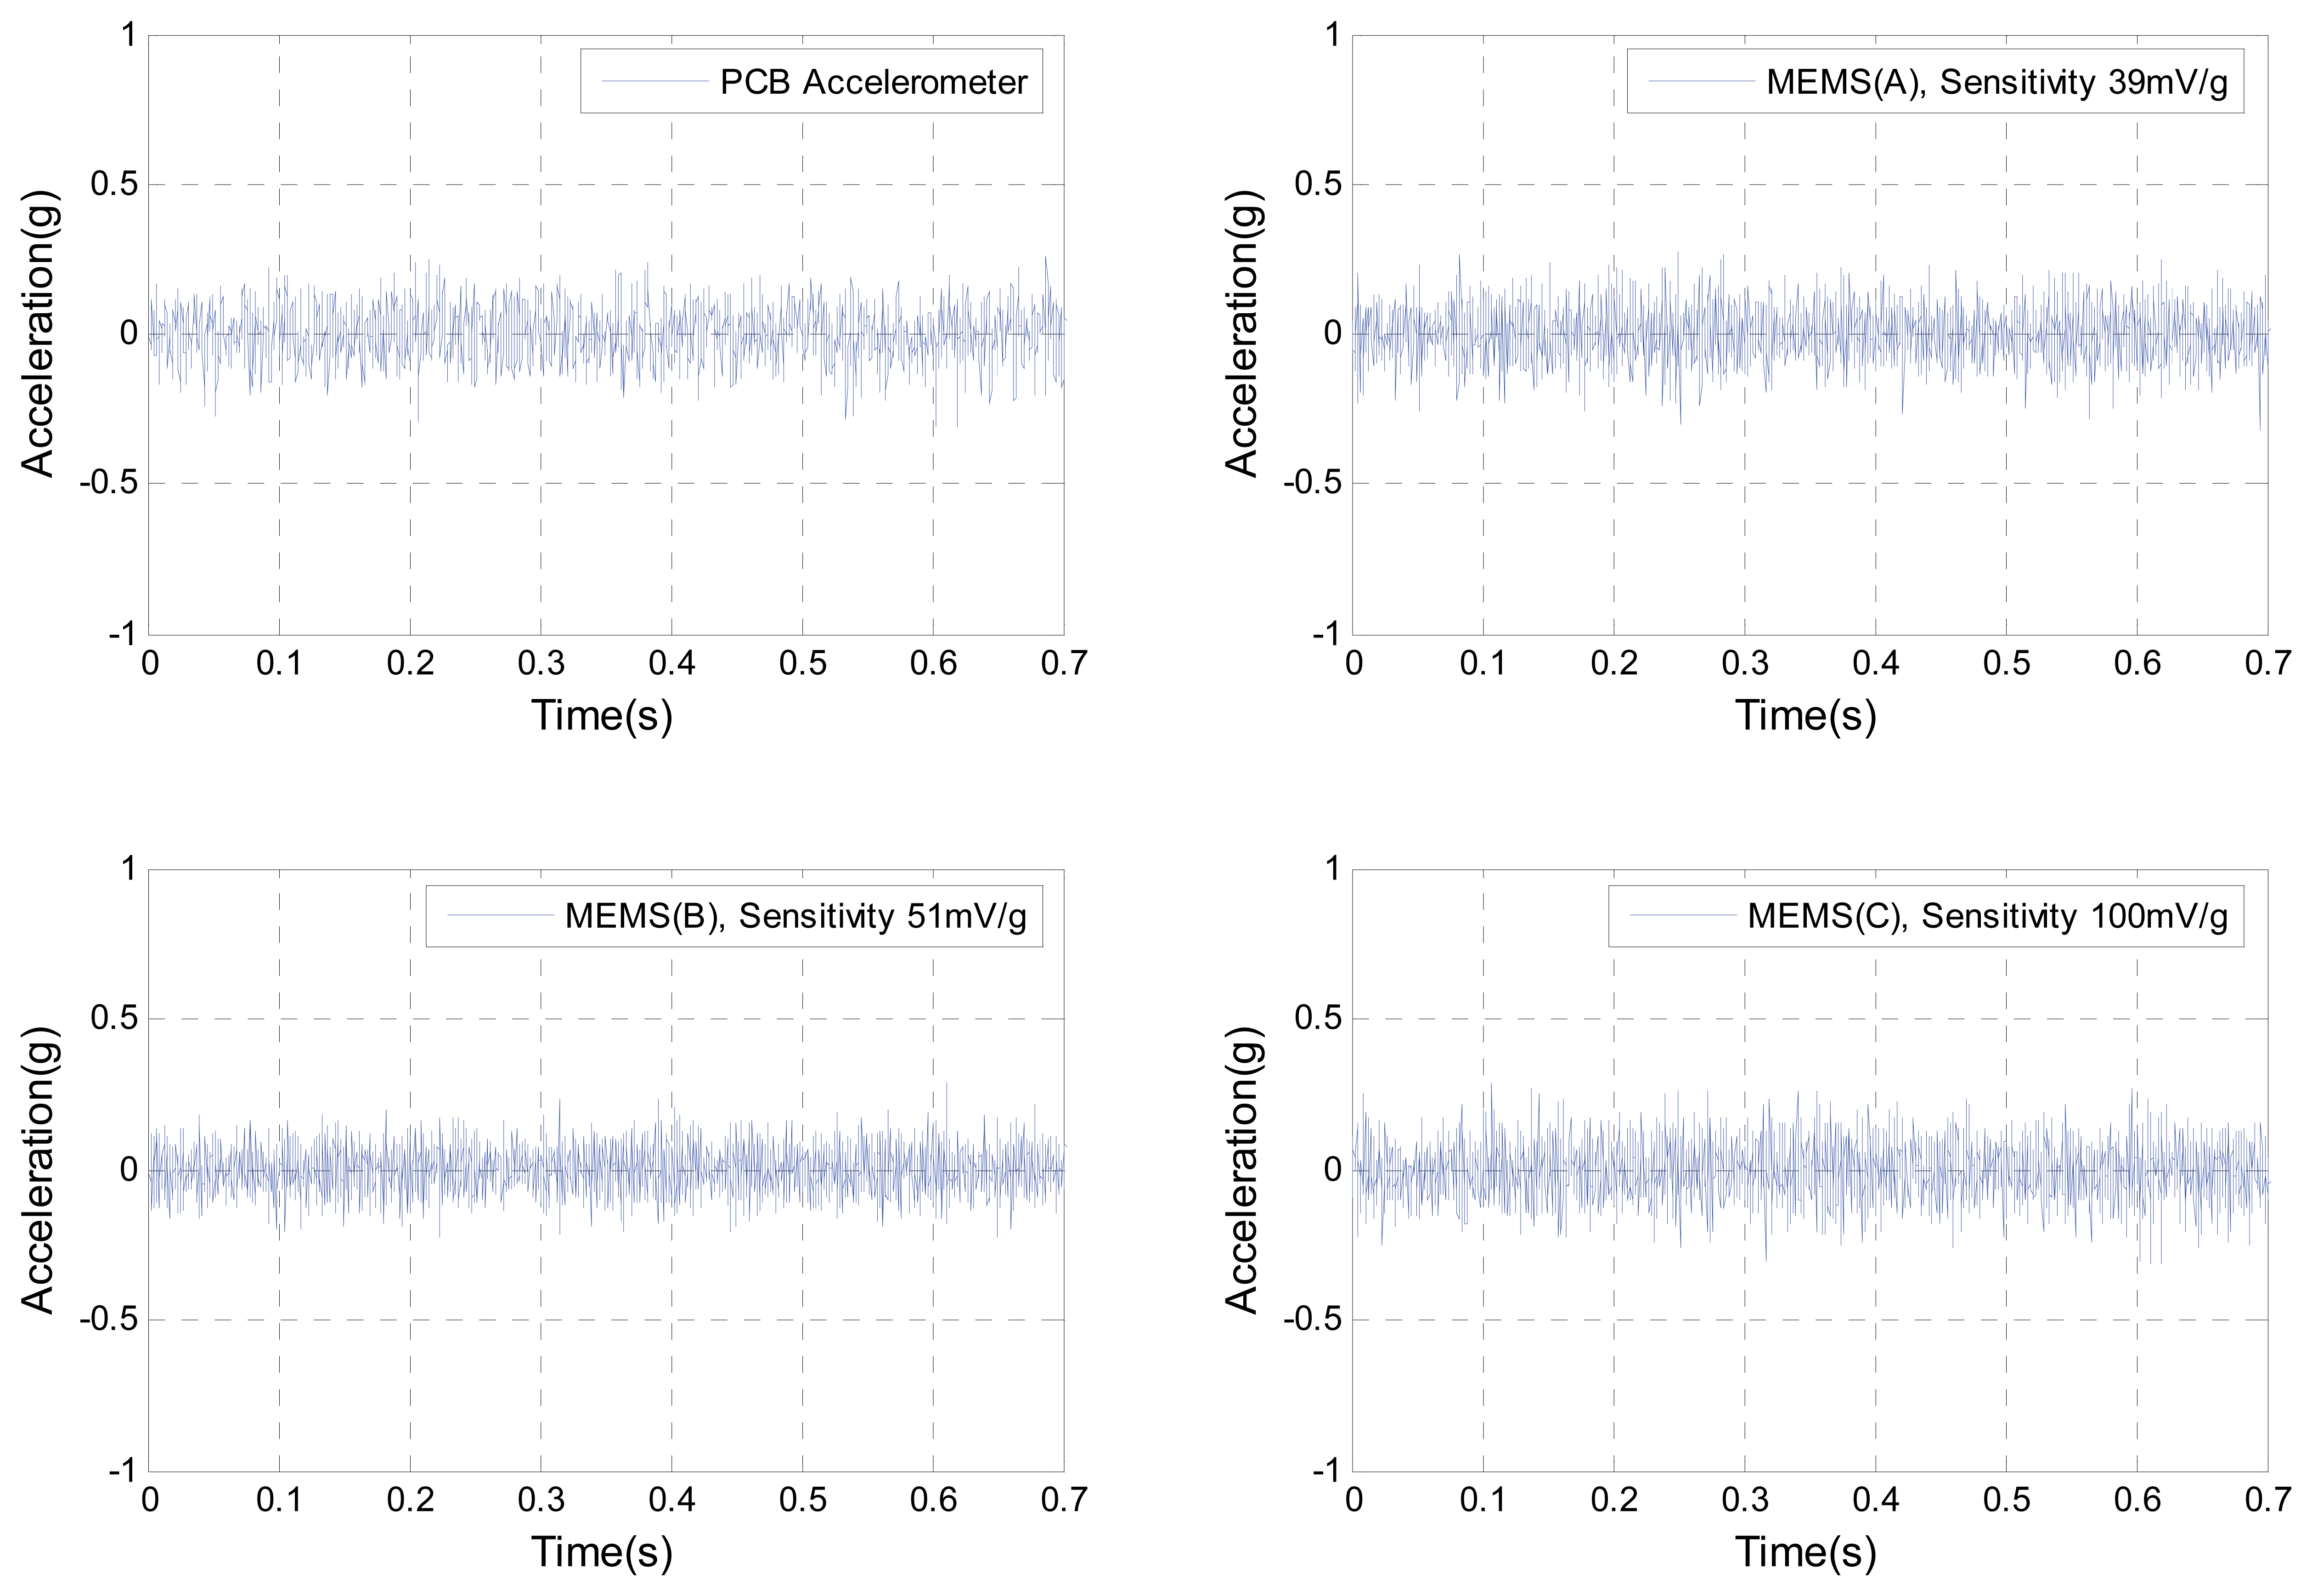
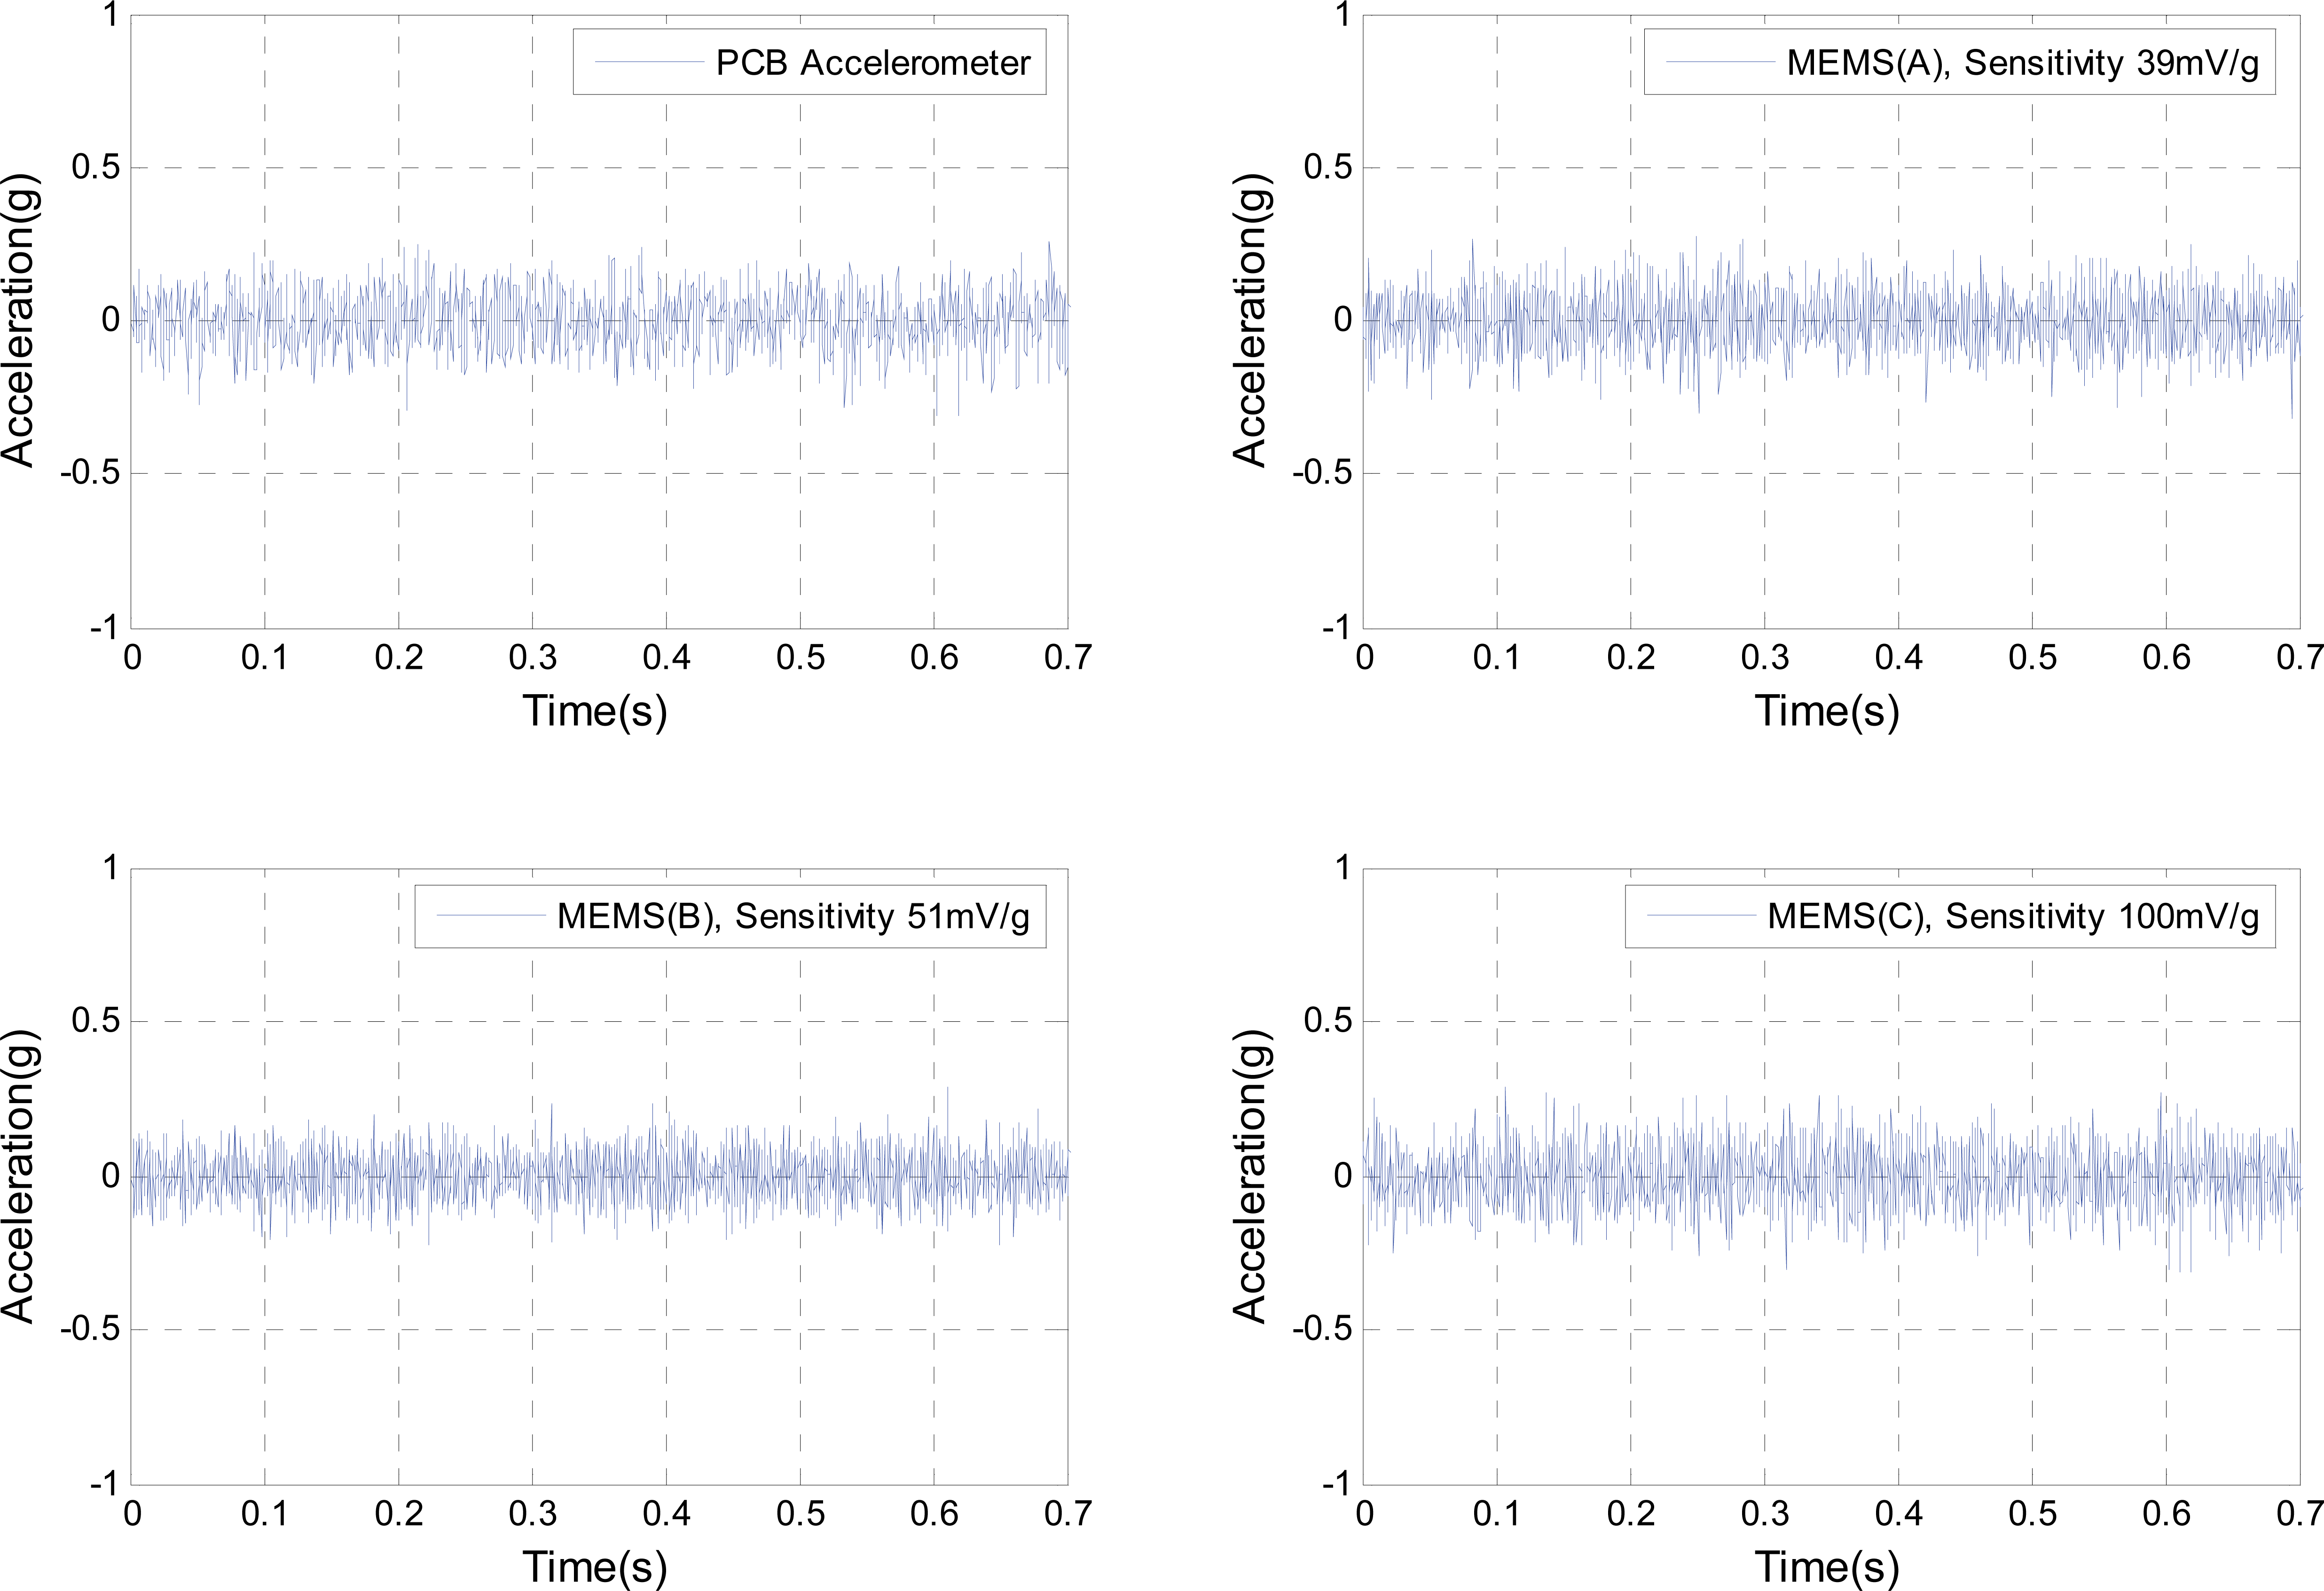
4.3. Random Excitation
Similar to the sinusoidal tests; the shaker was excited with random excitation in a frequency band from 10Hz to1.5 kHz with different amplitudes. Averaged accelerometers responses in time and frequency domains are shown in Figures 13 and 14. All accelerometers responses look identical in time and frequency domains, but here again the estimated sensitivity found to be not stable for MEMS (C). For the MEMS (A) and (B) it is close and not much different from the estimated sensitivity during the sinusoidal tests.
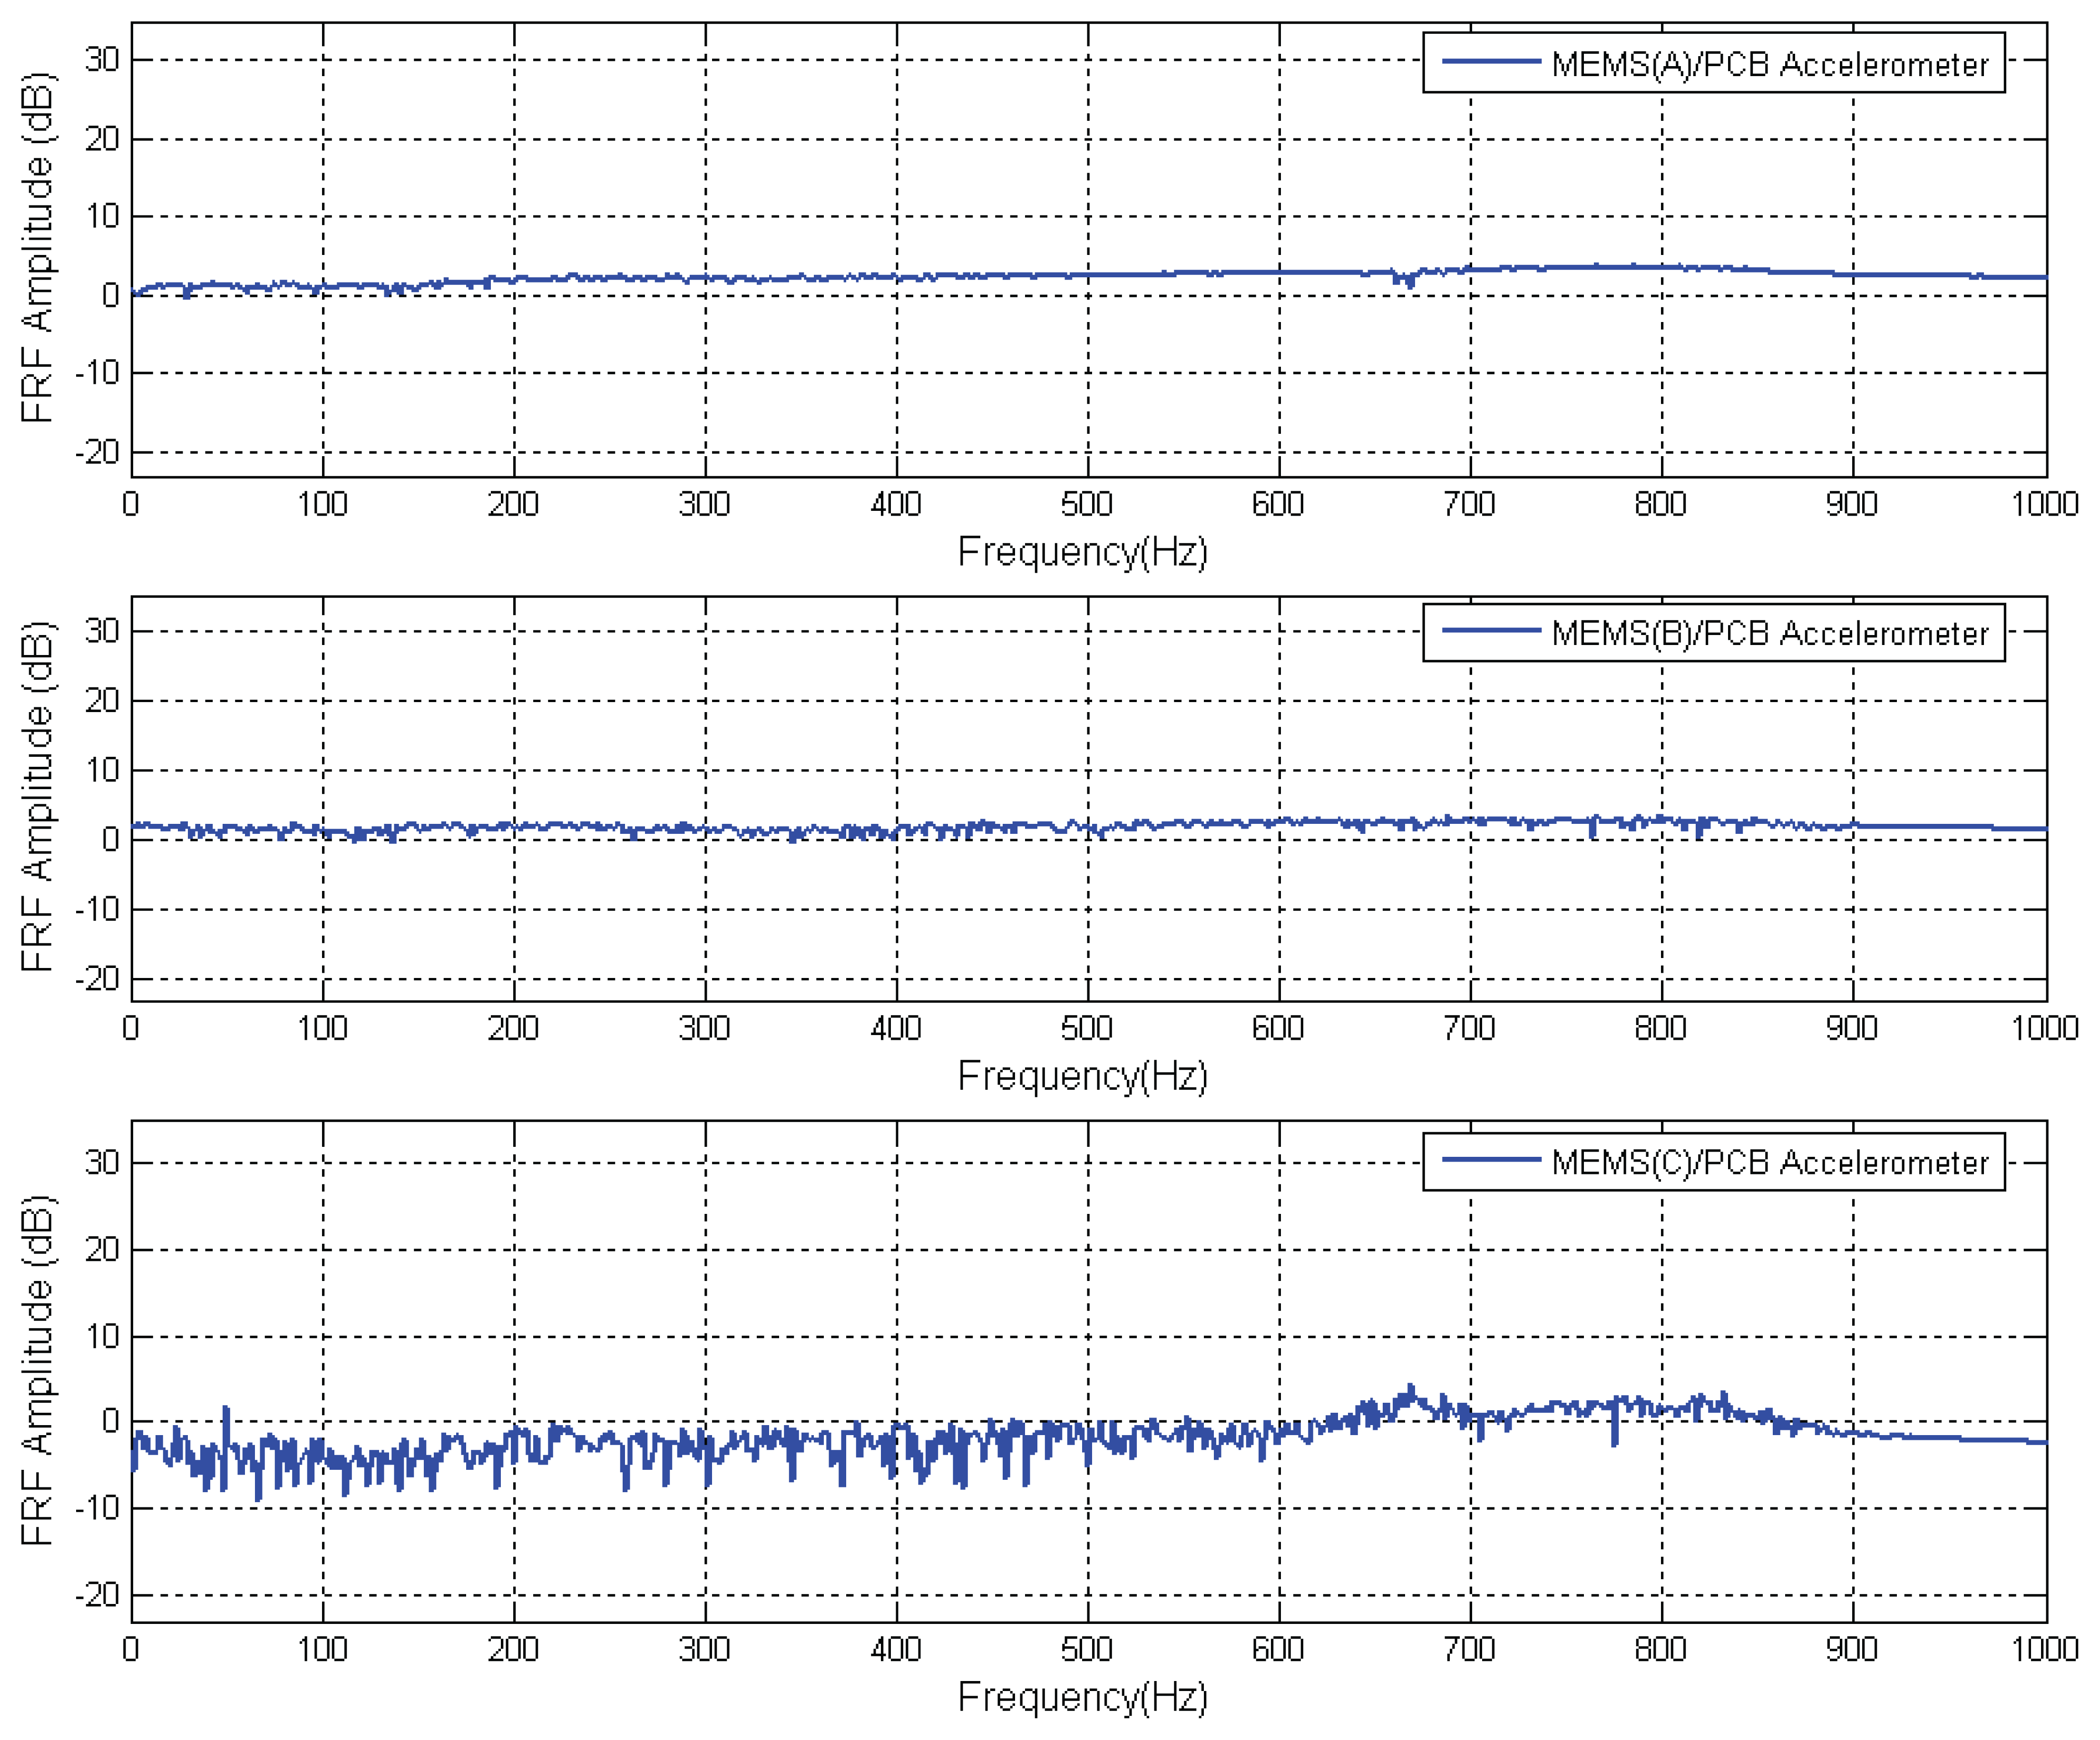
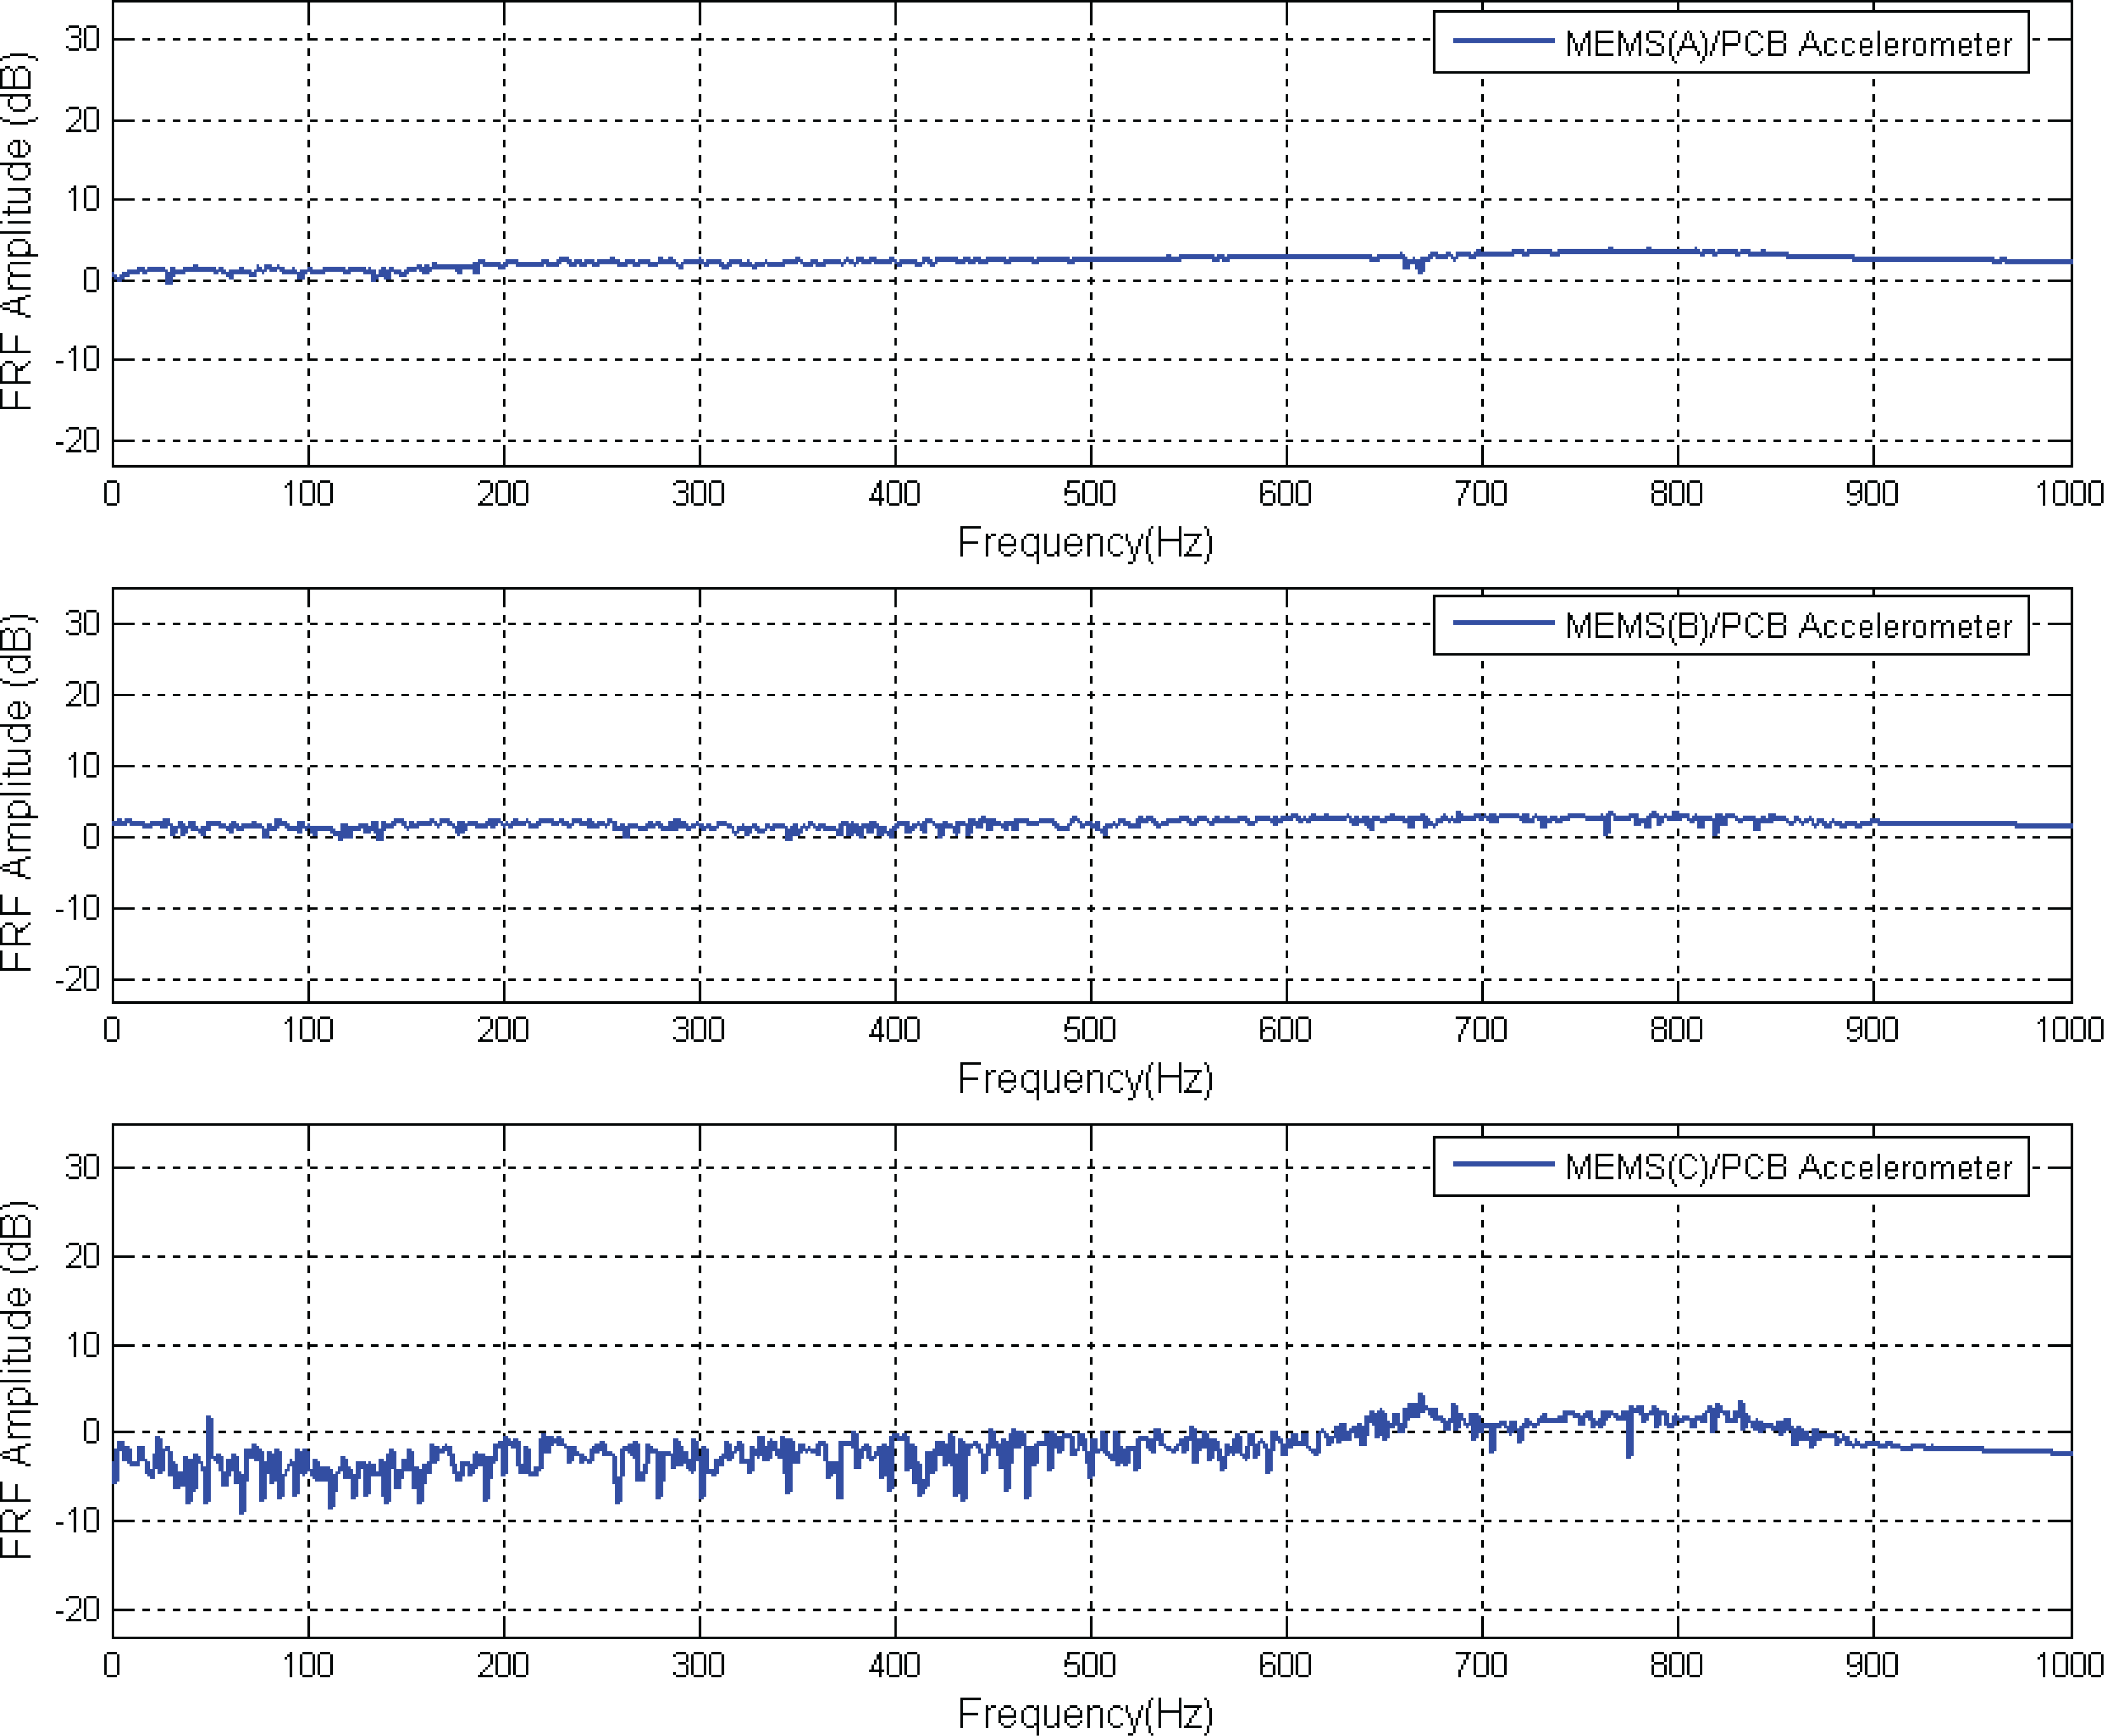
To determine the linearity in the measurement over the frequency band of excitation and phase shift, the frequency response function (FRF- the transfer function in frequency domain) has also been calculated assuming the responses of the MEMS accelerometer as the output and the reference accelerometer responses as the input. Both the amplitude and phase FRF plots are shown in Figures 15 and 16. The response spectra shown in Figure 14; shows satisfactory performance for MEMS (B) and for MEMS (A) for frequencies over 150 Hz. MEMS (C) performed not very well and this is confirmed in the FRF and phase shift plots; shown in Figures 15 and 16.
5. CNC Machine Monitoring Results
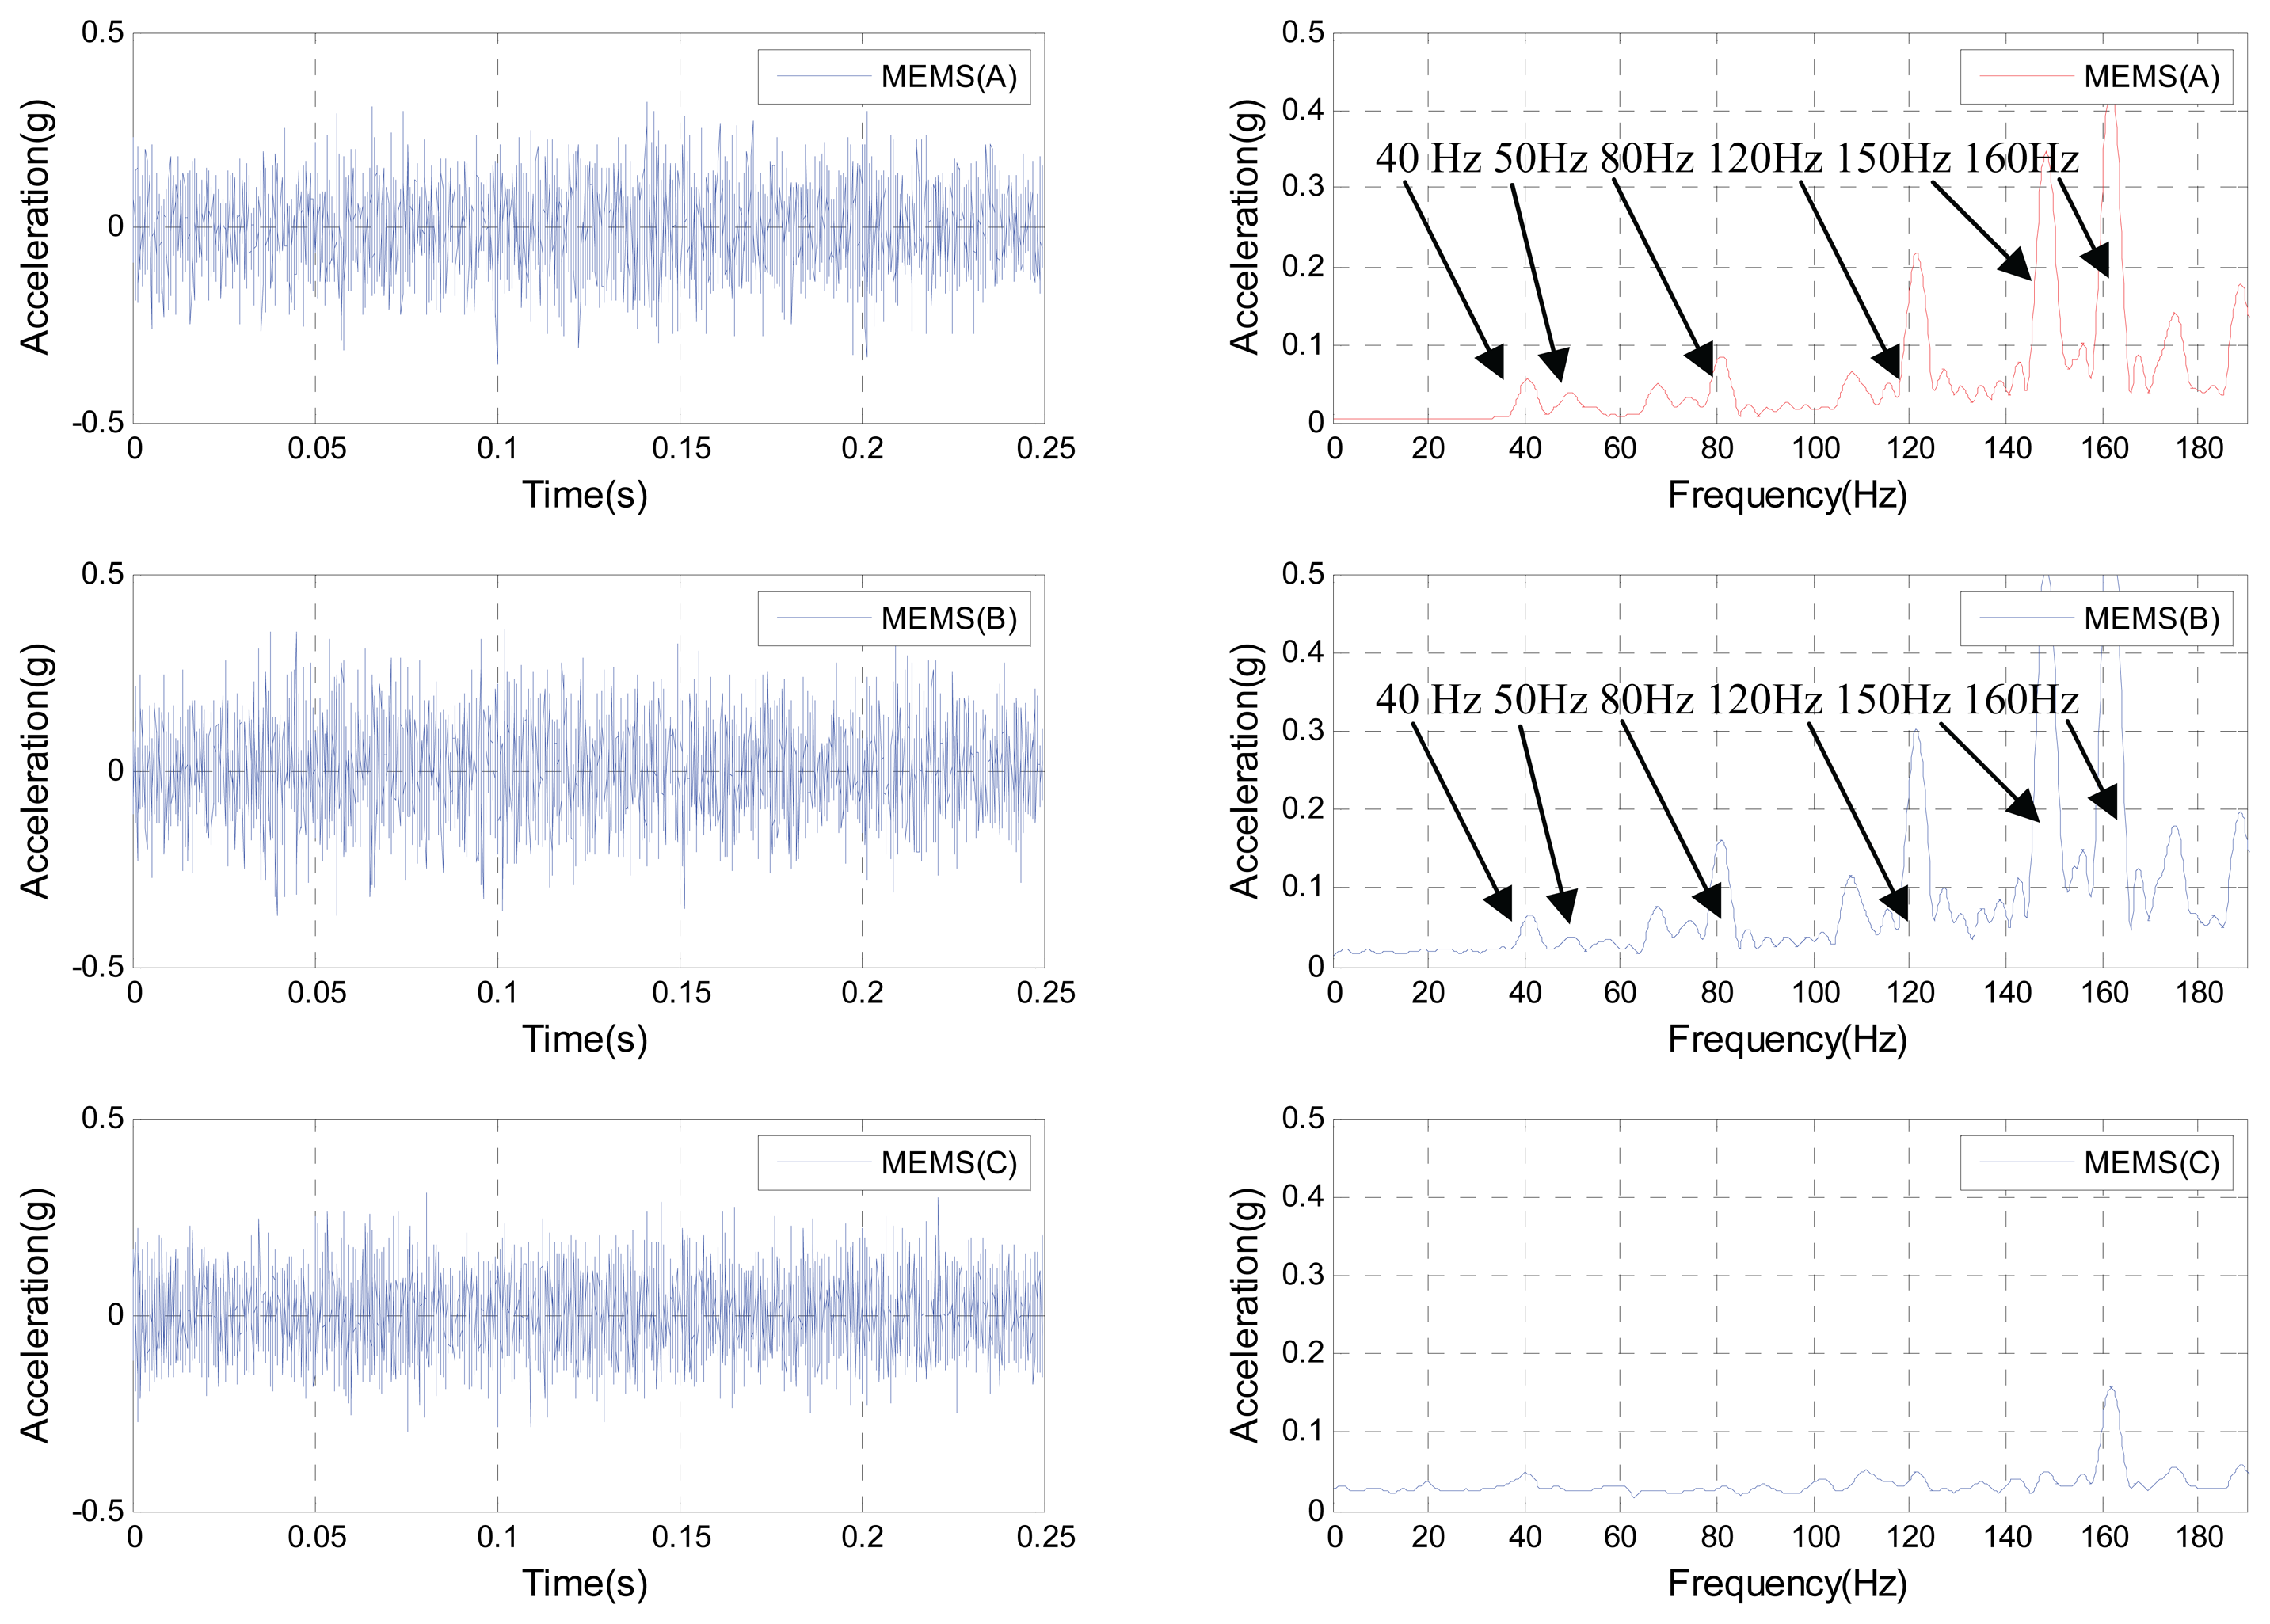
Data were also collected using MEMS accelerometers from a CNC machine in a typical industrial environment; see Figure (17). The vibration of the CNC machine was collected under a speed of 2400 rpm. Time and frequency domains of both data sets are shown in Figure (18). A satisfactory performance is achieved by both MEMS (A) and (B) accelerometers as expected and this was comparable and in good agreement with the conventional accelerometer. The fundamental speed and its harmonics (40, 80 and 160Hz) are measured by both accelerometers, line frequency and its multiples also exist in the frequency domain spectrum.
6. Conclusions and Future Work
The performance tests of typical three MEMS accelerometers are carried out for different excitations including sinusoidal, impulse and random. The measured responses of the MEMS accelerometers were compared with a well accepted commercially available ICP type accelerometer.
The MEMS accelerometer (A) performed well for the sinusoidal and random measurements though a very small shift in phase (approx. less than 1%) was observed, and the frequency peaks content is also found to be the same for the impact excitation.
The MEMS accelerometer (B) shows good performance for the sinusoidal and random measurements. Compared with MEMS accelerometer (A); a bigger shift in phase; approximately 5% was observed and the frequency peaks content was also found to be the same for the impact excitation.
The performance of MEMS accelerometer (C) seems to be very poor for the sinusoidal and random measurements. Compared with MEMS accelerometers (A) and (B); a substantial noise and shift in phase are observed; although this accelerometer is not suitable for machinery condition monitoring it could be indeed used for other suitable applications.
Hence, for vibration based condition monitoring MEMS (A) and (B) are expected to perform well and this was demonstrated by capturing fundamental running frequency, its multiples, the main line frequency and its multiples of a CNC machine within a typical industrial environment. The data collected showed lots of noise including extra un-interpretable peaks which could be due to the nature of the MEMS accelerometers structure.
MEMS sensors could be a good alternative to standard sensors mainly for wireless implementation as there is no need to carry heavy charge amplifiers, but the choice has to be made according to specifications and through validation tests. MEMS sensors have also to resist harsh environments using an appropriate packaging. More investigations with various MEMS accelerometers to understand the future direction for improvements are being carried out.
Acknowledgments
This work was supported by the European Union Sixth Framework programme for Research and Technological Development. Integrated Project IP017498 DYNAMITE Dynamic Decisions in Maintenance.
References
- Plaza, J.; Collado, A.; Cabruja, E.; Esteve, J. Piezoresistive accelerometers for MCM package. J. Microelectromech. Syst. 2002, 11(6), 794–801. [Google Scholar]
- Xie, H.; Fedder, G. CMOS z-axis capacitive accelerometer with comb-finger sensing. Proc. IEEE Micro Electro Mechanical Systems (MEMS) 2000, 496–501. [Google Scholar]
- Biefeld, V.; Buhrdorf, A.; Binder, J. Laterally driven accelerometer fabricated in single crystalline silicon. Sens. Actuators A: Phys. 2000, 82(1), 149–154. [Google Scholar]
- Yazdi, N.; Ayazi, F.; Najafi, K. Micromachined inertial sensors. Proc. IEEE 1998, 86(8), 1640–1659. [Google Scholar]
- Liu, C.; Kenny, T.W. A high-precision, wide-bandwidth micromachined tunneling accelerometer. J. Microelectromech. Syst. 2001, 10(3), 425–433. [Google Scholar]
- Li, L.; Xu, Y.; Zhao, Y.; Liang, C.; Wei, T.; Yang, Y. Micromachined accelerometer based on electron tunneling. Proc. SPI-Int. Soc. Opt. Eng. 1999, 3891, 121–125. [Google Scholar]
- Seshia, A.; Palaniapan, M.; Roessig, T.; Howe, R.; Gooch, R.; Schimert, T.; Montague, S. A vacuum packaged surface micromachined resonant accelerometer. J. Microelectromech. Syst 2002, 11(6), 784–793. [Google Scholar]
- Thanagasundram, S.; Schlindwein, F. Comparison of integrated micro-electrical-mechanical system and piezoelectric accelerometers for machine condition monitoring. Proc. of IMechE. 2006, 220. [Google Scholar]
- Shuster, M.; Briano, B.; Kitchin, C. Mounting considerations for ADXL series accelerometers. Analog devices application notes 2002.
- Sabin, E. Vibration of dry pumps. Semicond. Int. 1995, 18(8), 249–250. [Google Scholar]
- Sinha, J. On Standardisation of Accelerometers. Journal of Sound and Vibration 2005, 286, 417–427. [Google Scholar]
- Gao, R.; Zhang, L. Micromachined Microsensors for Manufacturing. IEEE Instrumentation & Measurement Magazine 2004, 1094–6969. [Google Scholar]
- Doscher, J. ADXL105: a lower-noise, wider-bandwidth accelerometer rivals performance of more expensive sensors. Analogue Dialogue 1999, 33(6), 27–29. [Google Scholar]
- Doscher, J. Using iMEMs accelerometers in instrumentation applications. Proceedings of the 45 th International Instrumentation Symposium; 1999; pp. 395–404. [Google Scholar]
- Doscher, J. Monitoring machine vibration with micromachined accelerometers. Sensors 1997, 14(5), 33–38. [Google Scholar]
Figure 1.
A typical MEMS accelerometer construction; (a) Piezoresistive using cantilever design, (b) capacitive based on membrane design [1]
Figure 1.
A typical MEMS accelerometer construction; (a) Piezoresistive using cantilever design, (b) capacitive based on membrane design [1]

Figure 2.
Test setup
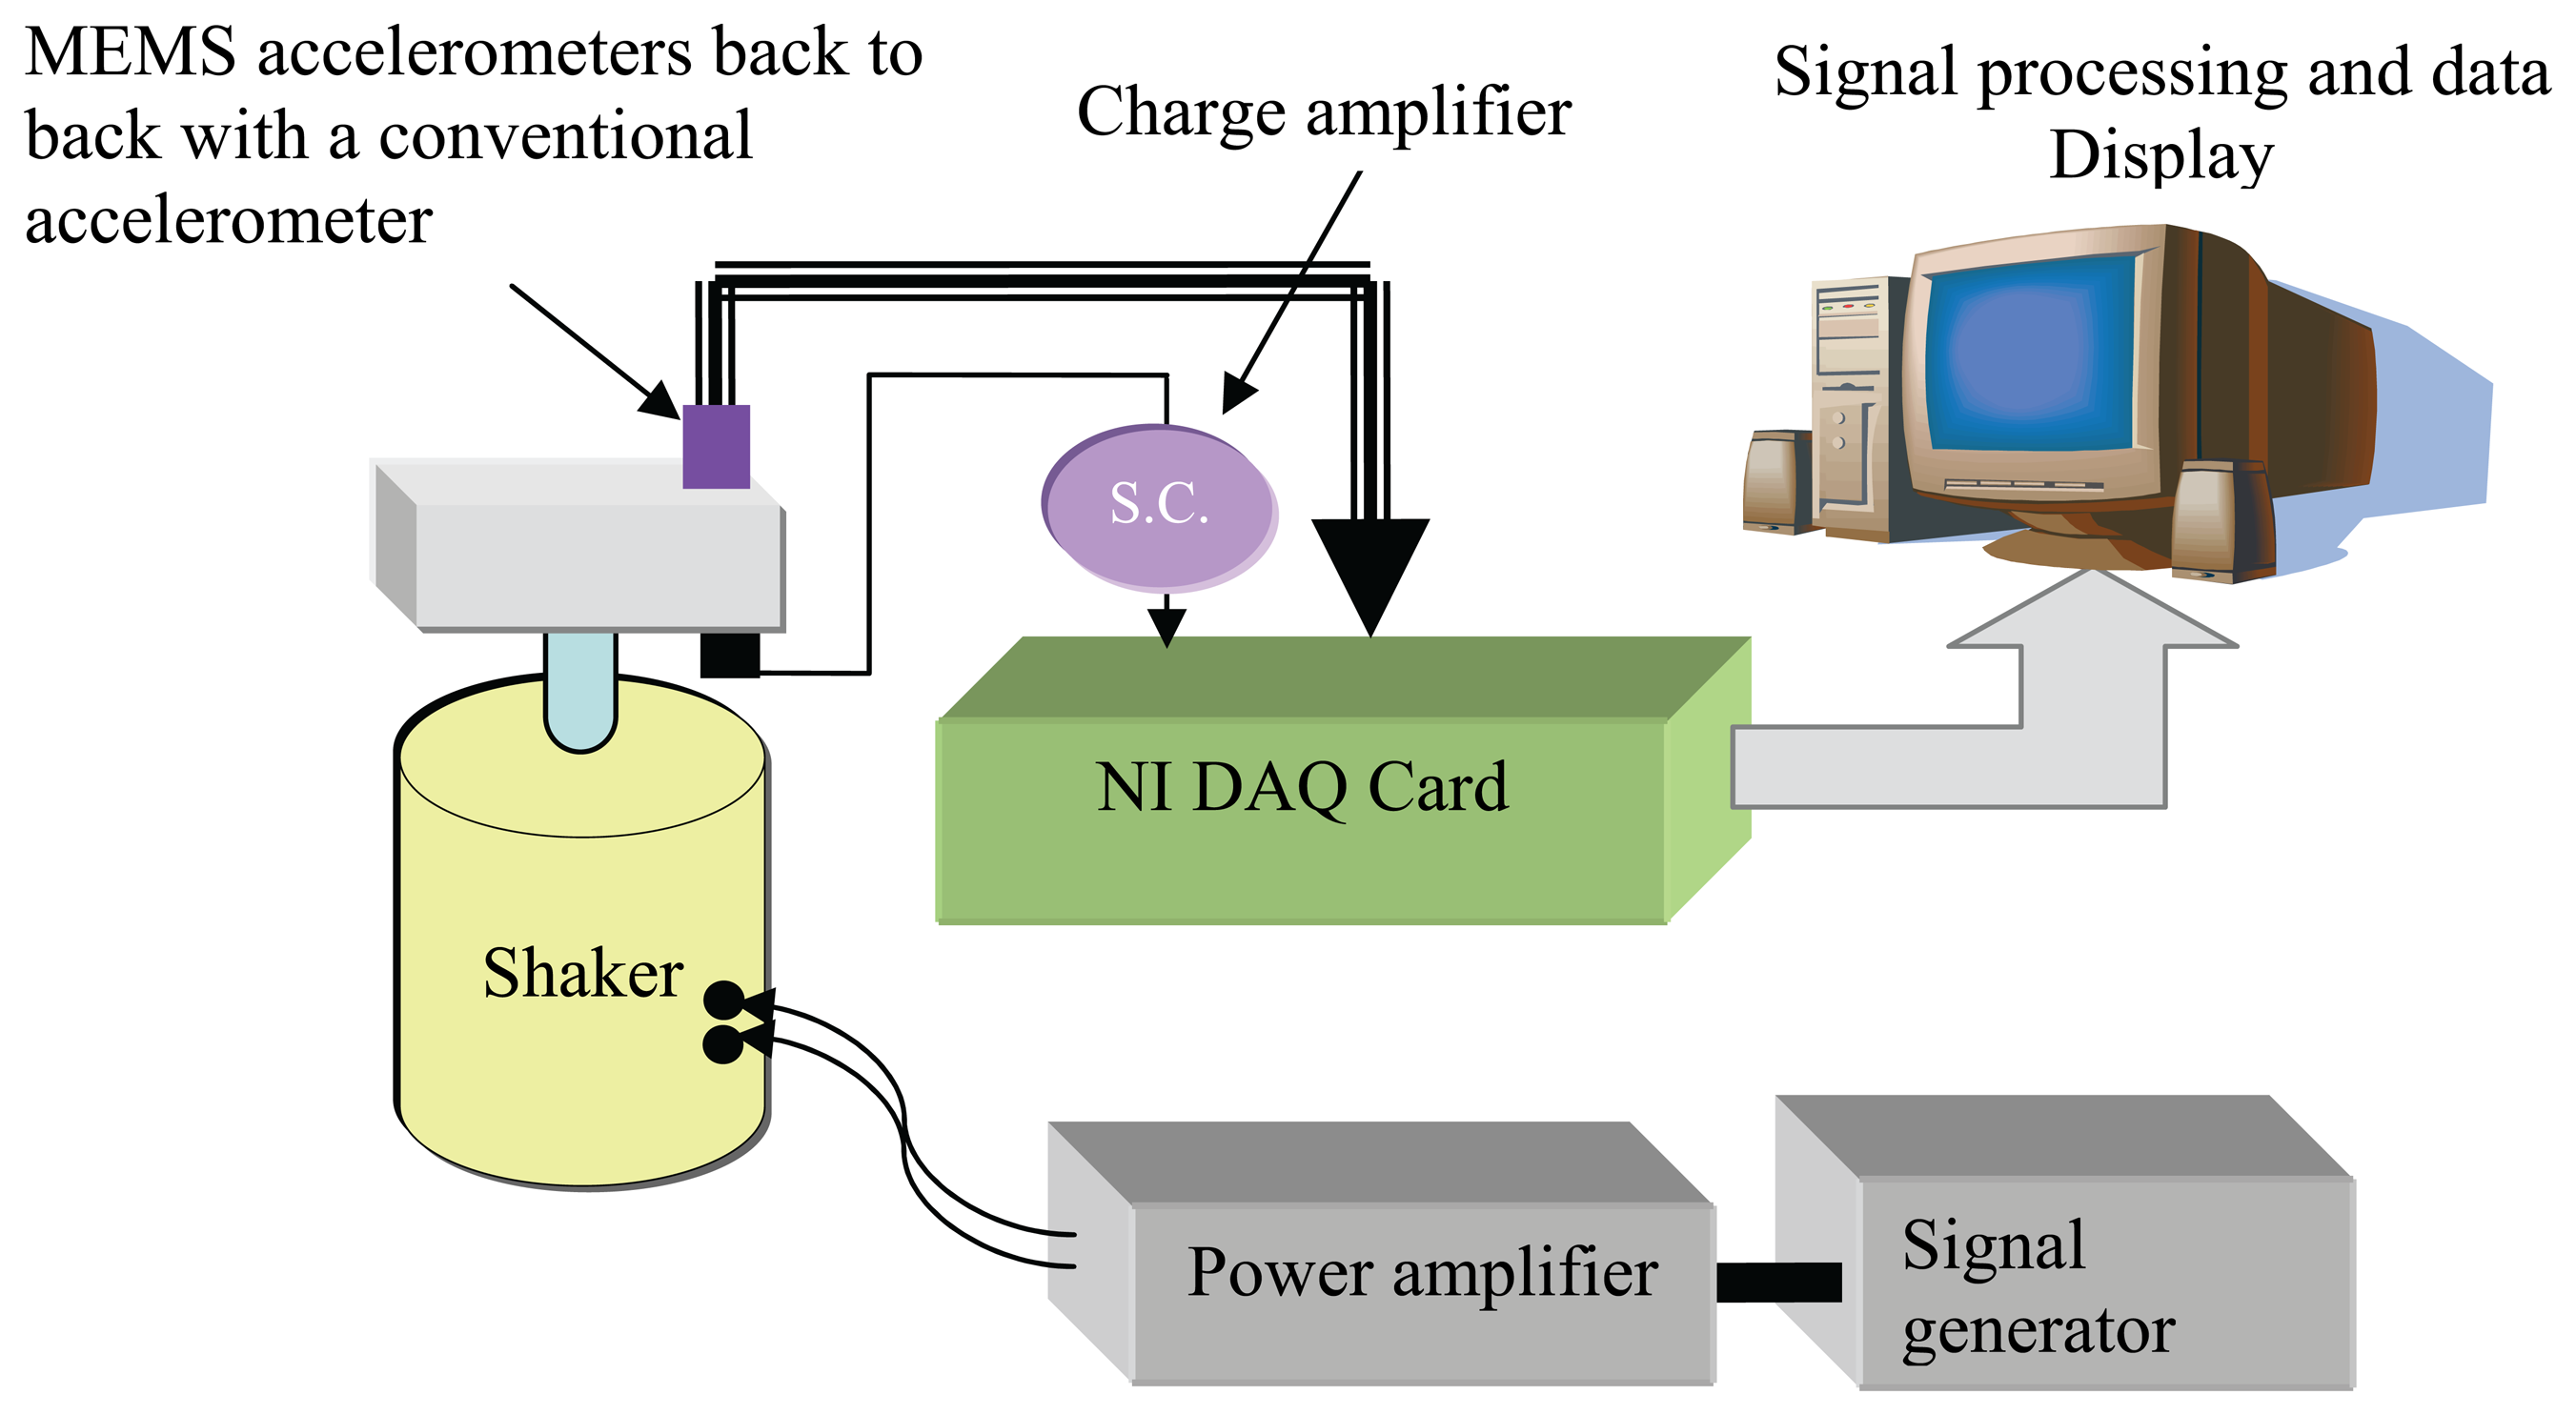
Figure 3.
Measured acceleration responses by the MEMS accelerometers and the reference (PCB) accelerometer at 53Hz for the excitation amplitude 0.15g
Figure 3.
Measured acceleration responses by the MEMS accelerometers and the reference (PCB) accelerometer at 53Hz for the excitation amplitude 0.15g

Figure 4.
Frequency domains of the measured acceleration responses by the MEMS accelerometers and the reference (PCB) accelerometer at 53Hz for the excitation amplitude 0.15g
Figure 4.
Frequency domains of the measured acceleration responses by the MEMS accelerometers and the reference (PCB) accelerometer at 53Hz for the excitation amplitude 0.15g
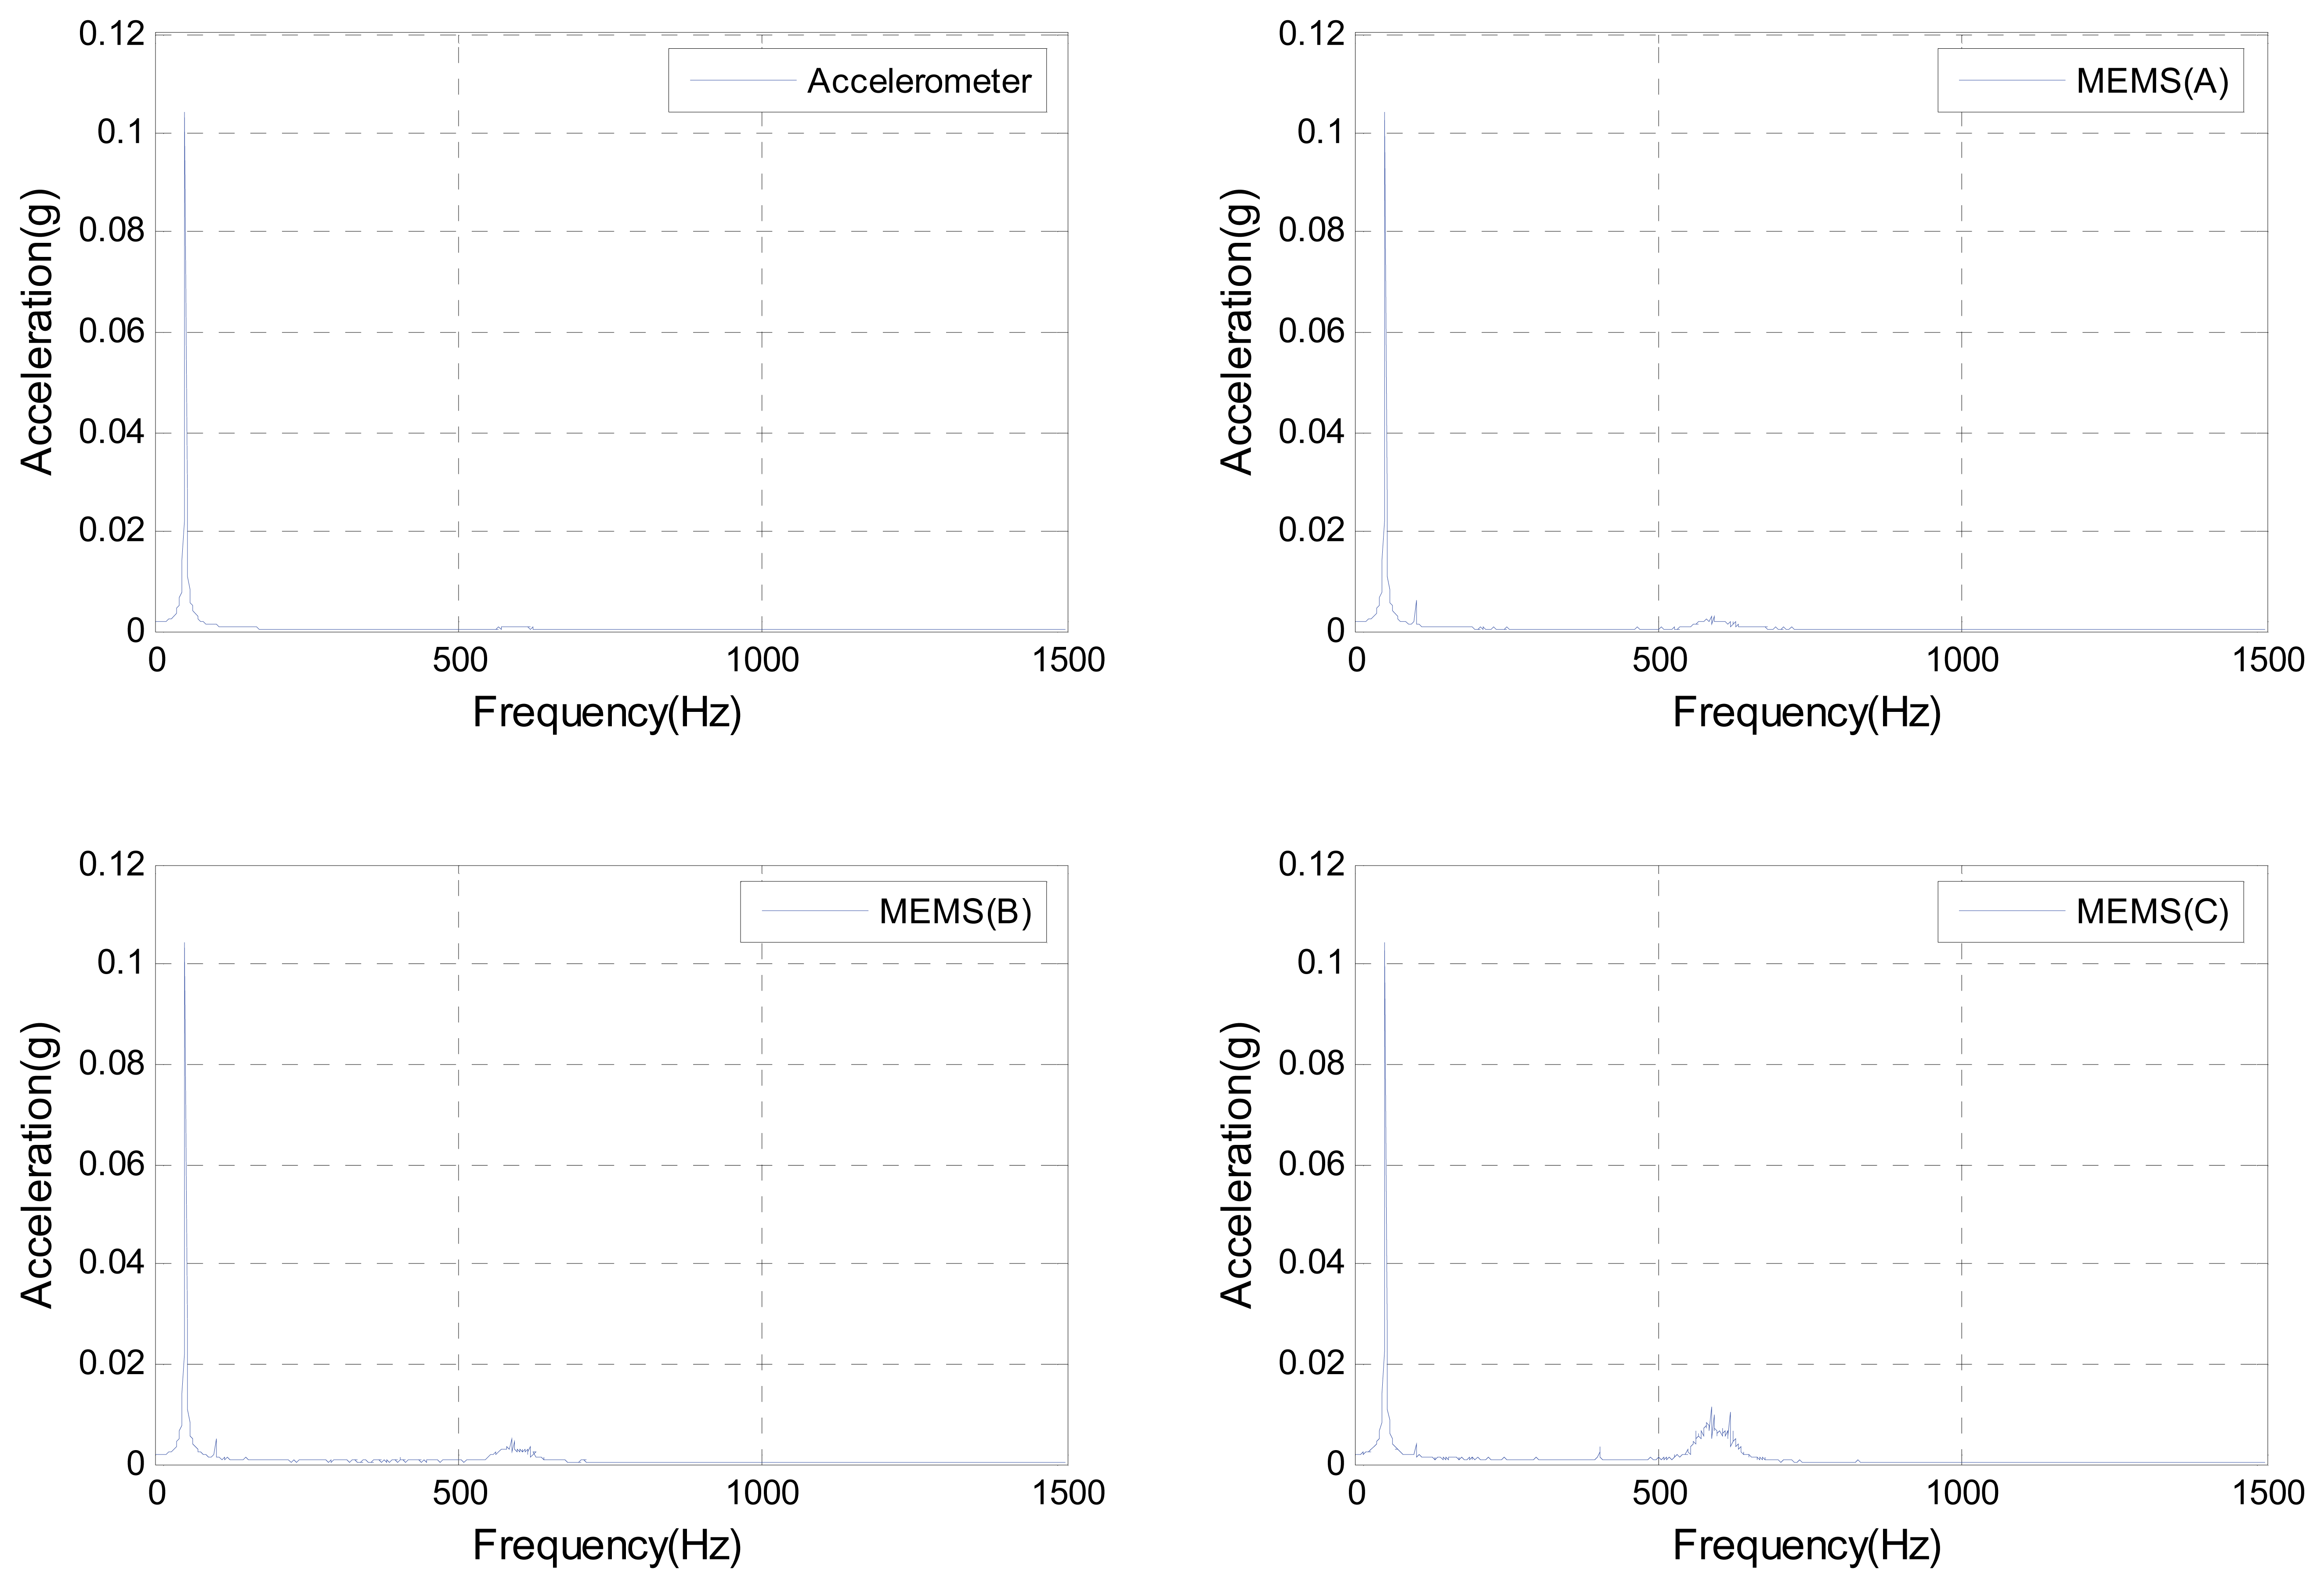
Figure 5.
Measured acceleration responses by the MEMS accelerometers and the reference (PCB) accelerometer at 53Hz for the excitation amplitude 0.5g
Figure 5.
Measured acceleration responses by the MEMS accelerometers and the reference (PCB) accelerometer at 53Hz for the excitation amplitude 0.5g
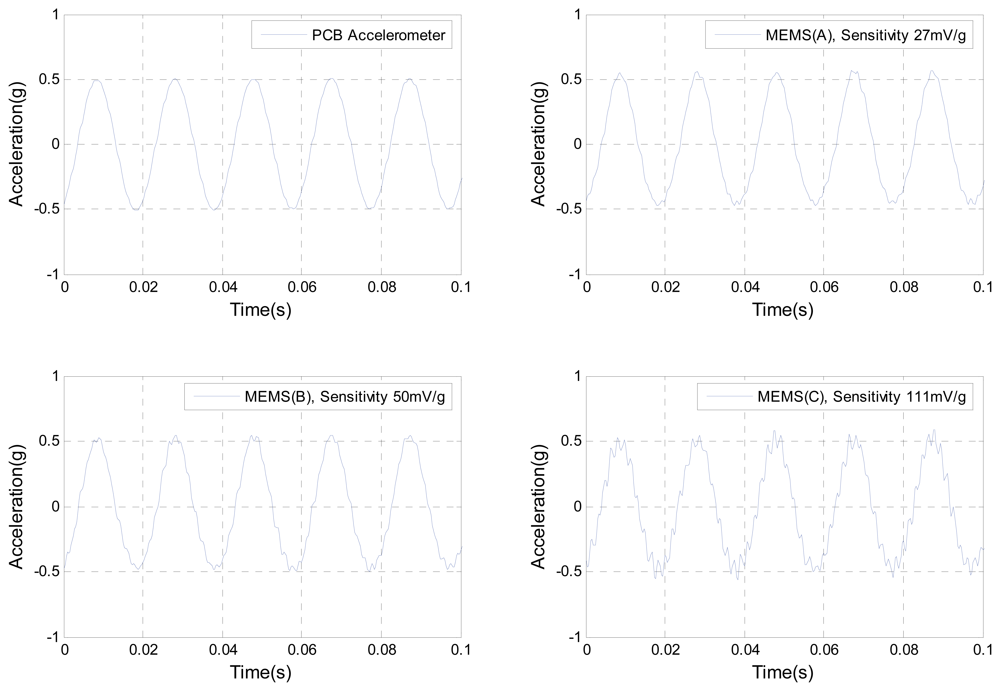
Figure 6.
Frequency domains of the measured acceleration responses by the MEMS accelerometers and the reference (PCB) accelerometer at 53Hz for the excitation amplitude 0.5g
Figure 6.
Frequency domains of the measured acceleration responses by the MEMS accelerometers and the reference (PCB) accelerometer at 53Hz for the excitation amplitude 0.5g
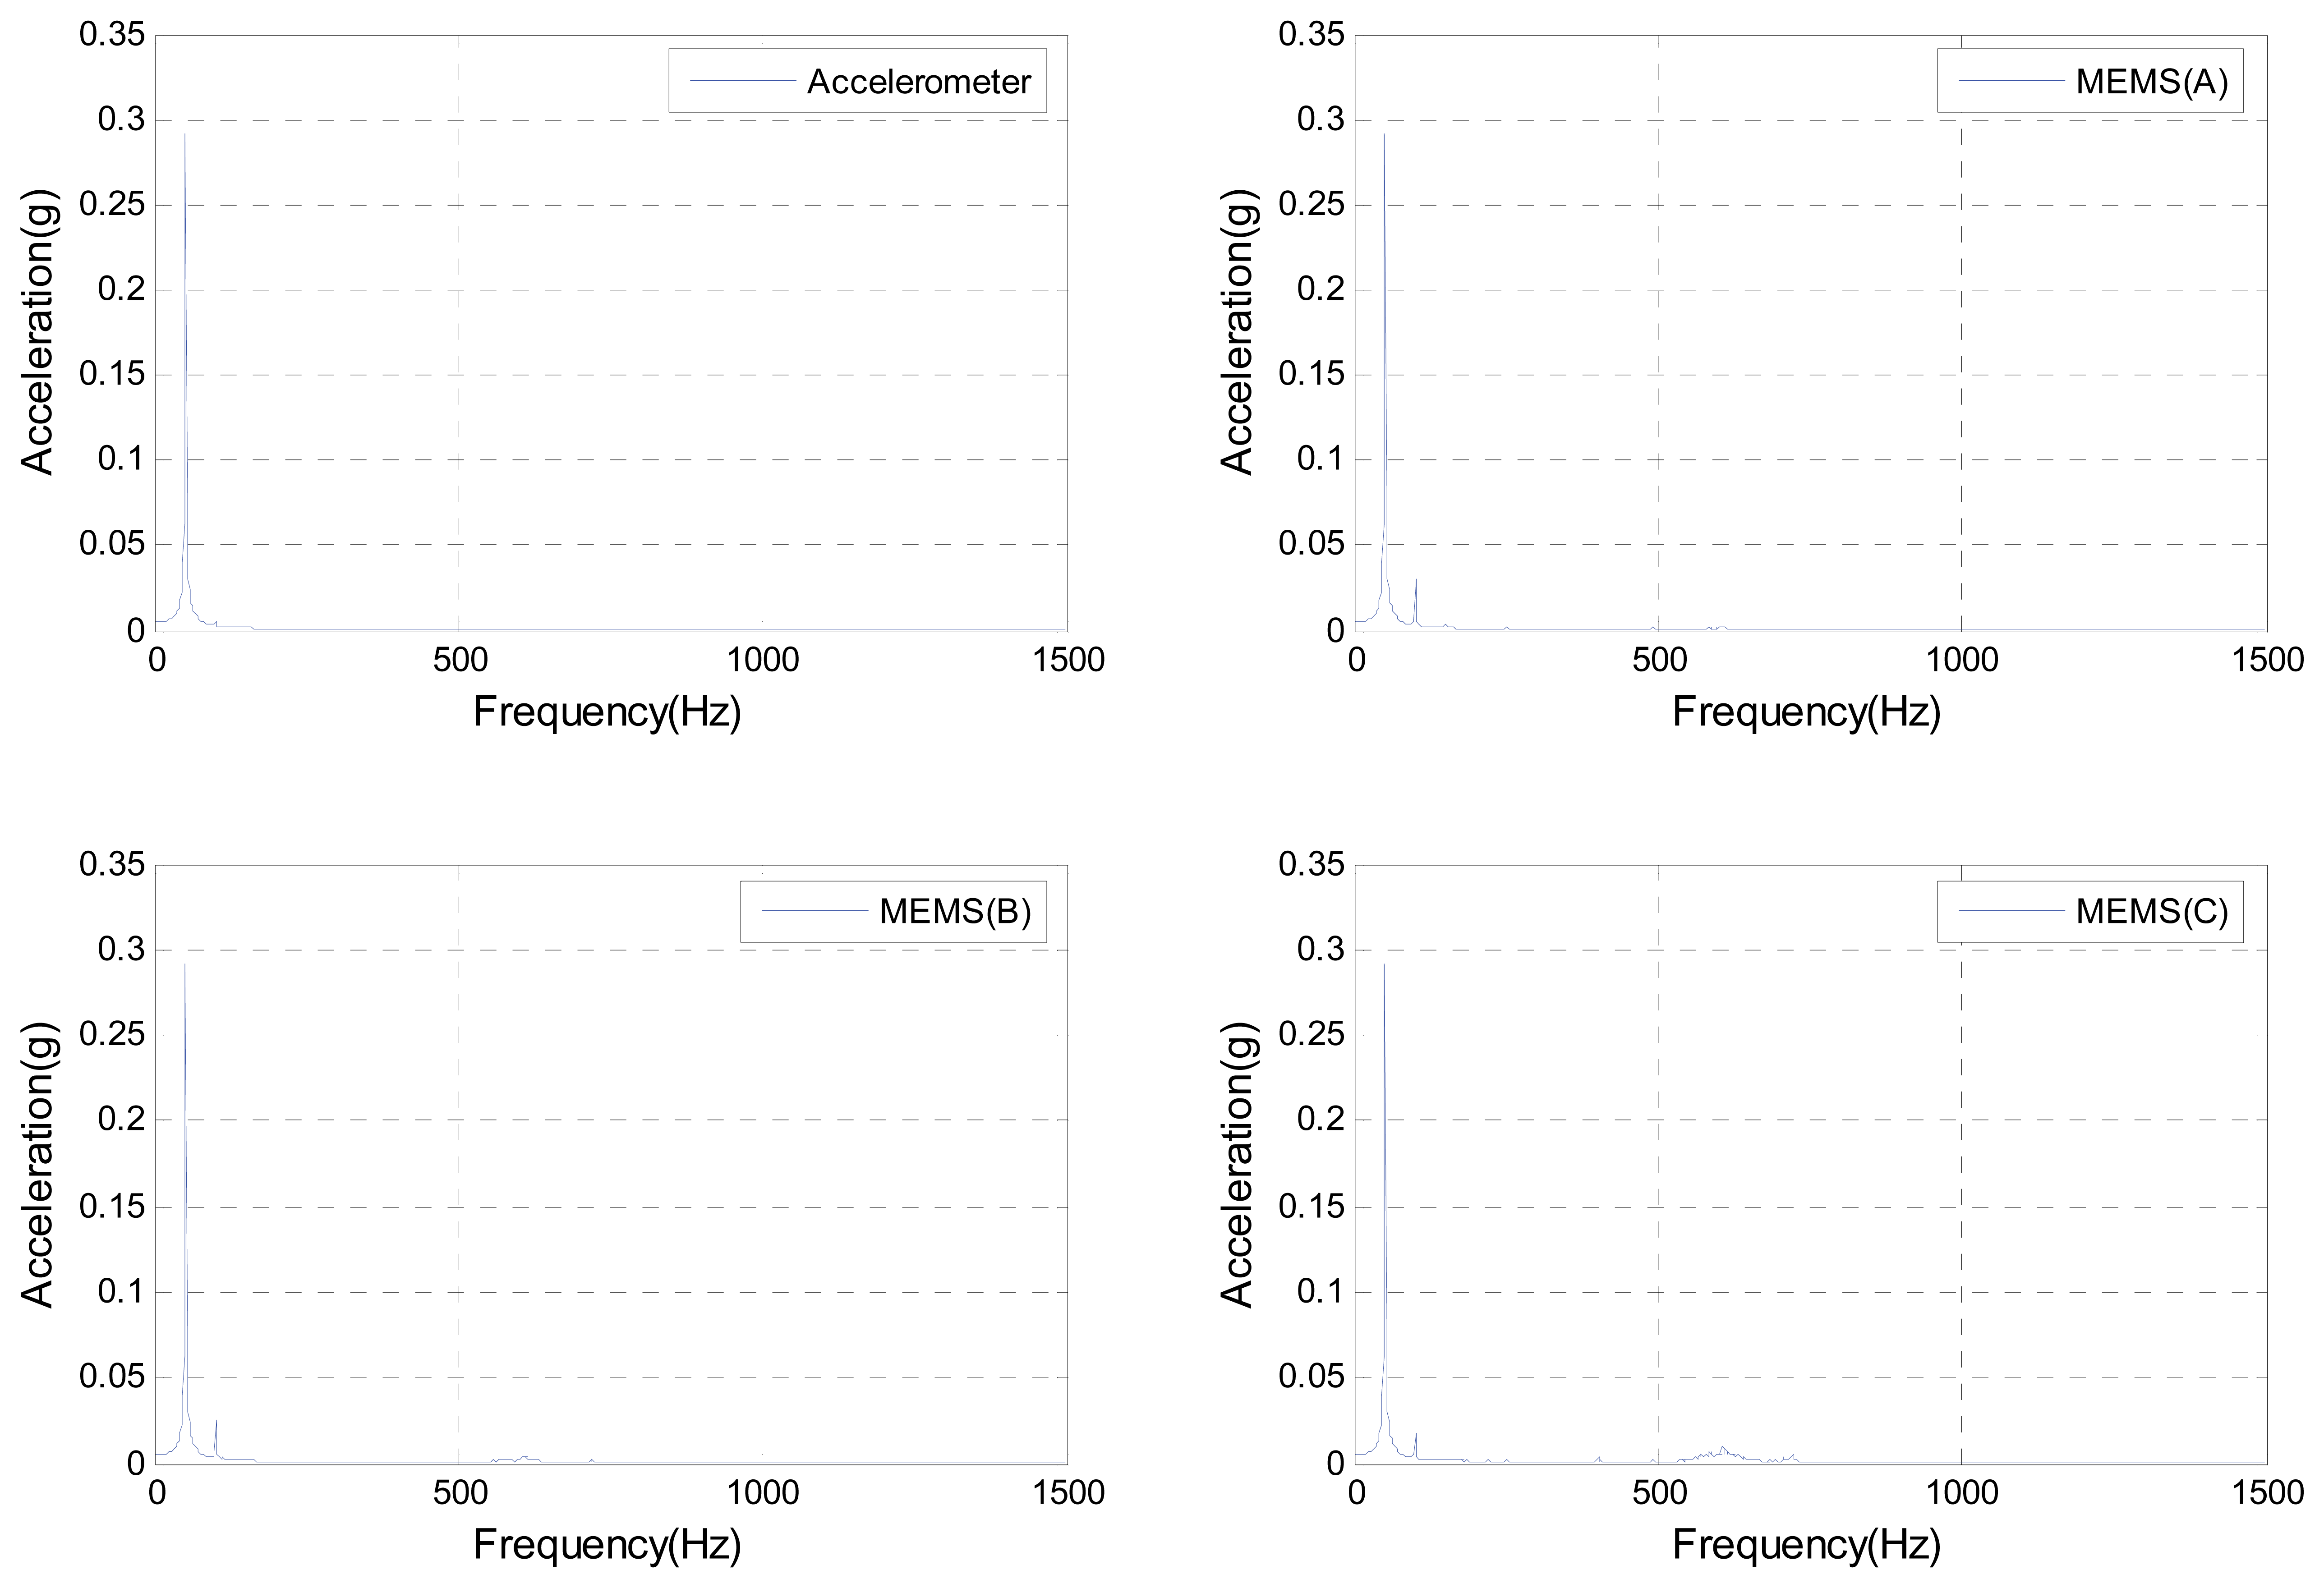
Figure 7.
Measured acceleration responses by the MEMS accelerometers and the reference (PCB) accelerometer at 95Hz for the excitation amplitude 0.15g
Figure 7.
Measured acceleration responses by the MEMS accelerometers and the reference (PCB) accelerometer at 95Hz for the excitation amplitude 0.15g
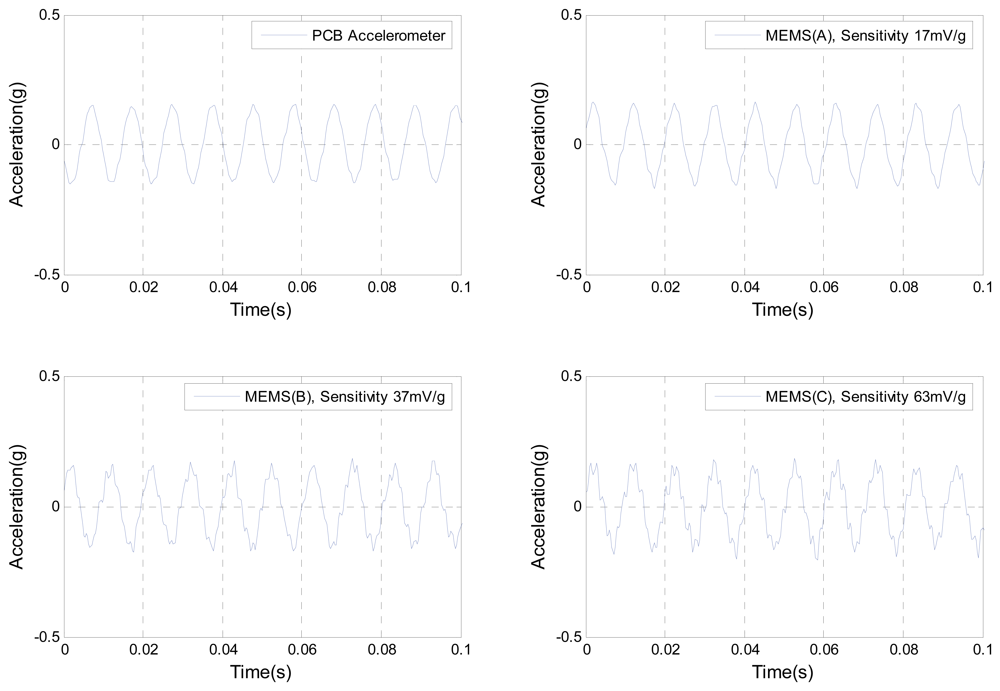
Figure 8.
Frequency domain of the measured acceleration responses by the MEMS accelerometers and the reference (PCB) accelerometer at 95Hz for the excitation amplitude 0.15g
Figure 8.
Frequency domain of the measured acceleration responses by the MEMS accelerometers and the reference (PCB) accelerometer at 95Hz for the excitation amplitude 0.15g
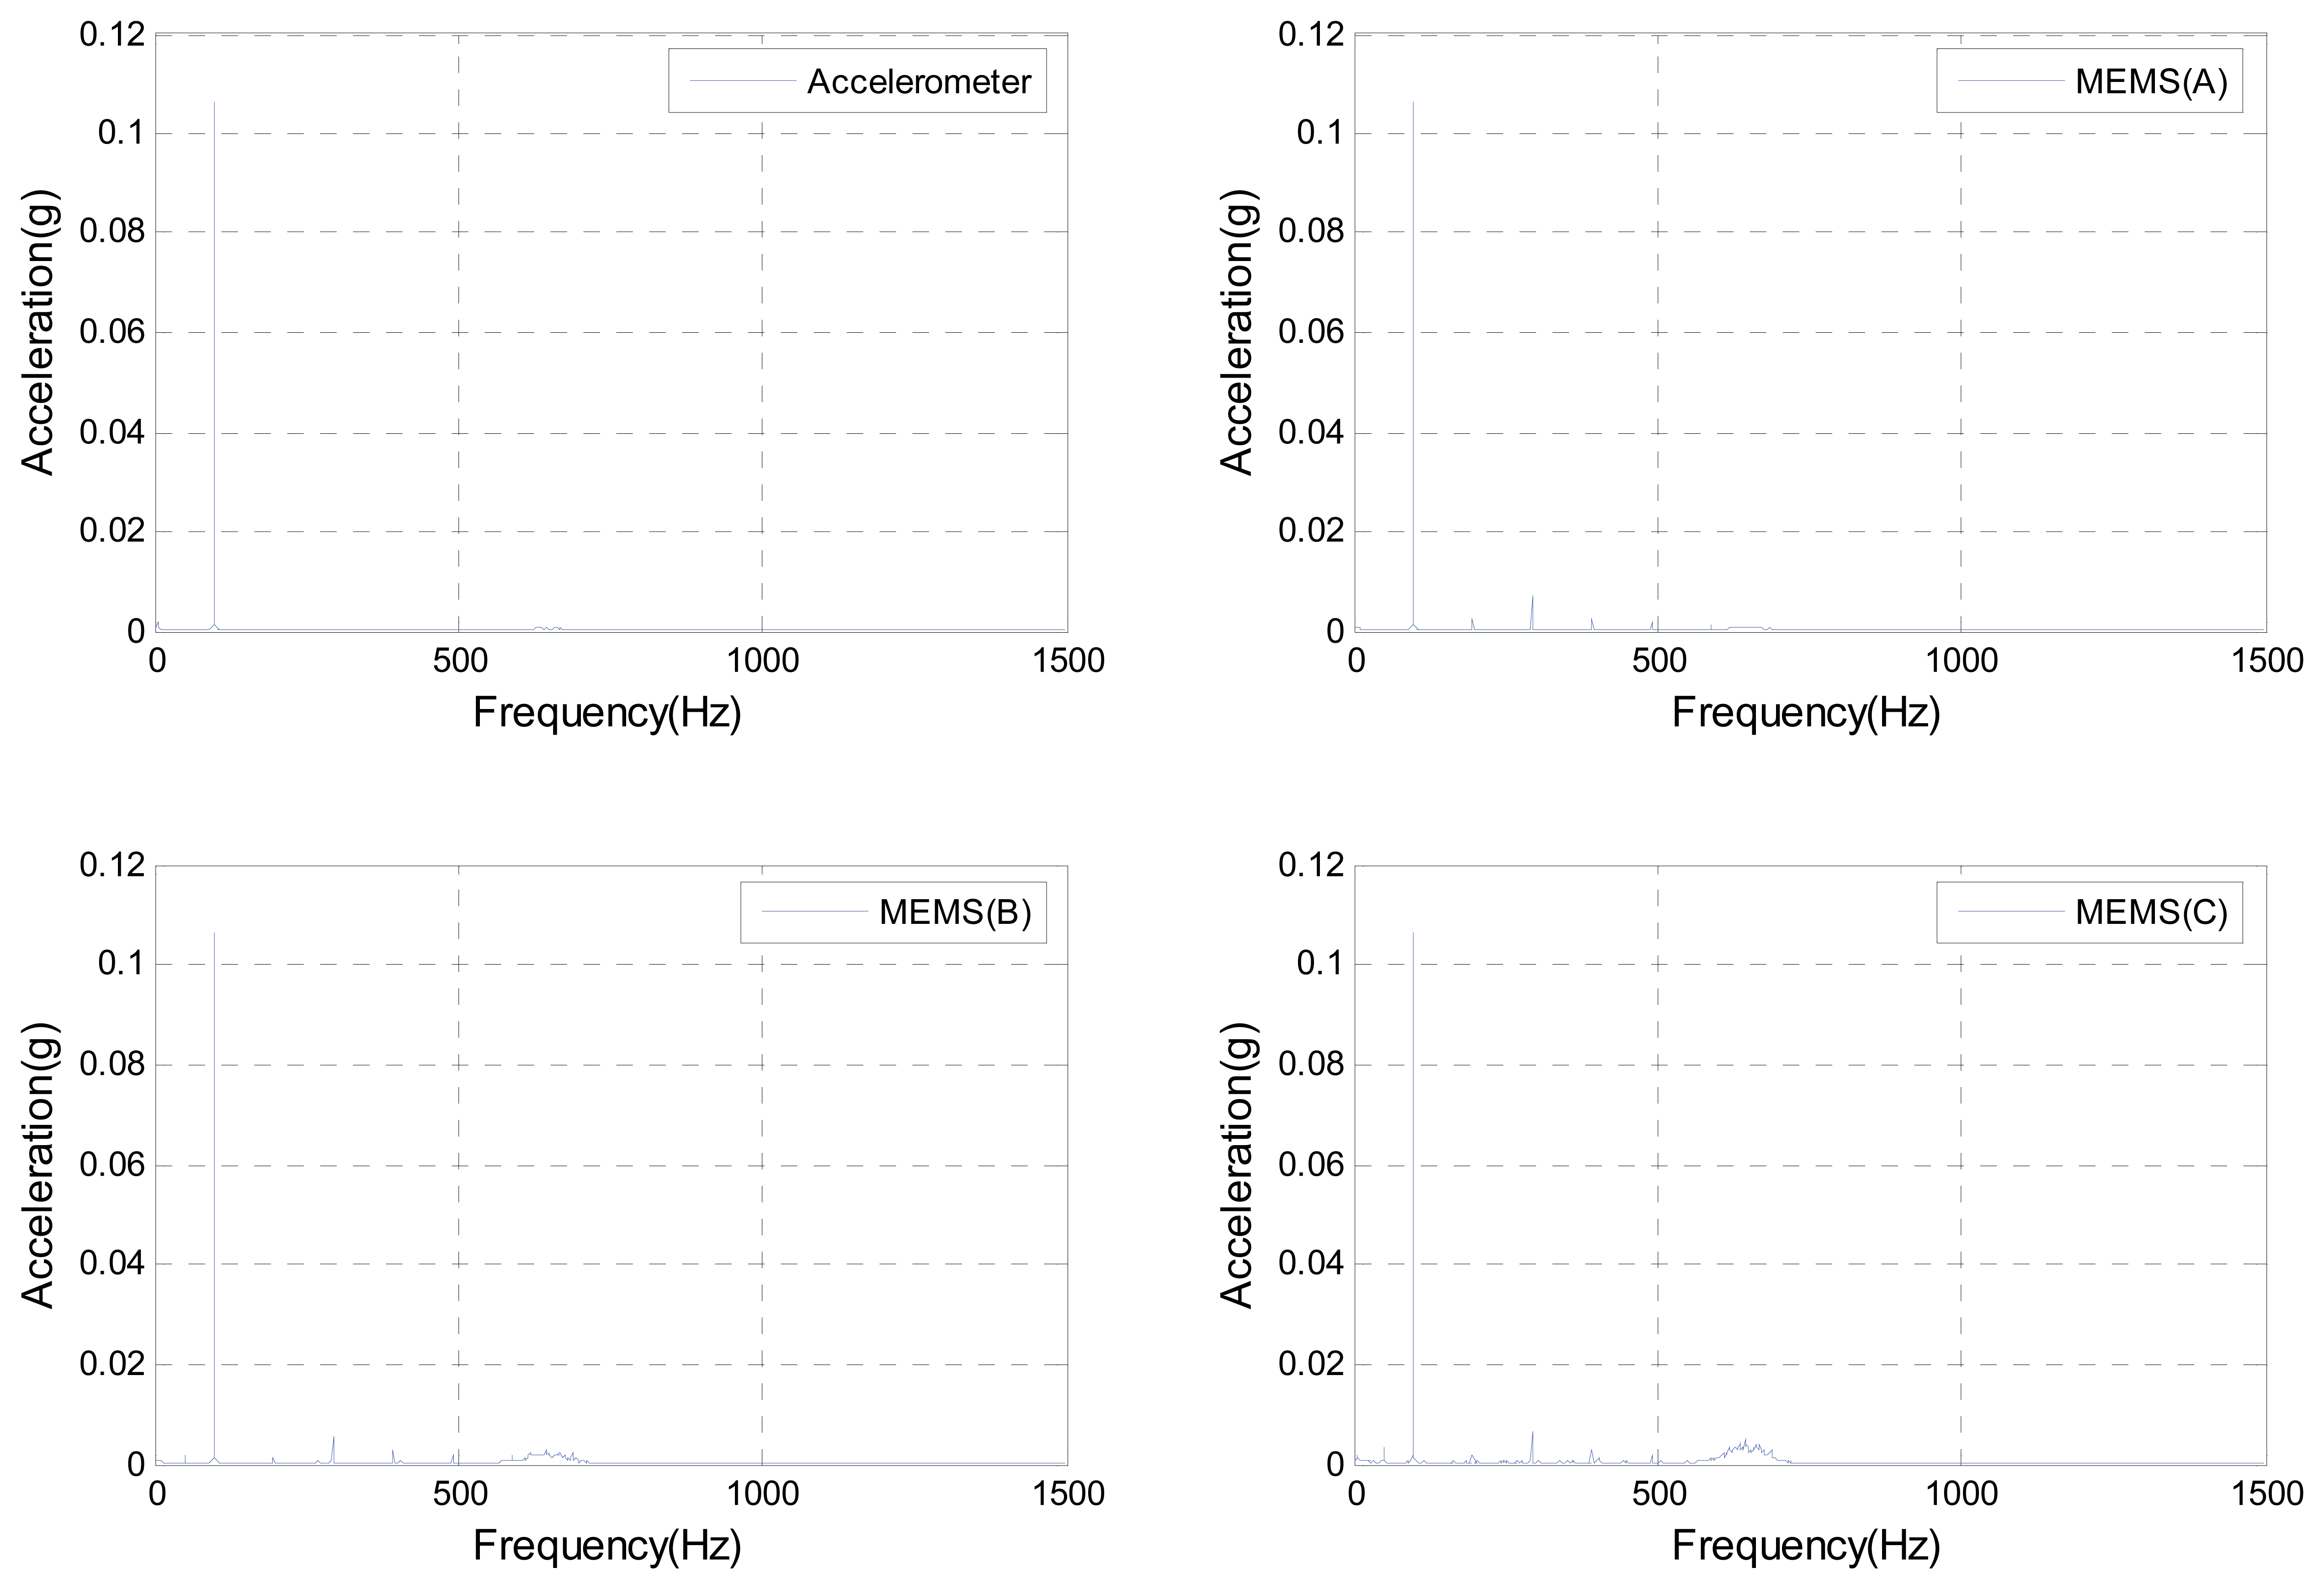
Figure 9.
Measured acceleration responses by the MEMS accelerometers and the reference (PCB) accelerometer at 95Hz for the excitation amplitude 0.35g
Figure 9.
Measured acceleration responses by the MEMS accelerometers and the reference (PCB) accelerometer at 95Hz for the excitation amplitude 0.35g
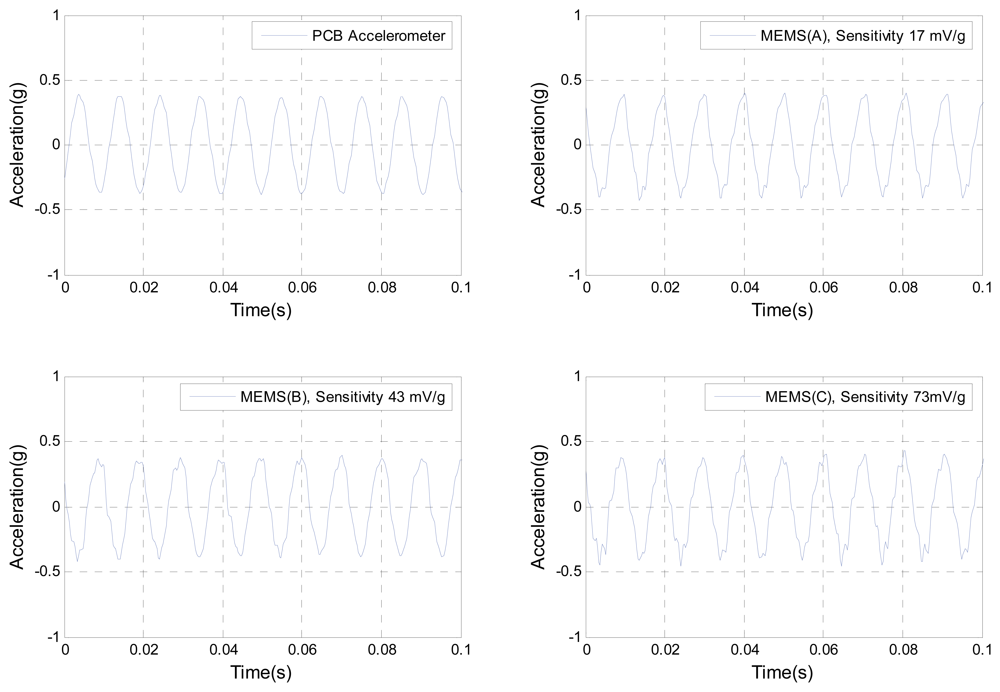
Figure 10.
Frequency domain of the measured acceleration responses by the MEMS accelerometers and the reference (PCB) accelerometer at 95Hz for the excitation amplitude 0.35g
Figure 10.
Frequency domain of the measured acceleration responses by the MEMS accelerometers and the reference (PCB) accelerometer at 95Hz for the excitation amplitude 0.35g

Figure 11.
A comparisons of measured responses by the MEMS accelerometers and the reference (PCB) accelerometer using a soft tip hammer.
Figure 11.
A comparisons of measured responses by the MEMS accelerometers and the reference (PCB) accelerometer using a soft tip hammer.
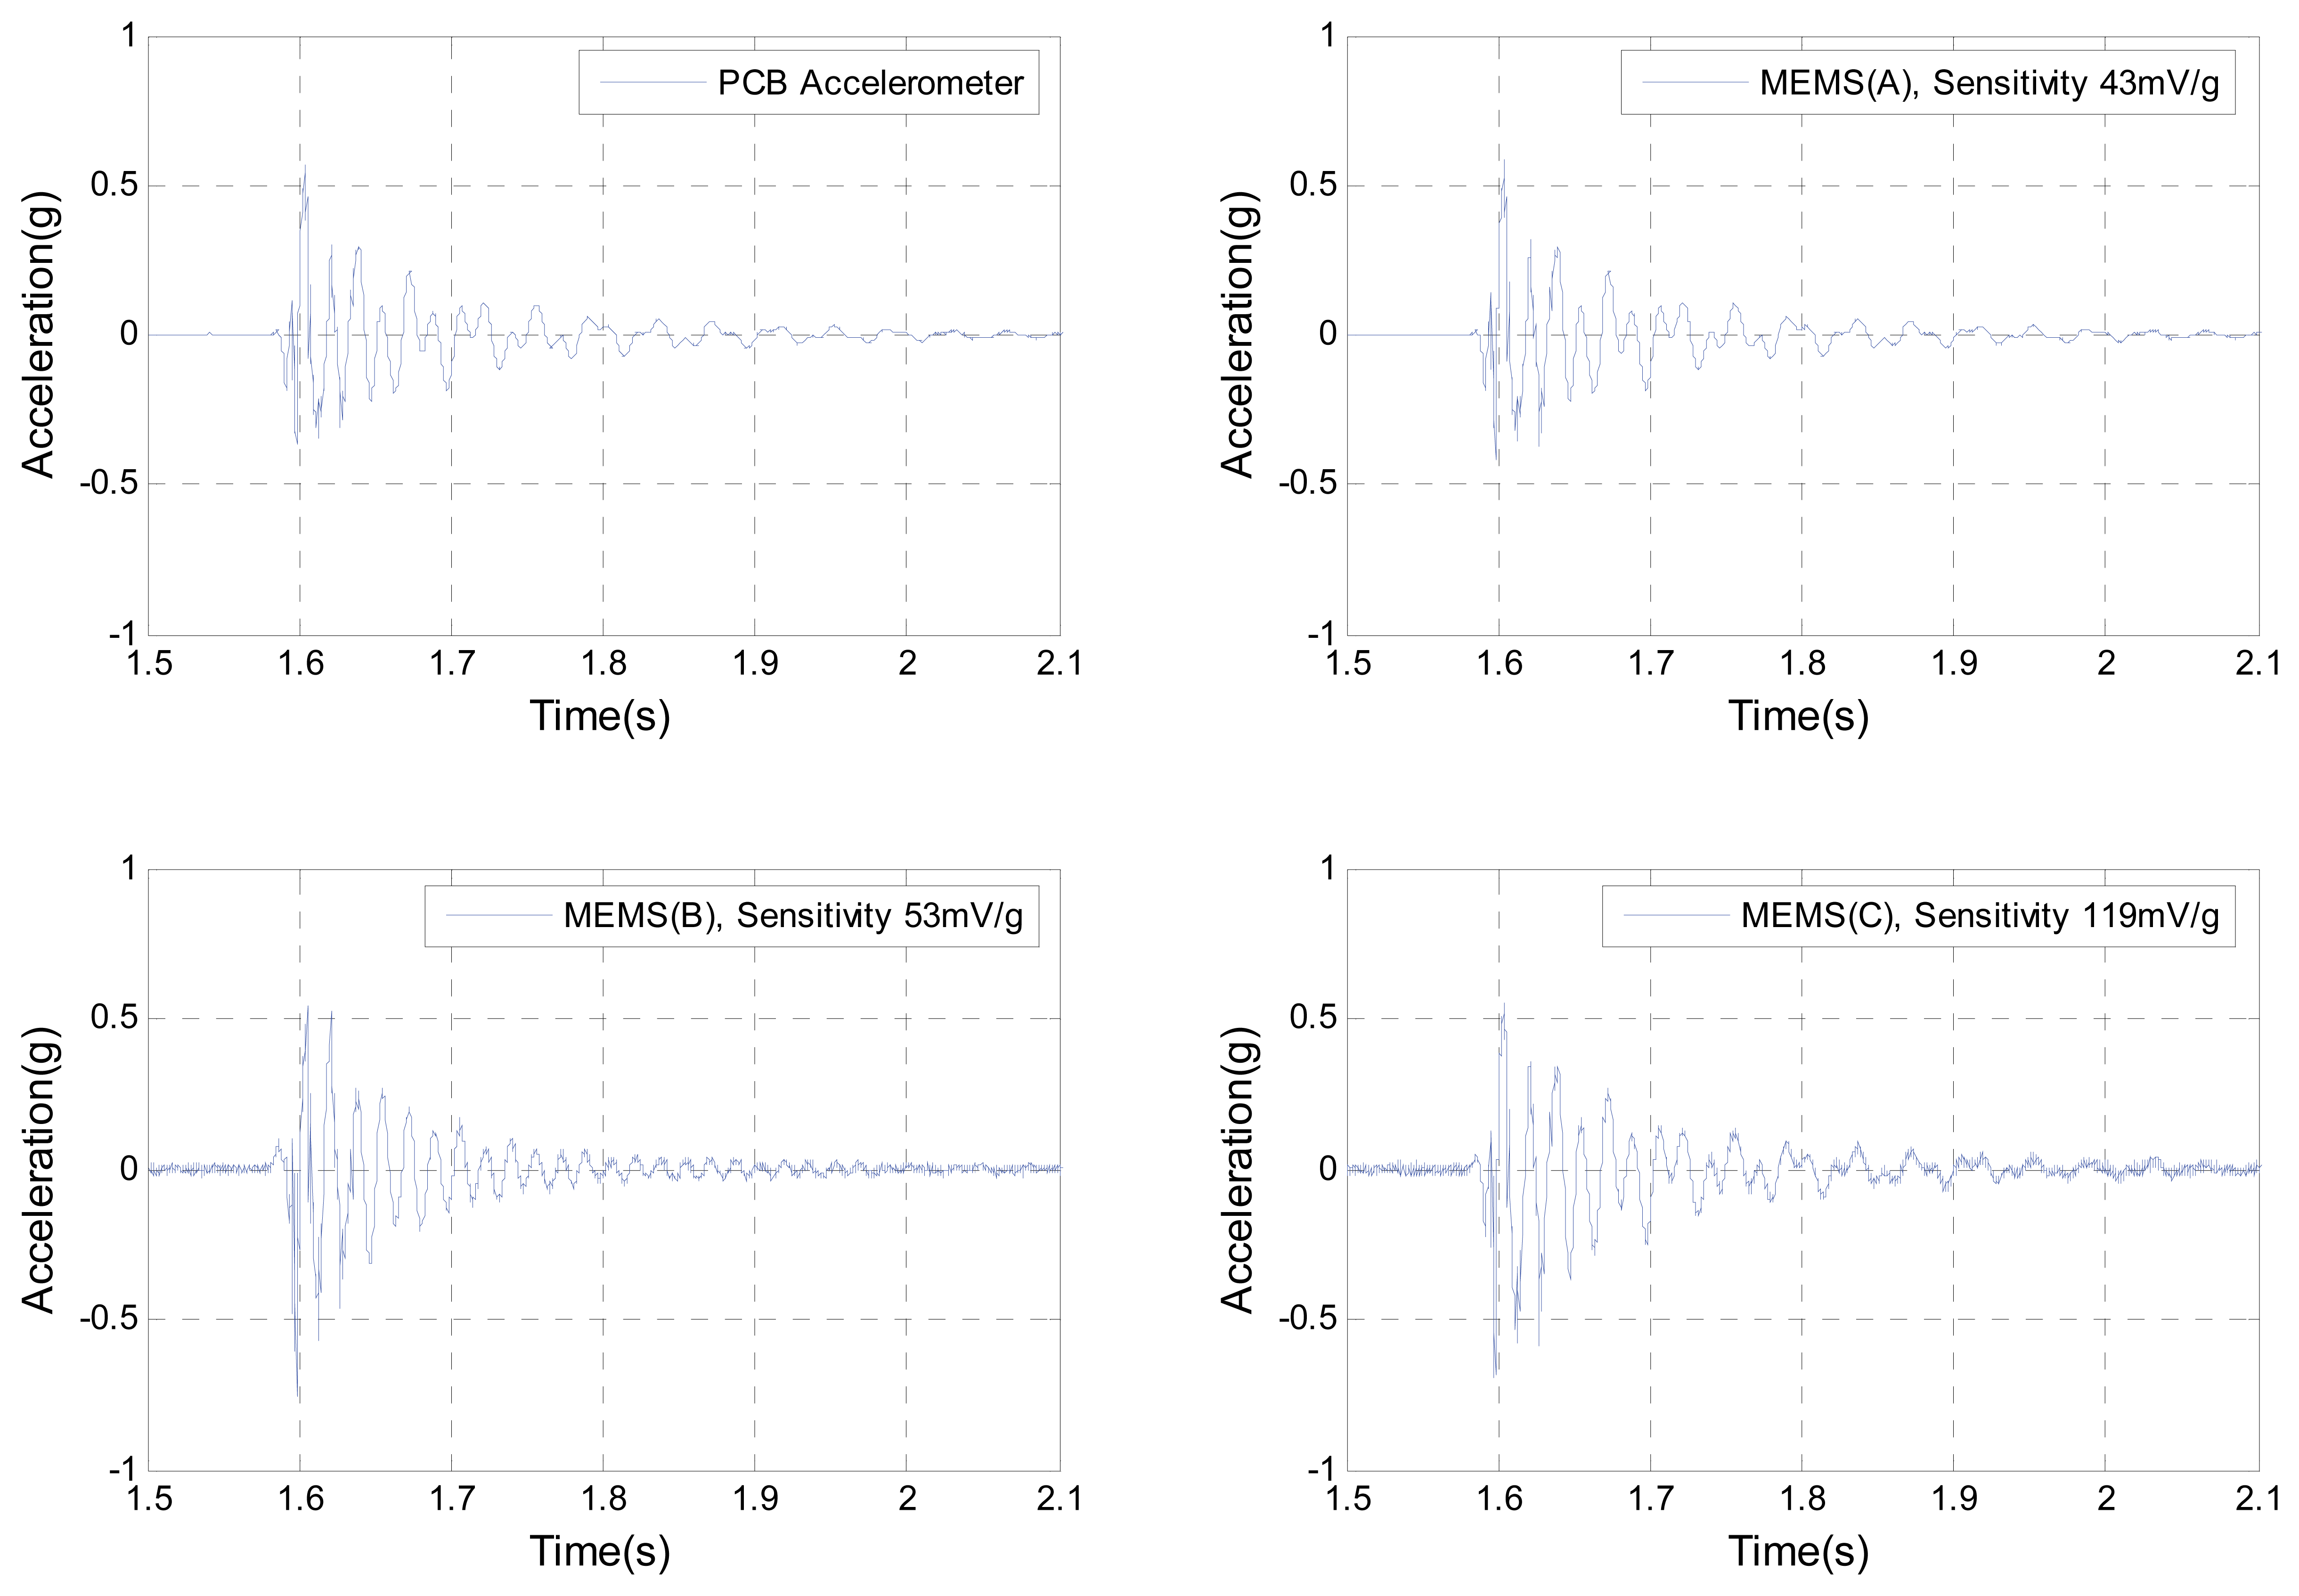
Figure 12.
Frequency domain of the measured responses by the MEMS accelerometers and the reference (PCB) accelerometer using a soft tip hammer
Figure 12.
Frequency domain of the measured responses by the MEMS accelerometers and the reference (PCB) accelerometer using a soft tip hammer
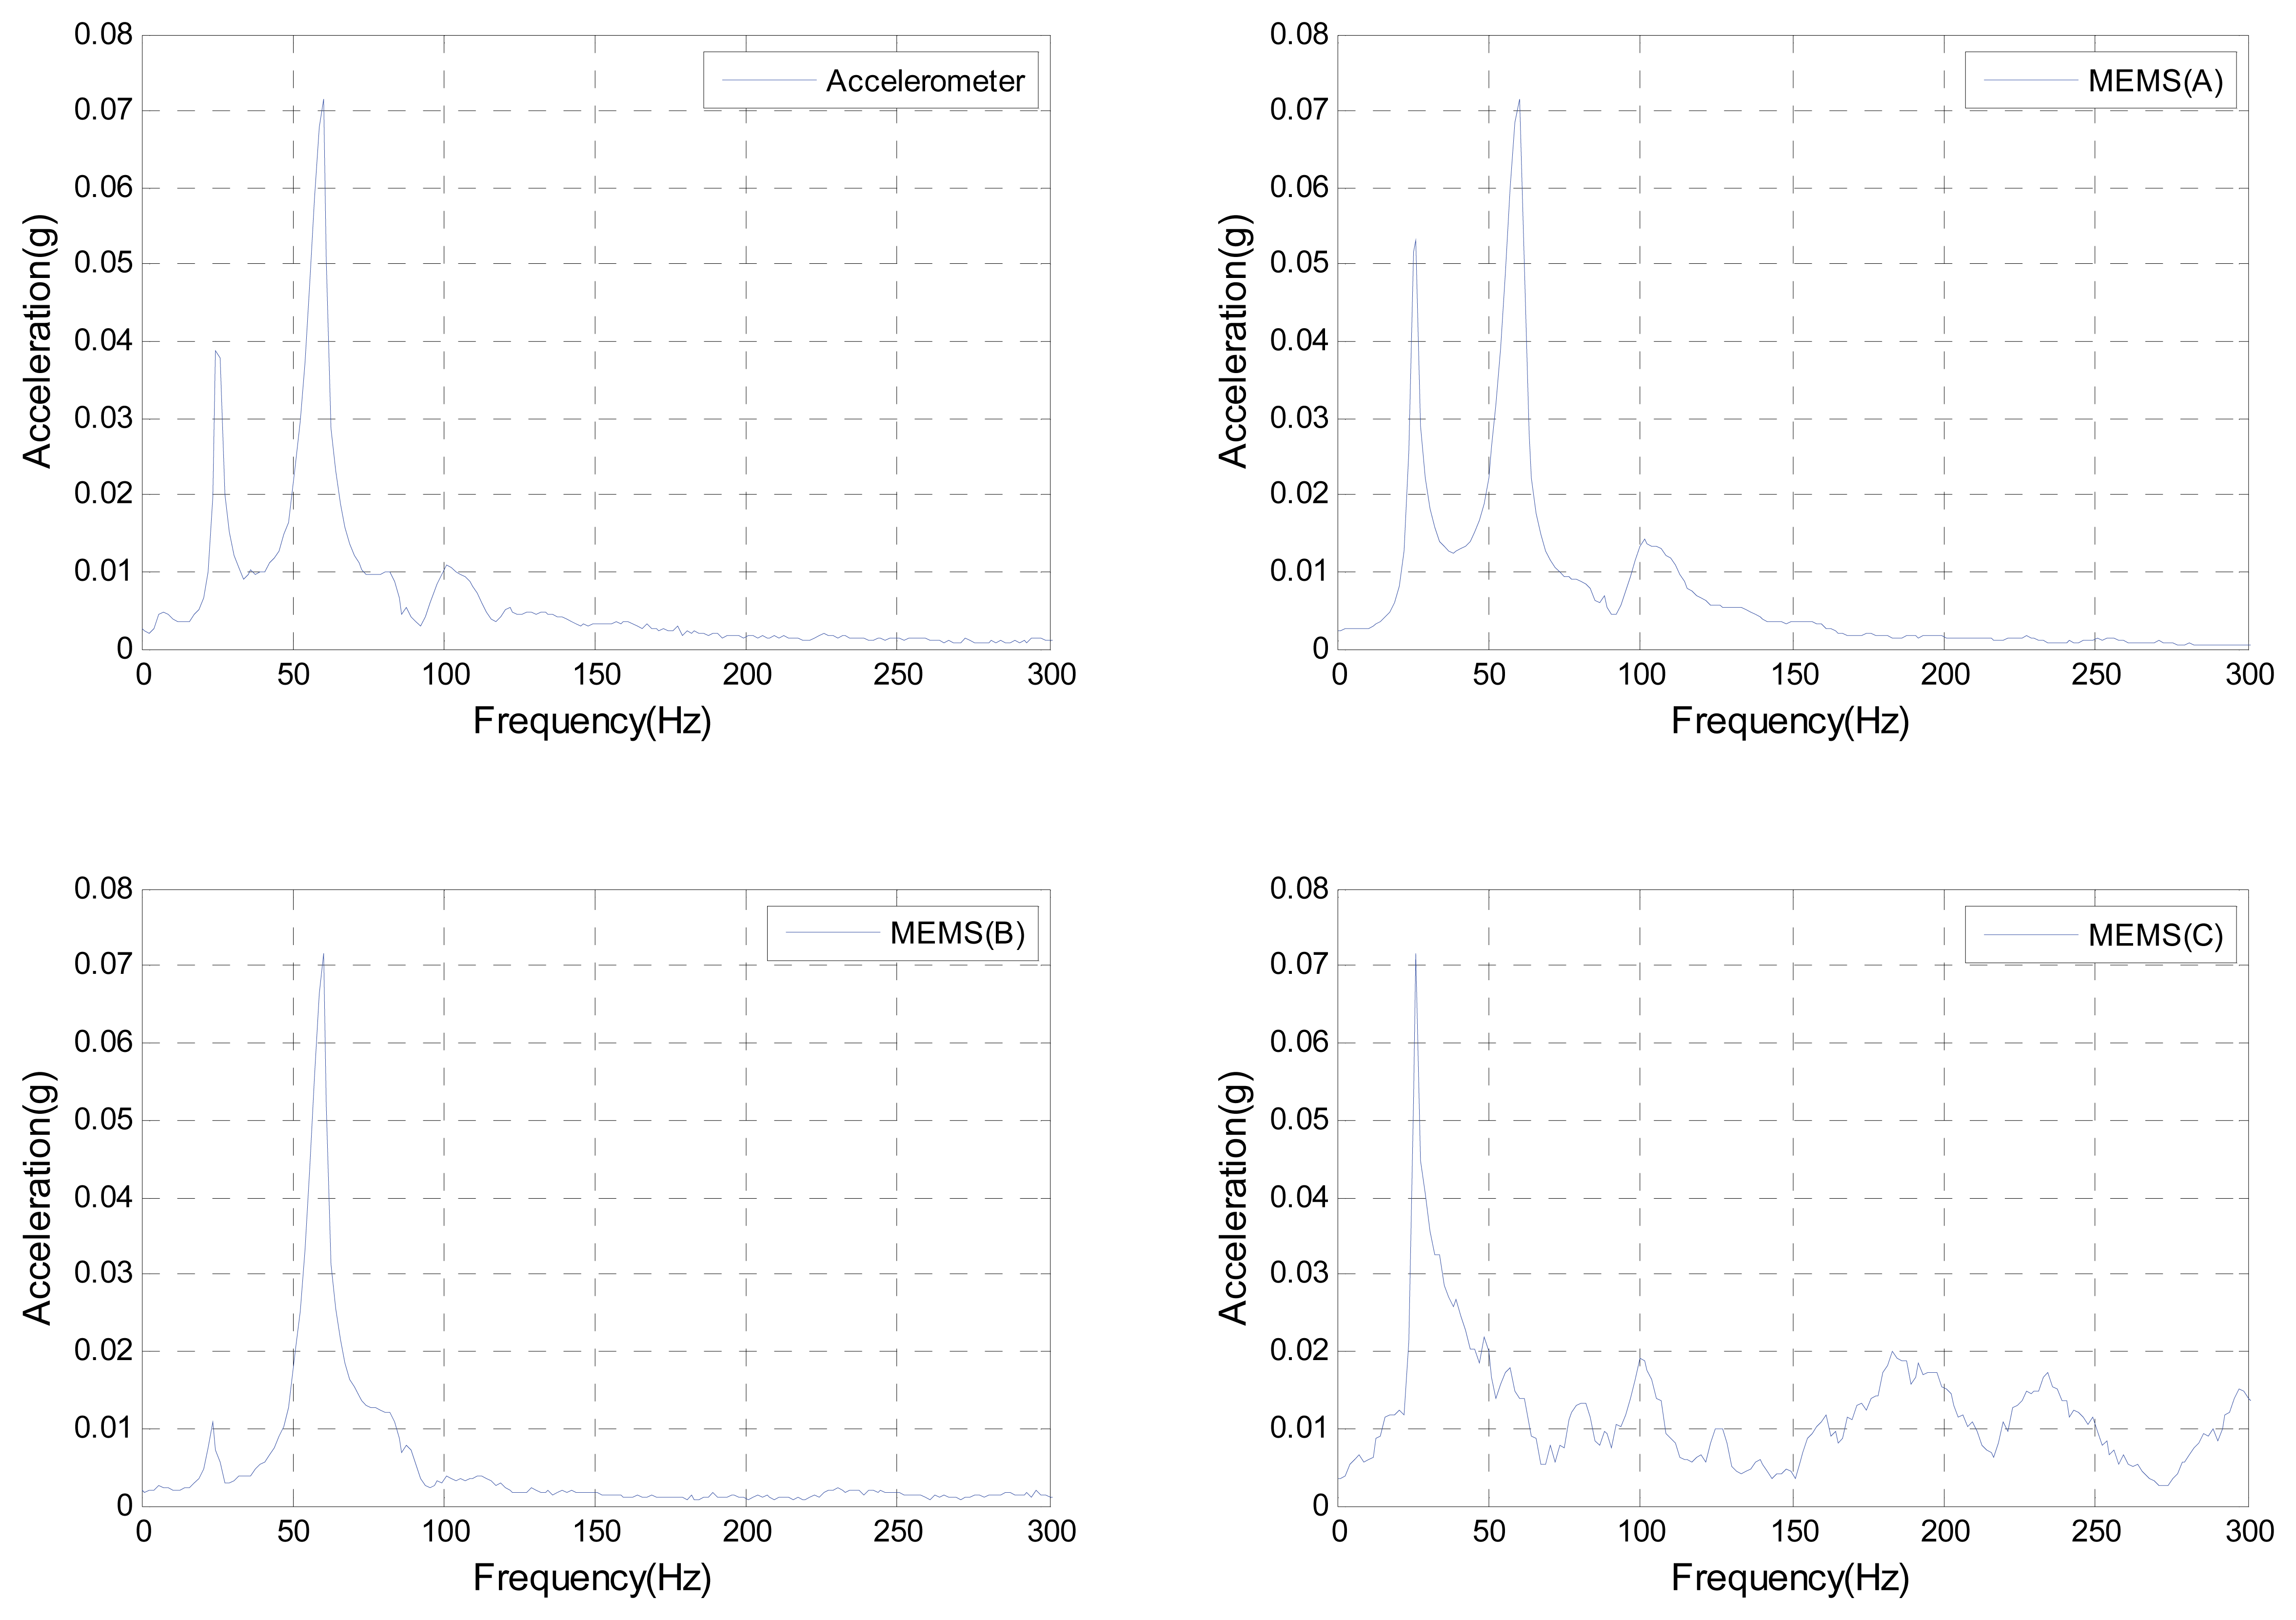
Figure 13.
Time domain of accelerometers responses when the shaker is excited by a random noise
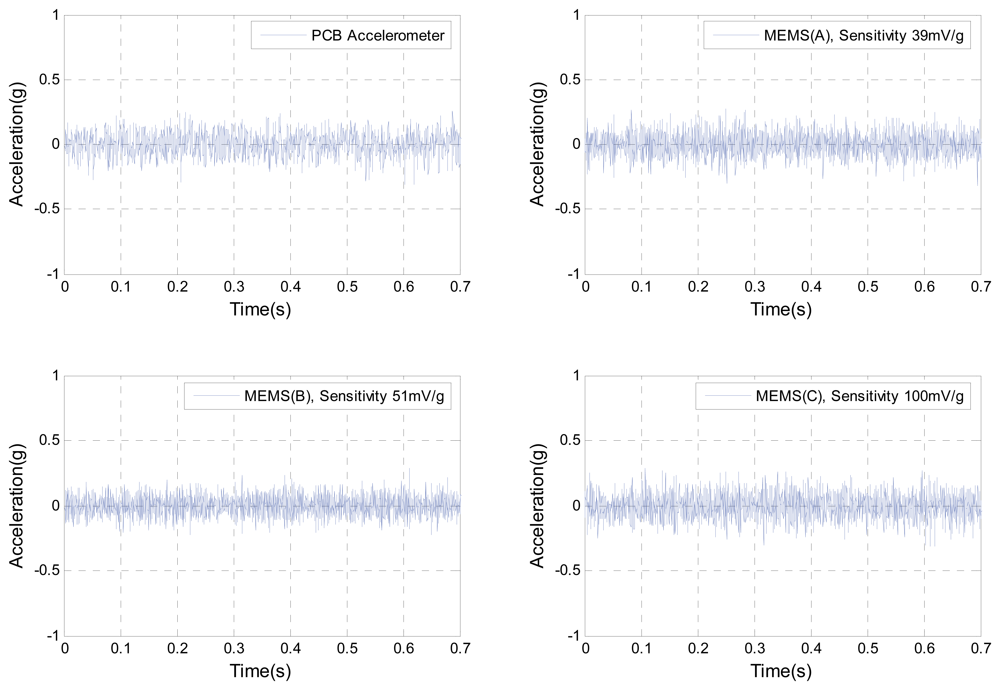
Figure 14.
Frequency domain of accelerometers responses when the shaker is excited by a random noise
Figure 14.
Frequency domain of accelerometers responses when the shaker is excited by a random noise
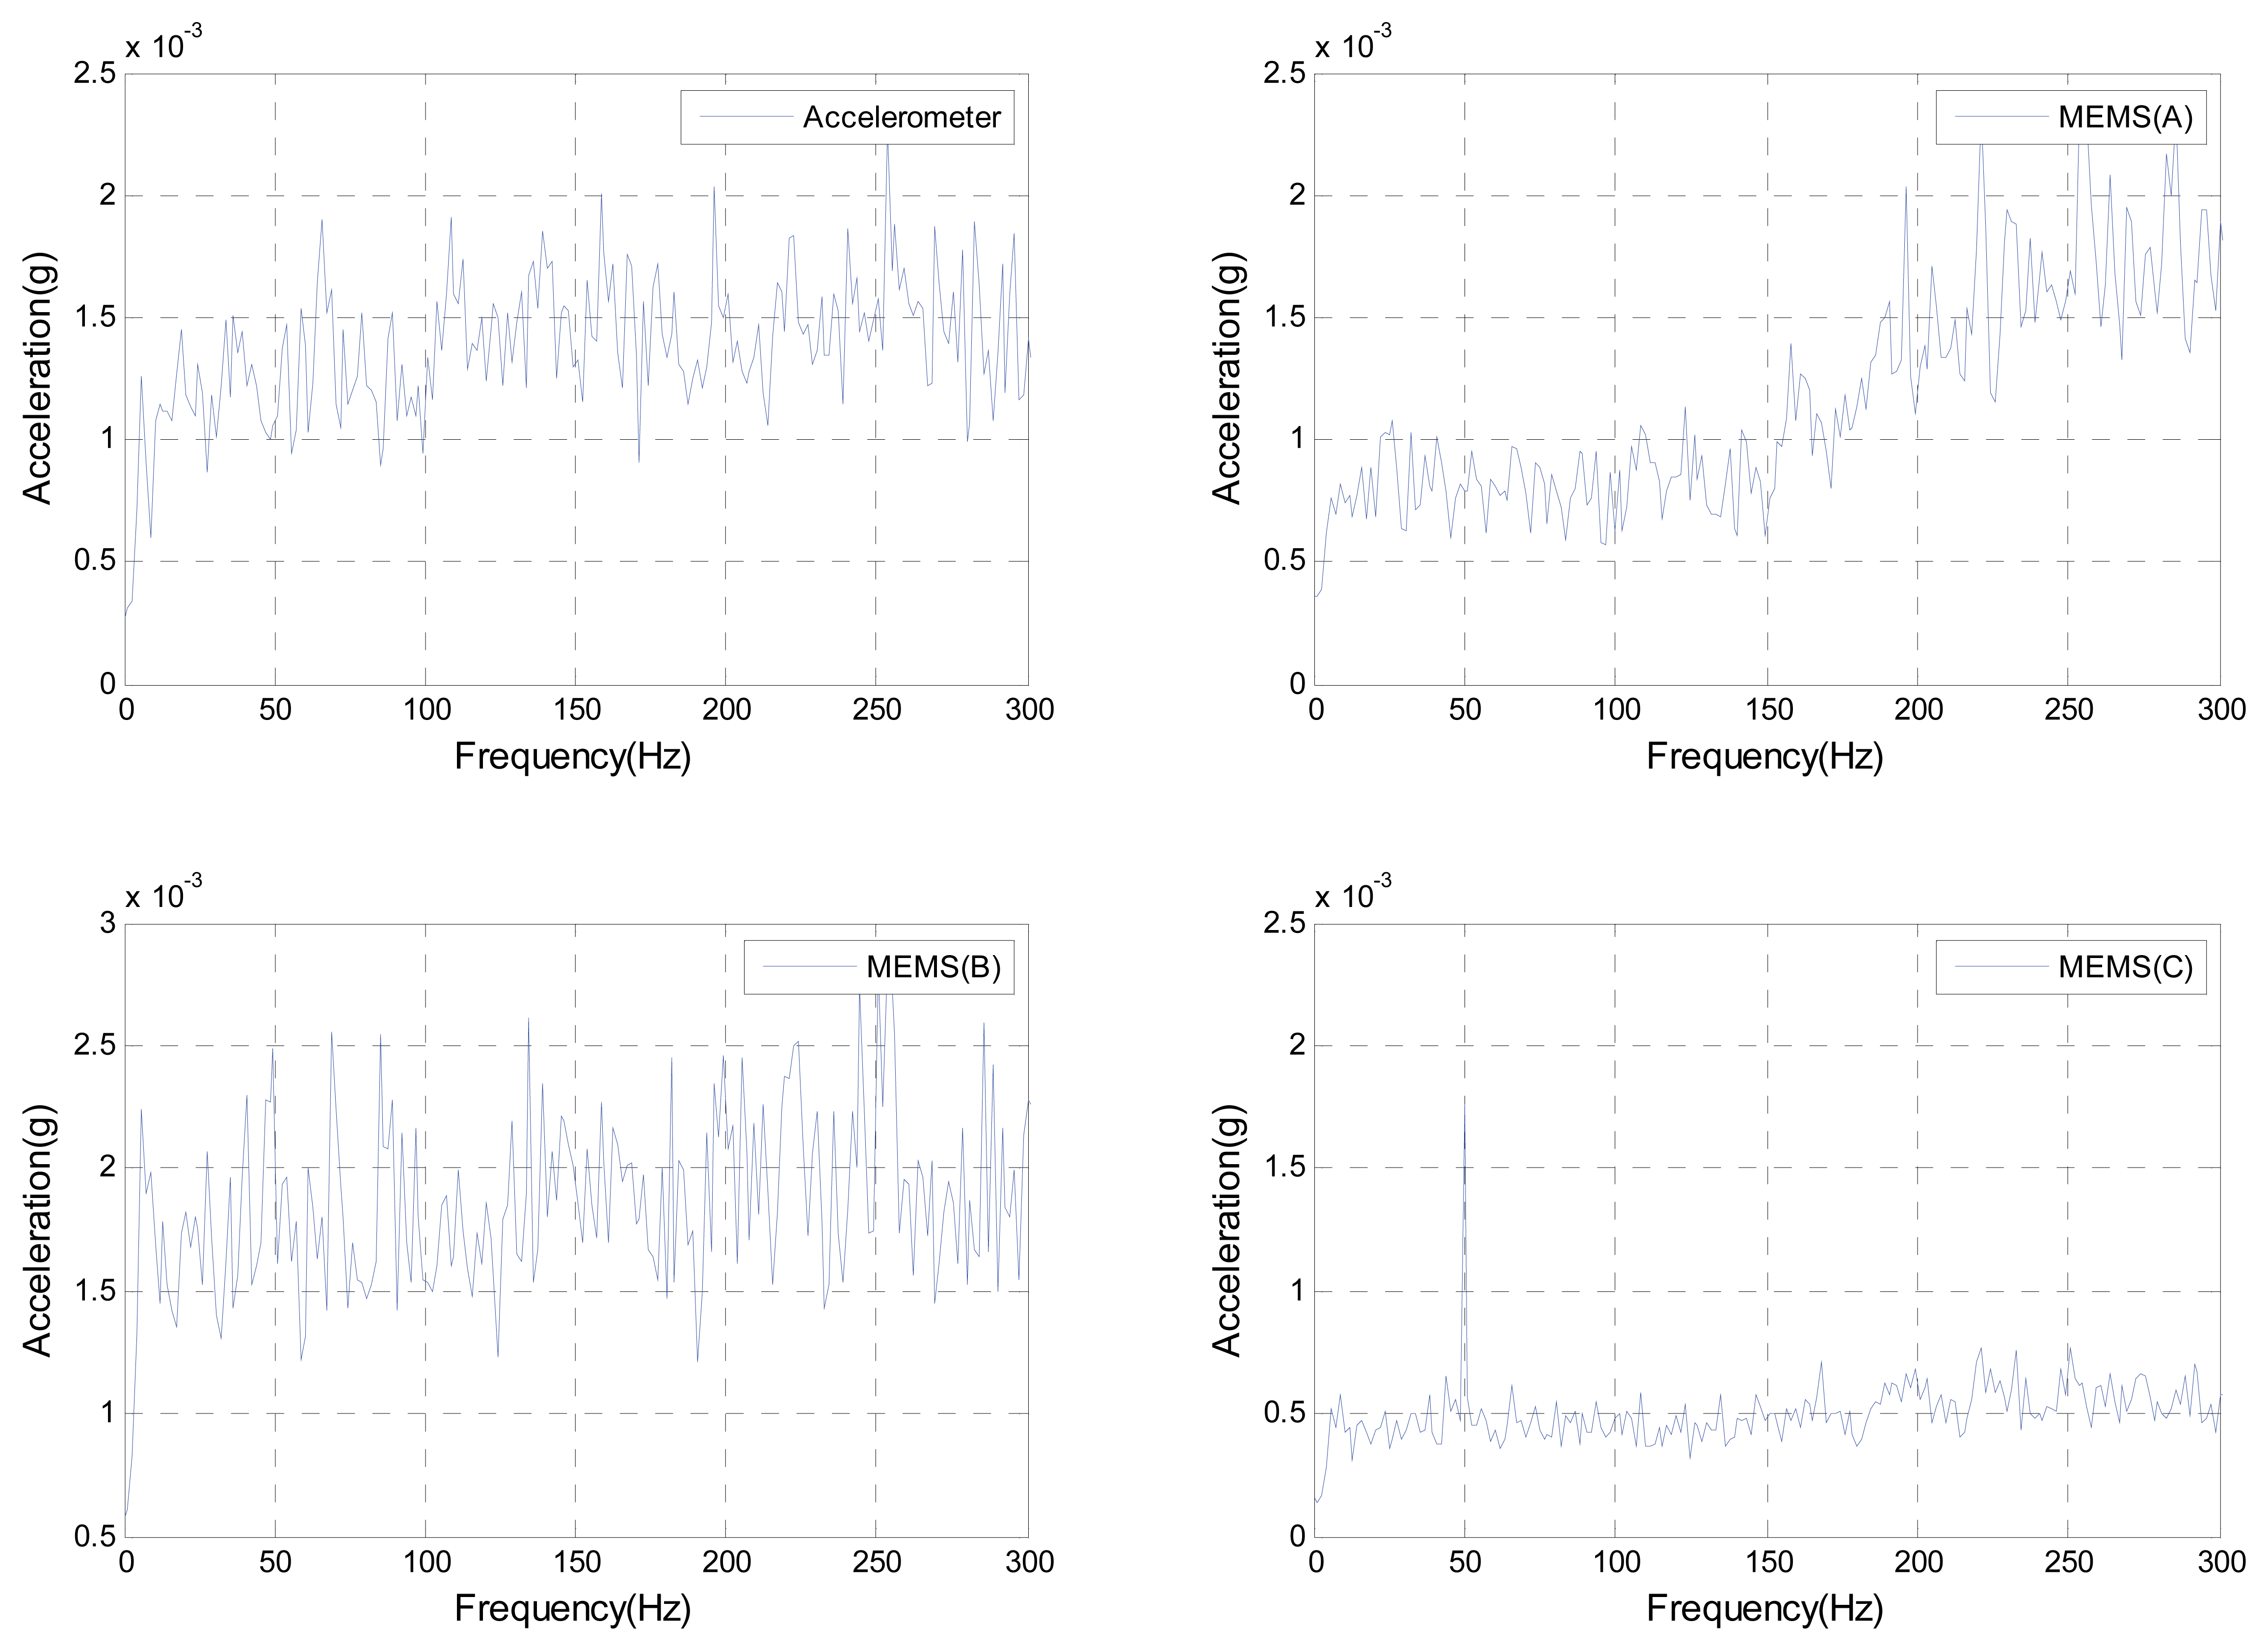
Figure 15.
Frequency response function for the MEMS accelerometers
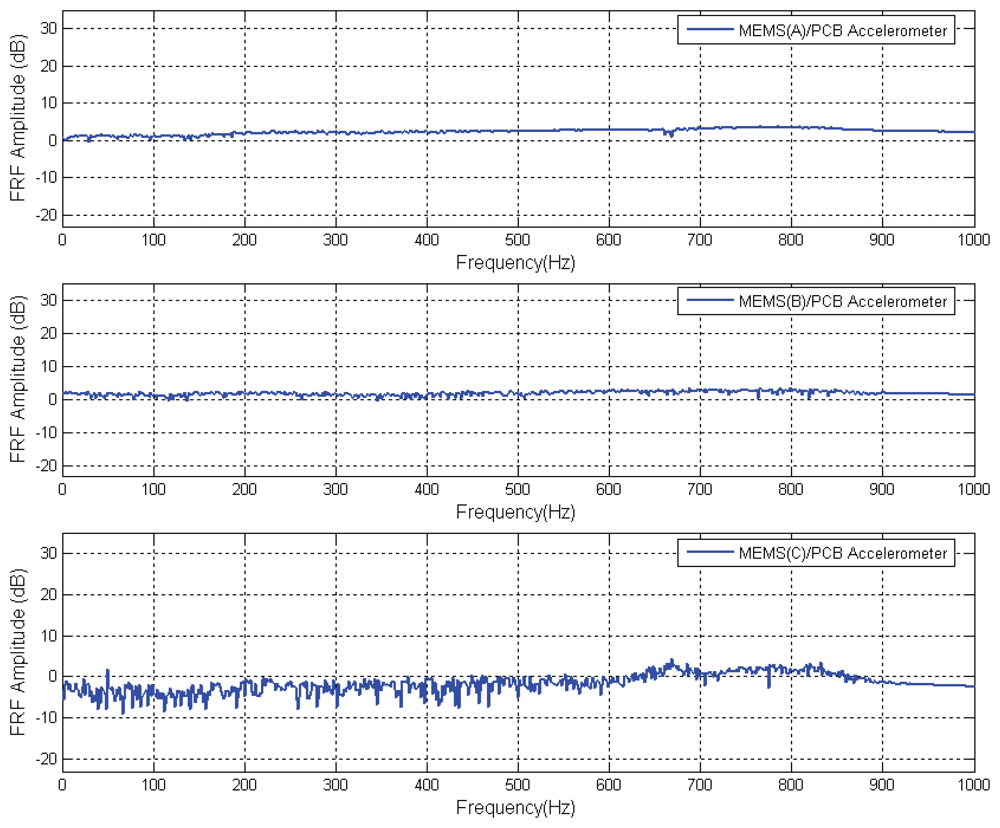
Figure 16.
Phase of the frequency response function for the MEMS accelerometers
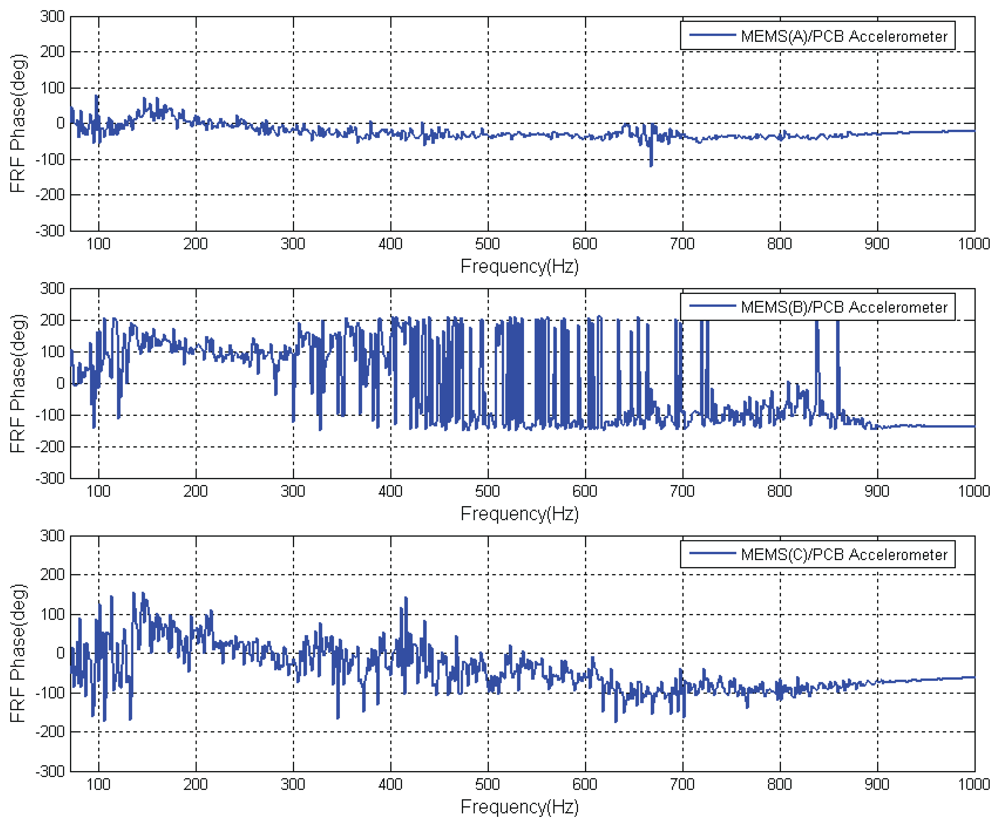
Figure 17.
CNC machine vibration monitoring setup
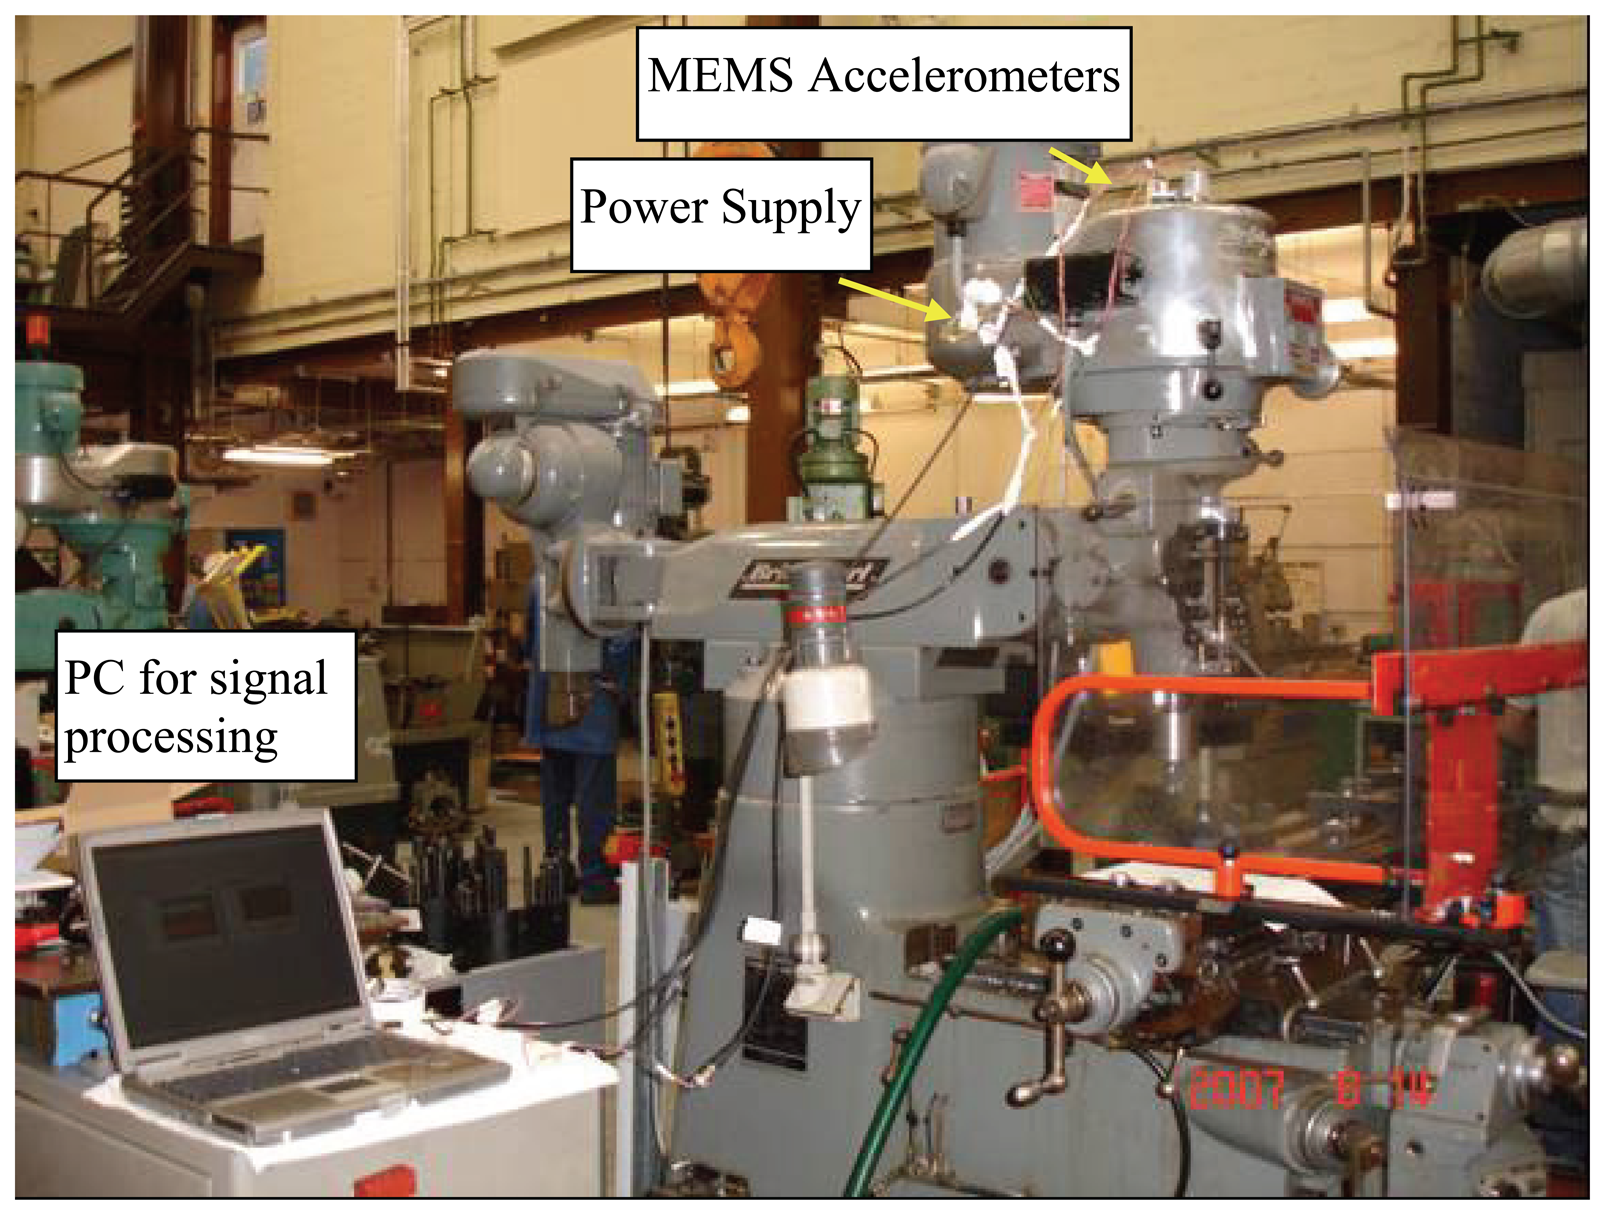
Figure 18.
CNC machine vibration measured by the MEMS accelerometers at speed of 2400 rpm

| Conventional | MEMS (A) | MEMS (B) | MEMS (C) | |
|---|---|---|---|---|
| Sensitivity | 100 mV/g for Vs=5V | 140-195 mV/g for Vs=3V | 225-275mV/g for Vs=5V | 450-550mV/g for Vs = 3V |
| Frequency range (Hz) | 1–2,000 | 1–6,000 | 1–10,000 | 1,500 |
| Amplitude limit (g) | +/-50 | +/-5 | +/-3 | +/- 3 |
| Linearity | <±5% | ±1%/1kHz | ±1%/5kHz | ±1%/1kHz |
| Shock limit (g) | 5000 | 250 | 1000 | 100 |
| Resolution (mg) | 3 | 2 | <0.1 | 0.3 |
© 2008 by MDPI Reproduction is permitted for noncommercial purposes.
Share and Cite
MDPI and ACS Style
Albarbar, A.; Mekid, S.; Starr, A.; Pietruszkiewicz, R. Suitability of MEMS Accelerometers for Condition Monitoring: An experimental study. Sensors 2008, 8, 784-799. https://doi.org/10.3390/s8020784
AMA Style
Albarbar A, Mekid S, Starr A, Pietruszkiewicz R. Suitability of MEMS Accelerometers for Condition Monitoring: An experimental study. Sensors. 2008; 8(2):784-799. https://doi.org/10.3390/s8020784
Chicago/Turabian StyleAlbarbar, Alhussein, Samir Mekid, Andrew Starr, and Robert Pietruszkiewicz. 2008. "Suitability of MEMS Accelerometers for Condition Monitoring: An experimental study" Sensors 8, no. 2: 784-799. https://doi.org/10.3390/s8020784