Application of Design of Experiment Method for Thrust Force Minimization in Step-feed Micro Drilling

1
Division of Mechanical Engineering, Inha University, Incheon 402-751, Korea
2
Department of Mechanical Engineering, University of Incheon, Incheon 402-749, Korea
3
Nano-Mechanisms Groups, KIMM, Daejeon 305-343, Korea
*
Author to whom correspondence should be addressed.
Sensors 2008, 8(1), 211-221; https://doi.org/10.3390/s8010211
Submission received: 4 December 2007
/
Accepted: 8 January 2008
/
Published: 21 January 2008
(This article belongs to the Special Issue Modeling, Testing and Reliability Issues in MEMS Engineering)
Abstract
:Micro drilled holes are utilized in many of today's fabrication processes. Precision production processes in industries are trending toward the use of smaller holes with higher aspect ratios, and higher speed operation for micro deep hole drilling. However, undesirable characteristics related to micro drilling such as small signal-to-noise ratios, wandering drill motion, high aspect ratio, and excessive cutting forces can be observed when cutting depth increases. In this study, the authors attempt to minimize the thrust forces in the step-feed micro drilling process by application of the DOE (Design of Experiment) method. Taking into account the drilling thrust, three cutting parameters, feedrate, step-feed, and cutting speed, are optimized based on the DOE method. For experimental studies, an orthogonal array L27(313) is generated and ANOVA (Analysis of Variance) is carried out. Based on the results it is determined that the sequence of factors affecting drilling thrusts corresponds to feedrate, step-feed, and spindle rpm. A combination of optimal drilling conditions is also identified. In particular, it is found in this study that the feedrate is the most important factor for micro drilling thrust minimization.
1. Introduction
Recently, with increasing demand for precise micro components production, the importance of micro hole drilling processes is increasing in fields such as medical instruments, aerospace engineering, and computer industries.[1,2] It is required for micro deep hole drilling technologies to achieve higher accuracy and higher productivity, because deeper and smaller holes are required for specific applications in the aforementioned industries. For these applications, thermal methods (e.g. electron beam, laser, electric discharging) and chemical methods (e.g. electrolytic polishing, electrochemical machining) are usually applied. However, in general applications, mechanical drilling process is preferred over other processes for producing micro deep holes due to their higher economical efficiency and productivity. Generally, mechanical micro deep hole drilling process become increasingly difficult as the aspect ratio of drill increases. This is caused by insufficient chip and heat discharging mechanisms, as well as problems related to ineffective lubrication arising from failure to adequately supply coolant. Due to such problems, the machining quality of drilled micro holes can be significantly deteriorated. Also, the micro drills can be easily fractured by small impact, bending, and torsion, because they are very slender and long.
To realize a more efficient micro-drilling process, a step-feed process is required instead of the one-pass drilling method. The step-feed process repeats drill feeding forward and backward with a certain number of steps, as shown in Figure 1. This provides better discharge of chips and heat, longer tool life, and more accurate drilling results. With increased step-feeding frequency, it is possible to achieve more enhanced chip and heat discharge; however, the total processing time increases consequently. Conversely, the total processing time can be reduced by decreasing the step-feeding frequency, but chip and heat discharge is degraded. Thus, it is necessary to determine the optimal drilling conditions based on reliable experimental results to improve the productivity in the micro drilling processes.[1,3,4,5]
In this paper, the thrust forces in 200μm micro deep hole drilling processes are minimized. The number of steps per one drilling, the feeding speed, and the spindle rpm are used as process parameters to determine the optimum drilling conditions. For this purpose, experimental works are carried out based on DOE (Design of Experiments), and the obtained experimental data are analyzed using ANOVA (Analysis of variance).[6,7]
2. Application of Design of Experiment
DOE (Design of Experiments) provides a powerful means to achieve breakthrough improvements in product quality and process efficiency. From the viewpoint of manufacturing fields, this can reduce the number of required experiments when taking into account the numerous factors affecting experimental results. DOE can show how to carry out the fewest number of experiments while maintaining the most important information. The most important process of the DOE is determining the independent variable values at which a limited number of experiments will be conducted. For this purpose, Taguchi [7] proposed an improved DOE. This approach adopts the fundamental idea of DOE, but simplifies and standardizes the factorial and fractional factorial designs so that the conducted experiments can produce more consistent results. The major contribution of the work has been in developing and using a special set of orthogonal arrays for designing experiments. Orthogonal arrays are a set of tables of numbers, each of which can be used to lay out experiments for a number of experimental situations. The DOE technique based on this approach makes use of these arrays to design experiments. Through the orthogonal arrays, it is possible to carry out fewer fractional factorial experiments than full factorial experiments. Also, the relative influence of factors and interactions on the variation of results can be identified. Through fractional experiments, optimal conditions can be determined by analyzing the S/N ratio (Signal-to-Noise ratio) as a performance measure, often referred to as ANOVA (Analysis of Variance). The details of this approach are presented in the following subsections [7].
2.1. Orthogonal Arrays
When optimizing process conditions to obtain higher quality products, it is necessary to carry out several steps. First, factors or conditions have to be selected, which predominantly affect the process results. These selected factors are divided into several levels, and all combinations are usually taken into account. In this case, the number of all possible combinations corresponds to the number of needed experiments. Here, orthogonal arrays make it possible to carry out fractional factorial experiments in order to avoid numerous experimental works as well as to provide shortcuts for optimizing factors. The orthogonal arrays are determined by the number of factors and levels considered in the process. They are usually described in the form LA(BC), where A denotes the number of fractional experiments, B is the number of levels, and C is the number of factors. The number 2 or 3 is usually selected for the levels.
2.2. Degree of Freedom in DOE
Degree of freedom (DOF) is a common term used in engineering and science. However, there is no visible interpretation of DOF applied to experimental data. Regarding statistical analysis of experimental data, DOF provides an indication of the amount of information contained in a data set. In DOE processes, DOF is applied to characterize four separate items as follows:
- (1)
- DOF of a factor = number of levels of the factor – 1
- (2)
- DOF of a column = number of levels of the column – 1
- (3)
- DOF of an array = total of all column DOFs for the array
- (4)
- DOF of an experiment = total number of results of all trials – 1
DOF is the minimal number of comparisons between levels of factors or interactions in order to improve process characteristics. The type of orthogonal array used in DOE can be selected by the DOF. When determining factors and levels, the orthogonal array has to be selected. In this case, the DOF is taken into account as a reference for selecting a certain type of orthogonal array. Determining the number of factors and levels, a suitable orthogonal array can be selected by the total DOF of the experiment, because the total DOF of factors and levels used in an orthogonal array is already determined [7].
2.3. Analysis of Variance
ANOVA (Analysis of Variance) is a statistical technique that identifies factors significantly affecting the experimental results. ANOVA consists of (1) summing squares for distributions of all characteristic values (experimental data); (2) unbiased variance; (3) decomposing this total sum into the sums of squares for all factors used in the experiment; (4) calculating unbiased variances through the sums of squares for all factors over their DOF; (5) calculating the variance ratio F0 by dividing each unbiased variance by the error variance; and (6) searching which factors significantly affect experimental results by analyzing the error variance. This procedure can be accomplished by constructing an ANOVA table. An example of an ANOVA is described as follows. Taking into account a factor A whose number of levels is l and m repetitions for each level, Table 1 can be obtained.
If the total deviation of each datum xij and the total average x̿ is decomposed into 2, the following equation is obtained.
Squaring this equation and summing l , m data, the following equation is given.
Here, the left side of Equation (2) is the total sum of squares ST, the first term of the right side is SSB (Sum of Squares Between) SA, corresponding to variations due to differences between each level effect or to the variances of factors, and the second term of the right side is SSW (Sum of Squares Within) SE, corresponding to the sum of squares within each level. This relationship can be expressed by ST = SA + SE and simple expressions of these terms are given as follows.
Here,
and T is the total sum of data. Dividing the sum of squares of factors obtained in Equation (3) by their DOF, the outcome corresponds to the mean squares or variances. This can be expressed by the following equations.
where Vij is the mean square or a variance, Si is the sum of squares of an arbitrary factor, and ϕi is its DOF. The variance and an error variance can be described as follows.
3. Experimental Works
3.1. Micro Drilling System
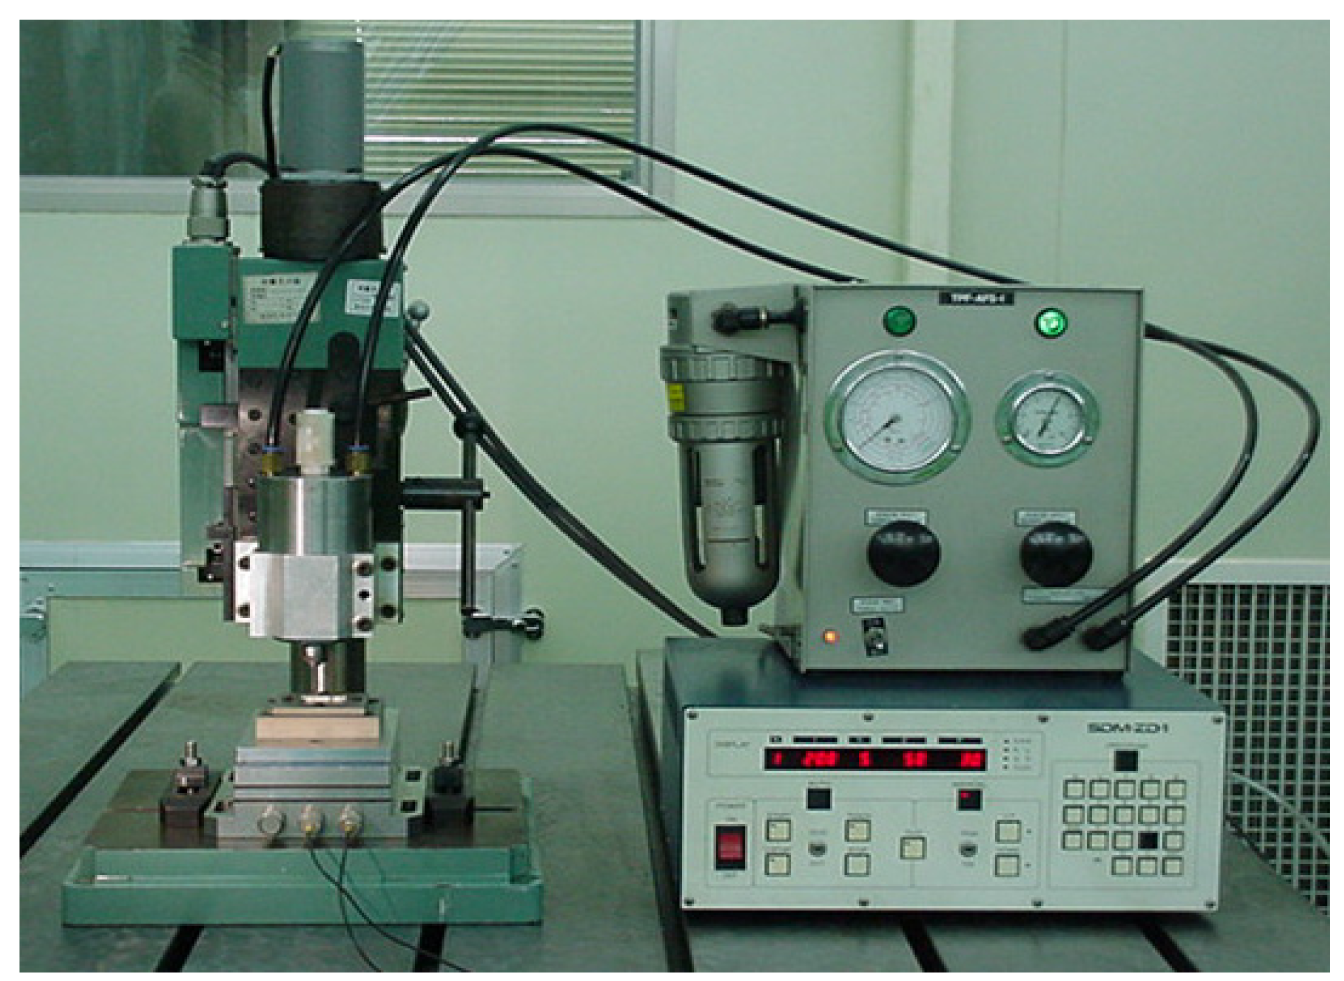
In the experimental studies, a micro drilling system employing a high speed air spindle is used. The drilling process is divided into a certain number of steps and the drill is fed into the workpiece and retracted repetitively. This allows avoiding micro drill fracture problems and providing enhanced chip and heat discharge. Figure 2 illustrates the configuration of the experimental system used in this study, and the specifications of the micro drilling system are provided in Table 2. In order to monitor the states of the workpieces and the drilling processes in real time, as well as to measure the drilling thrusts, a microscope with a built-in monitoring system and a measuring instrument for cutting force are established, respectively. The specifications of these systems are given in Table 3.
3.2. Experimental Conditions
In the experiments, SM45C specimens are used as workpieces. In order to fix the workpieces and dynamometer onto the micro drilling system, a fixture system is installed. The 200μm micro drill used for the experiment is shown in Figure 3.
4. 200μm Micro Drilling Process Optimization Based on DOE
When the step-feeding frequency is increased in order to reduce drilling force, the micro drill can easily be broken due to work-hardening. Furthermore, by reducing the drilling feedrate, the efficiency of the drilling process is deteriorated while increasing the drilling spindle speed leads to expansion of the size of the machined hole, because drill vibration becomes significant. In order to resolve these problems, the optimal drilling conditions are determined by using a DOE for the micro drilling process with SM45C workpieces and 200μm diameter drills. For this purpose, a L27(313) orthogonal array is used, and it is attempted to distinguish the predominant factors for drilling thrust. The same depth for all drillings is taken into account. Part of the orthogonal array and drilling thrusts as experimental results are shown in Table 4.
For the analysis of data acquired through DOE, Taguchi method is applied for gathering required data by using an orthogonal array and investigating the S/N ratio (Signal-to-Noise ratio) derived from these data. In the approaches, characteristics of loss functions are usually classified into “Smaller the Better Characteristics”, “Larger the Better Characteristics” and “Nominal the Best Characteristics”. In these experiments, “Smaller the Better Characteristics” are taken into account in order to determine drilling conditions for producing minimal drilling thrust. Taking into account the interactions of A*B and A*C, the factors are assigned and the experiments are carried out.
Table 5 shows the S/N ratio responses. For factor A, Table 5 shows the calculated average values of the S/N ratio responses when the levels of feedrate are 1, 2, and 3. Similarly, Table 6 and Table 7 show A*B and A*C interaction matrices, respectively. On the basis of the experimental results, the S/N ratio responses are calculated as shown in Figure 4. Based on these responses, the average values of the thrusts are arranged according to the levels of all factors, and the sums and average values of characteristic dispersions resulting from the level variance of the factors are described in Table 8.
Through the results presented in Table 8, the sequence of factors affecting drilling thrust corresponds to feedrate, step, and spindle rpm. In particular, it is noted that the feedrate is an important factor for drilling thrust. Table 9 shows the pooled analysis results.
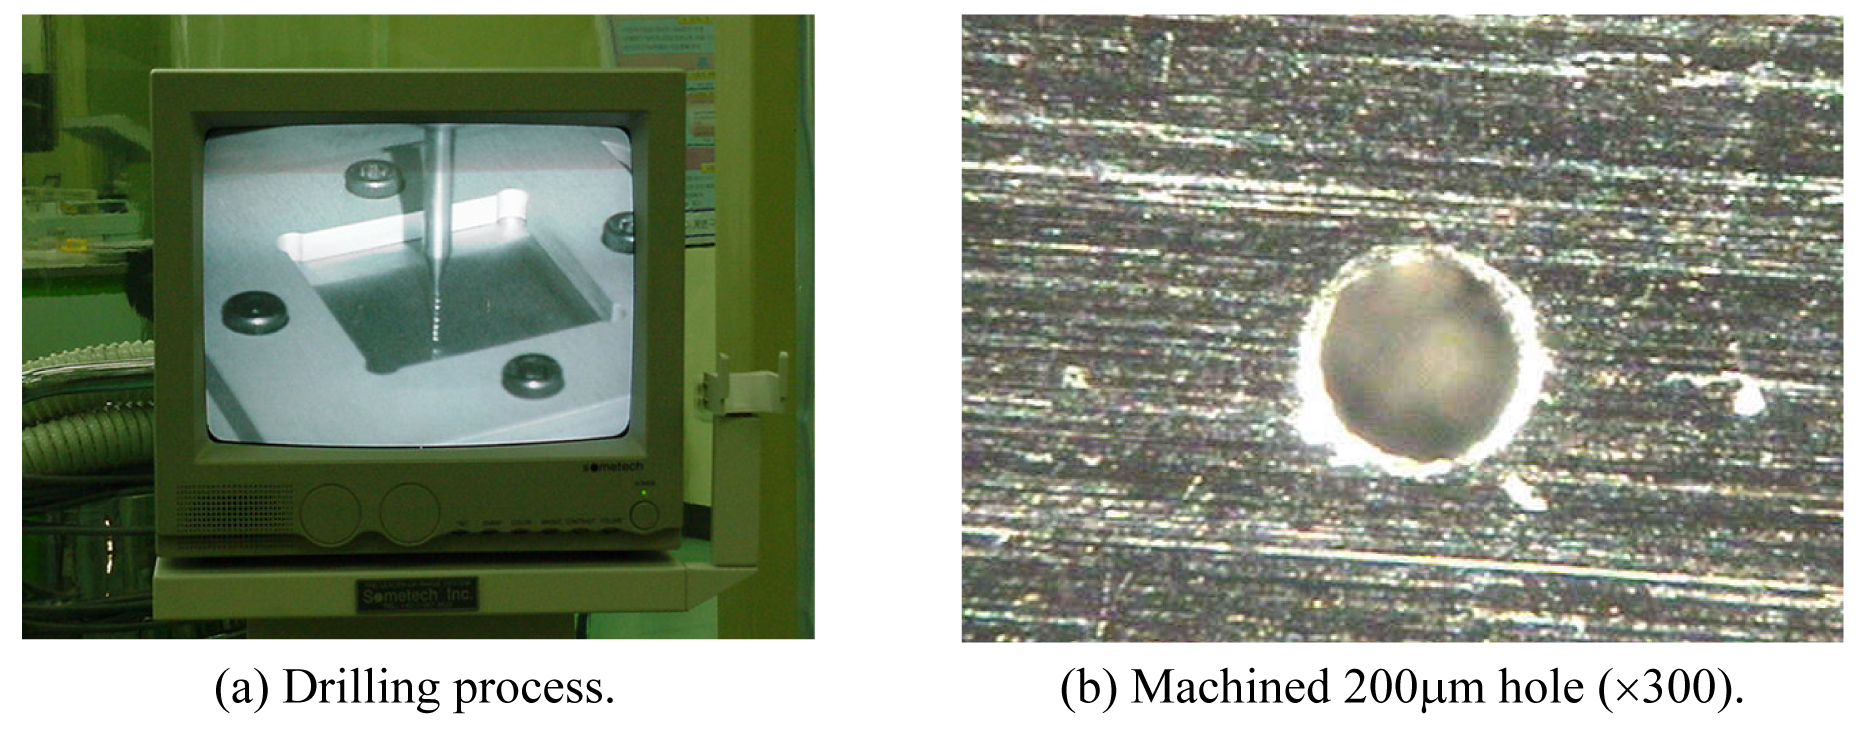
The process of ignoring a factor if it is deemed insignificant, called pooling, is done by combining the measure of influence of the factor with that of the error term. Finally, on the bases of the S/N ratio graphs and ANOVA, it can be declared that A1, B3, and C3 correspond to the factors producing minimal drilling thrusts and there are no interactions between A*B and A*C. Figure 9 shows the actual micro drilling process and a 200μm hole drilled based on the applied methods.
The process of ignoring a factor if it is deemed insignificant, called pooling, is done by combining the measure of influence of the factor with that of the error term. Finally, on the bases of the S/N ratio graphs and ANOVA, it can be declared that A1, B3, and C3 correspond to the factors producing minimal drilling thrusts and there are no interactions between A*B and A*C. Figure 9 shows the actual micro drilling process and a 200μm hole drilled based on the applied methods.
5. Conclusions
The objective of this study is to ascertain factors predominantly affecting drilling thrust in micro deep hole drilling processes. For this purpose, DOE (Design of Experiments) technique and ANOVA (Analysis of Variances) are used. Through this study, as presented in this paper, the conclusions can be summarized as follows:
- (1)
- In the 200micro drilling process, the experimental works designed by a L27(313) orthogonal array are carried out and ANOVA is also conducted. Through these works, it is possible to recognize that the sequence of the most influential factors for drilling thrust corresponds to feedrate, step-feed, and spindle rpm. In particular, it can be concluded that the feedrate is the most influential factor for drilling thrust.
- (2)
- Through the S/N ratio graphs and ANOVA, it can be observed that A1, B3, and C3 correspond to the factors producing minimal drilling thrust; there are no interactions between A*B and A*C. Thus, the optimal conditions are A1, B3, and C3.
In this study, only the drilling thrust is taken into account as the most significant factor in order to optimize the step-feed micro drilling processes. It is possible, however, to consider other factors such as drill life, roughness, circularity of drilled holes, drilling time, burrs, etc. The selection of these factors depends on the main objectives of the required processes. The influence of interactions among the factors will be studied and discussed in our next study.
References
- Cheong, M.S.; Cho, D.W.; Ehmann, K.F. Silicon Micromachining Technology and Industrial MEMS Applications. International Journal of Machine Tools and Manufacture 1999, 39, 1539–1561. [Google Scholar]
- Egashira, K.; Mizutani, K. Micro-Drilling of Monocrystalline Silicon using a Cutting Tool. Journal of the International Societies for Precision Engineering and Nanotechnology 2002, 26, 263–268. [Google Scholar]
- Higuchi, T.; Bang, Y.B.; Motegi, Y.; Tsuda, M. Automation of Centered Micro Hole Drilling using a Magnetically Levitated Table. International Journal of Machine Tools and Manufacture 1999, 39, 409–1426. [Google Scholar]
- Chyan, H.C.; Ehmann, K.F. Development of Curved Helical Micro-Drilling Point Technology for Micro-Hole Drilling. Mechatronics 1998, 8, 337–358. [Google Scholar]
- Zhaojun, Y.; Wei, L.; Yanhong, C.; Lijiang, W. Study for Increasing Micro-Drill Reliability by Vibrating Drilling. Reliability Engineering and System Safety 1998, 61, 229–233. [Google Scholar]
- Du, Z.C.; Yang, J.G.; Yao, Z.Q.; Xue, B.Y. Modeling Approach of Regression Orthogonal Experiment Design for the Thermal Error Compensation of a CNC Turning Center. Journal of Materials Processing Technology 2002, 129, 619–623. [Google Scholar]
- Roy, R.K. Design of experiments using the Taguchi Approach. In Wiley-Interscience Publication; 2001; John Wiley & Sons, Inc. [Google Scholar]
- Heo, S.J. Micro Cutting of Tungsten Carbides with SEM Direct Observation. KSME International Journal 2004, 18, 770–779. [Google Scholar]
- Tosun, N. The Effect of the Cutting Parameters on Performance of WEDM. KSME International Journal 2003, 17, 816–824. [Google Scholar]
Figure 1.
Diagram of step feeding micro drilling method.
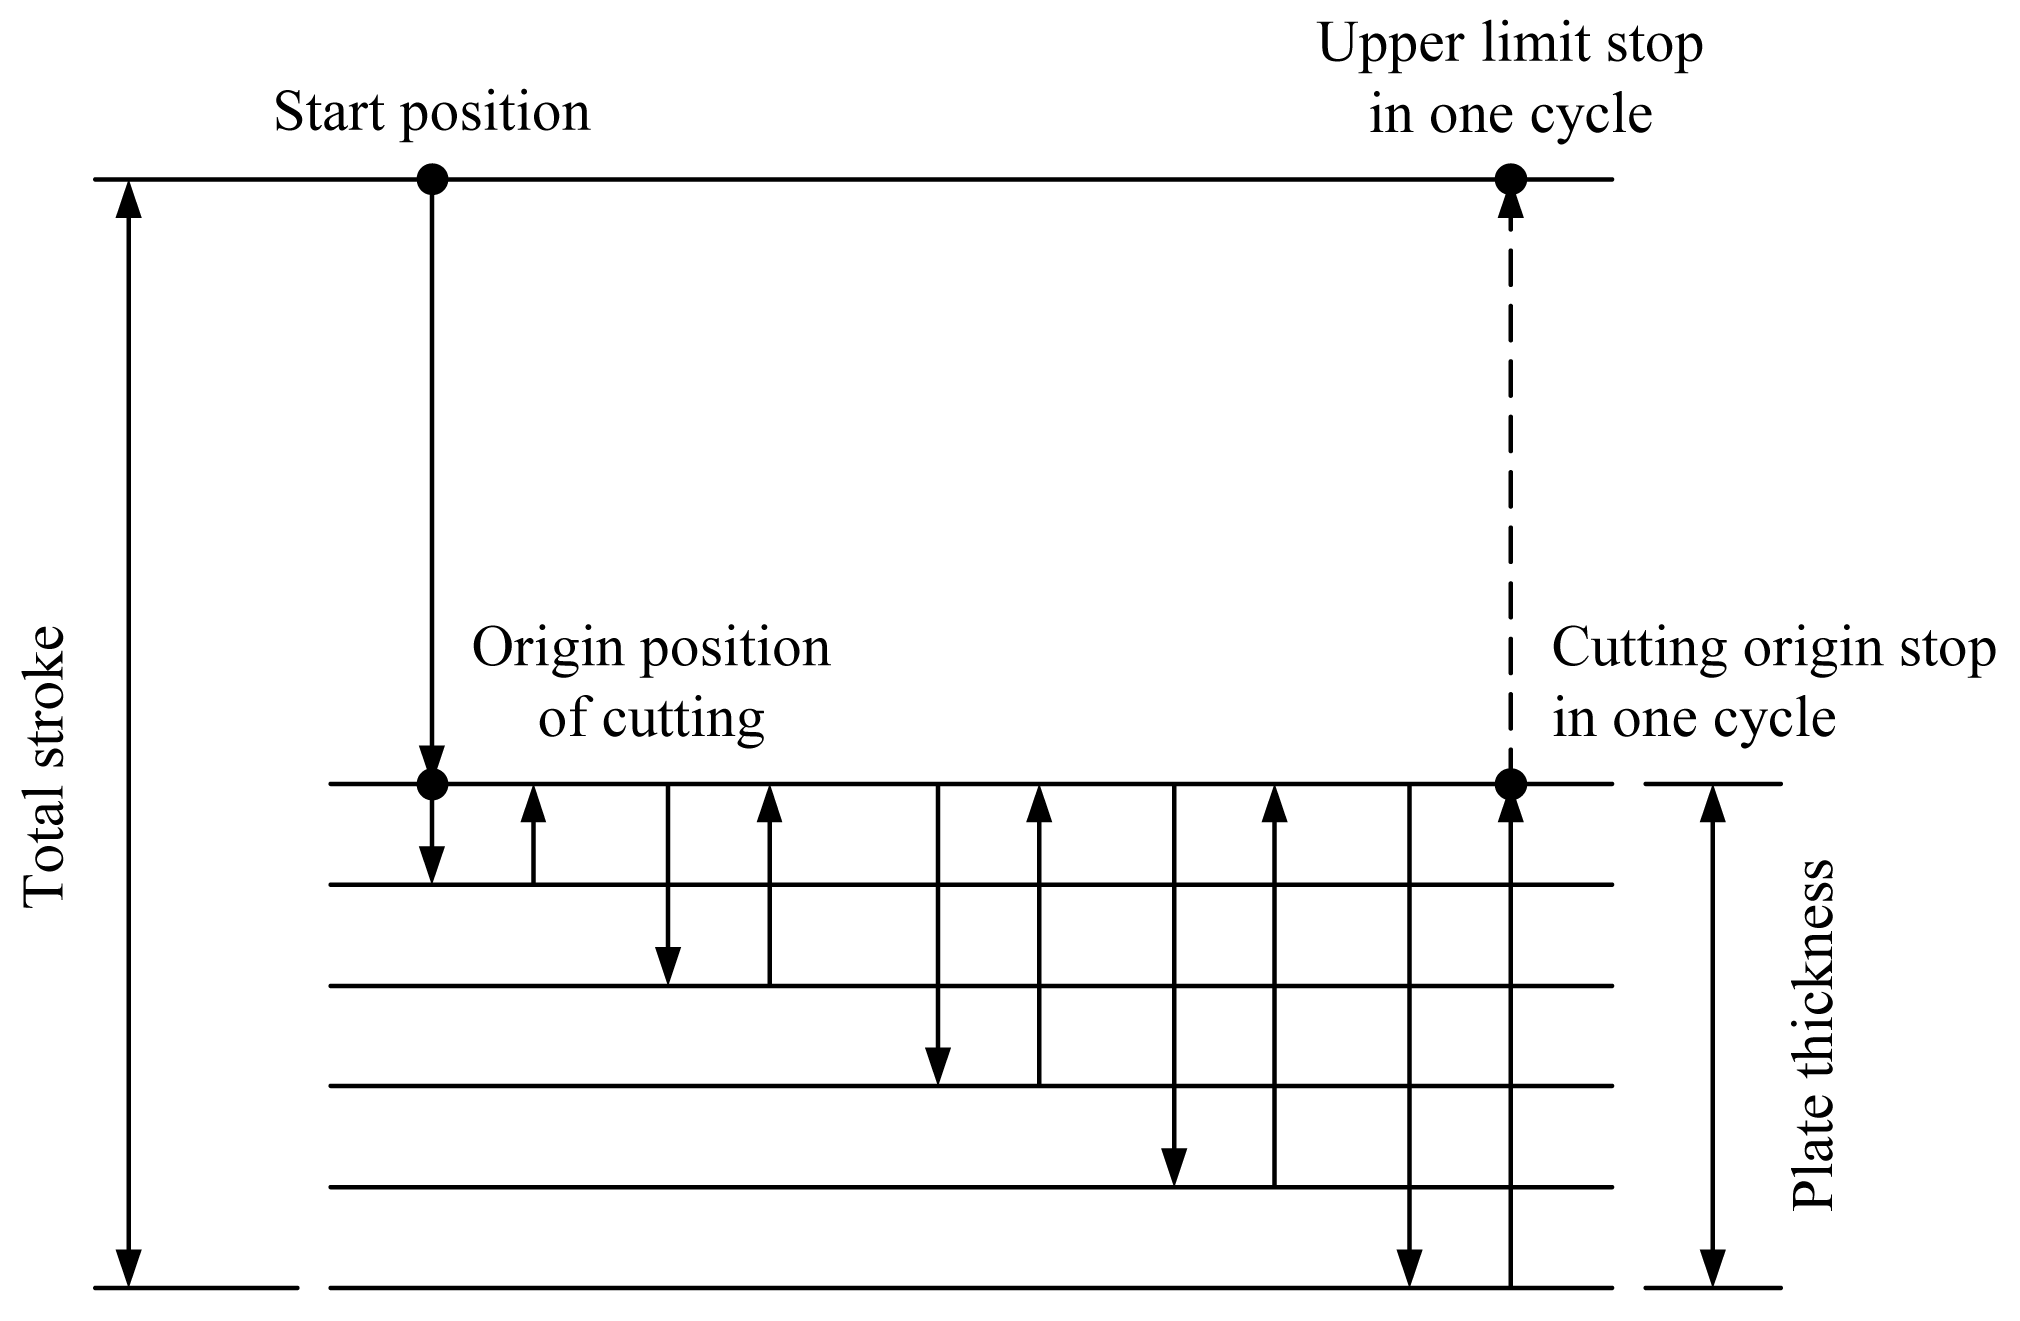
Figure 2.
Experimental setup for micro drilling.

Figure 3.
Employed 200μm micro drill.

Figure 4.
S/N Ratio response graph.
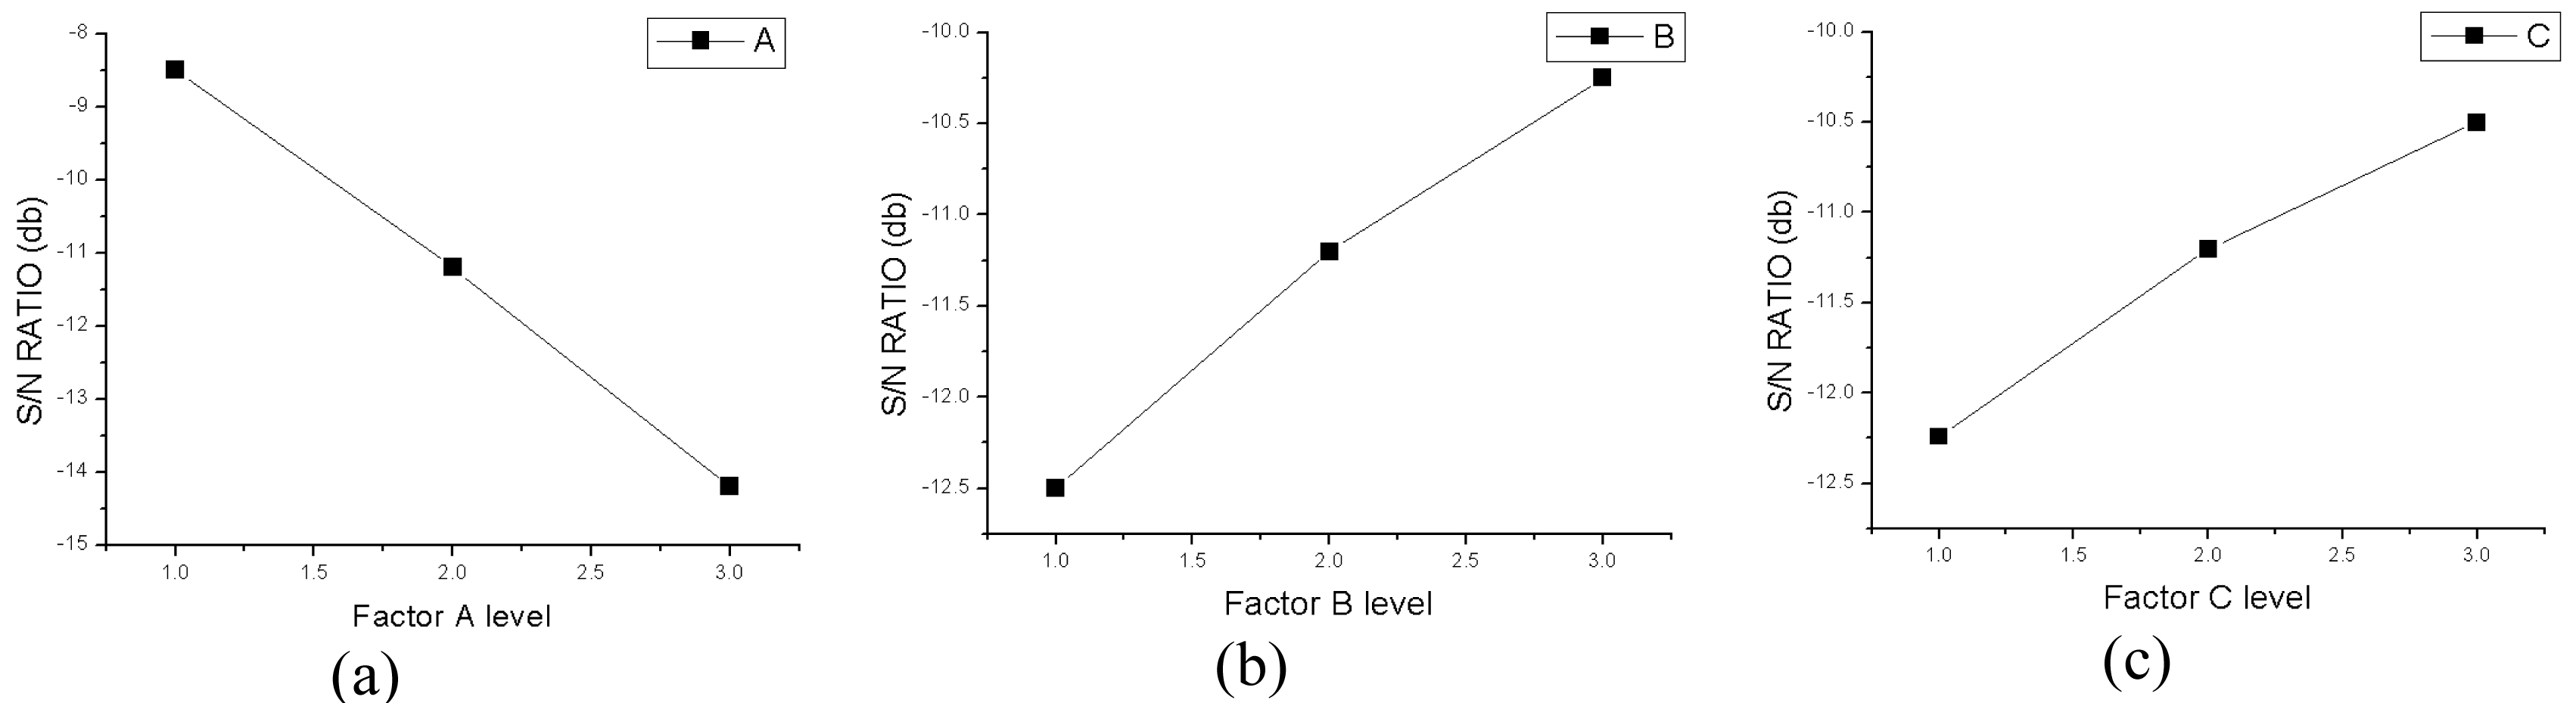
Figure 8.
Interaction graph.
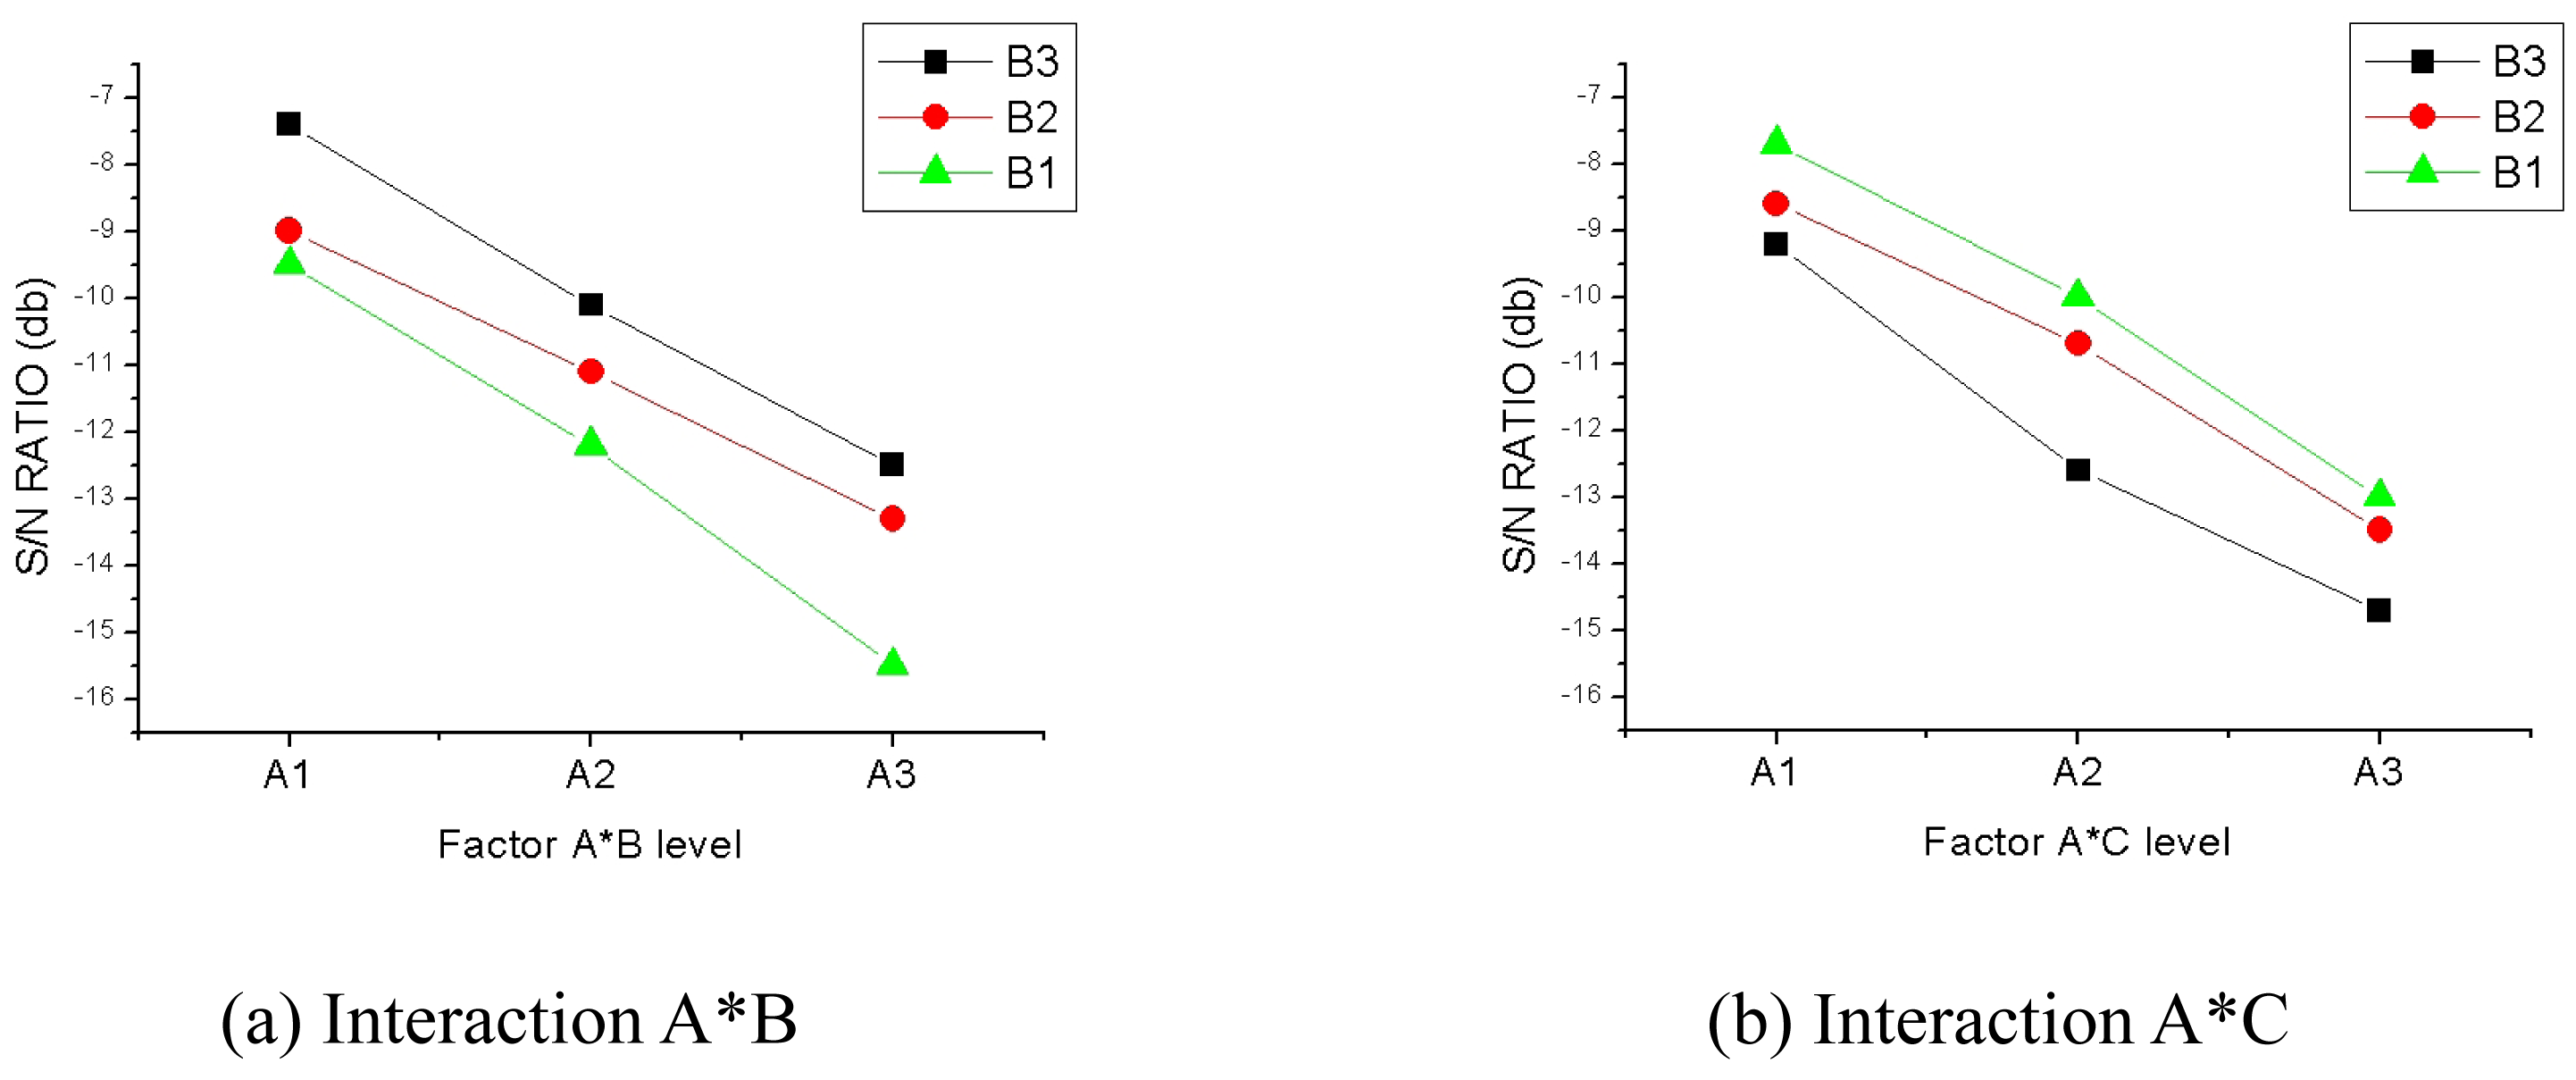
Figure 9.
Machined result of micro step drilling.

| Level of factor A | |||||
|---|---|---|---|---|---|
| A1 | A2 | A3 | … | Al | |
| x11 | x21 | x31 | … | x11 | |
| Repeat Of Experiments | x12 | x22 | x32 | … | x12 |
| x13 | x23 | x33 | … | x13 | |
| … | … | … | … | … | |
| x1m | x2m | x3m | … | x14 | |
| Sum of levels | T1 | T2 | T3 | … | T1 |
| Mean of levels | x̅1 | x̅2 | x̅3 | … | x̅l |
| Diameter | Ø 0.1 ∼0.2 mm |
| Revolution | Max. 50,000 rpm |
| Torque | 500 gr-cm |
| Air pressure (Bearing) | 5∼6 kg/cm2 |
| Step feedrate | 0.01 ∼ 99.99 mm |
| Standoff | 30 ∼ 200 mm |
| Size of machine body | 300*350*680 mm |
| Total stroke | 75 mm |
| Weight | 35kg |
| Workpiece | SM45C (35×35×2.3mm) |
| Dynamometer | Kistler Co. (9257A) |
| Amplifier | Kistler Co. (5011B) |
| A/D converter | DAQ Card-Al_16XE-50 |
| Microscope with built-in monitor | Microscope system (Sometech co.) |
| Symbol factor | A feed | B step | A*B1 | A*B | C rpm | A*C | A*C | e | e | e | e | e | e | Response (Thrust) | S/N (db) | ||
|---|---|---|---|---|---|---|---|---|---|---|---|---|---|---|---|---|---|
| Level | 1 | 30 | |||||||||||||||
| 2 | 60 | ||||||||||||||||
| 3 | 90 | ||||||||||||||||
| No | #2 | 1 | 2 | 3 | 4 | 5 | 6 | 7 | 8 | 9 | 1 | 1 | 1 | 1 | 1st | 2nd | |
| 3 | 19 | 1 | 1 | 1 | 1 | 3 | 3 | 3 | 3 | 3 | 3 | 3 | 3 | 3 | 2.8 | 2.9 | -9.10 |
| 6 | 18 | 1 | 2 | 2 | 2 | 3 | 3 | 3 | 1 | 1 | 1 | 2 | 2 | 2 | 2.7 | 2.6 | -8.63 |
| 9 | 8 | 1 | 3 | 3 | 3 | 3 | 3 | 3 | 2 | 2 | 2 | 1 | 1 | 1 | 2.1 | 1.9 | -6.03 |
| 12 | 3 | 2 | 1 | 2 | 3 | 3 | 1 | 2 | 3 | 1 | 2 | 3 | 1 | 2 | 3.7 | 3.3 | -10.90 |
| 15 | 5 | 2 | 2 | 3 | 1 | 3 | 1 | 2 | 1 | 2 | 3 | 2 | 3 | 1 | 3.4 | 3.3 | -10.50 |
| 18 | 12 | 2 | 3 | 1 | 2 | 3 | 1 | 2 | 2 | 3 | 1 | 1 | 2 | 3 | 3.0 | 2.9 | -9.40 |
| 21 | 23 | 3 | 1 | 2 | 2 | 3 | 2 | 1 | 3 | 2 | 1 | 3 | 2 | 1 | 5.1 | 5.2 | -14.24 |
| 24 | 24 | 3 | 2 | 3 | 3 | 3 | 2 | 1 | 1 | 3 | 2 | 2 | 1 | 3 | 4.6 | 4.8 | -13.44 |
| 27 | 9 | 3 | 3 | 1 | 1 | 3 | 2 | 1 | 2 | 1 | 3 | 1 | 3 | 2 | 4.1 | 3.9 | -11.93 |
| db total=-305.86 | |||||||||||||||||
Note:
1A*B means interactions between factor A and factor B
2# means actual experimental order
| Symbol | 1 | 2 | 3 | 4 | 5 | 6 | 7 | 8 | 9 | 10 | 11 | 12 | 13 |
|---|---|---|---|---|---|---|---|---|---|---|---|---|---|
| A | B | A*B | A*B | C | A*C | A*C | e | e | e | e | e | e | |
| Level 1 | -8.62 | -12.53 | -10.96 | -11.31 | -12.28 | -11.17 | -11.18 | -11.56 | -10.88 | -11.22 | -11.25 | -11.34 | -11.28 |
| Level 2 | -11.34 | -11.24 | -12.05 | -11.81 | -11.27 | -11.55 | -11.31 | -11.22 | -11.15 | -11.30 | -11.50 | -11.18 | -11.28 |
| Level 3 | -14.02 | -10.21 | -10.64 | -11.04 | -10.43 | -11.27 | -11.48 | -11.21 | -11.58 | -11.46 | -11.23 | -11.46 | -11.42 |
| Max-Min | 5.40 | 2.32 | 1.41 | 0.77 | 1.85 | 0.38 | 0.30 | 0.35 | 0.70 | 0.24 | 0.27 | 0.28 | 0.14 |
| B1 | B2 | B3 | |
|---|---|---|---|
| A1 | -9.52 | -9.20 | -7.26 |
| A2 | -12.32 | -11.12 | -10.57 |
| A3 | -15.75 | -13.53 | -12.78 |
| C1 | C2 | C3 | |
|---|---|---|---|
| A1 | -9.27 | -8.79 | -7.92 |
| A2 | -12.67 | -11.08 | -10.26 |
| A3 | -14.90 | -13.95 | -13.20 |
| Source | Sum of squares | DOF | Mean square | F0 |
|---|---|---|---|---|
| A | 127.39 | 2 | 63.67 | 12.96 |
| B | 18.72 | 2 | 9.35 | 1.90 |
| C | 11.71 | 2 | 5.86 | 1.19 |
| A*B | -29.05 | 4 | -7.26 | -1.48 |
| A*C | -10.41 | 4 | -2.60 | 0.53 |
| e | 58.96 | 12 | 4.93 | |
| Total | 177.26 | 26 |
| Source | Sum of squares | DOF | Mean square | F0 | F (0.05) |
|---|---|---|---|---|---|
| A | 127.388 | 2 | 63.669 | 65.3 | 3.49 |
| B | 18.7163 | 2 | 9.3518 | 9.58 | 3.49 |
| C | 11.7107 | 2 | 5.855 | 6.00 | 3.49 |
| e | 19.491 | 20 | 0.9745 | ||
| Total | 177.256 | 26 |
© 2008 by MDPI Reproduction is permitted for noncommercial purposes.
Share and Cite
MDPI and ACS Style
Kim, D.-W.; Cho, M.-W.; Seo, T.-i.; Lee, E.-S. Application of Design of Experiment Method for Thrust Force Minimization in Step-feed Micro Drilling. Sensors 2008, 8, 211-221. https://doi.org/10.3390/s8010211
AMA Style
Kim D-W, Cho M-W, Seo T-i, Lee E-S. Application of Design of Experiment Method for Thrust Force Minimization in Step-feed Micro Drilling. Sensors. 2008; 8(1):211-221. https://doi.org/10.3390/s8010211
Chicago/Turabian StyleKim, Dong-Woo, Myeong-Woo Cho, Tae-il Seo, and Eung-Sug Lee. 2008. "Application of Design of Experiment Method for Thrust Force Minimization in Step-feed Micro Drilling" Sensors 8, no. 1: 211-221. https://doi.org/10.3390/s8010211