Article

Spectrometric and Voltammetric Analysis of Urease – Nickel Nanoelectrode as an Electrochemical Sensor

by
Jaromir Hubalek
1,
Jan Hradecky
2,
Vojtech Adam
2,
Olga Krystofova
2,
Dalibor Huska
2,
Michal Masarik
4,
Libuse Trnkova
5,
Ales Horna
6,
Katerina Klosova
1,
Martin Adamek
1,
Josef Zehnalek
2 and
Rene Kizek
1,*
1
Department of Microelectronics, Faculty of Electrical Engineering and Communication, Brno University of Technology, Udolni 53, CZ-602 00 Brno, Czech Republic
2
Department of Chemistry and Biochemistry, Faculty of Agronomy, Mendel University of Agriculture and Forestry, Zemedelska 1, CZ-613 00 Brno, Czech Republic
3
Department of Animal Nutrition and Forage Production, Faculty of Agronomy, Mendel University of Agriculture and Forestry, Zemedelska 1, CZ-613 00 Brno, Czech Republic
4
Department of Pathological Physiology, Faculty of Medicine, Masaryk University, Komenskeho namesti 2, CZ-662 43 Brno, Czech Republic
5
Department of Chemistry, Faculty of Science, Masaryk University, Kotlarska 2, CZ-611 37 Brno, Czech Republic
6
Department of Food Engineering, Faculty of Technology, Tomas Bata University, T.G. Masaryka 275, CZ-762 72 Zlin, Czech Republic
*
Author to whom correspondence should be addressed.
Sensors 2007, 7(7), 1238-1255; https://doi.org/10.3390/s7071238
Submission received: 3 July 2007 / Accepted: 13 July 2007 / Published: 16 July 2007

Abstract

:
Urease is the enzyme catalyzing the hydrolysis of urea into carbon dioxide and ammonia. This enzyme is substrate-specific, which means that the enzyme catalyzes the hydrolysis of urea only. This feature is a basic diagnostic criterion used in the determination of many bacteria species. Most of the methods utilized for detection of urease are based on analysis of its enzyme activity – the hydrolysis of urea. The aim of this work was to detect urease indirectly by spectrometric method and directly by voltammetric methods. As spectrometric method we used is called indophenol assay. The sensitivity of detection itself is not sufficient to analyse the samples without pre-concentration steps. Therefore we utilized adsorptive transfer stripping technique coupled with differential pulse voltammetry to detect urease. The influence of accumulation time, pH of supporting electrolyte and concentration of urease on the enzyme peak height was investigated. Under the optimized experimental conditions (0.2 M acetate buffer pH 4.6 and accumulation time of 120 s) the detection limit of urease evaluated as 3 S/N was 200 ng/ml. The activity of urease enzyme depends on the presence of nickel. Thus the influence of nickel(II) ions on electrochemical response of the enzyme was studied. Based on the results obtained the interaction of nickel(II) ions and urease can be determined using electrochemical methods. Therefore we prepared Ni nanoelectrodes to measure urease. The Ni nanoelectrodes was analysed after the template dissolution by scanning electron microscopy. The results shown vertically aligned Ni nanopillars almost covered the electrode surface, whereas the defect places are minor and insignificant in comparison with total electrode surface. We were able to not only detect urease itself but also to distinguish its native and denatured form.

1. Introduction

Urease, enzyme catalyzing the hydrolysis of urea into carbon dioxide and ammonia, was firstly isolated from Cannavalia enzyformis (Fabacae) in 1926 [1]. Afterward it has been shown that urease (EC 3.5.1.5, amidohydrolases) is abundant enzyme in plants and, moreover, it can be found at numerous of eukaryotic microorganisms and bacteria [2-5]. The highest activity of urease was determined in embryonic plant tissues, first of all, in seeds of Fabaceae and Curcubitaceae species [6-12]. In addition, a highly active isoenzym of urease was found at developing embryos. The activity of this enzyme is very dependent on nickel presence in its active centre [13]. This enzyme is substrate-specific, which means that the enzyme catalyzes the hydrolysis of urea only [14]. This feature is a basic diagnostic criterion used in the determination of many bacteria species, which produce highly active urease. Helicobacter pylori belong to such bacteria species. Many cases of peptic ulcers, gastritis, and duodenitis are caused by H. pylori infection. The presence of urease is therefore used in the diagnosis of Helicobacter species [15-20].
Based on these facts, analytical instruments used to rapid analysis of proteins like urease are needed. Most of the methods utilized for the detection of urease are based on analysis of its enzyme activity – the hydrolysis of urea [21]. However, the direct detection of this protein is difficult. Recently, the papers reported on highly sensitive determination of proteins by means of electrochemical techniques have been published [22-32]. To construct the miniature measurement instruments the developing and suggesting of new materials for electrodes is needed. It has been shown that nano-particles have several unique physicochemical properties [33-41]. The well known and mostly used materials for nano-particles are structures of carbon – fullerenes. Their application on suggesting and constructing of electrochemical sensors is the most advanced. One may expect that the commercial sensors and biosensors based on these nano-particles could be prepared very soon [42-67].
The aim of this work was to detect urease by spectrometric and voltammetric methods and to study the influence of nickel on electrochemical response of the enzyme. Moreover, the specific interaction of the protein with nickel was used in suggesting of simple sensor to detect urease.

2. Experimental

2.1 Chemicals

All analytical reagents of ACS purity were purchased from Sigma Aldrich Chemical Corp. (St. Louis, USA) unless noted otherwise. The working solutions and supporting electrolytes were prepared with ACS water (Sigma Aldrich). Deionised water for the preparation of indophenol assay underwent demineralization by reverse osmosis using the instruments Aqua Osmotic 02 (Aqua Osmotic, Tisnov, Czech Republic) and was subsequently purified using Millipore RG (Millipore Corp., USA, 18 MΏ).

2.2 Enzyme

Urease EC 3.5.1.5 (Jack Beans, type III; 45 000 IU/g) was purchased from Sigma Aldrich (St. Louis, USA). The stock standard solution of urease at 1 mg.ml-1 were prepared with ACS water and stored in the dark at -20 °C. The working standard solutions were prepared daily by dilution of the stock solutions with ACS water and stored in the dark at 4 °C. The basic data about urease: molecular weight 77 536, count of aminoacids 725, their sequence is as follows according to Expasy ( www.expasy.ch), A – Alanine, R – Arginine, N – Asparagine, D – Aspartic Acid, C – Cysteine, E – Glutamic Acid, Q – Glutamine, G – Glycine, H – Histidine, I – Isoleucine, L – Leucine, K – Lysine, M – Methionine, F – Phenylalanine, P – Proline, S – Serine, T – Threonine, W – Tryptophan, Y – Tyrosine, V – Valine.
102030405060
MNHFNRRQVLPAVPHLLNIIQVEATLPNGTKLVTVHDPIANENGDLEEALYGSFLPVPSL
708090100110120
DKFAESKEEHKIPGEIICADGRLTLNPGRKAVFLKVVNHGDRPIQVGSHYHFIEVNPYLT
130140150160170180
FDRRKAYGMRLNIAAGDSVRFEPGDHKTVNLVSIGGNKIIRGGNAIADGPVNEANCKAAM
190200210220230240
EIVCRREFGHKEEEEASEGVTTGDPDCPFTKAIPREEYANKYGPTIGDKIRLGDTDLIAE
250260270280290300
IEKDFALYGDESVFGGGKVIRDGMGQSSGHPPAMSLDTVITSAVIIDYTGIIKADIGIKD
310320330340350360
GLIASIGKAGNPDIMNGVFPNMIIGVNTEVICGEGLIVTAGGIDCHVHYICPQSLDEAIS
370380390400410420
SGITTVVGGGTGPTDGSRATTCTPAPTQMKLMLQSTDDIPLNFGFTGKGSGSHPDELHEI
430440450460470480
IKAGAMGLKLHEDWGCTPAAIDNCLAVAEQHDIQVNIHTDTVNESGFVEHTIAAFNGRTI
490500510520530540
HTYHSEGAGGGHAPDIIKVCSMKNVLPSSTNTTRPLTSNTVDEHLDMLMVCHKLNREIPE
550560570580590600
DLAFASSRVREQTIAAEDILHHIGGISIISSDAQAVGRIGEVISCTWQTADKMKAERGPL
610620630640650660
QPDGSDNDNFRIKRYIAKYTINPAIVNGISQYVGSVEVGKLADLVIWKPSFFGAKPDIVI
670680690700710720
KGGSIAWADMGDPNGSIPTPEPVLMRPMYGTLGKAGSALSIAFVSKAALDLGVKVLYGLN
725
KGWNP

2.3 Electrochemical measurements

Electrochemical measurements were performed with AUTOLAB Analyser (EcoChemie, Netherlands) connected to VA-Stand 663 (Metrohm, Switzerland), using a standard cell with three electrodes. A hanging mercury drop electrode (HMDE) with a drop area of 0.4 mm2 was used as working electrode, an Ag/AgCl/3M KCl electrode as reference ones and a platinum electrode as the auxiliary electrode. For smoothing and baseline correction the software GPES 4.4 supplied by EcoChemie was employed. The solutions analysed were deoxygenated by purging with argon (99.999%) saturated with water for 120 s prior to measurements.

Adsorptive transfer stripping differential pulse voltammetric analysis of urease

Urease was measured by adsorptive transfer stripping technique (AdTS) coupled with differential pulse voltammetry (DPV). Acetate buffer (0.2 M, pH 5.0) was used as supporting electrolyte. AdTS DPV parameters were as follows: an initial potential of −0.9 V, an end potential −0.3 V, a modulation time 0.057 s, a time interval 0.2 s, a step potential of 1.05 mV, a modulation amplitude of 25 mV, Eads = 0 V. All measurements were carried at room temperature.

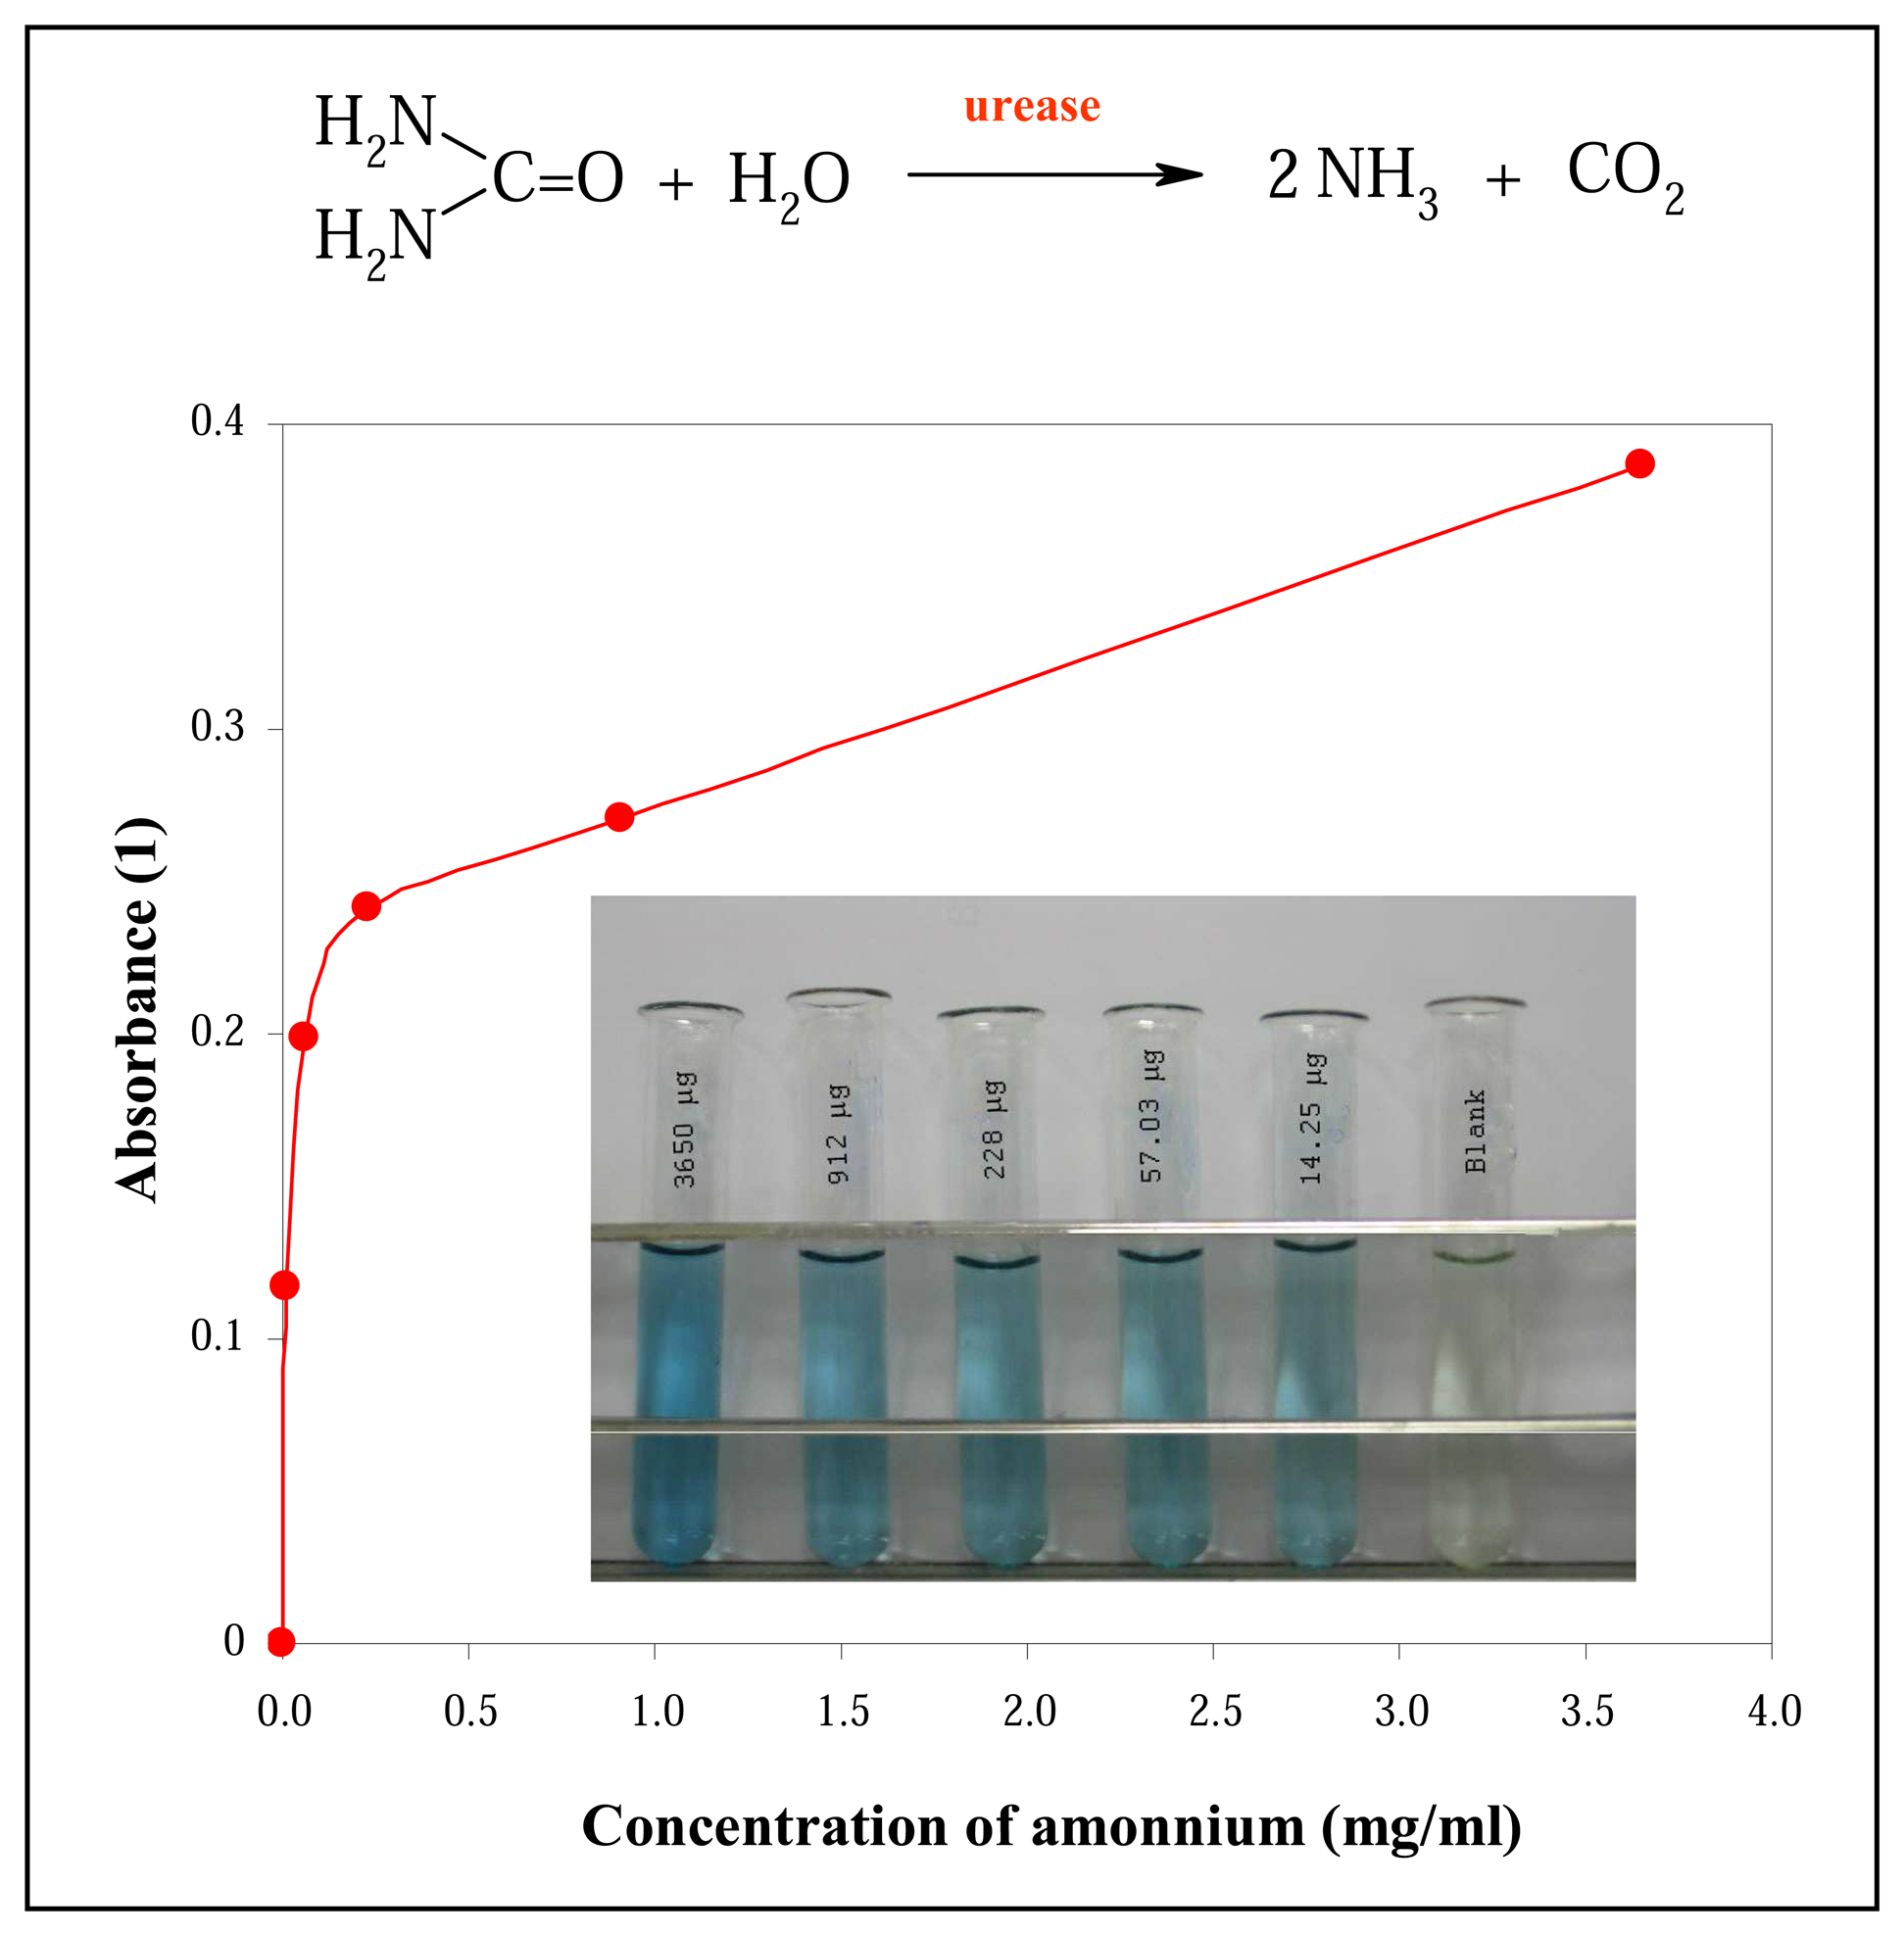
2.4 An indophenol assay for the detection of ammonium – Berthelot method

The reagents were prepared as described in [68]. Briefly, phenolic solution – phenol (7 g) and sodium nitroprusside (disodium pentacyanonitrosylferrate, 34 mg) were dissolved in deionised water (50 ml) and then made up to 100 ml. This reagent was stored in a dark-coloured bottle at 4°C. The buffered hypochloride reagent was prepared by dissolving 2.96 g NaOH in 140 ml of deionised water, adding 22.29 g Na2HPO4·7H2O, and dissolving it completely. Then NaClO (12% v/v, 16.6 ml) solution was added. The pH was adjusted to 12.0 and the deionised water was added to complete the final volume of 200 ml. This reagent was stored in a dark-coloured bottle at room temperature.
Ammonium was measured as follows: NH4Cl (40 μl, 7 μg/ml - 7 mg/ml) was pipetted to glassy test tubes. Further, deionised water (1960 μl), the phenolic solution (200 μl) and the buffered hypochloride reagent (400 μl) were added. The mixture was vortexed for 5 min. using Vortex–2 Genie (Scientific Industries, New York, USA) and stored for 20 min. at 50 °C. The coloured solutions were measured by spectrophotometer (Helios, Thermo Fisher Scientific, USA) at 636 nm as against blank sample, which contains deionised water (2 ml), the phenolic solution (200 μl) and the buffered hypochloride reagent (400 μl). The blank sample was also stored for 20 min. at 50 °C prior to measurements [68].

2.5 pH measurement

The pH value was measured using WTW inoLab Level 3 (MultiLab Pilot; Weilheim, Germany), connected to the personal computer and controlled by program (MultiLab Pilot; Weilheim, Germany). The pH-electrode (SenTix-H, pH 0–14/3M KCl) was regularly calibrated by set of WTW buffers (pH 4.01, 7.00 and 10.00) (Weilheim, Germany).

2.6 Scanning electron microscope

To observe electrode surfaces auto-emissive scanning electron microscope MIRA (Tescan, Brno, Czech Republic) was used. The instrument contains Schottky auto-emissive jet with high current density and three-lens optical system. The detectors used were as follows: SE Detector (secondary electron detector) and BSE Detector (backscatter electron detector). Voltage: 5 kV. The instrument was controlled by PC.

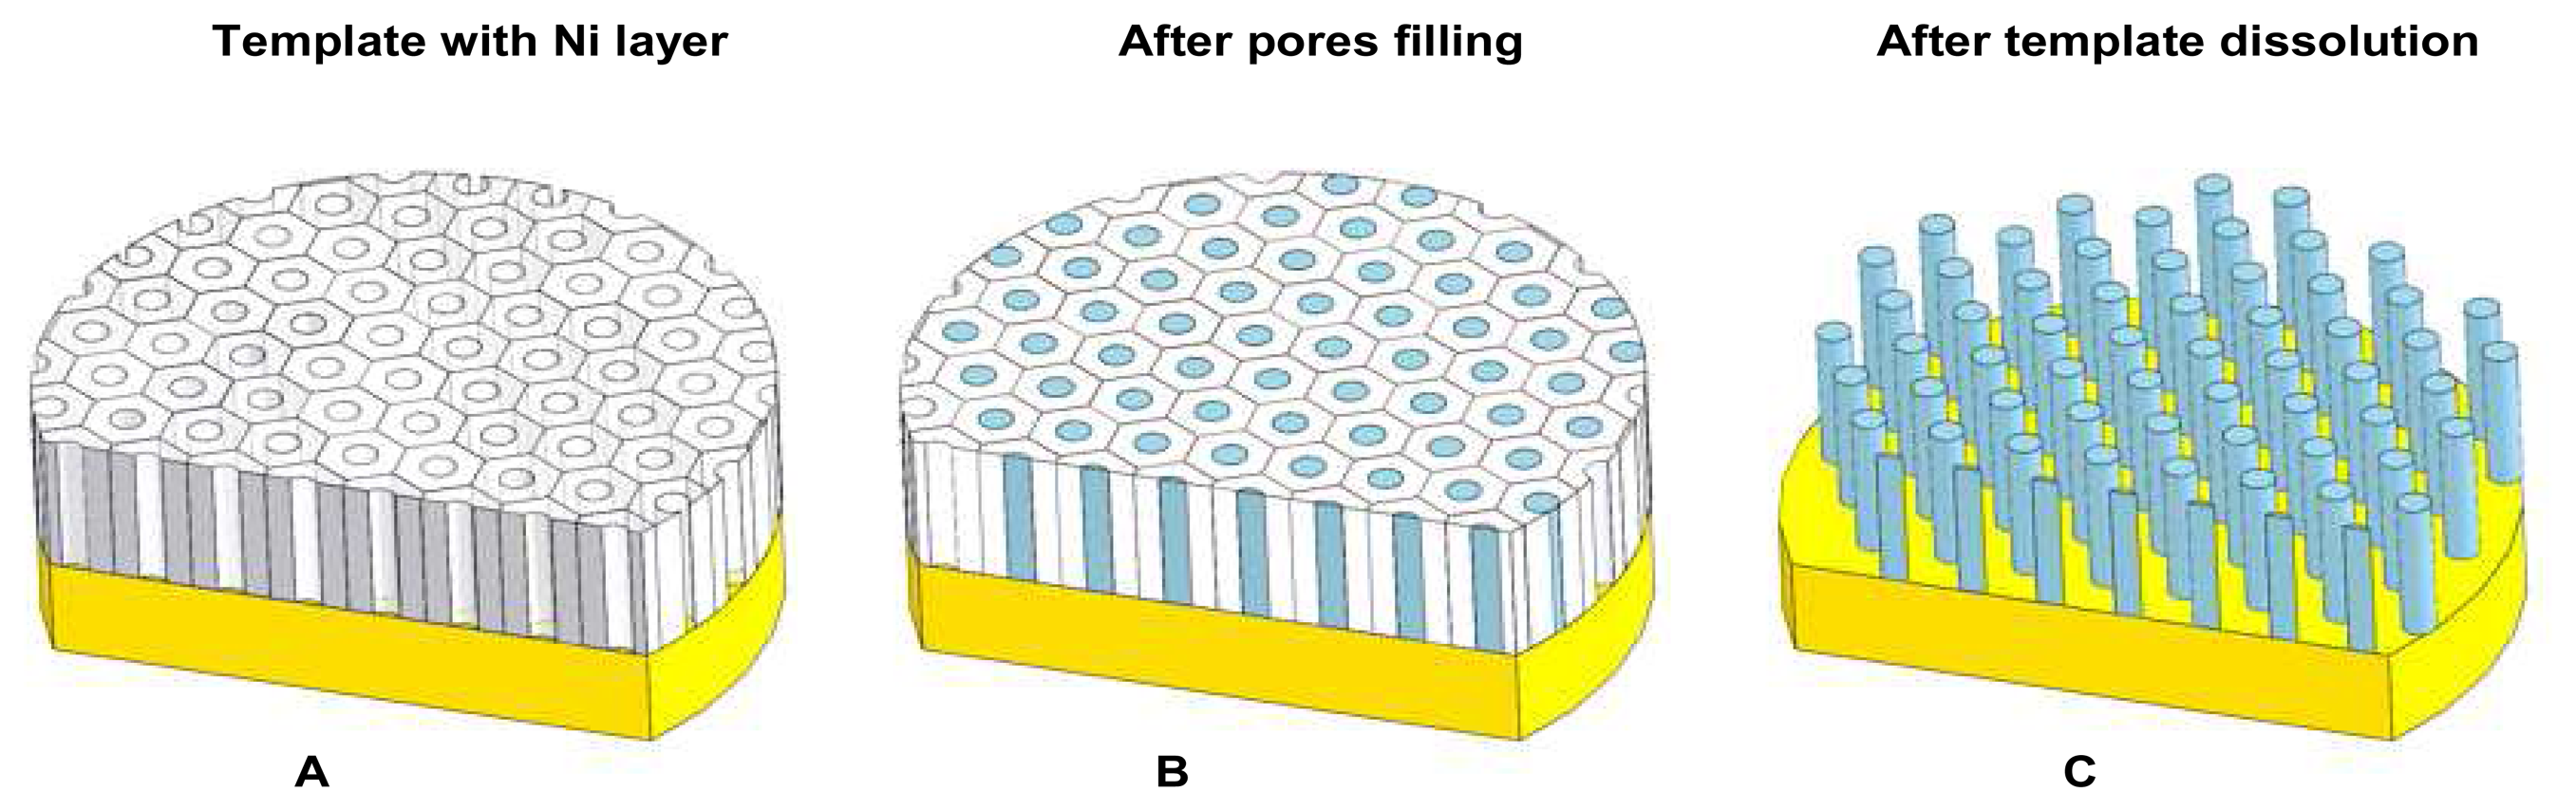
2.7 Ni nanopillars creation

The formation of nanostructures (nanopillars) is based on using an alumina template (Whatman Anodisc with pore diameter 100 nm) with hexagonally arrayed nanopores. One of the template sides is sputtered by metal (Ni) which forms a conductive layer on the surface of the template. An area of the layer, which is not covered by Al2O3 (template, bottoms of the nanopores), represents a cathode in an electroplating cell. During the electroplating process under galvanostatic conditions the selected metal fills the nanopores of the template. After dissolving the template in NaOH or H3PO4 required vertically aligned nanopillars are obtained. The process is shown in Figure 1.
As an electrolyte, Watts Bath (250 g/l NiSO4, 50 g/l NiCl2, 34 g/l H3BO3) was used. The boric acid served as a buffer agent, which adjust the pH close to the cathodic film. The temperature of the solution was 55 °C, the pH was usually ranging between 3 and 3.5. The current density was 15 mA/cm2.

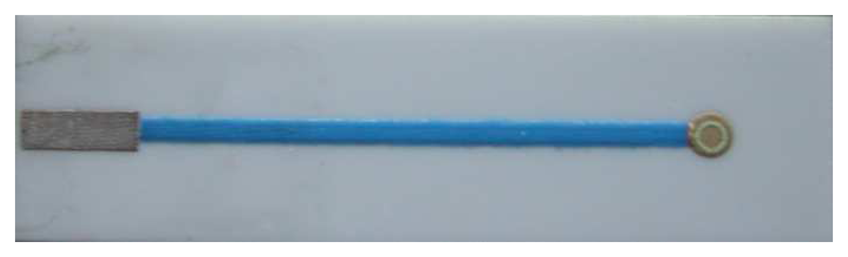
2.8 Ni nanoelectrode preparation for experimental measurements

The template has been adhered to Cu tape with polymer conductive adhesive to avoid damage of the template and to Ni layer with nanopillar (after alumina dissolution) by manipulation during process. The Cu tape has been cut after the template dissolution to prepare small rectangular sheet for the electrode forming. As the Ni electrode carrier the alumina substrate has been used with screen printed conductive via isolated from surrounding and terminated by a gold pad (Figure 2). The Cu sheet with Ni nanopillars has been fixed on the gold pad using Ag epoxy glue (Aremco). Finaly the Cu edges have been isolated grouting by PMMA (polymethyl metacrylate).

3. Results and Discussion

3.1 Spectrophotometric determination of urease activity

Most of the currently used tests aimed on determination of urease activity base in monitoring of the products of enzyme catalyzed hydrolysis of urea into carbon dioxide and ammonia (upper inset in Figure 3), where the formed ammonium interacts with a specific agent forming a coloured product. In the present paper we used the indophenol assay, in which ammonium ions reacts with NaClO and monochloramine is formed. Addition of the phenolic solution to monochloramine results in quinonechlorimine. The imine interacts with the phenol and indophenol occurs. In acidic solution indophenol is of yellow colour, but after alkalization of the solution the blue product is formed – Berthelot reaction [68]. The resulted blue coloured solutions are shown in bottom inset in Figure 3. The intensity of the colouring strongly depends on ammonium ions concentration up to 5 mg/ml, then the intensity enhances more gradually. Nevertheless laborious and time-consuming purification step must precede a utilizing of this method for analysis of real samples. Moreover, the sensitivity of detection itself is not sufficient to analyse the samples without pre-concentration steps. Therefore new methods providing simple, rapid and sensitive analysis of urease are needed. Electrochemical methods used various types of working electrodes could be considered as of these fulfilling the fore-mentioned demands. Moreover, a modification of a surface of the working electrodes by nano-materials brings new limits in their applications [52,69-76].

3.2 Electrochemical study of urease

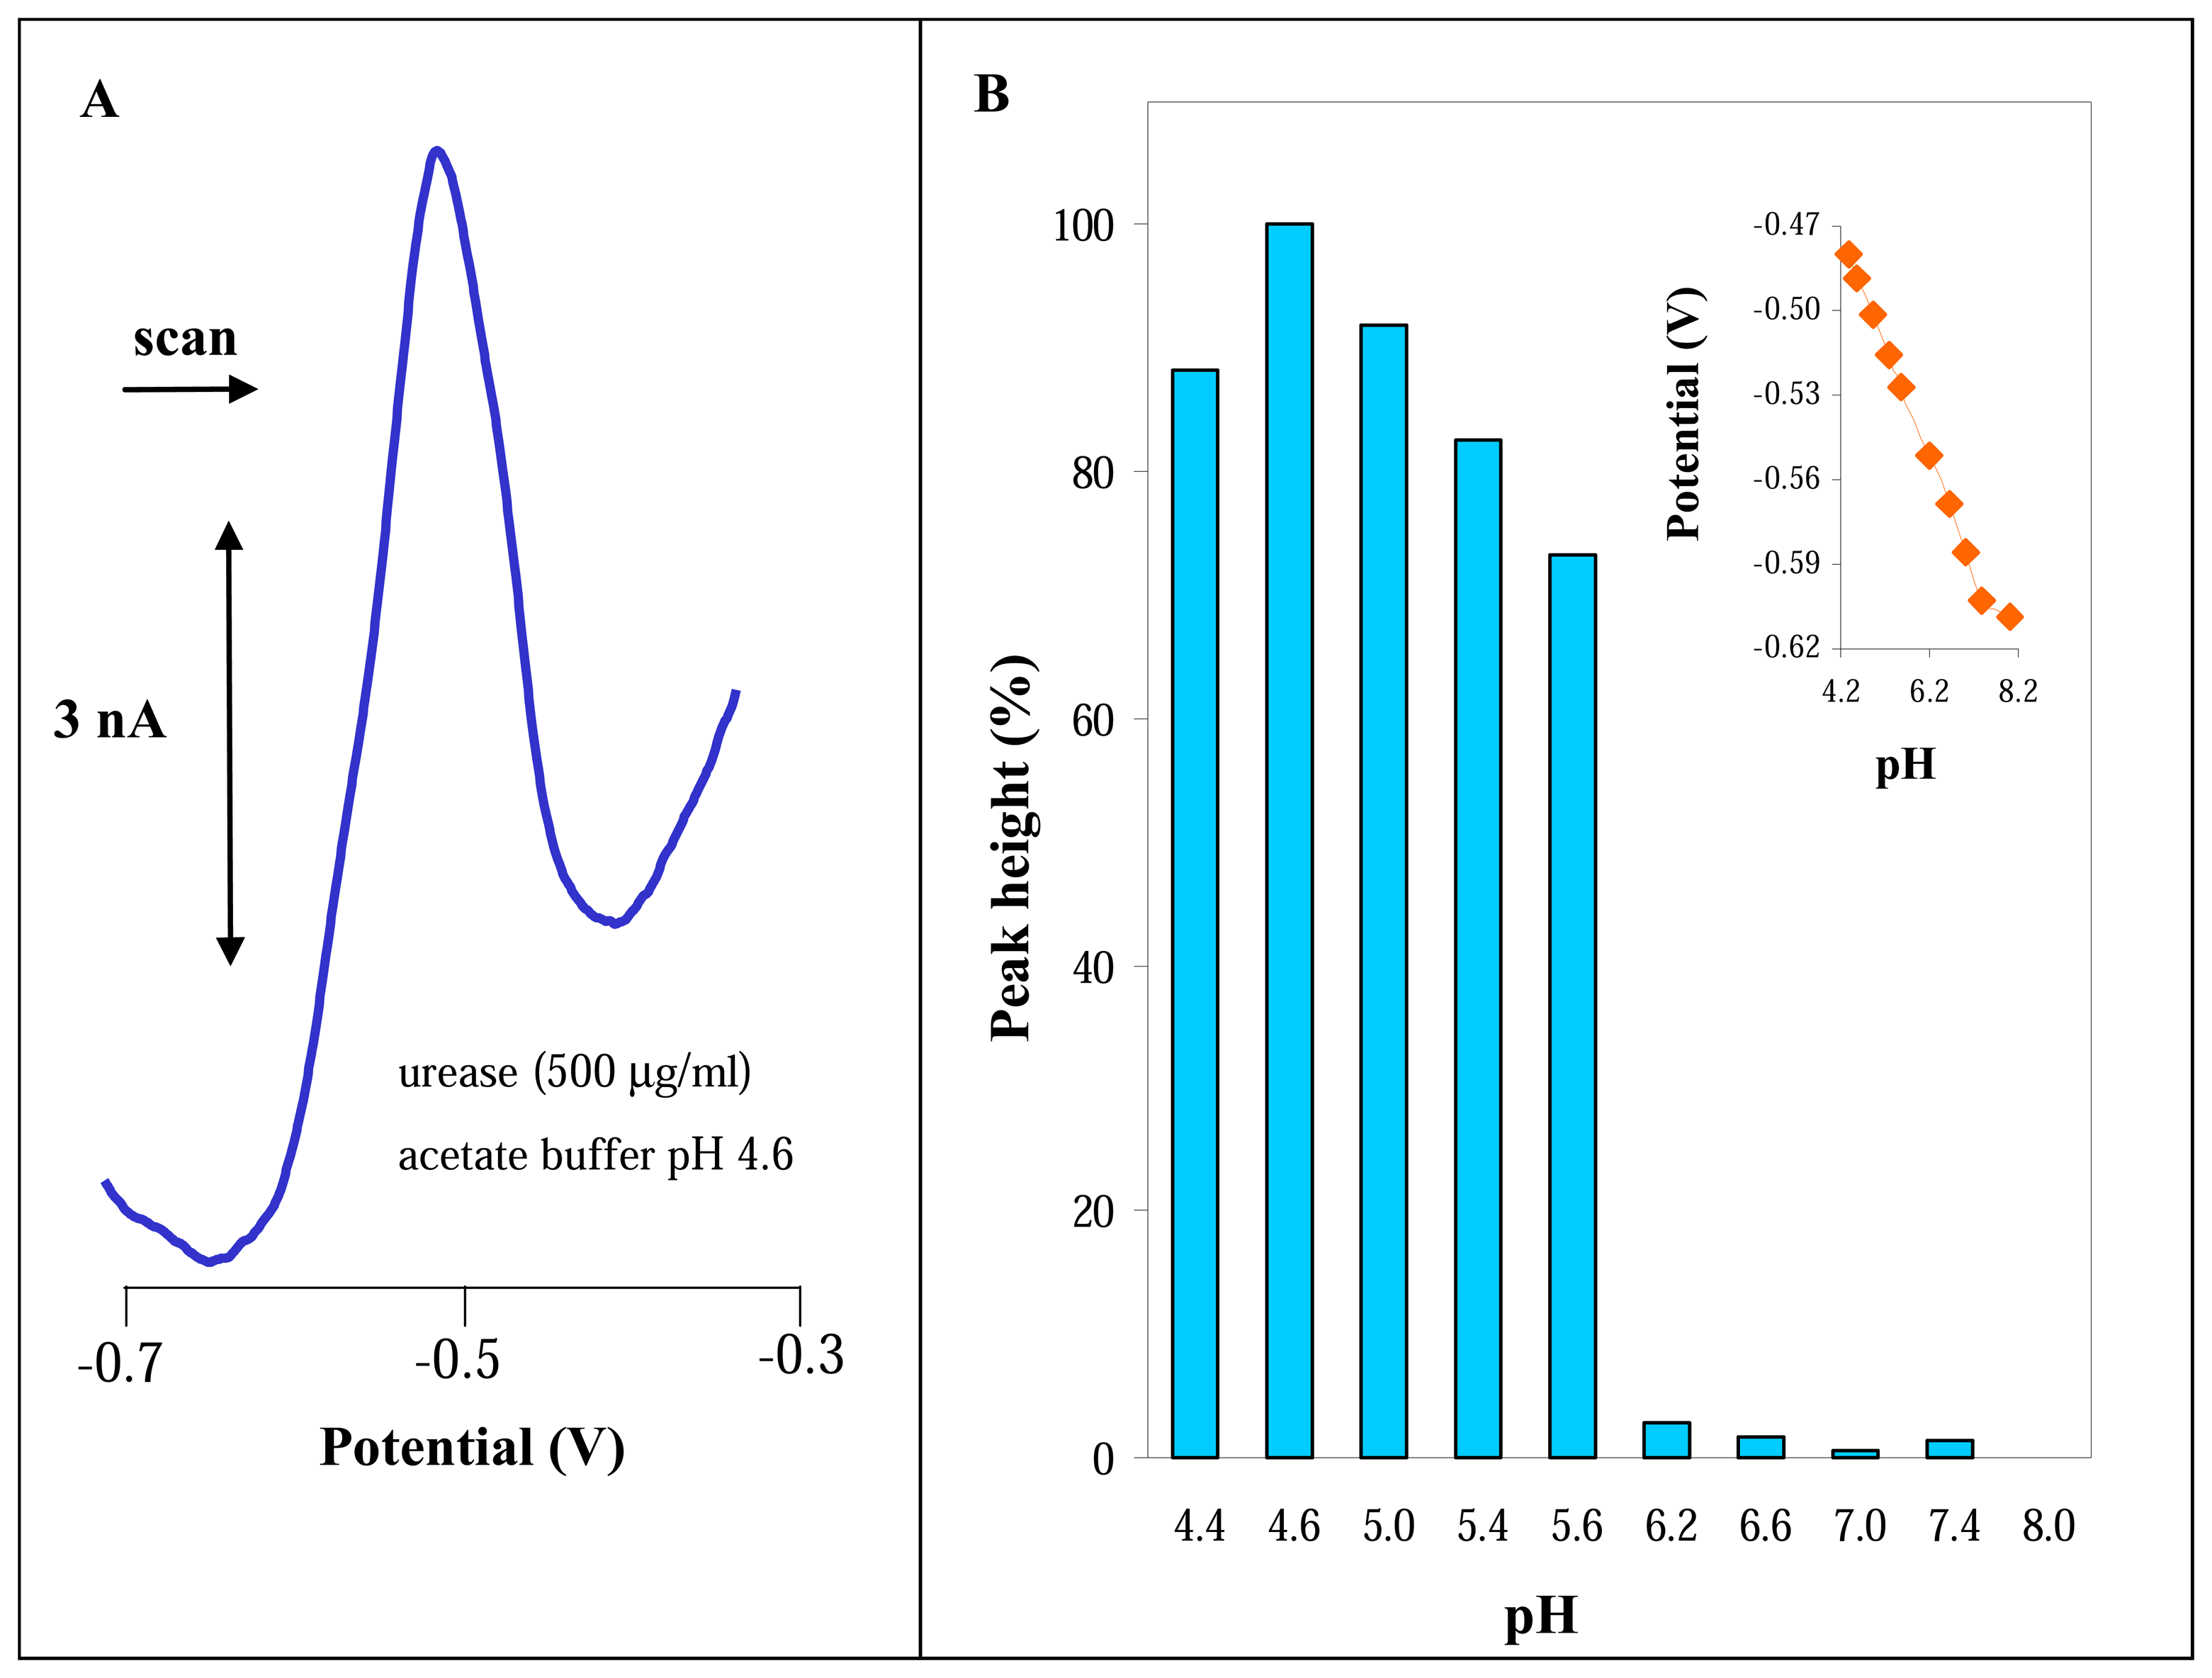
3.2.1 Differential pulse voltammetric analysis of urease

To our knowledge urease has not been electrochemically studied in great details yet. The most experimental papers focus on immobilization of the enzyme on the surface of the working electrode and on detection of changes in the enzyme activity under various conditions, e.g. the presence of a toxic metal [77-80]. Here, we studied urease by means of adsorptive transfer stripping technique coupled with differential pulse voltammetry at surface of hanging mercury drop electrode. The protein was adsorbed on the surface of the working mercury electrode at open circuit; the electrode was washed in deionised water and acetate buffer. The modified electrode was transferred to the supporting electrolyte and measured in differential pulse mode. Other details on modifying of mercury electrodes by peptides and proteins can be found in the references as follows [22,25,81-91].
The basic electrochemical behaviour of urease was studied in the presence of acetate buffer (0.2 M, pH 5). Typical DP voltammogram of urease (500 μg/ml) is shown in Figure 4A. The redox signal observed at −0.55 V was well developed and reproducible. Based on our previously published papers the signal we observed can be associated with binding of the proteins (–SH groups) to mercury [30,31].
To optimize the electroanalytical detection of urease dependence of urease peak height on pH change of acetate buffer (4.4 – 5.6) and phosphate buffer (6.2 – 8.0) was studied. We found that urease gave the highest signal within pH range from 4.4 to 5.4. Under the higher pH the peak of urease markedly decreased and slightly shifted to negative potential of −0.6 V (Figure 4B). One may except that pH change causes alterations of the enzyme structure, whose can result in the varying of the electrochemical response, as it was reported on electrochemical study of protein p53 [92] and lactoferrin [28]. Moreover a type of the supporting electrolyte probably influences the urease redox signal (Figure 4B).

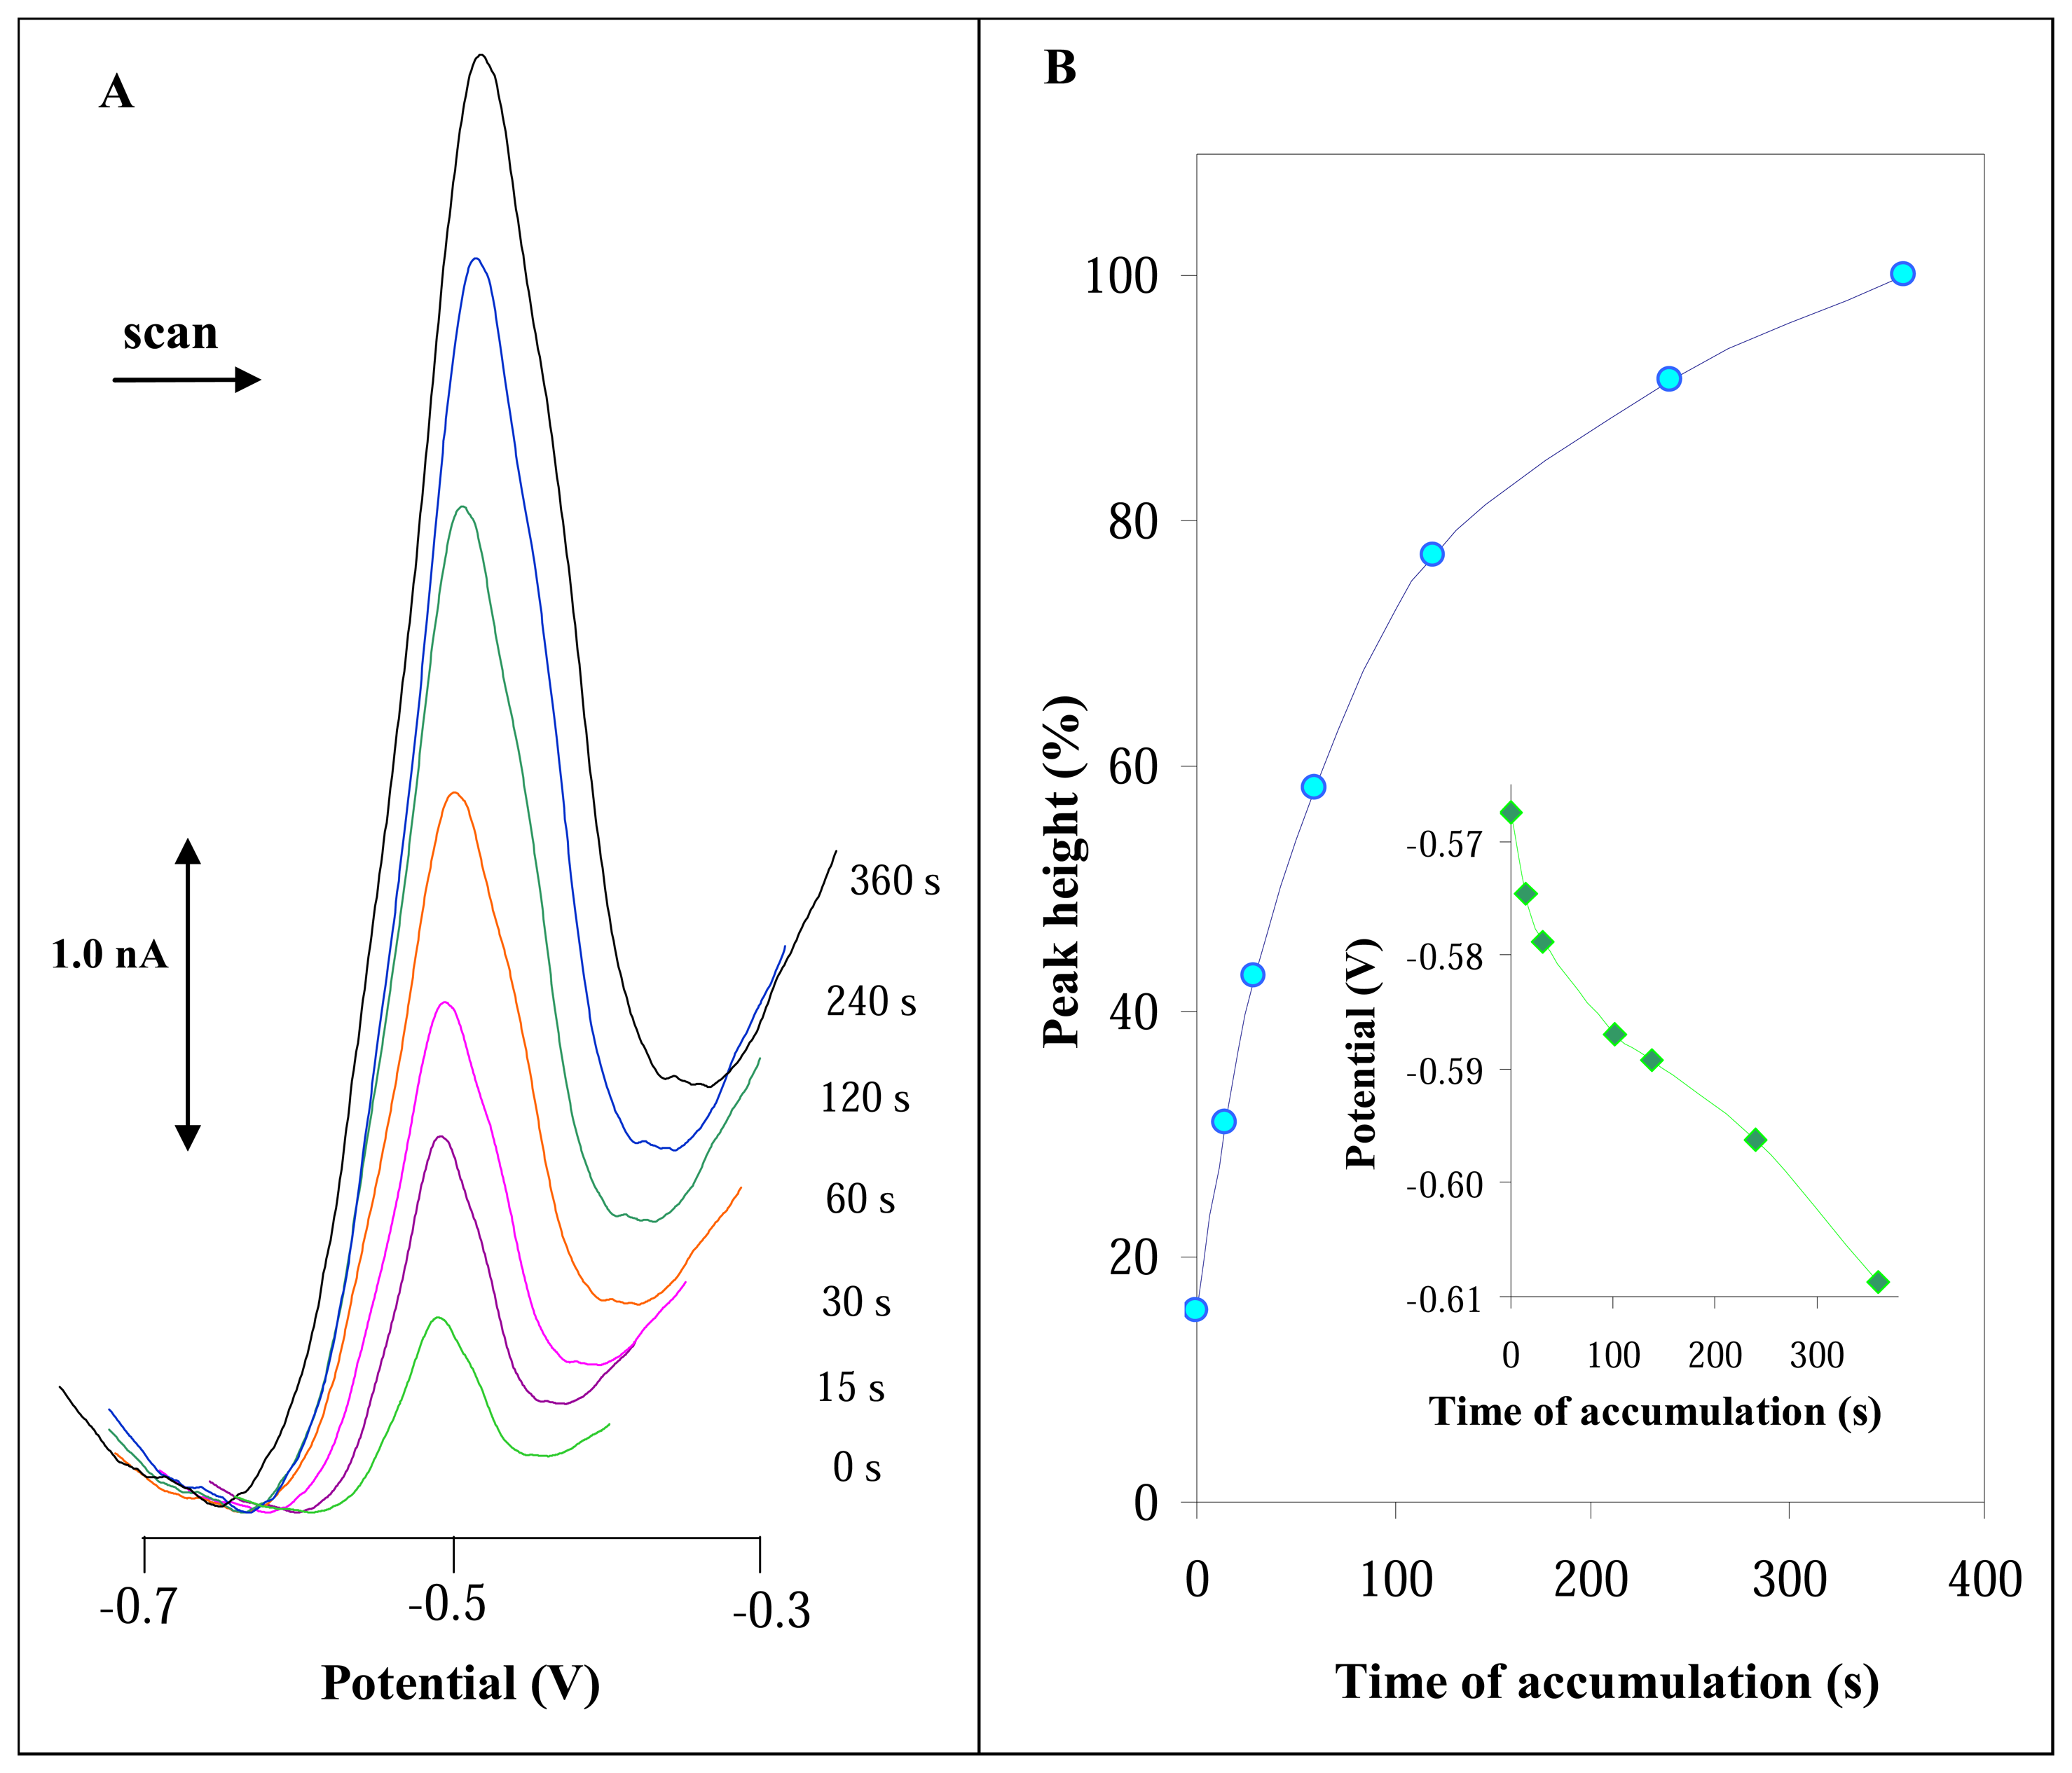
3.2.2 Influence of accumulation time on DPV signal of urease

Proteins interact with a surface of a working electrode, thus, the time of the interaction belongs to the important factors influencing an analysis. The signal enhances with the increasing time interaction proportionally to full coverage of the surface. Then, multilayer of the target protein or other nonspecific interactions can occur, which result in decrease in the signal measured. Thus, we studied the influence of urease peak height on time of accumulation. We obtained well reproducible dependence. The peaks of urease were well developed and enhanced with increasing accumulation time (Figure 5A). The dependence obtained has linear trend to accumulation time of 100 s. At accumulation times higher than 100 s the dependence is more gradual (Figure 5B). The potential of urease peak height shifted to negative ones very slightly (Figure 5B). The observed changes in the urease peak height and potential could be associated with the coverage of the working electrode surface by the protein and other non-specific interactions [30].

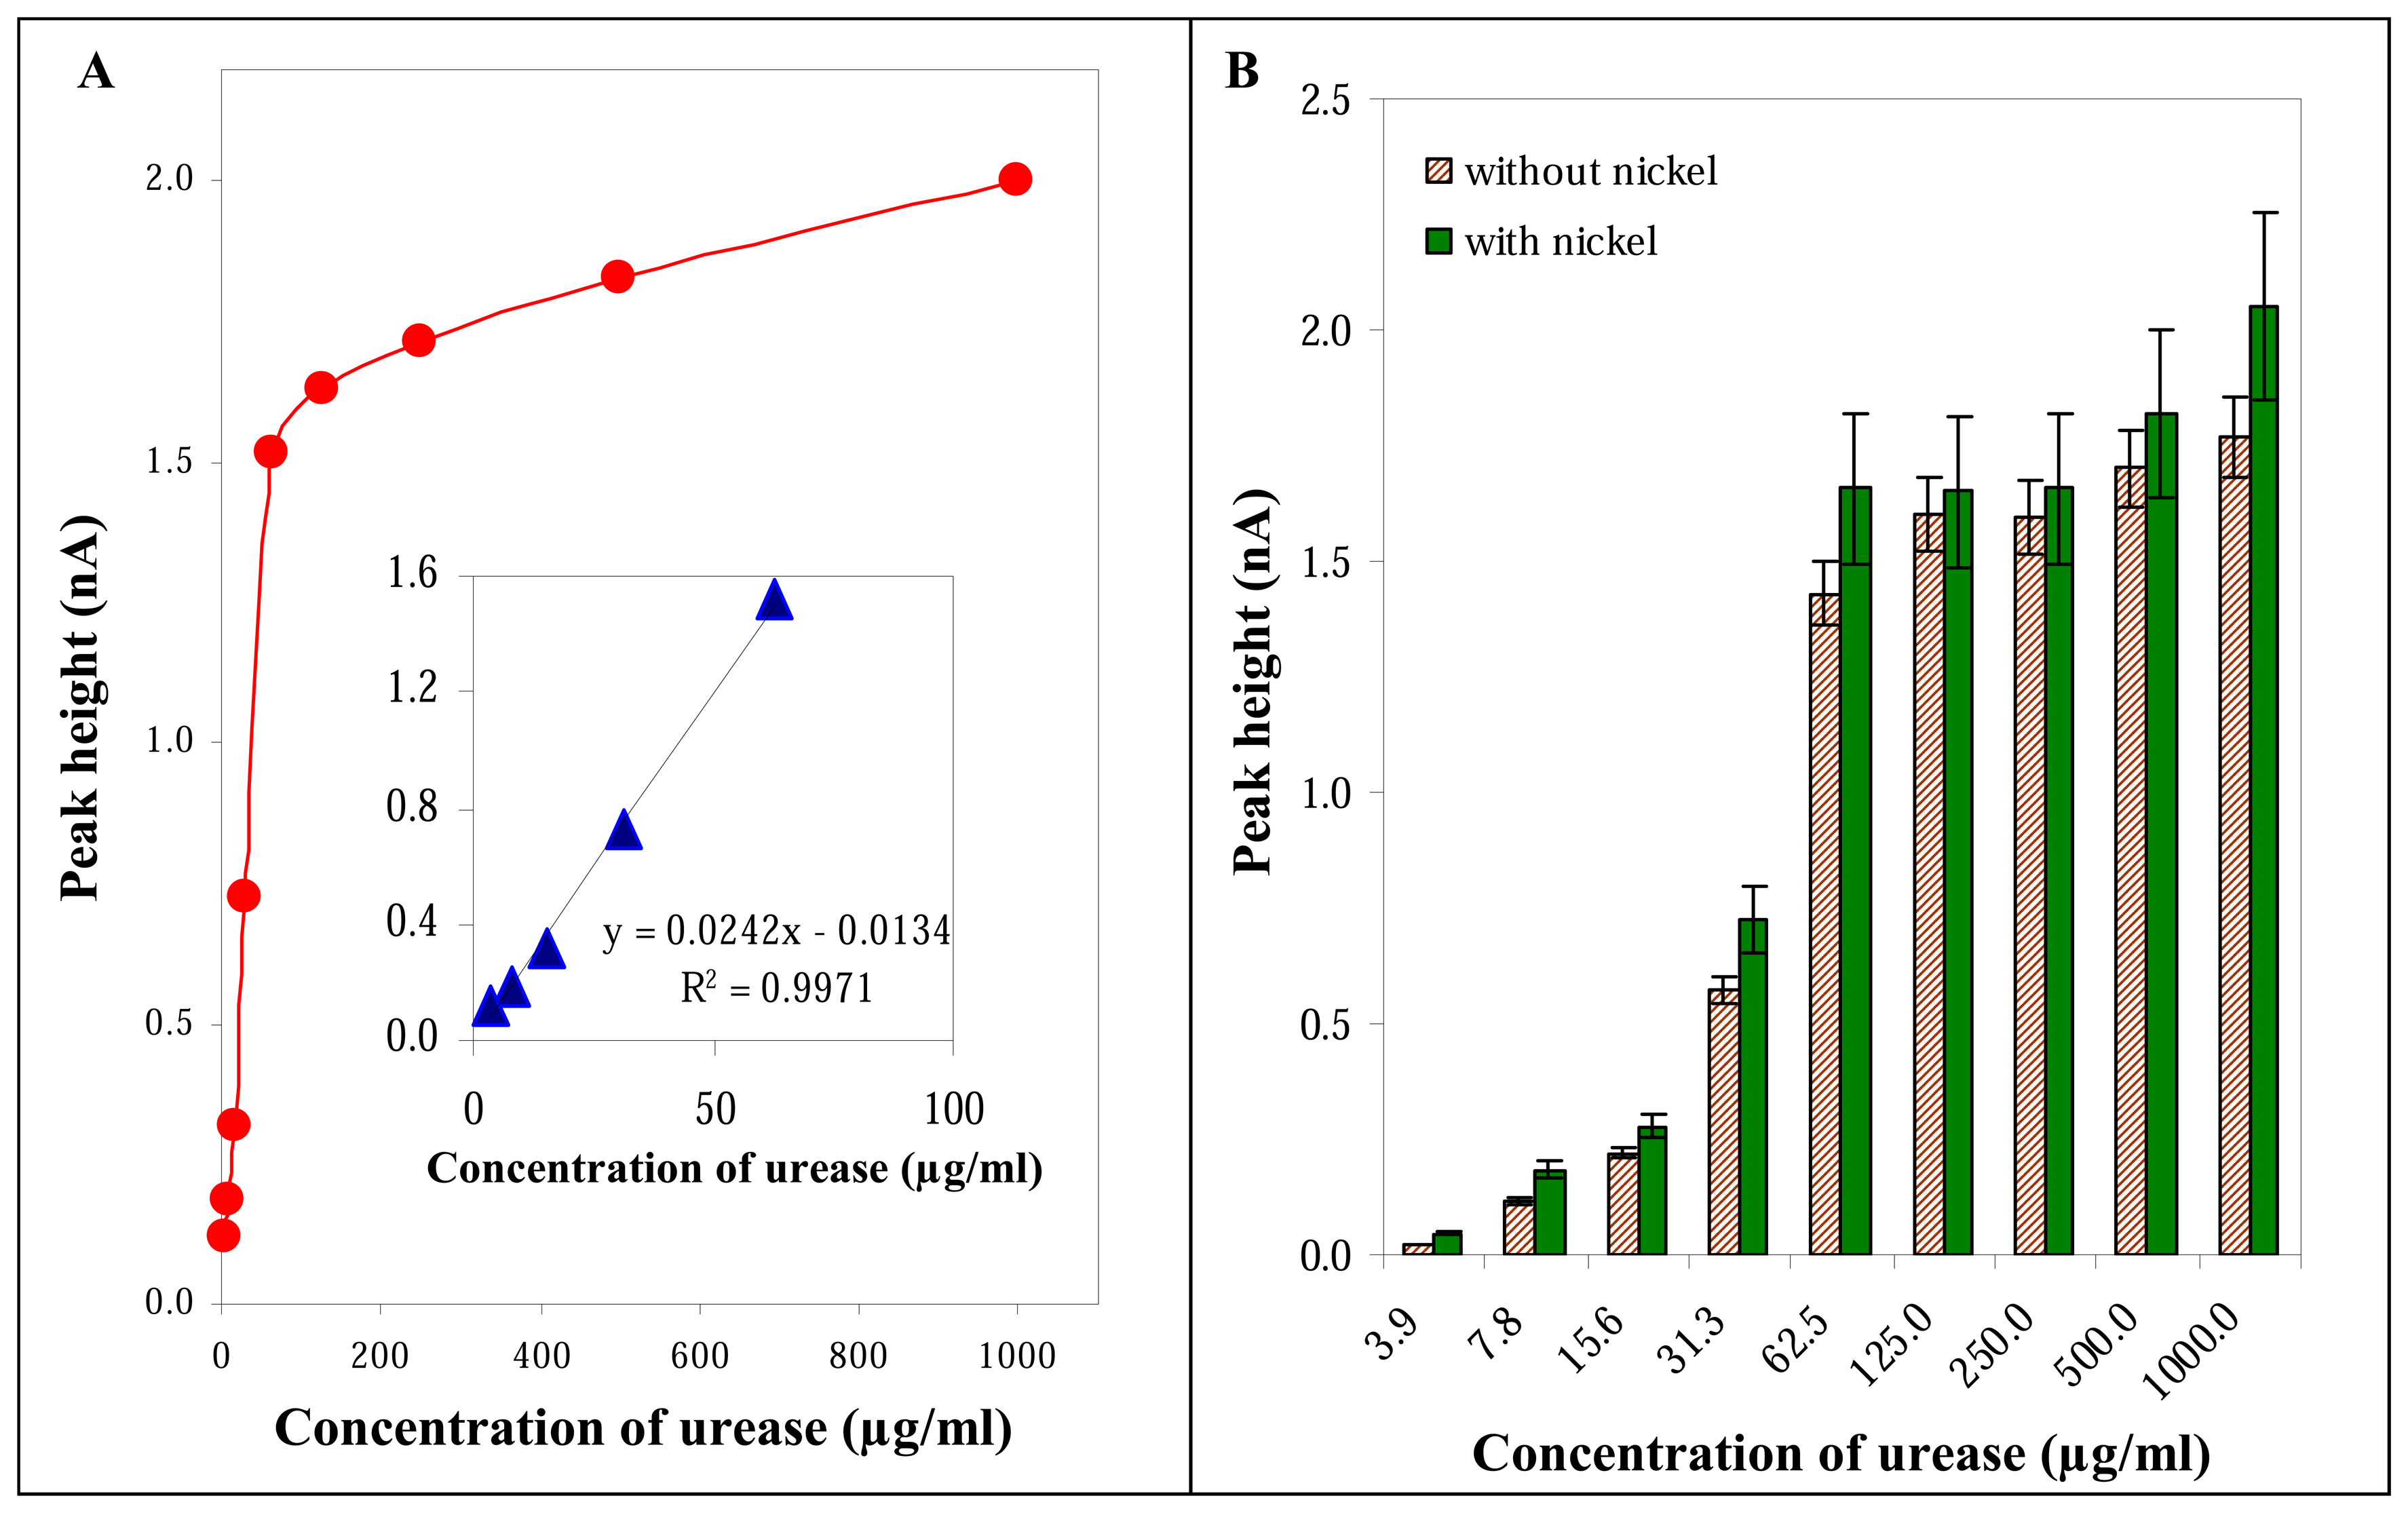
3.2.3 Influence of urease concentration

Further we were interested in the studying of urease peak height changes with increasing concentration of the protein. The higher concentration of the protein was, the higher signals were observed. The dependence obtained was not linear within the whole concentration range tested (Figure 6A). The shape of the dependence probably relates with saturation of the surface of the working electrode and with formation of multilayer coverage of the surface by the protein. However, the dependence was strictly linear within the range from 1 to 60 μg/ml with the equation y = 0.0242× -0.0134, R2 = 0.9971. Under the optimized experimental conditions (0.2 M acetate buffer pH 4.6 and accumulation time of 120 s) the detection limit of urease evaluated as 3 S/N was 200 ng/ml with relative standard deviation below 5 %.

3.3 Influence of nickel on the electrochemical signal of urease

As we mentioned in the “Introduction” section, the activity of urease enzyme depends on the presence of nickel. Two nickel atoms are obviously bounded into urease. We were very interested in the issue how did the presence of nickel(II) ions influence the electrochemical response of urease. We kept the nickel(II) concentration constant (100 ng/ml), changed urease concentration and measured the DP voltammograms. Except the redox peak of urease we observed new signals on the voltammograms measured. These signals probably corresponds to complex of urease with nickel(II) ions. Nevertheless, we aimed our attention on the signal of urease at −0.5 V only. The observed changes in this signal with increasing concentration of urease and constant concentration of nickel(II) ions are shown in Figure 6B. It can be concluded that DPV peak of urease is higher for more than 12 % in the presence of nickel(II) compared to those measured without nickel(II) ions. In addition, we studied the influence of various concentration of nickel(II) ions on urease signal. We found that DPV peak of urease shifted to more negative potentials about 50 mV. Based on the results obtained the interaction of nickel(II) ions and urease can be determined using electrochemical methods. Therefore we attempted to prepare Ni nanoelectrodes to measure urease.

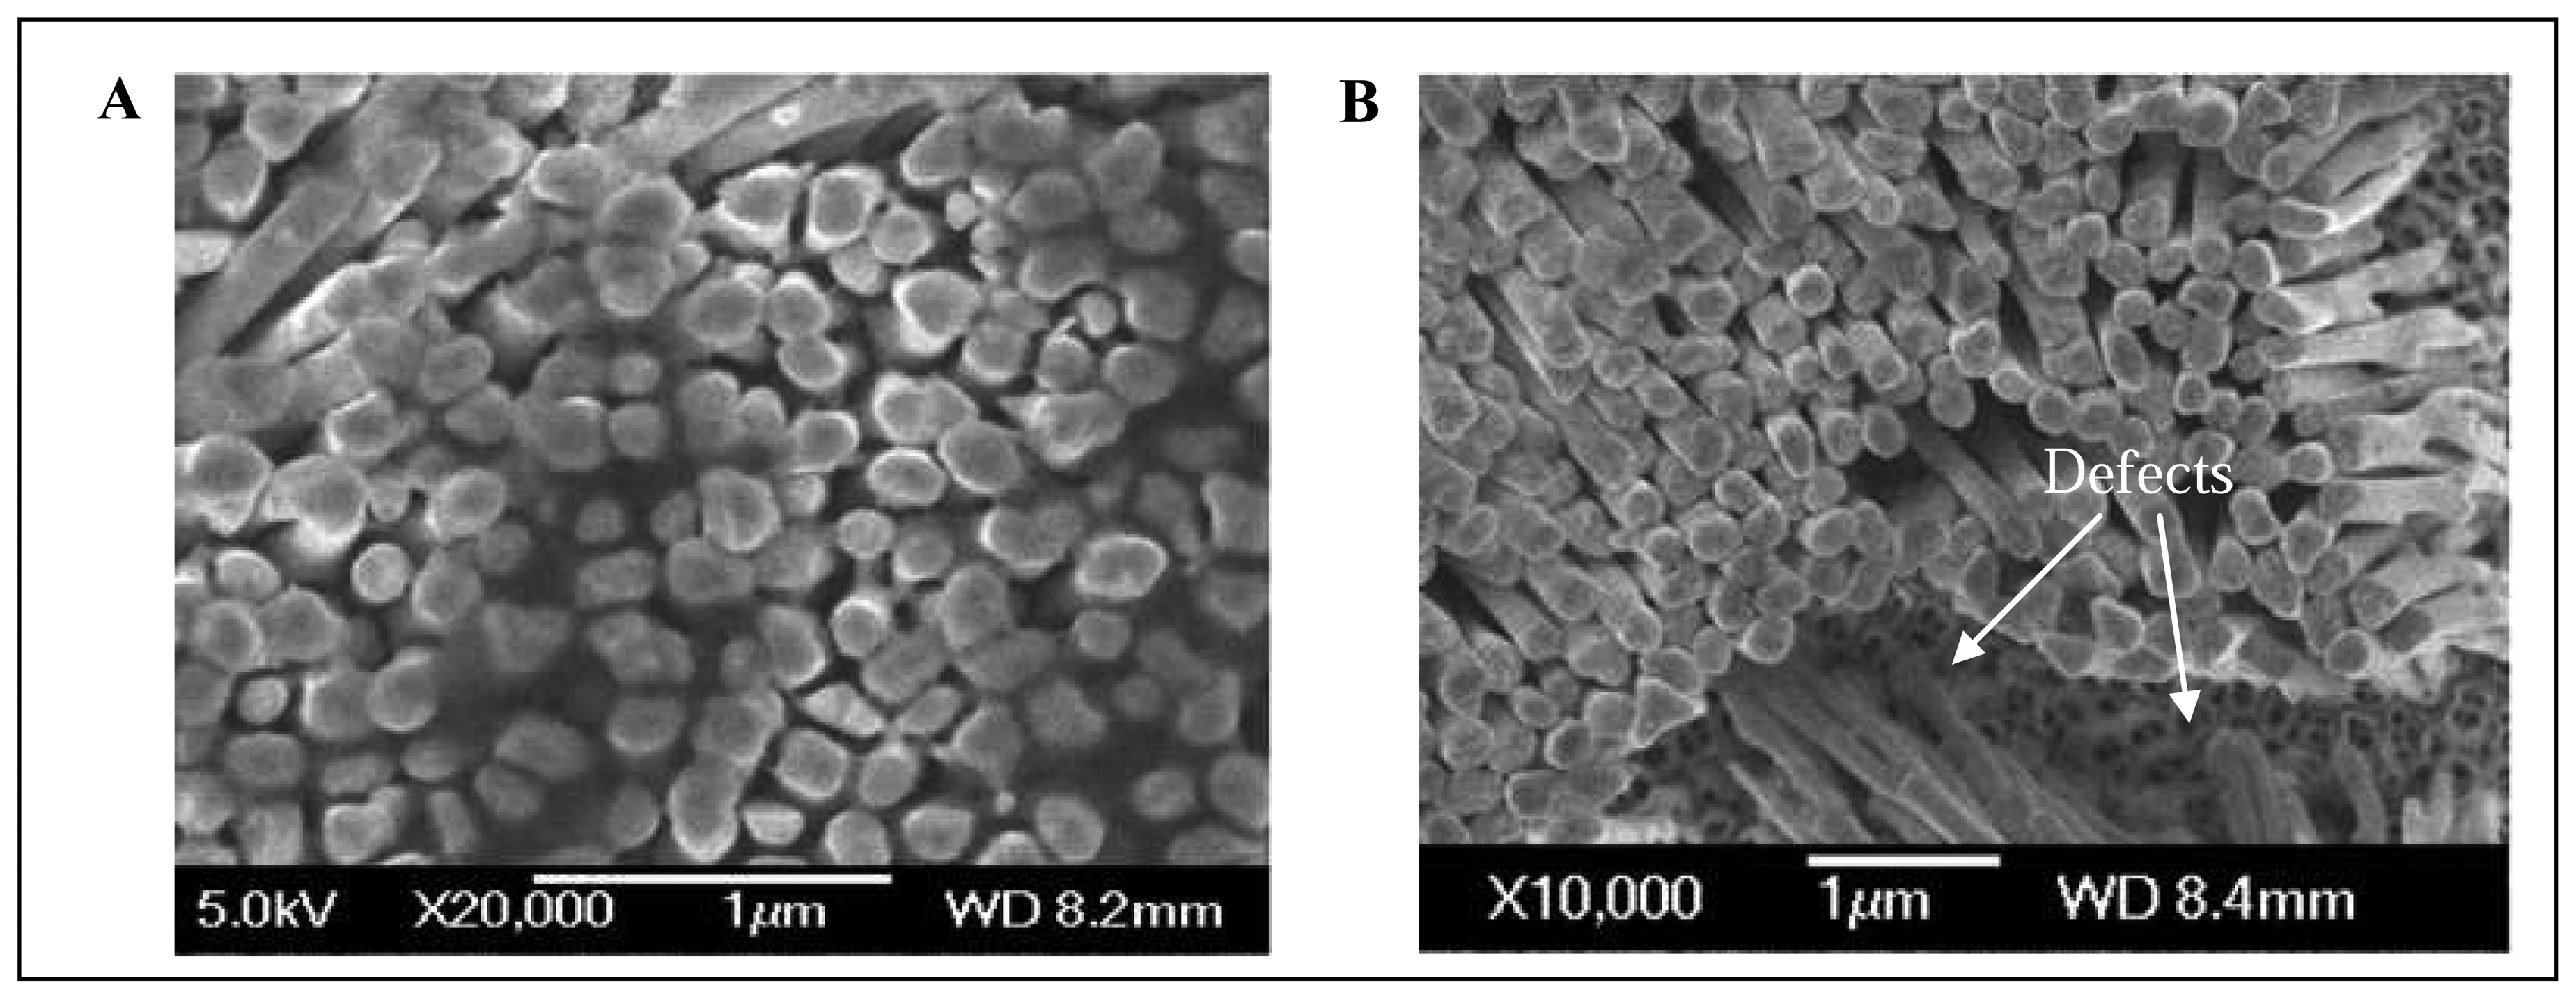
3.4 SEM analysis of Ni nanoelectrode surface

The Ni nanoelectrode has been analysed after the template dissolution by Scanning Electron Microscopy (SEM). The results confirm vertically aligned Ni nanopillars almost covered the electrode surface (Figure 7A). Analysis have also shown defects on the surface where Ni nanopilars are missing (Figure 7B). These defect places can be caused by impurities adhered on the template surface before electroplating or by abruption of nanopillars after the template dissolution because of their faulty bonding to Ni layer. The defect places are minor and insignificant in comparison with total electrode surface.

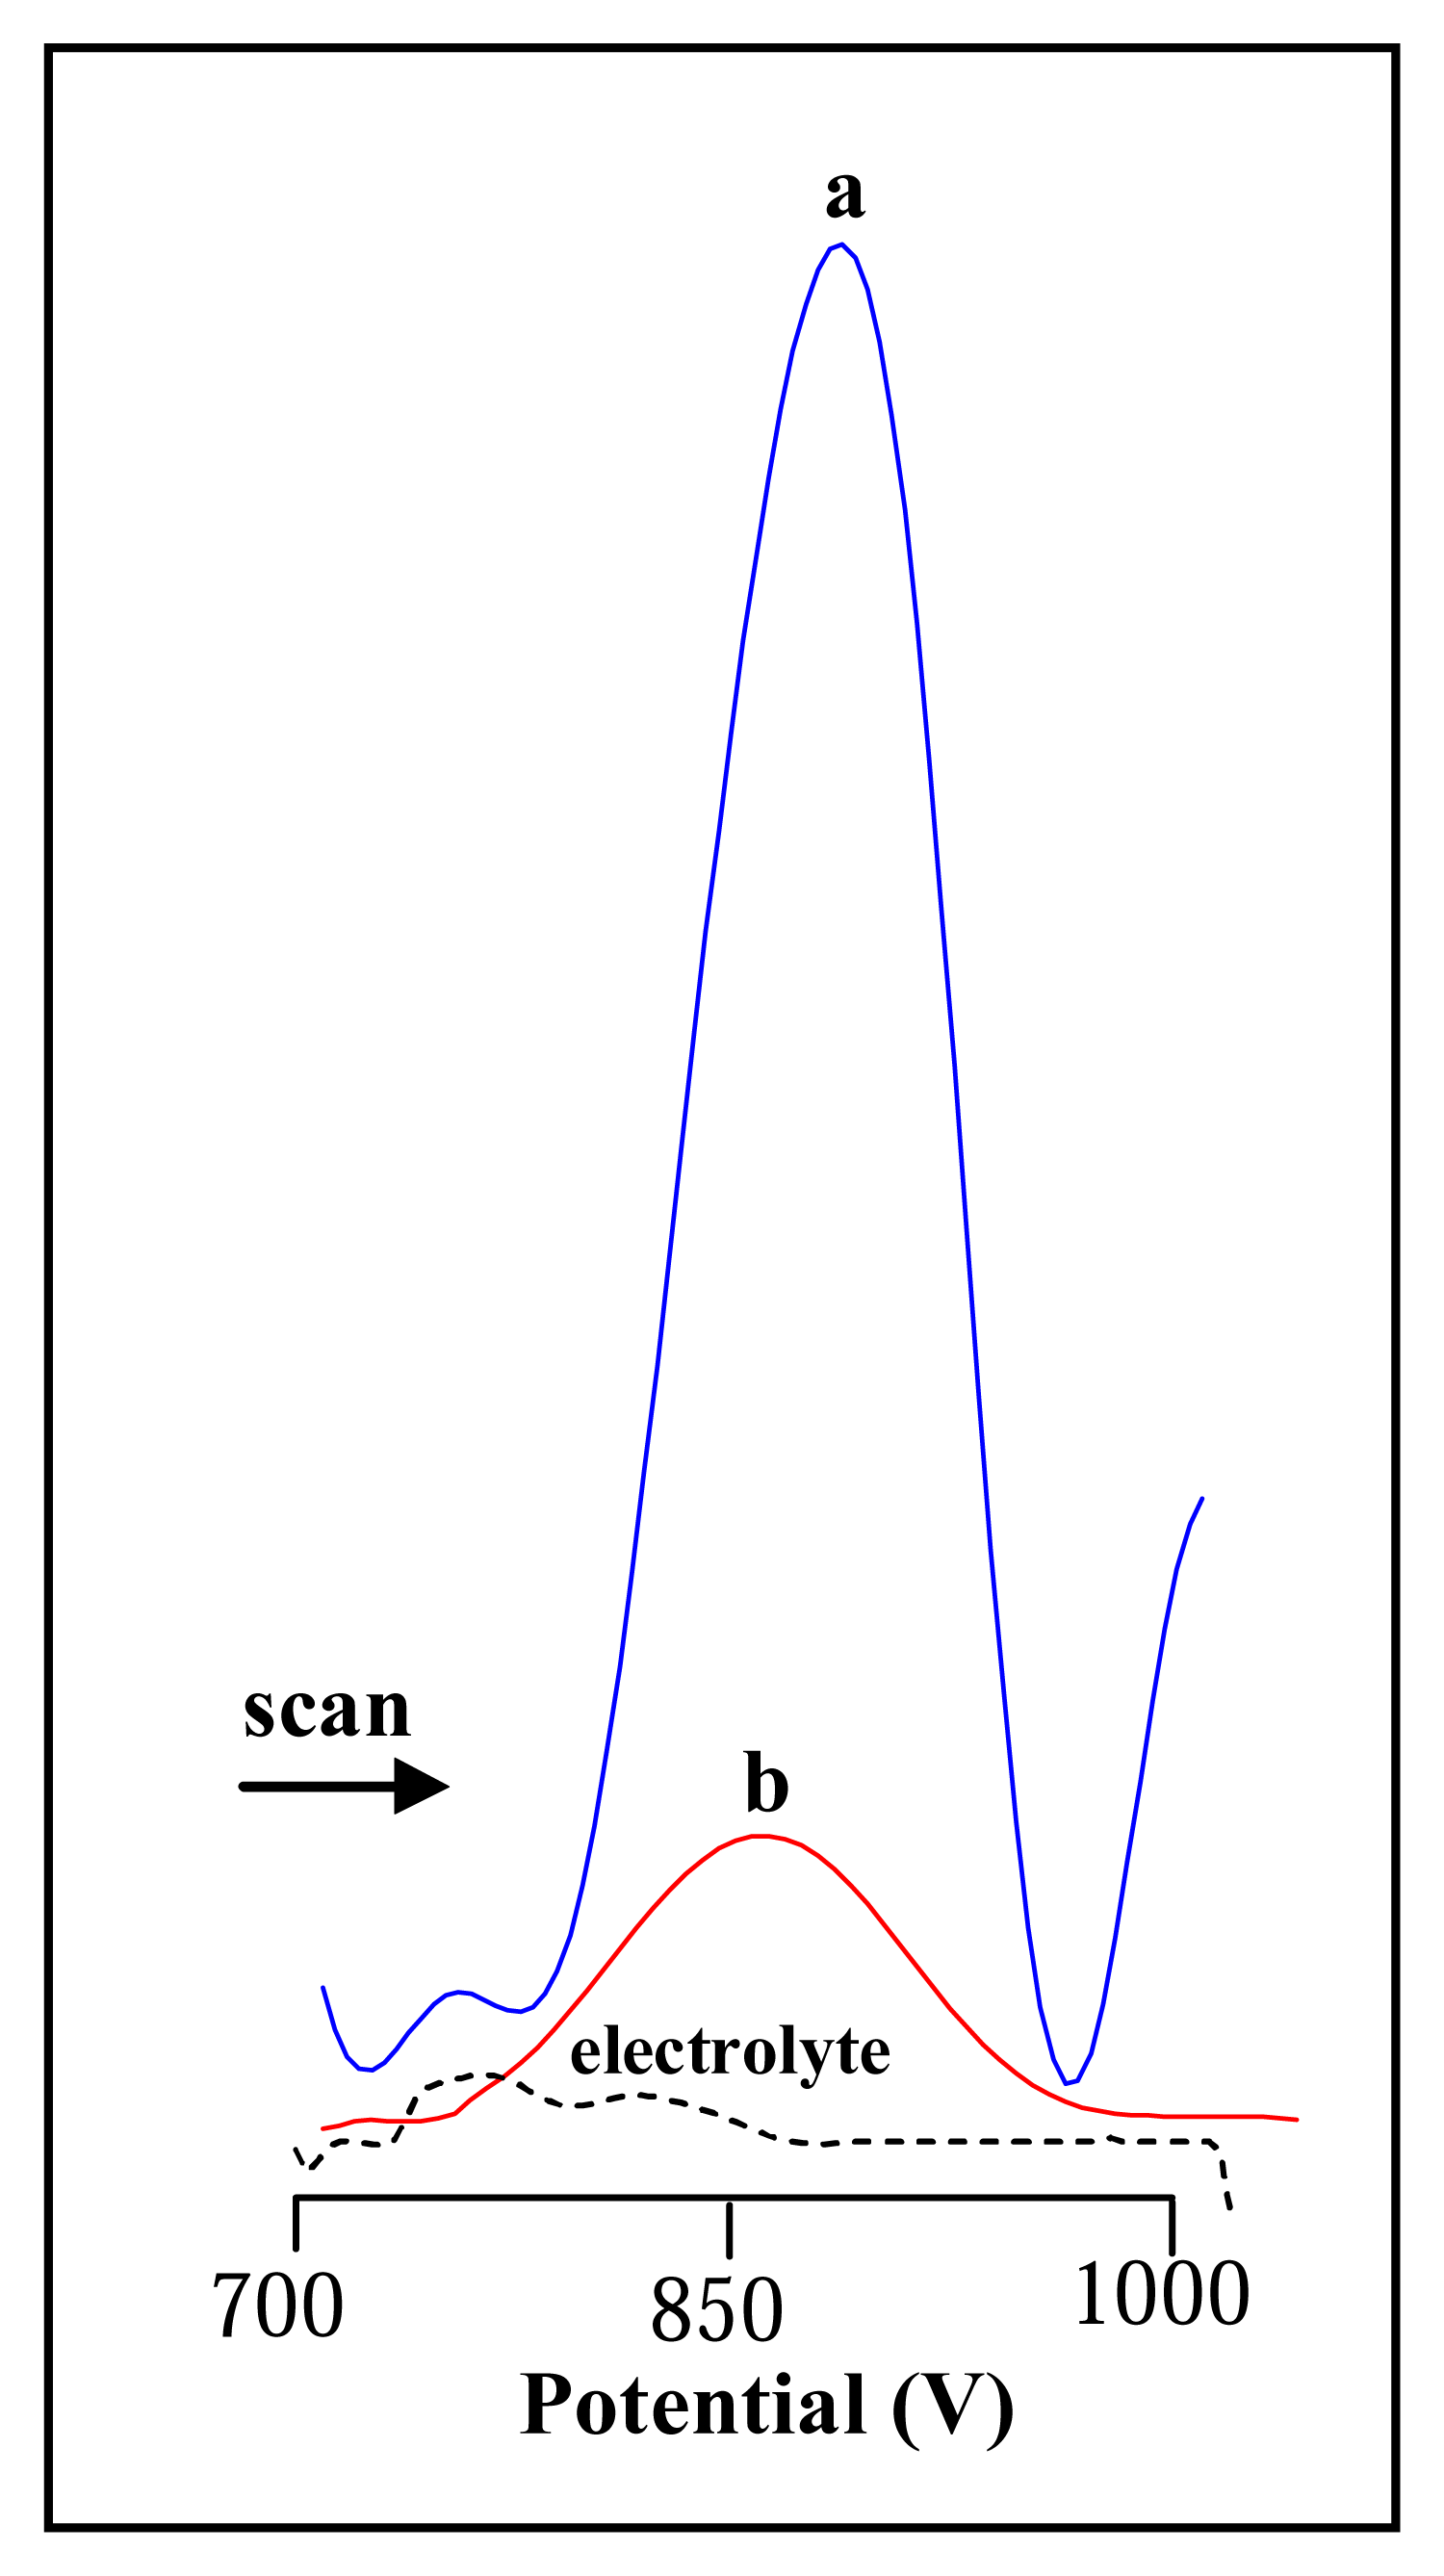
3.5 Detection of urease by Ni nanoelectrodes

The Ni nanoelectrodes were utilized for a detection of urease. Measurements were carried out in acetate buffer (pH 4.6). Urease (10 μl) was accumulated at the surface of Ni nanoelectrode for various times (from 30 s to 10 min). The optimal time of accumulation was 240 s. Under these experimental conditions urease gave oxidative signal at 0.8 V. Previously we investigated the influence of various denaturing conditions (physical and chemical) on signals of various proteins (lactoferrin, protein p53) [28,92]. However, we have not utilized the stationary electrochemical instrument to measure denaturation of protein yet. Therefore we were interested in the issue whether we were able to observe a difference between signal of native and heat denatured urease. The protein was denatured for 30 min at 99 °C. Subsequently the urease was measured at the Ni nanoelectrode. The voltammograms obtained are shown in Figure 8 (red curve – native protein, blue curve – denatured protein). Based on the results obtained the native urease gave approximately six times lower signal compared to the denatured protein.

4. Conclusion

Urease belongs to group of nickel-binding proteins. In the present paper we utilized two very different analytical techniques, spectrometric and electrochemical, for detection of this protein. The spectrometric analysis is most commonly used compared to electrochemistry [68,93]. However we shown that the electrochemical technique is suitable not only to detect urease sensitively but also to study the interaction of urease with nickel(II) ions. Moreover, we prepared Ni nanoelectrodes and utilized it for measurement of urease. Based on the results obtained we were able to not only detect urease itself but also to distinguish its native and denatured form using Ni nanoelectrode.

Acknowledgments

This work was supported from the grant of the Grant Agency of Academy of Sciences of the Czech Republic No. GAAV IAA401990701, and GAAV 1QS201710508, and from the Czech Ministry of Education within the framework of Research Plan MSM 0021630503 and IGA MZLU 5/2007.

References

  1. Sumner, J.B. The isolation and crystallization of the enzyme urease. J. Biol. Chem. 1926, 69, 435–441. [Google Scholar]
  2. Mobley, M.L.; Hausinger, R.P. Microbial ureases: significance, regulation and molecular characterization. Microbiol. Rev. 1989, 53, 85–108. [Google Scholar]
  3. Witte, C.P.; Rosso, M.G.; Romeis, T. Identification of three urease accessory proteins that are required for urease activation in Arabidopsis. Plant Physiol. 2005, 139, 1155–1162. [Google Scholar]
  4. Witte, C.P.; Tiller, S.; Isidore, E.; Davies, H.V.; Taylor, M.A. Analysis of two alleles of the urease gene from potato: polymorphisms, expression, and extensive alternative splicing of the corresponding mRNA. J. Exp. Bot. 2005, 56, 91–99. [Google Scholar]
  5. Witte, C.P.; Tiller, S.A.; Taylor, M.A.; Davies, H.V. Leaf urea metabolism in potato. Urease activity profile and patterns of recovery and distribution of N-15 after foliar urea application in wild-type and urease-antisense transgenics. Plant Physiol. 2002, 128, 1129–1136. [Google Scholar]
  6. Polacco, J.C.; Winkler, R.G. Soyaben leaf urease: a seed enzyme. Plant Physiol. 1984, 74, 800–803. [Google Scholar]
  7. de Melo, W.J.; Aguiar, P.D.; de Melo, G.M.P.; de Melo, V.P. Nickel in a tropical soil treated with sewage sludge and cropped with maize in a long-term field study. Soil Biol. Biochem. 2007, 39, 1341–1347. [Google Scholar]
  8. Thoren, A.K. Urea transformation of wetland microbial communities. Microb. Ecol. 2007, 53, 221–232. [Google Scholar]
  9. Kojima, S.; Bohner, A.; von Wiren, N. Molecular mechanisms of urea transport in plants. J. Membr. Biol. 2006, 212, 83–91. [Google Scholar]
  10. Kohler, J.; Caravaca, F.; Carrasco, L.; Roldan, A. Interactions between a plant growth-promoting rhizobacterium, an AM fungus and a phosphate-solubilising fungus in the rhizosphere of Lactuca sativa. Appl. Soil Ecol. 2007, 35, 480–487. [Google Scholar]
  11. Varel, V.H.; Wells, J.E.; Miller, D.N. Combination of a urease inhibitor and a plant essential oil to control coliform bacteria, odour production and ammonia loss from cattle waste. J. Appl. Microbiol. 2007, 102, 472–477. [Google Scholar]
  12. Yang, Z.X.; Liu, S.Q.; Zheng, D.W.; Feng, S.D. Effects of cadium, zinc and lead on soil enzyme activities. J. Environ. Sci. 2006, 18, 1135–1141. [Google Scholar]
  13. Dixon, N.E.; Gazzola, C.; Blakeley, R.L.; Zerner, B. Jack-Bean Urease (Ec 3.5.1.5) -Metalloenzyme - Simple Biological Role for Nickel. J. Am. Chem. Soc. 1975, 97, 4131–4133. [Google Scholar]
  14. Zehnalek, J.; Adam, V.; Kizek, R. Assimilation of nitrate, ammonium and amide nitrogen by agricultural crops. Chem. Listy 2006, 100, 508–514. [Google Scholar]
  15. Robotis, J. Two rapid urease tests comparison (CLO Vs PRONTO DRY) for the detection of HP infection. Gastroenterology 2003, 124, A176–A177. [Google Scholar]
  16. Vilaichone, R.; Mahachai, V.; Nunthapisud, P.; Thong-Gyam, D.; Kullavanijaya, P. Gastric juice urease test and brushing urease test for Helicobacter pylori detection. Gut 2002, 51, A111–A112. [Google Scholar]
  17. Wisniewska, M.; Nilsson, H.O.; Bak-Romaniszyn, L.; Rechcinski, T.; Bielanski, W.; Planeta-Malecka, I.; Plonka, M.; Konturek, S.; Wadstrom, T.; Rudnicka, W.; Chmiela, M. Detection of specific Helicobacter pylori DNA and antigens in stool samples in dyspeptic patients and healthy subjects. Microbiol. Immunol. 2004, 46, 657–665. [Google Scholar]
  18. Xia, H.H.X.; Wong, B.C.Y. Gastric biopsy-based rapid urease tests for the detection of Helicobacter pylori: Progress, advantages and limitations. J. Gastroenterol. Hepatol. 2002, 17, 629–632. [Google Scholar]
  19. Yee, Y.K.; Yip, K.T.; Que, T.L.; Chang, K.K.; Li, K.F.; Lee, C.K.; Wong, S.W.; Lau, S.F.; Szeto, M.L. Efficacy of enzyme immunoassay for the detection of Helicobacter pylori antigens in frozen stool specimens: local validation. Aliment. Pharmacol. Ther. 2002, 16, 1739–1742. [Google Scholar]
  20. Berdoz, J.; Corthesy, B. Human polymeric IgA is superior to IgG and single-chain Fv of the same monoclonal specificity to inhibit urease activity associated with Helicobacter pylori. Mol. Immunol. 2004, 41, 1013–1022. [Google Scholar]
  21. Tripathi, R.N.; Nath, N.; Gandhi, A.P. Studies on the quality of canned baked soybeans. J. Food Sci. Technol. -Mysore 2004, 41, 131–134. [Google Scholar]
  22. Kizek, R.; Trnková, L.; Palecek, E. Determination of metallothionein at the femtomole level by constant current stripping chronopotentiomentry. Anal. Chem. 2001, 73, 4801–4807. [Google Scholar]
  23. Kizek, R.; Vacek, J.; Trnkova, L.; Klejdus, B.; Havel, L. Application of catalytic reactions on a mercury electrode for electrochemical detection of metallothioneins. Chem. Listy 2004, 98, 166–173. [Google Scholar]
  24. Masarik, M.; Stobiecka, A.; Kizek, R.; Jelen, F.; Pechan, Z.; Hoyer, W.; Jovin, T.M.; Subramaniam, V.; Palecek, E. Sensitive electrochemical detection of native and aggregated alpha-synuclein protein involved in Parkinson's disease. Electroanalysis 2004, 16, 1172–1181. [Google Scholar]
  25. Palecek, E.; Masarik, M.; Kizek, R.; Kuhlmeier, D.; Hassmann, J.; Schulein, J. Sensitive electrochemical determination of unlabeled MutS protein and detection of point mutations in DNA. Anal. Chem. 2004, 76, 5930–5936. [Google Scholar]
  26. Prusa, R.; Potesil, D.; Masarik, M.; Adam, V.; Kizek, R.; Jelen, F. Fast and sensitive electrochemical detection of native, denatured, and aggregated forms of tumor suppressor protein p53. Mol. Biol. Cell 2004, 15, 249A–249A. [Google Scholar]
  27. Kukacka, J.; Zitka, O.; Horna, A.; Stejskal, K.; Zehnalek, J.; Adam, V.; Havel, L.; Zeman, L.; Prusa, R.; Trnkova, L.; Kizek, R. A new tool for distinguishing of different structural forms of lactoferrin. Faseb J. 2007, 21, A635–A635. [Google Scholar]
  28. Zitka, O.; Horna, A.; Stejskal, K.; Zehnalek, J.; Adam, V.; Havel, L.; Zeman, L.; Kizek, R. Study of structural changes of lactoferrin using flow injection analysis with electrochemical detection on glassy carbon electrode. Acta Chim. Slov. 2007, 54, 68–73. [Google Scholar]
  29. Zitka, O.; Stejskal, K.; Kleckerova, A.; Adam, V.; Beklova, M.; Horna, A.; Supalkova, V.; Havel, L.; Kizek, R. Utilizing electrochemical techniques for detection of biological samples. Chem. Listy 2007, 101, 225–231. [Google Scholar]
  30. Adam, V.; Petrlova, J.; Potesil, D.; Zehnalek, J.; Sures, B.; Trnkova, L.; Jelen, F.; Kizek, R. Study of metallothionein modified electrode surface behavior in the presence of heavy metal ions-biosensor. Electroanalysis 2005, 17, 1649–1657. [Google Scholar]
  31. Adam, V.; Zehnalek, J.; Petrlova, J.; Potesil, D.; Sures, B.; Trnkova, L.; Jelen, F.; Vitecek, J.; Kizek, R. Phytochelatin modified electrode surface as a sensitive heavy-metal ion biosensor. Sensors 2005, 5, 70–84. [Google Scholar]
  32. Kizek, R.; Masarik, M.; Kramer, K.J.; Potesil, D.; Bailey, M.; Howard, J.A.; Klejdus, B.; Mikelova, R.; Adam, V.; Trnkova, L.; Jelen, F. An analysis of avidin, biotin and their interaction at attomole levels by voltammetric and chromatographic techniques. Anal. Bioanal. Chem. 2005, 381, 1167–1178. [Google Scholar]
  33. Huang, X.J.; Choi, Y.K. Chemical sensors based on nanostructured materials. Sens. Actuator B-Chem. 2007, 122, 659–671. [Google Scholar]
  34. Daniel, S.; Rao, T.P.; Rao, K.S.; Rani, S.U.; Naidu, G.R.K.; Lee, H.Y.; Kawai, T. A review of DNA functionalized/grafted carbon nanotubes and their characterization. Sens. Actuator B-Chem. 2007, 122, 672–682. [Google Scholar]
  35. Li, L.; Li, G.H.; Fang, X.S. Bi-based nanowire and nanojunction arrays: Fabrication and physical properties. J. Mater. Sci. Technol. 2007, 23, 166–181. [Google Scholar]
  36. Sque, S.J.; Jones, R.; Oberg, S.; Briddon, P.R. Carbon nanotubes and their interaction with the surface of diamond. Phys. Rev. B 2007, 75, 16. [Google Scholar]
  37. Billinge, S.J.L.; Levin, I. The problem with determining atomic structure at the nanoscale. Science 2007, 316, 561–565. [Google Scholar]
  38. Tang, J.; Xing, G.M.; Zhao, F.; Yuan, H.; Zhao, Y.L. Modulation of structural and electronic properties of fullerene and metallofullerenes by surface chemical modifications. J. Nanosci. Nanotechnol. 2007, 7, 1085–1101. [Google Scholar]
  39. Bandaru, P.R. Electrical properties and applications of carbon nanotube structures. J. Nanosci. Nanotechnol. 2007, 7, 1239–1267. [Google Scholar]
  40. Chen, Y.; Lin, Y.; Liu, Y.; Doyle, J.; He, N.; Zhuang, X.D.; Bai, J.R.; Blau, W.J. Carbon nanotube-based functional materials for optical limiting. J. Nanosci. Nanotechnol. 2007, 7, 1268–1283. [Google Scholar]
  41. Wei, W.; Sethuraman, A.; Jin, C.; Monteiro-Riviere, N.A.; Narayan, R.J. Biological properties of carbon nanotubes. J. Nanosci. Nanotechnol. 2007, 7, 1284–1297. [Google Scholar]
  42. Wang, J. Carbon-nanotube based electrochemical biosensors: A review. Electroanalysis 2005, 17, 7–14. [Google Scholar]
  43. Lin, Y.; Taylor, S.; Li, H.P.; Fernando, K.A.S.; Qu, L.W.; Wang, W.; Gu, L.R.; Zhou, B.; Sun, Y.P. Advances toward bioapplications of carbon nanotubes. J. Mater. Chem. 2004, 14, 527–541. [Google Scholar]
  44. Martin, C.R.; Kohli, P. The emerging field of nanotube biotechnology. Nat. Rev. Drug Discov. 2003, 2, 29–37. [Google Scholar]
  45. Niyogi, S.; Hamon, M.A.; Hu, H.; Zhao, B.; Bhowmik, P.; Sen, R.; Itkis, M.E.; Haddon, R.C. Chemistry of single-walled carbon nanotubes. Accounts Chem. Res. 2002, 35, 1105–1113. [Google Scholar]
  46. Baughman, R.H.; Zakhidov, A.A.; de Heer, W.A. Carbon nanotubes - the route toward applications. Science 2002, 297, 787–792. [Google Scholar]
  47. Thostenson, E.T.; Ren, Z.F.; Chou, T.W. Advances in the science and technology of carbon nanotubes and their composites: a review. Compos. Sci. Technol. 2001, 61, 1899–1912. [Google Scholar]
  48. Terrones, M.; Hsu, W.K.; Kroto, H.W.; Walton, D.R.M. Nanotubes: A revolution in materials science and electronics; Springer-Verlag: Berlin, 1999; pp. 189–234. [Google Scholar]
  49. Subramoney, S. Novel nanocarbons - Structure, properties, and potential applications. Adv. Mater. 1998, 10, 1157, -+. [Google Scholar]
  50. Ebbesen, T.W. Carbon Nanotubes. Annu. Rev. Mater. Sci. 1994, 24, 235–264. [Google Scholar]
  51. Leoni, L.; Attiah, D.; Desai, T.A. Nanoporous platforms for cellular sensing and delivery. Sensors 2002, 2, 111–120. [Google Scholar]
  52. Wang, J. Nanoparticle-based electrochemical bioassays of proteins. Electroanalysis 2007, 19, 769–776. [Google Scholar]
  53. Cochrane, C.; Koncar, V.; Lewandowski, M.; Dufour, C. Design and development of a flexible strain sensor for textile structures based on a conductive polymer composite. Sensors 2007, 7, 473–492. [Google Scholar]
  54. Jaffrezic-Renault, N.; Martelet, C.; Chevolot, Y.; Cloarec, J.P. Biosensors and bio-bar code assays based on biofunctionalized magnetic microbeads. Sensors 2007, 7, 589–614. [Google Scholar]
  55. Lyons, M.E.G.; Keeley, G.P. The redox behaviour of randomly dispersed single walled carbon nanotubes both in the absence and in the presence of adsorbed glucose oxidase. Sensors 2006, 6, 1791–1826. [Google Scholar]
  56. Lu, J.H.; Cao, X.A.; Pan, C.Y.; Yang, L.F.; Lai, G.B.; Chen, J.L.; Wu, C.Q. Studies of the cataluminescence of benzene homologues on nanosized gamma-Al2O3/Eu2O3 and the development of a gas sensor for benzene homologue vapors. Sensors 2006, 6, 1827–1836. [Google Scholar]
  57. Liewhiran, C.; Phanichphant, S. Influence of thickness on ethanol sensing characteristics of doctor-bladed thick film from flame-made ZnO nanoparticles. Sensors 2007, 7, 185–201. [Google Scholar]
  58. De Stefano, L.; Arcari, P.; Lamberti, A.; Sanges, C.; Rotiroti, L.; Rea, I.; Rendina, I. DNA optical detection based on porous silicon technology: from biosensors to biochips. Sensors 2007, 7, 214–221. [Google Scholar]
  59. Liu, N.; Hui, J.; Sun, C.Q.; Dong, J.H.; Zhang, L.Z.; Xiao, H. Nanoporous zeolite thin film-based fiber intrinsic Fabry-Perot interferometric sensor for detection of dissolved organics in water. Sensors 2006, 6, 835–847. [Google Scholar]
  60. Kang, B.S.; Wang, H.T.; Tien, L.C.; Ren, F.; Gila, B.P.; Norton, D.P.; Abernathy, C.R.; Lin, J.S.; Pearton, S.J. Wide bandgap semiconductor nanorod and thin film gas sensors. Sensors 2006, 6, 643–666. [Google Scholar]
  61. Wang, L.Y.; Kariuki, N.N.; Schadt, M.; Mott, D.; Luo, J.; Zhong, C.J.; Shi, X.J.; Zhang, C.; Hao, W.B.; Lu, S.; Kim, N.; Wang, J.Q. Sensing arrays constructed from nanoparticle thin films and interdigitated microelectrodes. Sensors 2006, 6, 667–679. [Google Scholar]
  62. Katz, E.; Willner, I. Magneto-controlled quantized electron transfer to surface-confined redox units and metal nanoparticles. Sensors 2006, 6, 420–427. [Google Scholar]
  63. Zhang, X.L.; Wang, J.X.; Wang, Z.; Wang, S.C. Improvement of amperometric sensor used for determination of nitrate with polypyrrole nanowires modified electrode. Sensors 2005, 5, 580–593. [Google Scholar]
  64. Bushuev, Y.; Davletbaeva, S.; Muguet, F.F. Hydration simulations of a carbon nanotube, immersed in water, according to the 3-attractor water model. Sensors 2005, 5, 139–147. [Google Scholar]
  65. Yin, Y.J.; Lu, Y.F.; Wu, P.; Cai, C.X. Direct electrochemistry of redox proteins and enzymes promoted by carbon nanotubes. Sensors 2005, 5, 220–234. [Google Scholar]
  66. Cheng, F.L.; Zhang, M.L.; Wang, H. Fabrication of polypyrrole nanowire and nanotube arrays. Sensors 2005, 5, 245–249. [Google Scholar]
  67. Liang, W.; Yuan, Z.B. Direct electrochemistry of glucose oxidase at a gold electrode modified with single-wall carbon nanotubes. Sensors 2003, 3, 544–554. [Google Scholar]
  68. Witte, C.P.; Medina-Escobar, N. In-gel detection of urease with nitroblue tetrazolium and quantification of the enzyme from different crop plants using the indophenol reaction. Anal. Biochem. 2001, 290, 102–107. [Google Scholar]
  69. Bollo, S.; Ferreyra, N.F.; Rivas, G.A. Electrooxidation of DNA at glassy carbon electrodes modified with multiwall carbon nanotubes dispersed in chitosan. Electroanalysis 2007, 19, 833–840. [Google Scholar]
  70. Castaneda, M.T.; Alegret, S.; Merkoci, A. Electrochemical sensing of DNA using gold nanoparticles. Electroanalysis 2007, 19, 743–753. [Google Scholar]
  71. Erdem, A.; Sayar, F.; Karadeniz, H.; Guven, G.; Ozsoz, M.; Piskin, E. Development of streptavidin carrying magnetic nanoparticles and their applications in electrochemical nucleic acid sensor systems. Electroanalysis 2007, 19, 798–804. [Google Scholar]
  72. Horibe, T.; Zhang, J.D.; Oyama, M. Effects of capping reagents on the electron transfer reactions on gold nanoparticle-attached indium tin oxide electrodes. Electroanalysis 2007, 19, 847–852. [Google Scholar]
  73. Hsing, I.M.; Xu, Y.; Zhao, W.T. Micro- and nano-magnetic particles for applications in biosensing. Electroanalysis 2007, 19, 755–768. [Google Scholar]
  74. Liu, G.D.; Wang, J.; Wu, H.; Lin, Y.Y. Nanovehicles based bioassay labels. Electroanalysis 2007, 19, 777–785. [Google Scholar]
  75. Merkoci, A. Nanobiomaterials in electroanalysis. Electroanalysis 2007, 19, 739–741. [Google Scholar]
  76. Rivas, G.A.; Rubianes, M.D.; Pedano, M.L.; Ferreyra, N.F.; Luque, G.L.; Rodriguez, M.C.; Miscoria, S.A. Carbon nanotubes paste electrodes. A new alternative for the development of electrochemical sensors. Electroanalysis 2007, 19, 823–831. [Google Scholar]
  77. Rajesh; Bisht, V.; Takashima, W.; Kaneto, K. An amperometric urea biosensor based on covalent immobilization of urease onto an electrochemically prepared copolymer poly (N-3-aminopropyl pyrrole-co-pyrrole) film. Biomaterials 2005, 26, 3683–3690. [Google Scholar]
  78. Gambhir, A.; Gerard, M.; Mulchandani, A.K.; Malhotra, B.D. Coimmobilization of urease and glutamate dehydrogenase in electrochemically prepared polypyrrole-polyvinyl sulfonate films. Appl. Biochem. Biotechnol. 2001, 96, 249–257. [Google Scholar]
  79. Balugian, R.; Sorochinsky, V.; Seidguseinov, A. Electrochemical Sensor for the Determination of Urea in Blood on the Basis of Immobilized Urease. Artif. Organs 1980, 4, 137–138. [Google Scholar]
  80. Karube, I.; Suzuki, S. Electrochemical Preparation of Urease-Collagen Membrane. Biochem. Biophys. Res. Commun. 1972, 47, 51, -&. [Google Scholar]
  81. Palecek, E. Adsorptive transfer stripping voltammetry - determination of nanogram quanitities of DNA immobilized at the electrode surface. Anal. Biochem. 1988, 170, 421–431. [Google Scholar]
  82. Palecek, E. Adsorptive transfer stripping voltammetry: Effect of electrode potential on the structure of DNA adsorbed at the mercury surface. Bioelectrochem. Bioenerg. 1992, 28, 71–83. [Google Scholar]
  83. Palecek, E.; Jelen, F.; Postbieglova, I. Adsorptive transfer stripping voltammetry offers new possibilities in DNA research. Studia Biophysica 1989, 130, 51–54. [Google Scholar]
  84. Palecek, E.; Postbieglova, I. Adsorptive stripping voltammetry of bimacromolecules with transfer of the adsorbed layer. J. Electroanal. Chem. 1986, 214, 359–371. [Google Scholar]
  85. Adam, V.; Krizkova, S.; Zitka, O.; Trnkova, L.; Petrlova, J.; Beklova, M.; Kizek, R. Determination of apo-metallothionein using adsorptive transfer stripping technique in connection with differential pulse voltammetry. Electroanalysis 2007, 19, 339–347. [Google Scholar]
  86. Petrlova, J.; Potesil, D.; Mikelova, R.; Blastik, O.; Adam, V.; Trnkova, L.; Jelen, F.; Prusa, R.; Kukacka, J.; Kizek, R. Attomole voltammetric determination of metallothionein. Electrochim. Acta 2006, 51, 5112–5119. [Google Scholar]
  87. Petrlova, J.; Potesil, D.; Zehnalek, J.; Sures, B.; Adam, V.; Trnkova, L.; Kizek, R. Cisplatin electrochemical biosensor. Electrochim. Acta 2006, 51, 5169–5173. [Google Scholar]
  88. Kukacka, J.; Krizkova, S.; Zitka, O.; Prusa, R.; Adam, V.; Sures, B.; Beklova, M.; Kizek, R. Study of nucleic acids interactions with platinum based cytostatics using biosensor. Faseb J. 2007, 21, A262–A262. [Google Scholar]
  89. Krizkova, S.; Adam, V.; Petrlova, J.; Zitka, O.; Stejskal, K.; Zehnalek, J.; Sures, B.; Trnkova, L.; Beklova, M.; Kizek, R. A suggestion of electrochemical biosensor for study of platinum(II)-DNA interactions. Electroanalysis 2007, 19, 331–338. [Google Scholar]
  90. Adam, V.; Petrlova, J.; Potesil, D.; Lubal, P.; Zehnalek, J.; Sures, B.; Kizek, R. New electrochemical biosensor to determine platinum cytostatics to DNA structure. Chem. Listy 2005, 99, 353–393. [Google Scholar]
  91. Prusa, R.; Petrlova, J.; Kukacka, J.; Adam, V.; Sures, B.; Beklova, M.; Kizek, R. Study of interaction of glutathiones and metallothionein with cytostatics. Clin. Chem. 2006, 52, A175–A175. [Google Scholar]
  92. Potesil, D.; Mikelova, R.; Adam, V.; Kizek, R.; Prusa, R. Change of the protein p53 electrochemical signal according to its structural form - Quick and sensitive distinguishing of native, denatured, and aggregated form of the “guardian of the genome”. Protein J. 2006, 25, 23–32. [Google Scholar]
  93. Xu, Z.; Chen, X.; Qu, X.H.; Jia, J.B.; Dong, S.J. Single-wall carbon nanotube-based voltammetric sensor and biosensor. Biosens. Bioelectron. 2004, 20, 579–584. [Google Scholar]
Figure 1. Whatman Anodisc as the template with sputtered Ni layer on the bottom (A), nanopores filled with Ni nanocrystal undergalvanostatic conditions (B), Ni nanopillars obtained after dissolution of the template (C).
Sensors 07 01238f1
Figure 2. Thick-film electrode.
Sensors 07 01238f2
Figure 3. The scheme of the urease catalyzing hydrolysis of urea into carbon dioxide and ammonia (upper inset). An indophenol assay for the detection of ammonium – Berthelot method. The dependence of absorbance measured at 636 nm on concentration of NH4Cl. The intensity of colouring of the solutions with various concentration of NH4Cl (bottom inset). The colouring of the solutions is constant for more than 60 min. For other details see in “Materials and Methods” section.
Sensors 07 01238f3
Figure 4. Differential pulse voltammogram of urease (500 μg/ml) measured in the presence of acetate buffer (0.2 M, pH 4.6) and accumulation time of 120 s (A). Changes in urease peak height in the presence of acetate (pH of 4.4 – 5.6) and phosphate buffer (pH of 6.2 – 8.0); in inset: the influence of pH on potential of the peak (B).
Sensors 07 01238f4
Figure 5. Typical DP voltammograms of urease (500 μg/ml) measured under various accumulation times (A). Dependences of urease peak height and its potential (in inset) on accumulation time (B). For other details see in Figure 4.
Sensors 07 01238f5
Figure 6. Dependence of urease peak height on its concentration within the range from 1 to 1,000 μg/ml) and from 1 to 60 μg/ml (inset) (A). The influence of nickel(II) ions on DPV urease signal (B).
Sensors 07 01238f6
Figure 7. SEM analysis of Ni nanopillars created on the electrode, homogenously distributed Ni nanopillars (A) and detail of surface defects without Ni nanopillars (B).
Sensors 07 01238f7
Figure 8. Square wave voltammetric analysis of urease using Ni nanoelectrode. The supporting electrolyte (acetate buffer pH 4.2) – dot-and-dash black curve, a) denatured urease (30 min, 99 °C), b) native urease. Concentration of urease (100 mg/ml). SWV parameters were as follows: frequency 200 Hz, initial potential −0.4 V, end potential 1.4 V, step potential 5 mV, amplitude 25 mV.
Sensors 07 01238f8

