Effects of Palladium Loading on the Response of Thick Film Flame-made ZnO Gas Sensor for Detection of Ethanol Vapor

1
Department of Physics, Faculty of Science, Chiang Mai University, Chiang Mai 50200, Thailand
2
Nanoscience Research Laboratory, Department of Chemistry, Faculty of Science, Chiang Mai 50200, Thailand
*
Author to whom correspondence should be addressed.
Sensors 2007, 7(7), 1159-1184; https://doi.org/10.3390/s7071159
Submission received: 6 June 2007
/
Accepted: 9 July 2007
/
Published: 26 July 2007
Abstract
:ZnO nanoparticles doped with 0-5 mol% Pd were successfully produced in a single step by flame spray pyrolysis (FSP) using zinc naphthenate and palladium (II) acetylacetonate dissolved in toluene-acetonitrile (80:20 vol%) as precursors. The effect of Pd loading on the ethanol gas sensing performance of the ZnO nanoparticles and the crystalline sizes were investigated. The particle properties were analyzed by XRD, BET, AFM, SEM (EDS line scan mode), TEM, STEM, EDS, and CO-pulse chemisorption measurements. A trend of an increase in specific surface area of samples and a decrease in the dBET with increasing Pd concentrations was noted. ZnO nanoparticles were observed as particles presenting clear spheroidal, hexagonal and rod-like morphologies. The sizes of ZnO spheroidal and hexagonal particle crystallites were in the 10-20 nm range. ZnO nanorods were in the range of 10-20 nm in width and 20-50 nm in length. The size of Pd nanoparticles increased and Pd-dispersion% decreased with increasing Pd concentrations. The sensing films were produced by mixing the particles into an organic paste composed of terpineol and ethyl cellulose as a vehicle binder. The paste was doctor-bladed onto Al2O3 substrates interdigitated with Au electrodes. The film morphology was analyzed by SEM and EDS analyses. The gas sensing of ethanol (25-250 ppm) was studied in dry air at 400°C. The oxidation of ethanol on the sensing surface of the semiconductor was confirmed by MS. A well-dispersed of 1 mol%Pd/ZnO films showed the highest sensitivity and the fastest response time (within seconds).
1. Introduction
Solid-state gas sensors have recently played an important role in environmental monitoring and chemical process control. Among the various solid-state sensors, semiconducting metal oxide ones have been widely investigated due to their small dimensions and low cost. Many researchers have developed ethanol vapor sensors based on semiconductor metal oxides. The various semiconductor metal oxides commonly used as ethanol gas sensors include both pure and metal-doped ones, e.g. SnO2 [1-12], In2O3 [13, 14], TiO2 [8, 15-20], ZrO2 [8], WO3 [7, 19], MoO3 [19], Cu2O [21], and ZnO [22-49]. The latter in particular was among the earliest discovered and is one of the most widely applied oxide gas sensing materials. Many materials using nanoparticles require non-agglomerated spherical particles. In gas sensors, small-sized particles decrease the response time and increase the gas sensitivity, while a low degree of agglomeration facilitates the production of thin or thick films [50].
ZnO is an interesting chemically and thermally stable n-type semiconductor with a wurtzite structure displaying a large-band gap energy of about 3.37 eV at low temperature and 3.30 eV at room temperature [51-54], and with high sensitivity to toxic and combustible gases. It is sensitive to many gases at moderate temperatures, especially towards ethanol vapor [22-49]. ZnO is one of the most widely applied oxide-gas sensor materials owing to its high chemical stability, low cost and good flexibility in fabrication. Various types of ZnO-based gas sensors, such as single crystal [22, 25, 37], sinter pellet [28, 42-44], heterojunctions [49], thin film [24, 30, 34, 41, 47, 48] and thick film [23, 29, 43, 52, 53], have been demonstrated. Instead of bulk ZnO and ZnO thin films, it is also possible to use one-dimensional (1D) ZnO nanowires or nanorods for gas sensing. Such 1D ZnO nanomaterials are especially attractive due to their tunable electronic and optoelectronic properties. In the case of polycrystalline (ceramic or film) devices, only a small amount of the species adsorbed near the grain boundaries was active in modifying the electrical transport properties, which leads to low maximum sensitivity because of their limited surface-to-volume ratio [33]. The application of nanomaterials to the design of ethanol gas sensor is nowadays one of the most active research fields, due to their high activity, high surface-to-bulk ratio, good adsorption characteristics and high selectivity. The gas sensing mechanism involves chemisorptions of oxygen on the oxide surface followed by charge transfer during the reaction between chemisorbed oxygen reducing and target gas molecules. However, the physical and sensing properties of semiconductor gas sensors are directly related to their preparation e.g. particle size, sensing film morphology, crack surface [53] and film thickness [52, 55-63] as well as sensing film characteristics.
Flame aerosol synthesis, one of the most promising routes applicable to manufacture of a range of single and multi-component functional nanoparticles at low cost and with high production rates, refers to the formation of fine particles from gases in flames [64]. Today, flame technology is employed routinely in large scale manufacture of carbon blacks and metal oxide commodities such as fumed silica and pigmentary titania and, to a lesser extent, for specialty chemicals such as zinc oxide and alumina powders. Zinc oxide (ZnO) is the third largest flame-aerosol-made material after carbon black and pigmentary titania with global consumption of 600,000 t/y [65]. According to our current understanding of flame technology, vapors of the precursor compounds react at high temperatures producing the product powder, typically in the form of aggregates (clusters of cemented primary particles). The size of the particles ranges from a few to several hundred nanometers in diameter, depending on the material and process conditions [64]. Nanoparticles with high purity and relatively narrow size distribution can be synthesized efficiently in flame aerosol reactors [66]. These reactors are routinely used in industry to make a variety of commodities by combusting halide and hydrocarbon vapors. On the other hand, combustion of sprays is quite attractive as it can utilize a broader spectrum of liquid precursors than conventional vapor flame reactors. Combustion of liquid precursor droplets has been used also in synthesis of mixed oxide powders by the so-called flame spray pyrolysis (FSP) process. The FSP process was systematically investigated using an external-mixing gas-assisted atomizer supported by premixed methane and oxygen flamelets [66-68]. The FSP is capable of producing mixed metal oxide powder in the 1-200 nm size range from low-cost precursors with production rates of up to 250 g/h. In conventional spray pyrolysis, the solution is atomized into a hot wall reactor where the aerosol droplets undergo evaporation, drying and thermolysis of the precipitate particles at higher temperature to form a microporous particle and eventually, dense particles by sintering. In flame reactors, the energy of the flame is used to drive chemical reactions of precursors resulting in clusters which further grow to nanoparticles by surface growth and/or coagulation and coalescence at high temperature [50]. Using flames as a heat source, one has to further distinguish between FSP processes where the spray forms a self-sustaining flame, resulting from evaporation and burning of droplets from other spray pyrolysis processes, where the supporting fuel is supplied separately from the precursor solution droplets. In the latter case the droplets rapidly evaporate so the released precursor can directly react with the oxidant gas provided by the oxy-hydrogen flame. The advantages of FSP include the ability to dissolve the precursor directly in the fuel, simplicity of introduction of the precursor into the hot reaction zone (e.g. a flame), and flexibility in using the high-velocity spray jet for rapid quenching of aerosol formation [66].
In general, a flame is used to force chemical reactions of precursor compounds, finally resulting in the formation of clusters, which increase their size up to a range of some nanometers by coagulation and sintering. Finally, the nanostructured powders are collected on a filter [66, 69]. Moreover, at low oxidant flow rates, the specific surface area increased by increasing the oxidant flow rate as the spray flame length is reduced, leading to shorter residence times and allowing less time for particle growth. Using oxygen as oxidant the droplets burn much faster than in air, thus, product particles experience longer residence times at higher temperature [66, 70]. The effect of solution feed rate on particles specific surface area and crystalline size was also investigated [65]. The solution feed rate increased the flame height, and therefore coalescence was enhanced, resulting in large primary particles [65]. Furthermore, the flame conditions can be used to control the morphology of particles. ZnO nanorod formation was caused by FSP, which was described by XRD lattice aspect ratio [71, 72].
Many researchers have mentioned a variety of techniques used to prepare the sensing films, i.e. plasma enhanced chemical vapor deposition (PECVD) [34], spray pyrolysis [24, 34], dip-coating [15, 48], and doctor-blade [52, 53, 73, 74]. Particularly, the doctor-blade technique has several advantages for producing sensing thick films suitable for the gas sensor, including relatively homogeneous composition, regularities in the film thickness and easy control of film thickness [52, 53].
An ethanol gas sensor based on 1D ZnO nanostructures was found to be a good candidate for detecting gases of various concentrations. Many researchers have reported that pure ZnO [22-38] and metal-doped ZnO [39–49] can be used to detect ethanol vapor. Also, ZnO thin films were produced by spray pyrolysis [24]. Film layers of 20 μm in thickness showed sensor signal in terms of rather high ethanol concentration (1000-5000 ppm) at 150-350°C. At high operating temperatures, they did not depend on the concentration of ethanol [24]. An ethanol sensor based on ZnO nanorods prepared by hydrothermal method [25] showed high sensitivity to ethanol concentrations ranging from 10 to 2000 ppm at 330°C, with good responses and recovery times. Furthermore, a ZnO nanowire ethanol gas sensor showed high sensor signals and fast responses to ethanol gas at concentration up to 200 ppm with an operating temperature of 300°C [26]. In addition, pure ZnO nanorods and nano-needles produced by hybrid induction and laser heating (HILH) technique also showed the capability to produce sensors with good sensor signal at a maximum temperature around 400°C for a concentration of 100 ppm of volatile organic compounds (VOCs) including acetone, toluene, and ethanol. 4.58 at % In/ZnO showed the highest sensor signal compared to pure ZnO [46]. Al/ZnO thin films were also prepared by RF magnetron sputtering on a Si substrate using Pt as interdigitated electrodes. The gas sensing results showed that the sensor signal for detection of 400 ppm ethanol vapor was about 20 at an operating temperature of 250°C [47]. In this case, catalysts such as Pd, Pt, Rh, Ru or Ag are often added to improve selectivity and sensitivity [43-46, 75, 76]. Pd is one of the most versatile and most widely applied catalytic materials and absolutely known to have a catalytic effect [43, 76] due to its excellent oxidation capability to convert hydrocarbons at lower temperature. For example, 0.1 mol% Pd additive can drastically decrease the operating temperature for the maximum response by more than 100°C. It was found that with an operating temperature of 170°C it showed high sensitivity and shorter response and recovery times (in the order of seconds) at the concentration of 200 ppm [43]. Furthermore, with the Pd loading, the ZnO-La2O3-Pd-based sensor element showed excellent ethanol vapor sensing properties at a lower operating temperature in air with respect to sensitivity and response rate. The best performance was obtained at the concentration of 1000 ppm at the operating temperature of 175°C with La2O3 and Pd additives. The Pd additive thus plays an important role in improving the sensitivity [44]. Therefore, it is interesting to apply FSP for production of Pd/ZnO nanoparticles [65, 70, 71] as used in gas sensors for ethanol vapor.
2. Experimental
2.1. Flame-synthesis of Pd-ZnO Nanoparticles
The experimental setup for the synthesis of Pd/ZnO nanoparticles by flame spray pyrolysis is shown in Figure 1. The precursor solutions consisted of zinc naphtenate (Strem, 10 wt% Zn) and palladium (II) acetylacetonate (Pd(acac)2, Fluka, 34% Pd) dissolved in an 80:20 vol% mixture of toluene (Riedel deHaen, 99.5%)-acetonitrile (Fluka, 99.5%).
The precursor concentration was kept constant at 0.5 M for all experiments. In a typical run, the liquid precursor mixture was fed at 5 mL/min in the center of a methane (1.13 L/min)/oxygen (2.4 L/min) flame by a syringe pump (Inotech) and dispersed by oxygen (5 L/min), forming a fine spray. The pressure drop at the capillary tip was kept constant at 1.5 bars by adjusting the orifice gap area at the nozzle. The spray flame was surrounded and ignited by a small flame ring issuing from an annular gap (0.15 mm spacing, at a radius of 6 mm).
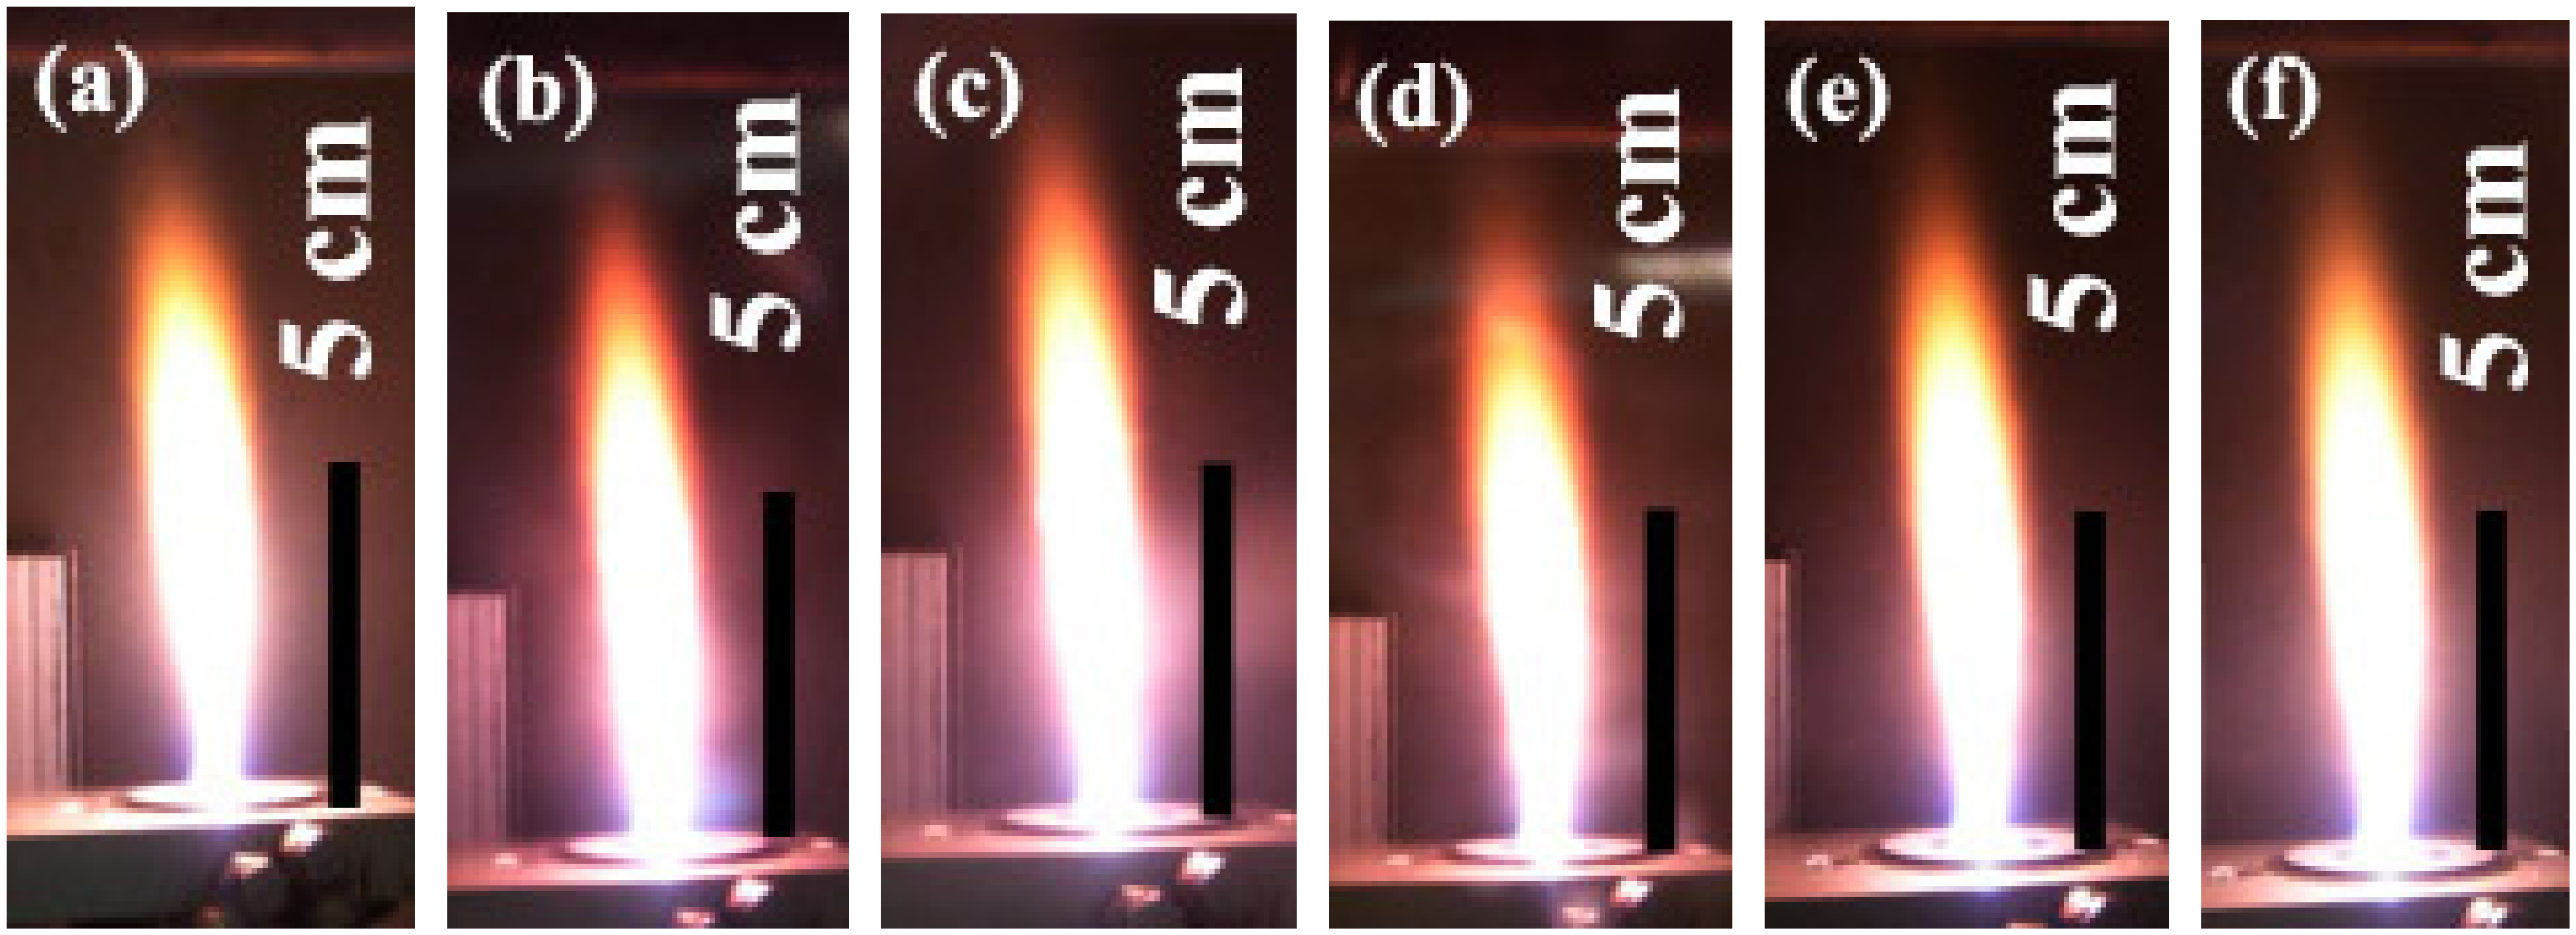
The flame height was observed to be approximately 10-12 cm, and was increased slightly by increasing the combustion enthalpy. The combustion enthalpies are directly dependent on the particular solvent, starting materials and dopants. All samples showed a yellowish-orange flame as seen in Figure 2. The liquid precursor mixture was rapidly dispersed by a gas stream and ignited by a premixed methane/oxygen flame. After evaporation and combustion of precursor droplets, particles are formed by nucleation, condensation, coagulation, coalescence and Pd deposited on the ZnO support. Finally, the product nanoparticles were collected on a glass microfibre filters (Whatmann GF/A, 25.7 cm in diameter) with the aid of a vacuum pump (Busch, Seco SV 1040C). The flame-made (5/5) ZnO as-prepared was designated as P0 while the ZnO nanopowders doped with 1-5 mol%Pd were designated as P1-P5, respectively.
2.2. Particle and Doping Characterizations
The phase and crystallinity of flame-made nanopowders and sensor samples were analyzed by XRD (Bruker D8 advance diffractometer, operated at 40 kV, 40 mA) using CuKα radiation at 2θ = 20-80° with a step size of 0.06° and a scanning speed of 0.72°/minute. Using the fundamental parameter approach and Rietveld method [77], the crystalline phase and size of the particles were confirmed. The phase and the corresponding sizes were calculated using the TOPAS-3 software. The specific surface areas of the nanopowders were determined by the 5-point nitrogen adsorption measurement, applying the Bruneauer-Emmett-Teller (BET) method [78] at 77 K (Micromeritics Tristar 3000). All samples were degassed at 150°C for 1h prior to analysis. The diameter of particles were calculated from dBET = 6/SSABET × ρsample, where SSABET is the specific surface area (m2/g), ρsamples are the density of ZnO (ρZnO = 5.61 × 10³ kg/m3 [65]) and the density of palladium (ρPd = 12.02 g/cm3 [79]).
The surface morphology, elemental compositions, and accurate size of the ZnO and Pd nanoparticles were further investigated by atomic force microscopy (AFM, Nano Scope IIIa, Veeco Digital instrument), scanning electron microscopy (SEM, JSM-6335F, JEOL, EDS line scan mode), and high-resolution transmission electron microscopy (HR-TEM) measurements, respectively. The AFM observations were performed by means of a Digital microscope Model Nanoscope IIIa. The HR-TEM mode was observed using the Tecanai 30F microscope (Philips; field emission cathode, operated at 300 kV). HR-TEM images were obtained using a slow-scan CCD camera. For scanning-transmission electron microscopy (STEM), the material was dispersed in ethanol and deposited onto a perforated carbon foil supported on a copper grid. The STEM micrographs were obtained with a high-angle annular dark-field (HAADF) detector, reveal the metal particles (bright spots) with bright contrast (Z contrast). The focused electron beam was then set on some of the bright points to analyze the Pd particles deposited on ZnO support qualitatively by energy dispersive X-ray spectrometry (EDS) attached to the Tecnai F30 microscope. Noble metal (Pd) dispersion was determined by CO-pulse chemisorption at 40°C using He gas with a flow rate of 50 mL/min and a pulse of 0.5 mL (10% CO in He, Micromeritics Autochem II 2920 unit). Prior to analysis, all samples were pretreated for 30 min at 350°C under flowing O2, cooled down to 300°C in He and then treated at 300°C for 30 min in H2. In order to calculate the Pd-dispersion, an adsorption stoichiometry of Pd/CO = 2 was assumed [80, 81]. Pd particle size was then calculated assuming spherical Pd particles, which is a rough estimation.
2.3. Sensor Preparation
Al2O3 substrates interdigitated with Au electrodes (Au/Al2O3) (10×10×0.1 mm; Electronics Design Center, MicroFabrication Lab, Case Western Reserve University) were used as sensor substrates and designated as A0. An appropriate quantity of homogeneous mixed solution (0.28 mL) was prepared by stirring ethyl cellulose (Fluka, 30-60 mPa.s) as the temporary binder and terpineol (Aldrich, 90%) as a solvent. The viscous mixture was combined with samples P0, P1, P3, and P5 (70 mg) and mixed for 30 min to form a paste prior to doctor-blading. The resulting paste was doctor-bladed [52, 53, 73, 74] on the Au/Al2O3 substrates.
The substrate was taped (Scotch Magic™ tape; Art. Nr.11110300, Ethilux, Germany) around the edges, which roughly controls film thickness to approximately 5 μm prior to doctor-blading. We believe that the tape plays an important role in creating a thick film layer by providing a template for film formation. The resulting substrates were heated in an oven at 400°C for 2h with a heating rate of 2°C/min for binder removal [82-87] and cooled down to 20°C with the heating rate of 5°C/min prior to the sensing test. Finally, the Au bonding was fabricated using pure Au wires (Alfa Aesar, 0.2 mm (0.008in) dia, 99.9% (metal basis)) that were put through the tiny holes of gold electrodes by soldering.
2.4. Characterization of Gas Sensing Properties and Mass Spectrometry Measurements
The characterization of gas sensing properties was performed according to the procedure described by Liewhiran et al. [53]. The sensitivity, S is defined in the following as the resistance ratio Ra/Rg for the reducing gas (ethanol) [25, 46, 52, 53], where Ra is the resistance in dry air, and Rg is the resistance in test gas. The response time, Tres is defined as the time required until 90% of the response signal is reached. The recovery times, Trec denotes the time needed until 90% of the original baseline signal is recovered [52, 53]. Furthermore, the experimental set up had a mass spectrometer (MS) connected for an oxidation process measurement. After the sensors fabricated using samples P0, P1, P3, and P5 had been tested, they were designated as S0, S1, S3, and S5, respectively. Finally, the film thickness of sensing layers and elemental compositions were further analyzed by SEM and EDS analyses.
3. Results and Discussion
3.1. Particle Properties
3.1.1. X-ray Diffraction and BET Analyses
Figure 3 shows the XRD patterns of samples as-prepared (P0-P5), Au/Al2O3 substrate (A0), and sensor after annealing and sensing test at 400°C (S0, S1, S3, and S5). The samples P0-P5 were highly crystalline and all peaks can be confirmed to be the hexagonal structure of ZnO (Inorganic Crystal Structure Database [ICSD] Coll. Code: 067454 [88]), which also match well with the model of Abrahams et al. [89]. Amorphous phase and Pd peaks were not found in these patterns. It can be assumed that the size of Pd particles was very small, which affected the appearance of the Pd peaks. The diffraction peaks were slightly sharp for sensor samples after annealing and sensing at 400°C (S0, S1, S3, and S5) as compared to nanopowder as-prepared (P0, P1, P3, and P5), suggesting relatively larger particles.
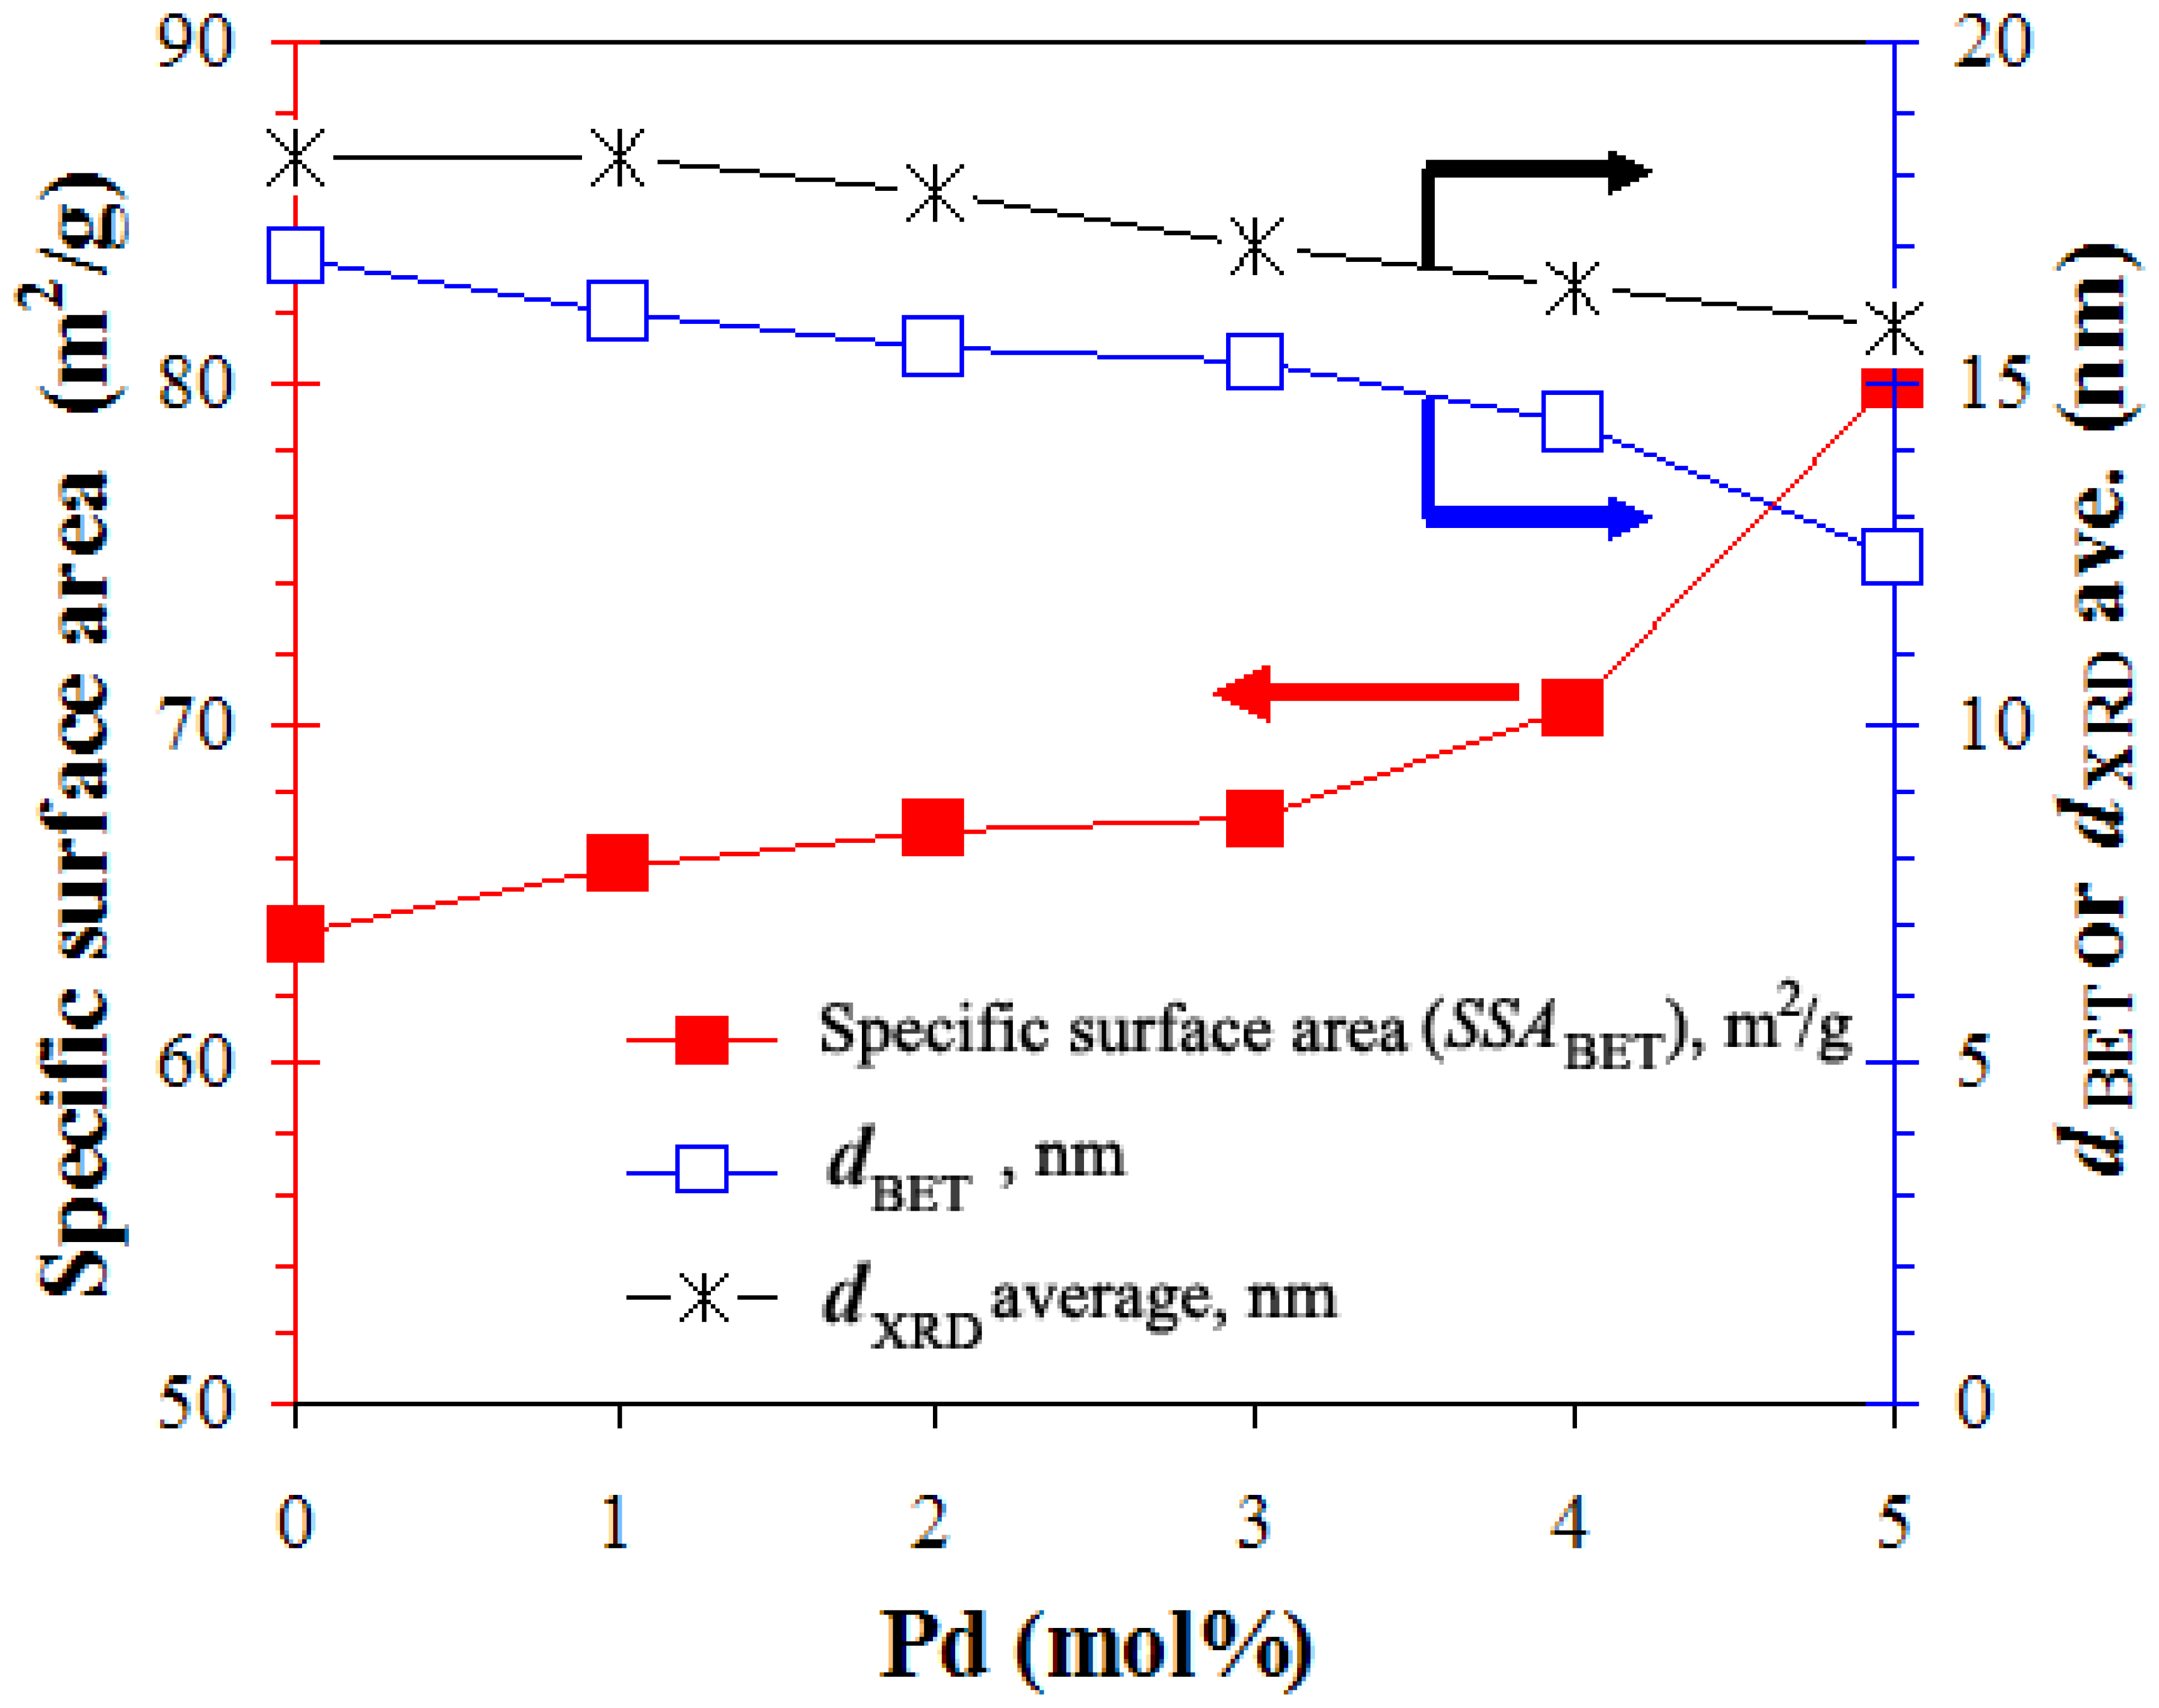
The diffraction patterns of Al2O3 (modified structural parameters of ICSD Coll. Code: No. 085137 [90]) (filled diamonds) and Au (modified structural parameters of ICSD Coll. CAS No. 7440-57-5 [91]) (filled rectangular) from the substrates were also visible in the A0, S0, S1, S3, and S5, especially, sensors S1, S3, and S5 showed ZnO peaks (filled circles) were also appeared in these patterns, which can clearly confirm thick film sensing layer based on flame made ZnO and Pd/ZnO nanoparticles, and also the Au (111) peak showed evidently the strongest peak in terms of intensity. The average crystal sizes (dXRD ave.) were calculated by the fundamental parameter approach Rietveld method [77] based on the half-maximum widths of Sherrer's equation [92] using the TOPAS-3 software, which compared with the average BET-equivalent particle diameter (dBET) as shown in Figure 4. With the Pd concentration increased (P0 to P5), the specific surface area increased (P0 to P5: 63.7 to 80.1 m2/g) with decreasing dBET (P0 to P5: 16.8 to 12.4 nm) and dXRD average sizes (P0 to P5: 18.3 to 15.8 m2/g).
3.1.2. Atomic Force Microscopy (AFM) Analysis
AFM measurements were performed to study the differences on the surface morphology between samples P0, P1, and P5 prior to sensor fabrication and the sensing test. The micrographs of samples P0, P1, and P5 are presented in Figures 5(a), (b), and (c), respectively, over scales of 500 nm × 500 nm. Here it has been observed that the samples had agglomerated particles. The average grain sizes were found to be almost in the same range of 10-30 nm for all of samples. The surface roughness profiles were analyzed based on the sectional analysis of the surface of sample P0, P1, and P5, as shown in Figures 5(d), (e), and (f), respectively. The quite smooth surface was clearly evident for ZnO; on the contrary, an increasing Pd concentration appeared as a relatively rough surface. Meanwhile, the mean roughness value derived from surface roughness profiles was 5.37 nm for pure ZnO (P0) whereas the mean roughness value for 1 and 5 mol%Pd/ZnO nanoparticles (P1 and P5) was 6.19 and 9.36, respectively. It can be observed that the mean roughness value increased with increasing the Pd concentration. For 1 mol% and 5 mol% Pd-doped ZnO nanoparticles, the root mean square (RMS) values of roughness was found to be 7.80 and 12.34 nm, which higher than the undoped ZnO nanoparticles (P0), RMS = 6.74 nm. The RMS values of roughness were found increasing with an increase in Pd concentrations. To explain this result, it can be speculated as follows: during the noble metal particles (Pd) formation and deposition on the particle support (ZnO) processes in the flame, the Pd created a new nucleation centers, which in turn changed the nucleation type from homogeneous to heterogeneous, and deteriorated the deposition forming leading to the agglomeration of the tiny Pd particles at high doping level. The Pd dispersion was quite poor in an agglomeration of particles affected to the larger Pd particles. Nevertheless, the Pd dispersion, the Pd sizes and the accurate size of particle can be determined by the CO-pulse chemisorption, STEM, and HR-TEM measurements.
3.1.3. Scanning Electron Microscopy (SEM) Analysis
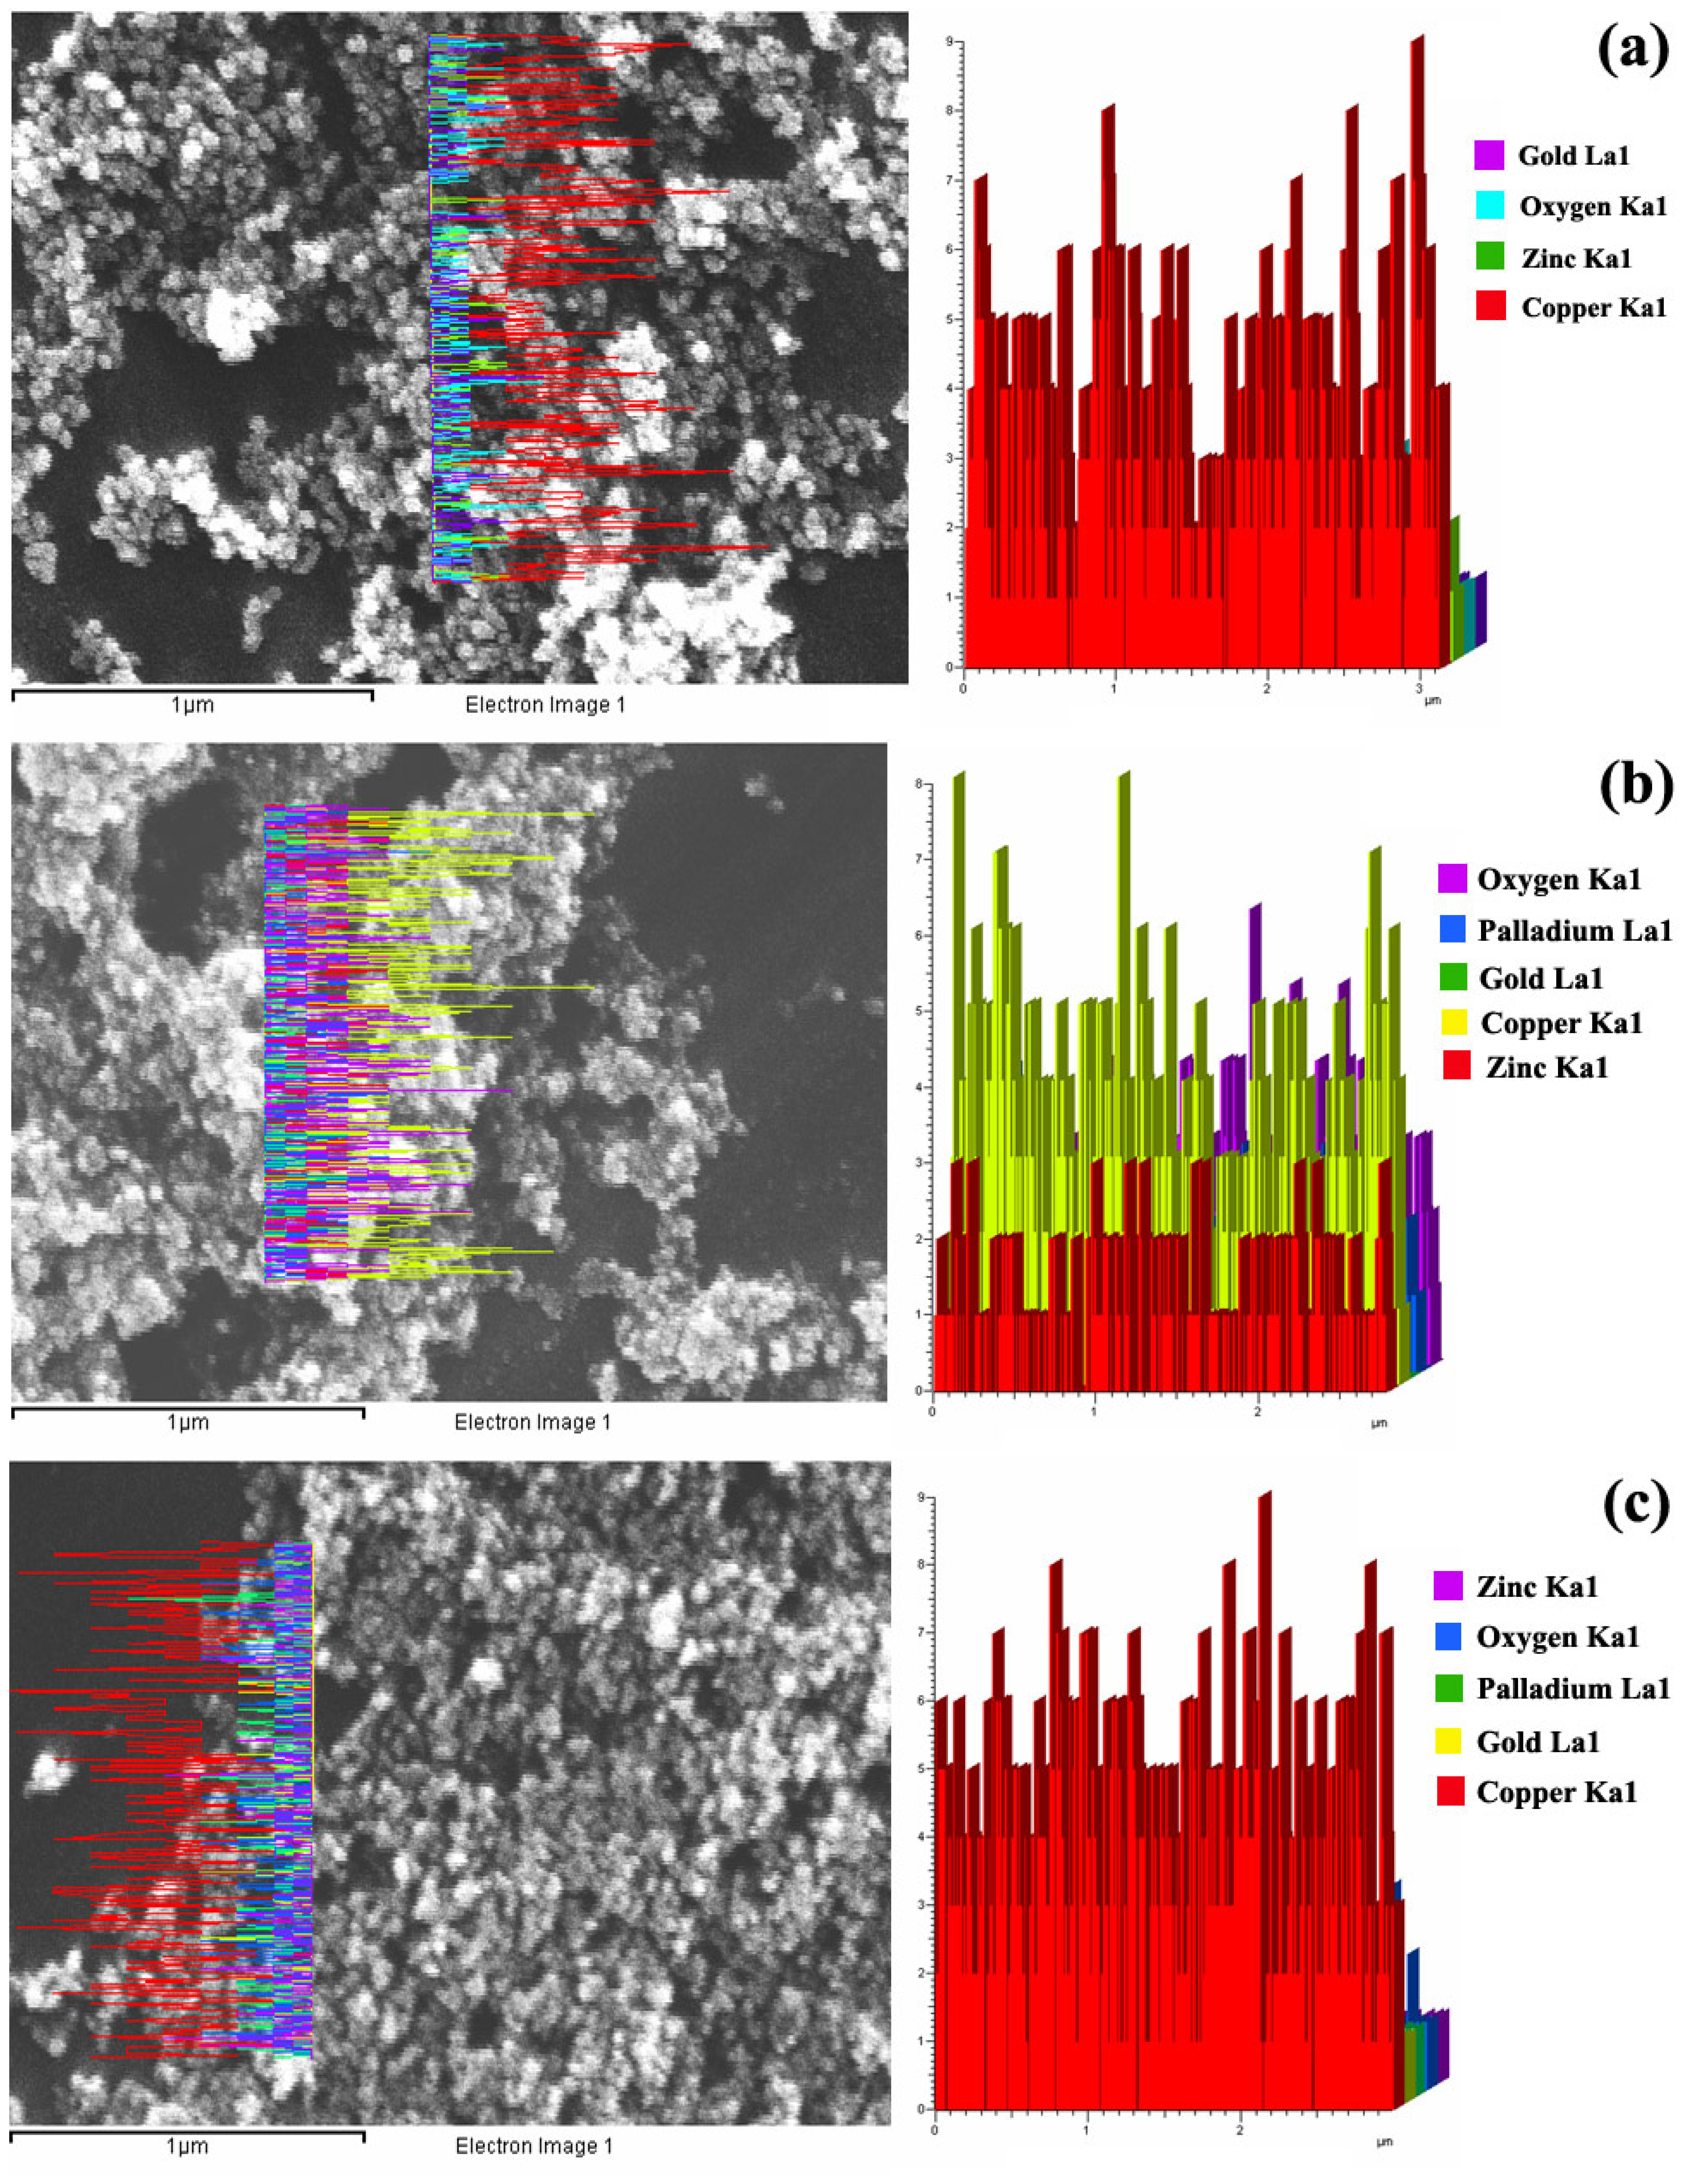
Figure 6 shows SEM images of highly crystalline flame-made (5/5) (a) pure ZnO (P0) and doped with (b-f) 1-5 mol%Pd/ZnO (P1-P5) nanoparticles at high magnification (100K). The morphology showed rather a dispersion of particles, with diameters ranging from 10–20 nm in all samples. It can be noticed that as the Pd concentration increased, the ZnO particles size did not increase. In addition, the trends in the elemental composition of the agglomerated nanoparticles formed in samples P0, P1, and P5 are shown by the EDS line scan mode in Figures 7(a), (b), and (c), respectively. Interestingly, the analyzed regions were composed of the nanoparticles, the copper grid, and gold sputtering prior to an analyzing. The line scan across the agglomerate for pure ZnO (P0) is indicated in Figure 7(a). The right side showed the elemental histograms corresponding to a rich in copper (Cu) caused by the contamination of copper grid, poor gold (Au), zinc (Zn), and oxygen (O). Moreover, the EDS line scans of Pd dopant were shown in Figures 7(b) and 7(c) with the lowest (P1) and the highest (P5) Pd concentrations. While the SEM images provide 3-D morphology and estimated particle sizes, TEM images can reveal internal structure and a more accurate measurement of particle size and morphology.
3.1.4. High Resolution-Transmission Electron Microscopy (HR-TEM) Analysis
Figure 8 shows HR-TEM bright-field images of samples (a-c) P0 and (d-f) P5 with different magnifications. The corresponding diffraction patterns are shown in the insets. The diffraction patterns illustrate spot patterns of the hexagonal structure of ZnO, indicating the ZnO nanoparticles are highly crystalline, which is in good agreement with the XRD data. Figures 8(a-f) show the TEM bright-field images of the FSP (5/5) made nanoparticles, which were polyhedral aggregated of primary particles. Figure 8(a) shows the morphologies of flame made (5/5) ZnO nanoparticles containing mainly spheroidal particles typically with diameters ranging from 10-20 nm with occasional hexagonal and rod-like particles. The crystalline sizes of ZnO hexagonal particles were in the range of 10-20 nm, and nanorod-like particles were in the range of 10-20 nm in width, and 20-50 nm in length. The primary particle diameters observed by TEM were consistent with both the dBET and the dXRD. This is consistent with the data of Tani et al. [65], Height et al. [71, 72] and Liewhiran et al. [52, 53]. Figure 8(f) shows that the sizes of Pd nanoparticles were very tiny, when compared with the size of ZnO nanoparticles.
3.1.5. Scanning-Transmission Electron Microscopy (STEM) Analysis
Figures 9(a, b) show STEM images of sample P5. The images show an agglomerated structure of ZnO nanoparticles (gray regions) decorated which discrete Pd particles (bright regions). Figures 9(c, d) gives the EDS elemental composition signal associated which each of the two regions as indicated in Figure 9 (b). Points 1 and point 2 emphasized clearly yield a signal corresponding to Zn (1, 8.7, 9.6 KeV), and Pd (2.5-3.5, 21.2, 21.4, 24.5 KeV), while Cu (0.9, 8.1, 8.9 KeV) caused by the contamination from the copper grid. It can be clearly seen that the particle sizes in the doped sample were not affected by Pd, due to the fact that Pd cannot form a solid solution in the crystal structure of ZnO. The sizes of Pd nanoparticles were found to be ranging from 2-12 nm.
3.1.6. CO-pulse Chemisorption Measurement
The influence of Pd additive on the dispersion is shown in Figure 10. From this data, it can be clearly seen that when the Pd concentration increased, the corresponding trend of Pd-dispersion/% decreased as the Pd particle sizes increased. Without knowing the actual stoichiometry, the Pd particles sizes are roughly estimated. Larger crystallite diameters indicate clumping and clusters of Pd, translating into poor dispersion of the Pd on ZnO support. The Pd particles sizes were in the range of 5-13 nm, which is in good agreement with almost in the same range of Pd sizes (2-12 nm) determined correspondingly by STEM micrographs.
3.2. Gas Sensing Properties
Figure 11(a) shows the sensitivity (S) and response time (Tres) versus the ethanol concentrations ranging from 25-250 ppm plot for the sensors S0, S1, S3, and S5 during forward cycle towards reducing gas ethanol at 400°C. The resistance decreased drastically during the gas exposure, a typical behavior for ZnO as an n-type semiconductor [26, 52, 53]. The sensitivities of sensor S1 were found to increase rather linearly with increasing ethanol concentrations. As the Pd concentration increased from 1 to 5 mol%, it can be clearly seen that the lowest Pd concentration (S1) can improve the sensor behavior in terms of sensitivity (to 250 ppm, S=65.7) and response times, which evidently are better than S3 and S5. Further increase of the Pd concentration increased the response time and deteriorated the sensitivity (Figure 11(a). The sensor S1 showed the fastest response to ethanol vapor, whereas the response of the undoped sensor (S0) was slightly sluggish. The role of the palladium in enhancing the sensitivity and response rate of the sensor could be due to the electronic interaction between the sensitizer and the semi-conducting material. Figure 11(b) shows the change in resistance of sensor S1 under exposure to reducing gas ethanol at 25-250 ppm at 400°C during forward and backward cycle. The resistance drastically decreased during the gas exposure with increasing ethanol concentration. Figure 11(c) shows the plot of sensitivity of S1 during the forward (filled triangles, left axis) and backward (filled rectangles, left axis) cycle of the ethanol sensor test in Figure 11(b). The sensitivity consistently increased with increasing ethanol concentration. The forward and backward cycles nearly coincide though the response time during the forward cycle was slightly lower than the backward. On the other hand, the sensitivity during the forward cycle was slightly higher than the backward one. The response (solid line, right axis) and recovery time (dashed line, right axis) times during the forward cycle (open triangles) and backward (open rectangles) cycle were also included in Figure 11(c). Tres was within seconds during the backward and forward cycle; this slightly decreased at increasing ethanol concentrations (in the order of 10 s). Tres was 60 and 15 s during the forward cycle at 25 and 250 ppm, respectively. Compared with the same material references reported, Baruwati et al. [43] reported the response characteristics for 0.1 wt% Pd/ZnO nanoparticles to 200 ppm ethanol gas at 170°C. The response and recovery times were found to be 60 s, and 10 s, respectively. Compared with undoped material references reported by Liu et al. [22], these sensors produced from flame-made ZnO nanoparticles have higher sensor signal and shorter response times than those made from ZnO single crystal flakes with different sizes and morphology of particles (to 300 ppm, S=14.3, Tres=62 s).
Moreover, Choopun et al. [32] reported that ZnO nanobelts RF-sputtered onto a copper tube. The sensor was tested at operating temperatures ranging from 200-290°C with ethanol concentration levels of 50-2000 ppm, e.g. at 220°C, when the ethanol concentration increased from 50 to 1000 ppm, the sensor signal increased from 7.3 to 23.2. In addition, Lv et al. [33] reported that the sensor fabricated from ZnO nanorods with average diameter about 95 nm and tested at operating temperatures ranging from 150-450°C under exposure of ethanol gas. It showed the highest sensing performance (to 100 ppm, S=120) at 450°C. The sensor signal to 1000 ppm ethanol gas enhanced with the increasing of operating temperature from 293 to 450°C. Also Zhu et al. [46] reported that ZnO nanorods and needle-shaped had a sensor response of 12 to 100 ppm of ethanol at 420°C. For comparison with other doping materials, Chou et al. [47] reported the ethanol sensing of ZnO doped with Al thin films prepared by RF magnetron sputtering on Si substrate interdigitated with Pt electrodes. The gas sensing results showed the sensor signal for detecting 400 ppm ethanol vapor was about 20 at 250°C. The response and recovery times were about 2-4 min, with good reproducibility. Comparing with different materials, Teleki et al. [15] reported the flame-made TiO2 spherical particles film about 30 μm thick prepared by drop-coating of heptanol suspension of these powders, and the sensing test at 500°C with ethanol at concentration ranging from 10-75 ppm. A sensor showed the highest sensor signal at 75 ppm (S=30) in ethanol concentration. The response and recovery times of the sensor based on flame-made ZnO nanoparticles were within a few minutes for pure ZnO. After Pd incorporation, the response time decreased to seconds (in the order of 10 s).
The noble metal (Pd) additive was showing fast response to alcohol vapors, whereas without palladium the response of the sensor is slightly sluggish [44]. This is because the addition of a noble metal is very important for the detection of a specific gas like ethanol. The role of the palladium in enhancing the sensitivity and response rate of the sensor element could be due to the electronic interaction between the sensitizer and the semi-conducting material. Further addition of Pd was primarily important for increasing the sensitivity, response rate and the selectivity of the sensor. This can be elaborated by considering the role of different contributions individually to the sensing phenomenon as follows:
When the metal-semiconductor (Pd–ZnO) contact is formed, a barrier is formed at the interface that is fully characterized by the electron affinity of the semiconductor, the work function (i.e. the minimum energy required to take out electron from the metal surface) of the metal and the surface state density of the semiconductor inside the energy gap [43]. In equilibrium and in the absence of any gas, if the metal work function is large, a depletion layer will be developed in the semiconductor. For those metals with high work function, this depletion region of electrons is much more pronounced, which gives rise to a larger barrier height. This manifests a larger electrical resistance of the sensor material (semiconductor and metal) in air. When exposed to a reducing gas, the change in resistance, because of the decrease in junction barrier height becomes more significant and in effect this increases the value of the gas response.
- -
- Nanostructuring of the based-semiconducting oxide also contributes to the improvement in the gas response by larger surface area because here the complete particle contributes to the gas sensing phenomenon (D ~ 2L, where D is the particle diameter and L is the Debye length). The larger surface area of the materials synthesized also facilitates the gas detection at much lower temperatures [43]. In addition, palladium is known to have a catalytic effect due to its excellent oxidation capability to convert hydrocarbons at lower temperatures making the sensor selective to hydrocarbons [43-45].
Figure 12 illustrates the characteristic MS peak intensities of interactions between reducing gas ethanol and surface-adsorbed oxygen species of sensing layer S1 sample including C2H5OH (mass 46) with those of its oxidation products (CO2 (mass 44) and H2O (mass 18)) versus times in dry air (N2/O2) at 400°C. The ion intensities were shown as rather strong peaks of CO2. This is because CO2 was the majority product oxidized with oxygen on the surface of semiconductor materials.
3.3. SEM-Film thickness sensing layer
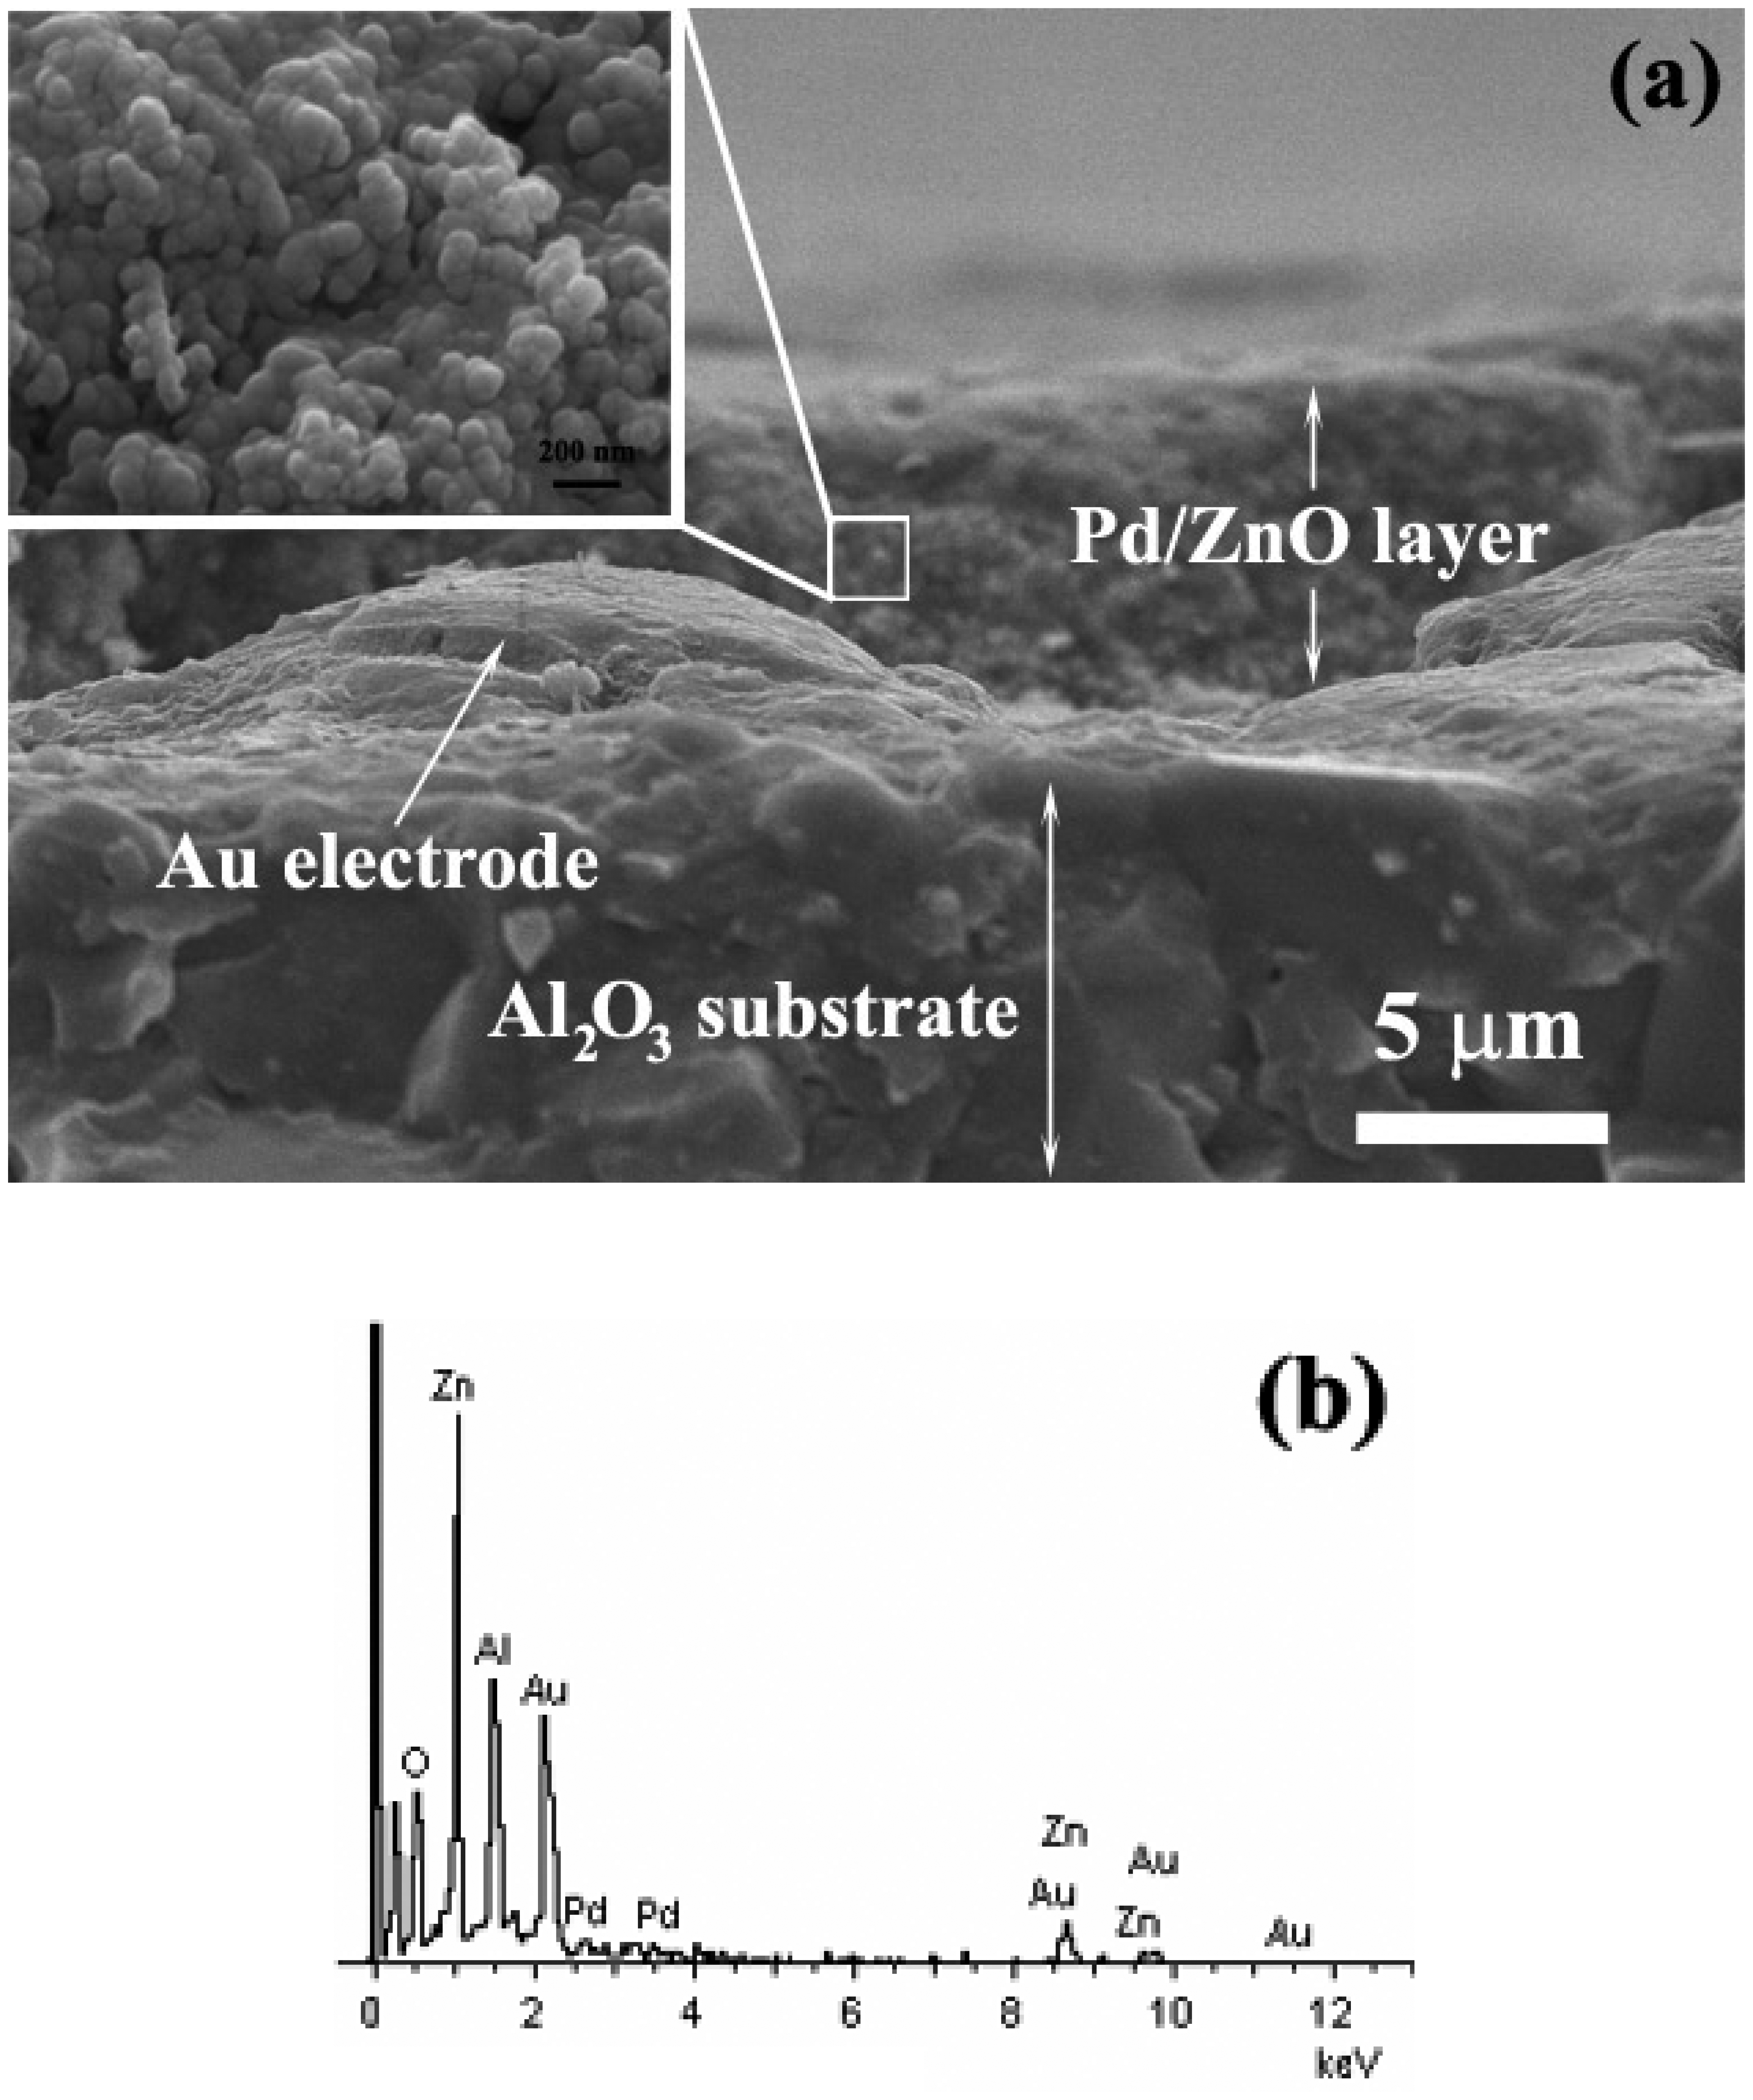
The cross-section, film thickness, and surface morphology of the sensing film layer (S1) after a sensing test at 400°C were observed using SEM analysis as shown in Figure 13(a). The film thickness of sensing film was about 5 μm, which benefited tremendously to ethanol gas sensing properties. The high density Al2O3 substrate interdigitated with Au electrodes was also visible. The square emphasized the investigation selected area at high magnification to an aggregated of primary particles. The particle sizes of nanoparticles slightly changed after annealing and sensing test were also shown in the inset. The EDS elemental mapping is shown in Figure 13(b), which gives the EDS elemental composition signals associated with the whole regions as indicated in Figure 9(a). The EDS elemental signals emphasized clearly yield the signals corresponding to Al, Zn, O, and Pd, while Au caused by the contamination from the gold sputtering, which sputtered prior to an analyzing. After annealing process, a denser film layer was formed. Regularities and preciseness in the film thickness stem from the doctor-blade technique.
4. Conclusions
The flame-made pure ZnO and 1-5mol%Pd/ZnO nanoparticles used as ethanol gas sensors were successfully produced by flame spray pyrolysis. The XRD patterns showed that the particles corresponding to hexagonal phase of ZnO. Pd peaks were not found all of samples, and also the corresponding Al2O3, Au, and ZnO peaks were evidently seen from the flame made ZnO nanoparticles printed on Al2O3 substrate interdigitated with Au electrodes after sensing test at 400°C as an ethanol sensor. The trend of specific surface area increased, the dBET and dXRD average sizes decreased with increasing Pd concentration. The dXRD average sizes calculated using conspicuous peaks based on XRD fitting of flame made ZnO as-prepared and after annealing and sensing test at 400°C were found to be slightly changed. The surface morphology (RMS roughness), elemental compositions, and accurate size of the ZnO and Pd nanoparticles were further investigated by AFM, SEM (EDS line scan mode), and TEM measurements, respectively. The root mean square (RMS) values of roughness were found to increase with an increase in Pd concentrations. The morphologies of ZnO nanoparticles were observed to be mainly spheroidal particles typically with diameters ranging from 10-20 nm with occasional hexagonal and rod-like particles. The crystalline sizes of ZnO hexagonal particles were found to be in the range of 10-20 nm, and nanorod-like particles were found to be ranging from 10-20 nm in width and 20-50 nm in length. The Pd dispersion and Pd particles sizes calculated by CO-pulse chemisorption technique (5-13 nm) and observed by STEM micrographs (2-12 nm) were found to be almost in the same range. For the sensor test, with the lowest Pd concentration and the best Pd-dispersion (S1) showed the best sensitivity and the fastest response time to ethanol concentration of 250 ppm at the sensing operating temperature of 400°C. The sensing performances were deteriorated evidently with increasing Pd concentration. The response times were quite good at lower Pd concentration. MS ion intensities measurement can be clearly confirmed the catalytic effect of Pd and oxidation process with reducing gas ethanol in terms of the oxidation products. Thick (5 μm) ZnO films showed tremendously the sensing characteristics e.g. sensitivity and fast response times (to 250 ppm, 15 s). The recovery times were quite long within minutes. This present study showed the FSP method to control the morphology, sizes, and Pd doping of nanopowders using the appropriate precursor and flame conditions, the effect of Pd loading on ethanol sensing behaviour improvement in terms of sensitivity, shorter response, and recovery times, and their characterizations.
Acknowledgments
The authors gratefully acknowledge the financial support from the Commission on Higher Education, Ministry of Education; the Graduate School, Chiang Mai University, Thailand, the Particle Technology Laboratory (PTL), Institute of Process Engineering, Department of Mechanical and Process Engineering, ETH Zentrum, Switzerland and the Electron Microscopy Research and Service Center (EMRSc), Chiang Mai University, Thailand for experimental facilities.
References
- Sahm, T.; Mädler, L.; Gurlo, A.; Barsan, N.; Pratsinis, S.E.; Weimar, U. Flame spray synthesis of tin dioxide nanoparticles for gas sensing. Sens. Actuators B 2004, 98, 148–153. [Google Scholar]
- Neri, G.; Bonavita, A.; Micali, G.; Donato, N.; Deorsola, F.A.; Mossino, P.; Amato, I.; Benedetti, B.D. Ethanol sensors based on Pt-doped tin oxide nanopowders synthesised by gel-combustion. Sens. Actuators B 2006, 117, 196–204. [Google Scholar]
- Li, F.; Xu, J.; Yu, X.; Chen, L.; Zhu, J.; Yang, Z.; Xin, X. One-step solid-state reaction synthesis and gas sensing property of tin oxide nanoparticles. Sens. Actuators B 2002, 81, 165–169. [Google Scholar]
- Rella, R.; Serra, A.; Siciliano, P.; Vasanelli, L.; De, G.; Licciulli, A.; Quirini, A. Tin oxide-based gas sensors prepared by the sol-gel process. Sens. Actuators B 1997, 44, 462–467. [Google Scholar]
- Maekawa, T.; Tamaki, J.; Miura, N.; Yamazoe, N. Development of SnO2-based ethanol gas sensor. Sens. Actuators B 1992, 9, 63–69. [Google Scholar]
- Gautheron, B.; Labeau, M.; Delabouglise, G.; Schmatz, U. Undoped and Pd-doped SnO2thin films for gas sensors. Sens. Actuators B 1993, 15-16, 357–362. [Google Scholar]
- Ivanov, P.; Hubalek, J.; Prášek, K.; Vilanova, X.; Llobet, E.; Correig, X. A route toward more selective and less humidity sensitive screen-printed SnO2 and WO3 gas sensitive layers. Sens. Actuators B 2004, 100, 221–227. [Google Scholar]
- Tan, O.K.; Cao, W.; Zhu, W.; Chai, J.W.; Pan, J.S. Ethanol sensors based on nano-sized α-Fe2O3 with SnO2, ZrO2, TiO2 solid solutions. Sens. Actuators B 2003, 93, 396–401. [Google Scholar]
- Mädler, L.; Roessler, A.; Pratsinis, S.E.; Sahm, T.; Gurlo, A.; Barsan, N.; Weimar, U. Direct formation of highly porous gas-sensing films by in situ thermophoretic deposition of flame-made Pt/SnO2 nanoparticles. Sens. Actuators B 2006, 114(1), 283–295. [Google Scholar]
- Ge, J.P.; Wang, J.; Zhang, H.X.; Wang, X.; Peng, Q.; Li, Y.D. High ethanol sensitive SnO2 microspheres. Sens. Actuators B 2006, 113, 937–943. [Google Scholar]
- Fang, Y.K.; Lee, J.J. A tin oxide thin film sensor with high ethanol sensitivity. Thin Solid Films 1989, 169, 51–56. [Google Scholar]
- Heilig, A.; Barsan, N.; Weimar, U.; Göpel, W. Selectivity enhancement of SnO2 gas sensors: simultaneous monitoring of resistances and temperatures. Sens. Actuators B 1999, 58, 302–309. [Google Scholar]
- Makhija, K.K.; Ray, A.; Patel, R.M.; Trivedi, U.B.; Kapse, H.N. Indium oxide thin film based ammonia gas and ethanol vapour sensor. Bull. Mater. Sci. 2005, 28, 9–17. [Google Scholar]
- Xiangfeng, C.; Caihong, W.; Dongli, J.; Chenmou, Z. Ethanol sensor based on indium oxide nanowires prepared by carbothermal reduction reaction. Chem. Phys. Lett. 2004, 399, 461–464. [Google Scholar]
- Teleki, A.; Pratsinis, S.E.; Kalyanasundaram, K.; Gouma, P.I. Sensing of organic vapors by flame-made TiO2 nanoparticles. Sens. Actuators B 2006, 119, 683–690. [Google Scholar]
- Sberveglieri, G.; Comini, E.; Faglia, G.; Atashbar, M.Z.; Wlodarski, W. Titanium dioxide thin films prepared for alcohol microsensor applications. Sens. Actuators B 2000, 66, 139–141. [Google Scholar]
- Mabrook, M.; Hawkins, P. A rapidly-responding sensor for benzene, methanol and ethanol vapours based on films of titanium dioxide dispersed in a polymer operating at room temperature. Sens. Actuators B 2001, 75, 197–202. [Google Scholar]
- Ruiz, A.M.; Cornet, A.; Morante, J.R. Performances of La-TiO2nanoparticles as gas sensing material. Sens. Actuators B 2005, 111-112, 7–12. [Google Scholar]
- Galatsis, K.; Li, Y.X.; Wlodarski, W.; Comini, E.; Sberveglieri, G.; Cantalini, C.; Santucci, S.; Passacantando, M. Comparison of single and binary oxide MoO3, TiO2 and WO3 sol-gel gas sensors. Sens. Actuators B 2002, 83, 276–280. [Google Scholar]
- Ferroni, M.; Guidi, V.; Martinelli, G.; Roncarati, G.; Comini, E.; Sberveglieri, G.; Vomiero, A.; Della Mea, G. Coalescence inhibition in nanosized titania films and related effects on chemoresistive properties towards ethanol. J. Vac. Sci. Technol. B 2002, 20(2), 523–530. [Google Scholar]
- Zhang, J.; Liu, J.; Peng, Q.; Wang, X.; Li, Y. Nearly monodisperse Cu2O and CuO nanospheres: Preparation and applications for sensitive gas sensors. Chem. Mater. 2006, 18, 867–871. [Google Scholar]
- Liu, Y.; Dong, J.; Hesketh, P.J.; Liu, M. Synthesis and gas sensing properties of ZnO single crystal flakes. J. Mater. Chem. 2005, 15, 2316–2320. [Google Scholar]
- Xiangfeng, C.; Dongli, J.; Djurišic, A.B.; Leung, Y.H. Gas-sensing properties of thick film based on ZnO nano-tetrapods. Chem. Phys. Lett. 2005, 401, 426–429. [Google Scholar]
- Sahay, P.P.; Tewari, S.; Jha, S.; Shamsuddin, M. Sprayed ZnO thin films for ethanol sensor. J. Mater. Sci. 2005, 40, 4791–4793. [Google Scholar]
- Xu, J.; Chen, Y.; Li, Y.; Shen, J. Gas sensing properties of ZnO nanorods prepared by hydrothermal method. J. Mater. Sci. 2005, 40, 2919–2921. [Google Scholar]
- Wan, Q.; Li, Q.H.; Chen, Y.J.; He, X.L.; Li, J.P.; Lin, C.L.; Wang, T.H. Fabrication and ethanol sensing characteristics of ZnO nanowire gas sensors. Appl. Phys. Lett. 2004, 84, 3654–3656. [Google Scholar]
- Xu, J.; Pan, Q.; Shun, Y.; Tian, Z. Grain size control and gas sensing properties of ZnO gas sensor. Sens. Actuators B 2000, 66, 277–279. [Google Scholar]
- Xu, H.; Liu, X.; Cui, D.; Li, M.; Jiang, M. A novel method for improving the performance of ZnO gas sensors. Sens. Actuators B 2006, 114, 301–307. [Google Scholar]
- Arshak, K.; Gaidan, I. Development of a novel gas sensor based on oxide thick films. Mater. Sci. Eng. B 2005, 118, 44–49. [Google Scholar]
- Cheng, X.L.; Zhao, H.; Huo, L.H.; Gao, S.; Zhao, J.G. ZnO nanoparticulate thin film: preparation, characterization and gas-sensing property. Sens. Actuators B 2004, 102, 248–252. [Google Scholar]
- Tang, H.; Li, Y.; Zheng, C.; Ye, J.; Hou, X.; Lv, Y. An ethanol sensor based on cataluminescence on ZnO nanoparticles. Talanta 2007, 72, 1593–1597. [Google Scholar]
- Choopun, S.; Hongsith, N.; Mangkorntong, P.; Mangkornthong, N. Zinc oxide nanobelts by RF sputtering for ethanol sensor. Physica E 2007, in press. [Google Scholar]
- Lv, Y.; Guo, L.; Xu, H.; Chu, X. Gas-sensing properties of well-crystalline ZnO nanorods grown by a simple route. Physica E 2007, 36, 102–105. [Google Scholar]
- Zhou, X.; Jiang, T.; Zhang, J.; Wang, X.; Zhu, Z. Humidity sensor based on quartz tuning fork coated with sol-gel-derived nanocrystalline zinc oxide thin film. Sens. Actuators B 2006, 123, 299–305. [Google Scholar]
- Gao, T.; Wang, T.H. Synthesis and properties of multipod-shaped ZnO nanorods for gas-sensor applications. Appl. Phys. A 2005, 80, 1451–1454. [Google Scholar]
- Feng, X.; Li, Z.J.; Wang, P.; Zhou, Y. Preparation and gas-sensitivity of ultra-fine zinc-oxide powders from roasted zinc-blended. J. Mater. Sci. 2005, 40, 6597–6600. [Google Scholar]
- Feng, P.; Wan, Q.; Wang, T.H. Contact-controlled sensing properties of flowerlike ZnO nanostructure. Appl. Phys. Lett. 2005, 87, 213111–213113. [Google Scholar]
- Delaunay, J.J.; Kakoiyama, N.; Yamada, I. Fabrication of three-dimensional network of ZnO tetrapods and its response to ethanol. Mater. Chem. Phys. 2007, in press. [Google Scholar]
- Stambolova, I.; Konstantinov, K.; Vassilev, S.; Peshev, P.; Tsacheva, Ts. Lanthanum doped SnO2 and ZnO thin films sensitive to ethanol and humidity. Mater. Chem. Phys. 2000, 63, 104–108. [Google Scholar]
- Rout, C.S.; Krishna, S.H.; Vivekchand, S.R.C.; Govindaraj, A.; Rao, C.N.R. Hydrogen and ethanol sensors based on ZnO nanorods, nanowires and nanotubes. Chem. Phys. Lett. 2005, 418, 582–586. [Google Scholar]
- Paraguay, F.D.; Yoshida, M.M.; Morales, J.; Solis, J.; Estrada, W.L. Influence of Al, In, Cu, Fe and Sn dopants on the response of thin films ZnO gas sensor to ethanol vapour. Thin Solid Films 2000, 373, 137–140. [Google Scholar]
- Raju, A.R.; Rao, C.N.R. Gas-sensing characteristics of ZnO and copper-impregnated ZnO. Sens. Actuators B 1991, 3, 305–310. [Google Scholar]
- Baruwati, B.; Kumar, D.K.; Manorama, S.V. Hydrothermal synthesis of highly crystalline ZnO nanoparticles: A competitive sensor for LPG and EtOH. Sens. Actuators B 2006, 119, 676–682. [Google Scholar]
- Rao, B.B. Zinc oxide ceramic semi-conductor gas sensor for ethanol vapour. Mater. Chem. Phys. 2000, 64, 62–65. [Google Scholar]
- Xu, J.; Chen, Y.; Chen, D.; Shen, J. Hydrothermal synthesis and gas sensing characters of ZnO nanorods. Sens. Actuators B 2006, 113, 526–531. [Google Scholar]
- Zhu, B.L.; Zeng, D.W.; Wu, J.; Song, W.L.; Xie, C.S. Synthesis and gas sensitivity of In-doped ZnO nanoparticles. J. Mater. Sci. - Mater. Electron. 2003, 14, 521–526. [Google Scholar]
- Chou, S.M.; Teoh, L.G.; Lai, W.H.; Su, Y.H.; Hon, M.H. ZnO:Al thin film gas sensor for detection of ethanol vapor. Sensor 2006, 6, 1420–1427. [Google Scholar]
- Ge, C.; Xie, C.; Cai, S. Preparation and gas-sensing properties of Ce-doped ZnO thin film sensors by dip-coating. Mater. Sci. Eng. B 2007, 137, 53–58. [Google Scholar]
- Hsueh, T.J.; Hsu, C.L.; Chang, S.J.; Chen, I.C. Laterally grown ZnO nanowire ethanol gas sensors. Sens. Actuators B 2007, in press. [Google Scholar]
- Wegner, K.; Stark, W.J.; Pratsinis, S.E. Flame-nozzle synthesis of nanoparticles with closely controlled size, morphology and crystallinity. Mater. Lett. 2002, 55, 318–321. [Google Scholar]
- Liewhiran, C.; Seraphin, S.; Phanichphant, S. Synthesis of nano-sized ZnO powders by thermal decomposition of zinc acetate using Broussonetia papyrifera (L.) Vent pulp as a dispersant. Curr. Appl. Phys. 2006, 6, 499–502. [Google Scholar]
- Liewhiran, C.; Phanichphant, S. Influence of thickness on ethanol sensing characteristics of doctor-bladed thick film from flame-made ZnO nanoparticles. Sensors 2007, 7, 185–201. [Google Scholar]
- Liewhiran, C.; Phanichphant, S. Improvement of flame-made nanoparticulate thick film morphology for ethanol sensing. Sensors 2007, 7, 650–675. [Google Scholar]
- Purica, M.; Budianu, E.; Rusu, E.; Danila, M.; Gavrila, R. Optical and structural investigation of ZnO thin films prepared by chemical vapor deposition (CVD). Thin Solid Films 2002, 403-404, 485–488. [Google Scholar]
- Dayan, N.J.; Karekar, R.N.; Aiyer, R.C.; Sainkar, S.R. Effect of film thickness and curing temperature on the sensitivity of ZnO:Sb thick-film hydrogen sensor. J. Mater. Sci. - Mater. Electron. 1997, 8, 277–279. [Google Scholar]
- Zheng, L.; Xu, T.; Li, G.; Yin, Q. Influence of thickness on oxygen-sensing properties of TiO2 thin films on Al2O3. Jpn. J. Appl. Phys., Part 1 2002, 41, 4655–4658. [Google Scholar]
- Lee, Y.L.; Sheu, C.Y.; Hsiao, R.H. Gas sensing characteristics of copper phthalocyanine films; effects of film thickness and sensing temperature. Sens. Actuators B 2004, 99, 281–287. [Google Scholar]
- Hossein-Babari, F.; Orvatinia, M. Analysis of thickness dependence of the sensitivity in thin film resistive gas sensors. Sens. Actuators B 2003, 89, 256–261. [Google Scholar]
- Geistlinger, H. Electron theory of thin-film gas sensors. Sens. Actuators B 1993, 17, 47–60. [Google Scholar]
- López, M.A.R.; Peiteado, M.; Fernández, J.F.; Caballero, A.C.; Holc, J.; Drnovsek, S.; Kuscer, D.; Macek, S.; Kosec, M. Thick film ZnO based varistors prepared by screen printing. J. Eur. Ceram. Soc. 2006, 26, 2985–2989. [Google Scholar]
- Chang, J.F.; Kuo, H.H.; Leu, I.C.; Hon, M.H. The effects of thickness and operation temperature on ZnO:Al thin film CO gas sensor. Sens. Actuators B 2002, 84, 258–264. [Google Scholar]
- Christoulakis, S.; Suchea, M.; Koudoumas, E.; Katharakis, M.; Katsarakis, N.; Kiriakidis, G. Thickness influence on surface morphology and ozone sensing properties of nanostructured ZnO transparent thin films grown by PLD. Appl. Surf. Sci. 2006, 252, 5351–5354. [Google Scholar]
- Sakai, G.; Baik, N.S.; Miura, N.; Yamazoe, N. Gas sensing properties of tin oxide thin films fabricated from hydrothermally treated nanoparticles dependence of CO and H2 response on film thickness. Sens. Actuators B 2001, 77, 116–121. [Google Scholar]
- Pratsinis, S.E. Flame aerosol synthesis of ceramic powders. Prog. Energy Comust. Sci. 1998, 24, 197–219. [Google Scholar]
- Tani, T.; Mädler, L.; Pratsinis, S.E. Homogeneous ZnO nanoparticles by flame spray pyrolysis. J. Nanopart. Res. 2002, 4, 337–343. [Google Scholar]
- Mädler, L.; Kammler, H.K.; Mueller, R.; Pratsinis, S.E. Controlled synthesis of nanostructured particles by flame spray pyrolysis. J. Aeros. Sci. 2002, 33, 369–389. [Google Scholar]
- Mueller, R.; Mädler, L.; Pratsinis, S.E. Nanoparticle synthesis at high production rates by flame spray pyrolysis. Chem. Eng. Sci. 2003, 58, 1969–1976. [Google Scholar]
- Mädler, L. Liquid-fed aerosol reactors for one-step synthesis of nano-structured particles. KONA 2004, 22, 107–120. [Google Scholar]
- Kammler, H.K.; Mädler, L.; Pratsinis, S.E. Flame synthesis of nanoparticles. Chem. Eng. Tech. 2001, 24, 583–596. [Google Scholar]
- Mädler, L.; Stark, W.J.; Pratsinis, S.E. Rapid synthesis of stable ZnO quantum dots. J. Appl. Phys. 2002, 92, 6537–6540. [Google Scholar]
- Height, M.J.; Mädler, L.; Krumeich, F.; Pratsinis, S.E. Nanorods of ZnO made by flame spray pyrolysis. Chem. Mater. 2006, 18, 572–578. [Google Scholar]
- Height, M.J.; Pratsinis, S.E.; Mekasuwandumrong, O.; Praserthdam, P. Ag-ZnO catalysts for UV-photodegradation of methylene blue. Appl. Catal., B 2005, 63, 305–312. [Google Scholar]
- Kaelin, M.; Zogg, H.; Tiwari, A.N.; Wilhelm, O.; Pratsinis, S.E.; Meyer, T.; Meyer, A. Electrosprayed and selenized Cu/In metal particles films. Thin Solid Films 2004, 457, 391–396. [Google Scholar]
- Kaelin, M.; Rudmann, D.; Tiwari, A.N. Low cost processing of CIGS thin film solar cells. Sol. Energy. 2004, 77, 749–756. [Google Scholar]
- Wagh, M.S.; Patil, L.A.; Seth, T.; Amalnerkar, D.P. Surface cupricated SnO2-ZnO thick films as a H2S gas sensor. Mater. Chem. Phys. 2004, 84, 228–233. [Google Scholar]
- Strobel, R.; Grunwaldt, J.D.; Camenzind, A.; Pratsinis, S.E.; Baiker, A. Flame-made alumina supported Pd-Pt nanoparticles: structural properties and catalytic behavior in methane combustion. Catal. Lett. 2005, 104, 9–16. [Google Scholar]
- Cheary, R.W.; Coelho, A.A. Axial divergence in a conventional X-ray powder diffractometer. I. Theoretical foundations. J. Appl. Crystallogr. 1998, 31, 851–861. [Google Scholar]
- Brunauer, S.; Emmett, P.; Teller, P.H. Adsorption of gases in multimolecular layers. J. Am. Chem. Soc. 1938, 60, 309–319. [Google Scholar]
- Moreno-Marín, J.C.; Abril, I.; Heredia-Avalos, S.; Garcia-Molina, R. Electronic energy loss of swift H+ and He+ ions in solids with material science applications. Nucl. Instrum. Meth. Phys. Res. Sect. B 2006, 249, 29–33. [Google Scholar]
- Canton, P.; Fagherazzi, G.; Battagliarin, M.; Menegazzo, F.; Pinna, F.; Pernicone, N. Pd/CO average chemisorption stoichiometry in highly dispersed supported Pd/γ-Al2O3 catalysts. Langmuir 2002, 18, 6530–6535. [Google Scholar]
- Canton, P.; Menegazzo, F.; Polizzi, S.; Pinna, F.; Pernicone, N.; Riello, P.; Fagherazzi, G. Structure and size of poly-domain Pd nanoparticles supported on silica. Catal. Lett. 2003, 88, 141–146. [Google Scholar]
- Liu, Z.; Chung, D.D.L. Burnout of the organic vehicle in an electrically conductive thick-film paste. J. Elec. Mater. 2004, 33, 1316–1325. [Google Scholar]
- Krishnan, B.; Nampoori, V.P.N. Screen printed nanosized ZnO thick film. Bull. Mater. Sci. 2005, 28, 239–242. [Google Scholar]
- Yun, K.H.; Yun, K.Y.; Cha, G.Y.; Lee, B.H.; Kim, J.C.; Lee, D.D.; Huh, J.S. Gas sensing characteristics of ZnO-doped SnO2sensors for simulants of the chemical agents. Mater. Sci. Forum 2005, 486-487, 9–12. [Google Scholar]
- Kim, K.B.; Song, Y.H.; Hwang, C.S.; Chung, C.H.; Lee, J.H.; Choi, I.S.; Park, J.H. Efficient electron emissions from printed carbon nanotubes by surface treatments. J. Vac. Sci. Technol. B 2004, 22, 1331–1334. [Google Scholar]
- Kim, C.J.; Kim, K.B.; Kuk, I.H.; Hong, G.W.; Park, S.D.; Yang, S.W.; Shin, H.S. Fabrication and properties of YBa2Cu3O7-δ-Ag composite superconducting wires by plastic extrusion technique. J. Mater. Sci. 1997, 32, 5233–5242. [Google Scholar]
- Arshaka, K.; Twomey, K.; Egan, D. A ceramic thick film humidity sensor based on MnZn ferrite. Sensors 2002, 2, 50–61. [Google Scholar]
- Kisi, E.H.; Elcombe, M.M. u Parameters for the wurtzite structure of ZnS and ZnO using powder neutron diffraction. Acta Crystallogr., Sect. C: Cryst. Struct. Commun. 1989, 45, 1867–1870. [Google Scholar]
- Abrahams, S.C.; Bernstein, J.L. Remeasurement of the structure of hexagonal ZnO. Acta Crystallogr., Sect. B: Struct. Sci. 1969, 25, 1233–1236. [Google Scholar]
- Liu, R.S.; Shi, W.C.; Cheng, Y.C.; Huang, C.Y. Crystal structures and peculiar magnetic properties of alpha- and gamma-(Al2O3) powders. Mod. Phys. Lett. B 1997, 11, 1169–1174. [Google Scholar]
- Swanson, H.E.; Tatge, E. Standard X-ray diffraction powder patterns. National Bureau of Standards 1953, 359, 1–1. [Google Scholar]Z. Angew. Phys.; 1956; Volume 8, pp. 202–205.
- Cullity, B.D. Structure of polycrystalline aggregates; Elements of X-ray diffraction; Addison-Wesley: Massachusetts, 1978; Volume 2, Chapter 9; p. 284. [Google Scholar]
Figure 1.
Schematic of the FSP experimental setup for the synthesis of samples P0-P5. The liquid precursor mixture is rapidly dispersed by a gas stream and ignited by a premixed methane/oxygen flame.
Figure 1.
Schematic of the FSP experimental setup for the synthesis of samples P0-P5. The liquid precursor mixture is rapidly dispersed by a gas stream and ignited by a premixed methane/oxygen flame.
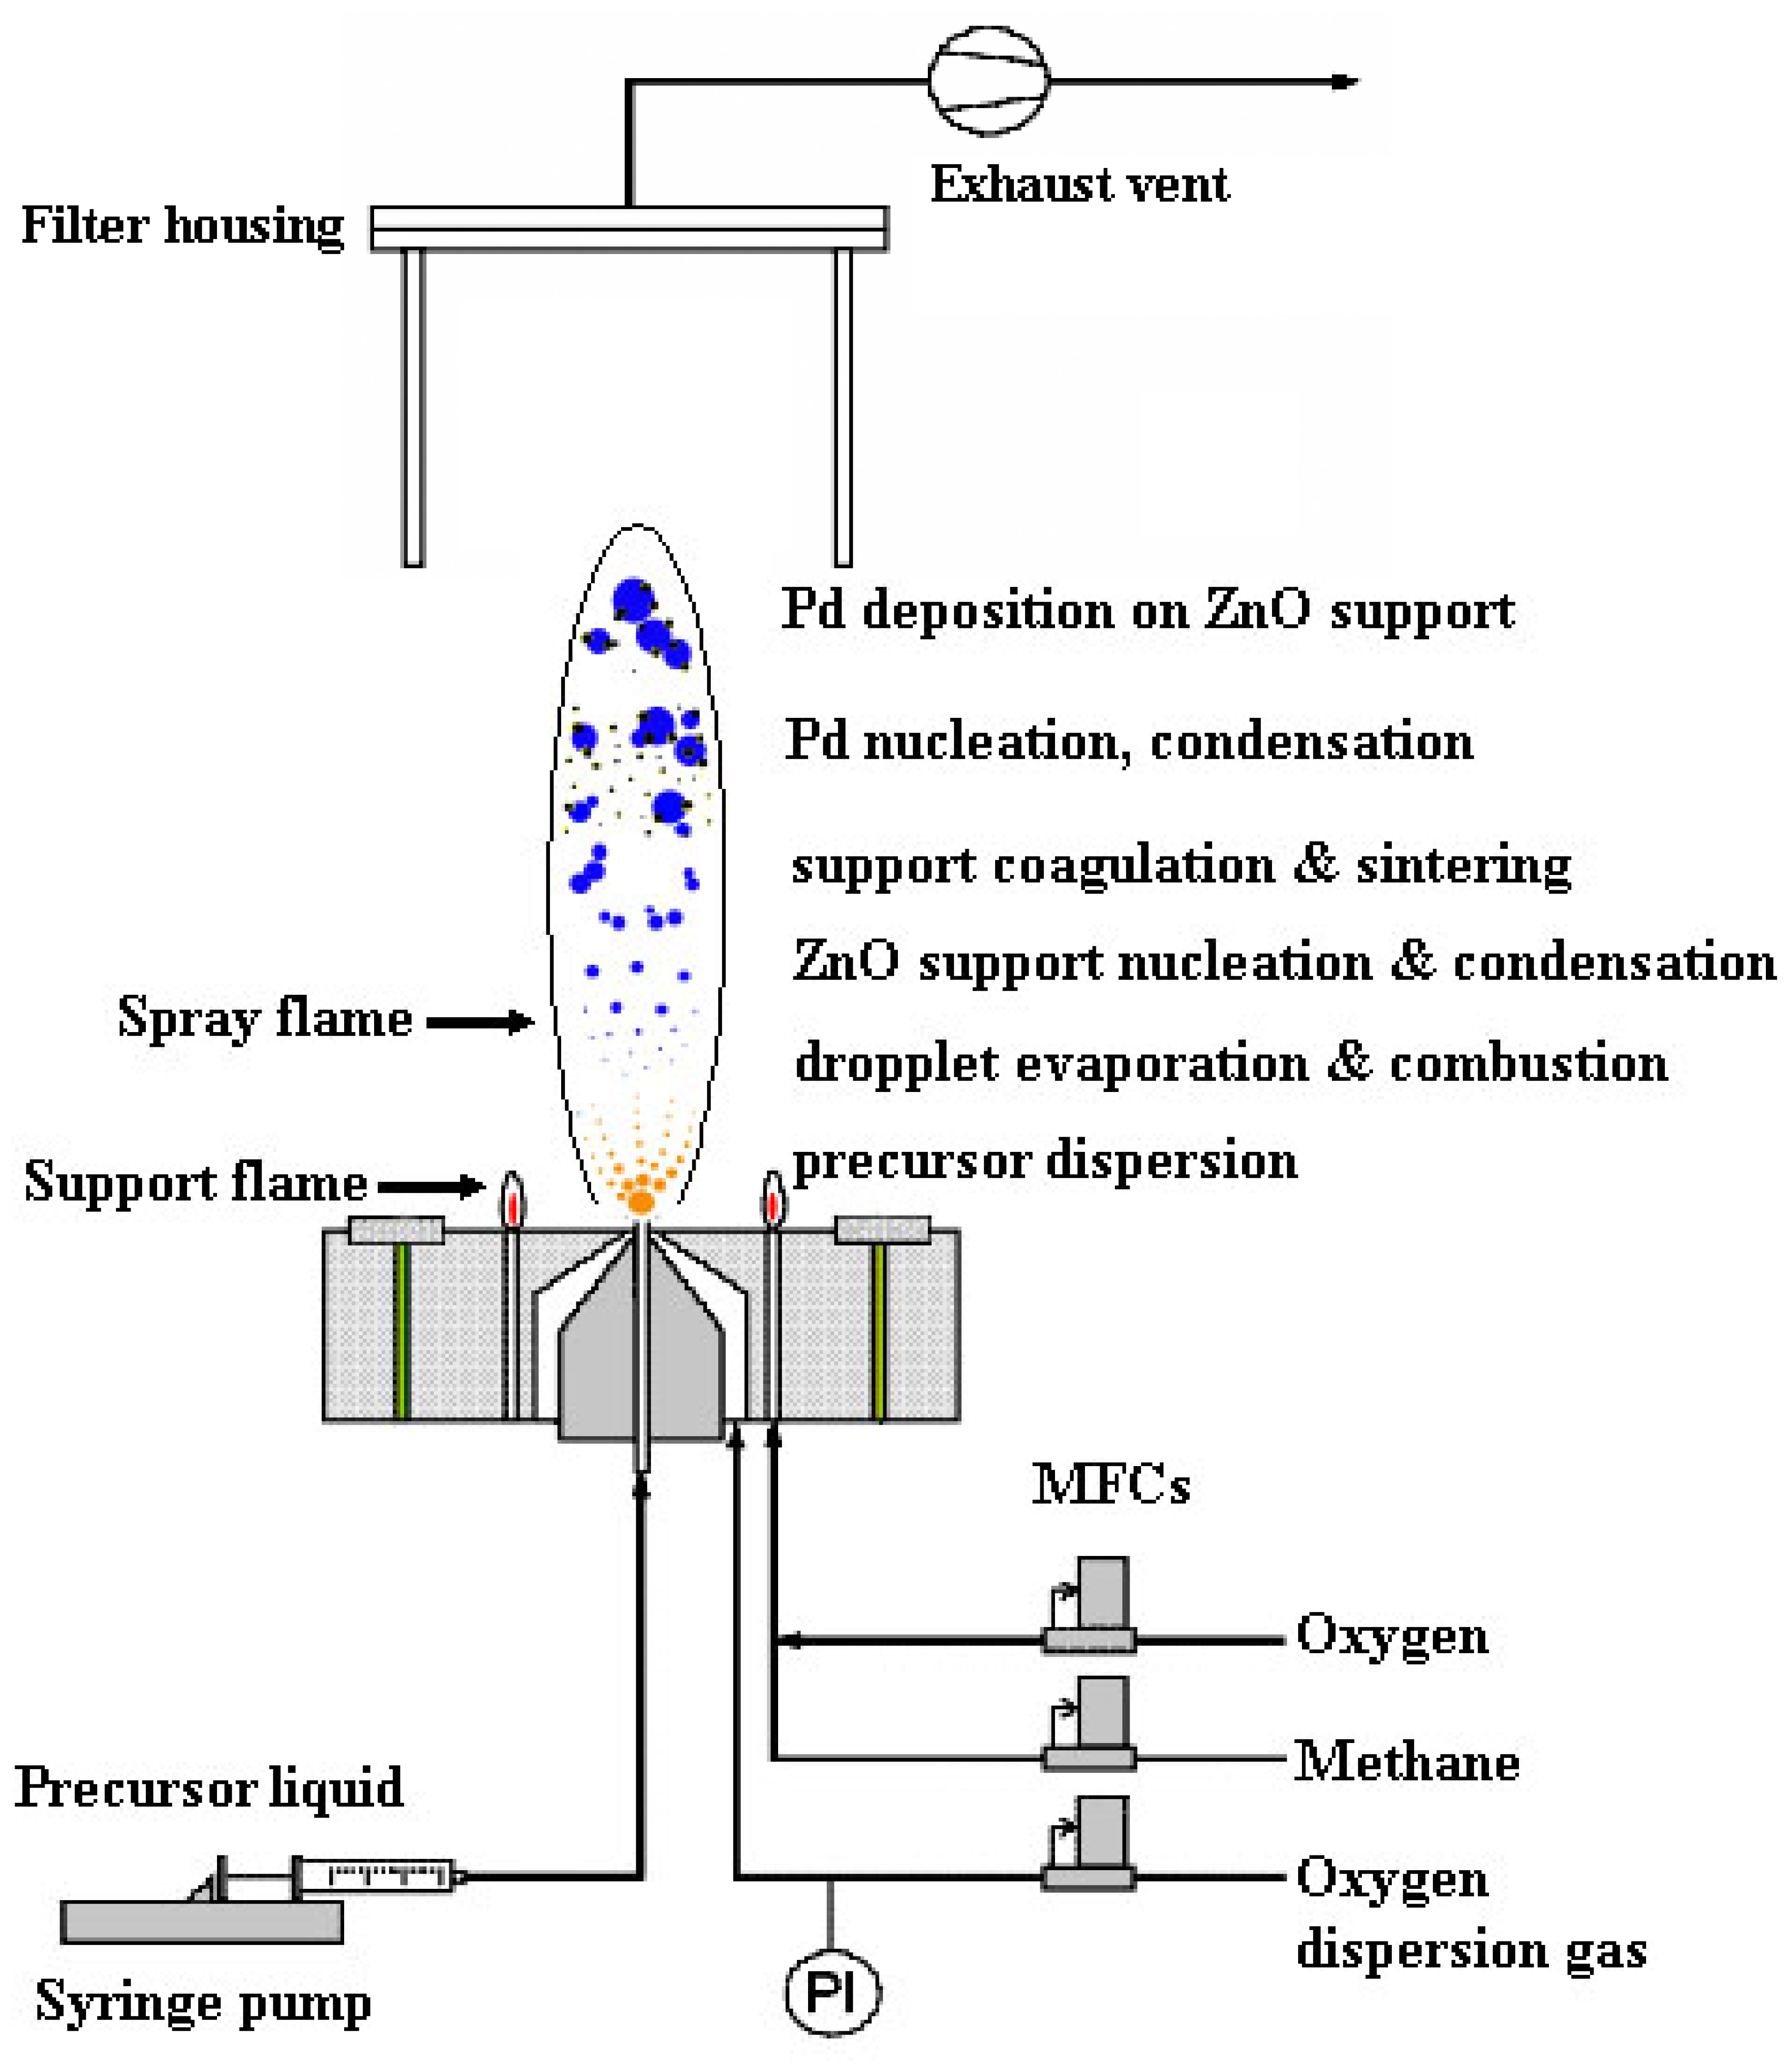
Figure 2.
Spray flame (0.5 M zinc naphtenate and Pd (acac)2 in toluene/acetonitrile (80/20 vol%)) of (a) pure ZnO, (b-f) 1-5 mol%Pd/ZnO nanoparticles producing 5 ml/min of liquid precursor feed rate and dispersed by O2 (5 l/min) at 1.5 bar pressure drop across the nozzle tip. The flame heights were observed ranging from 10-12 cm with slight increasing the combustion enthalpy and Pd concentration.

Figure 3.
XRD patterns of flame-made (5/5) 0-5mol%Pd/ZnO as-prepared (P0-P5), Au/Al2O3 substrate (A0), and samples P0, P1, P3, and P5 were doctor-bladed on Au/Al2O3 substrate after annealing and sensing test at 400 °C (S0, S1, S3, and S5) ((●) ZnO; (▪) Au; (♦) Al2O3).
Figure 3.
XRD patterns of flame-made (5/5) 0-5mol%Pd/ZnO as-prepared (P0-P5), Au/Al2O3 substrate (A0), and samples P0, P1, P3, and P5 were doctor-bladed on Au/Al2O3 substrate after annealing and sensing test at 400 °C (S0, S1, S3, and S5) ((●) ZnO; (▪) Au; (♦) Al2O3).
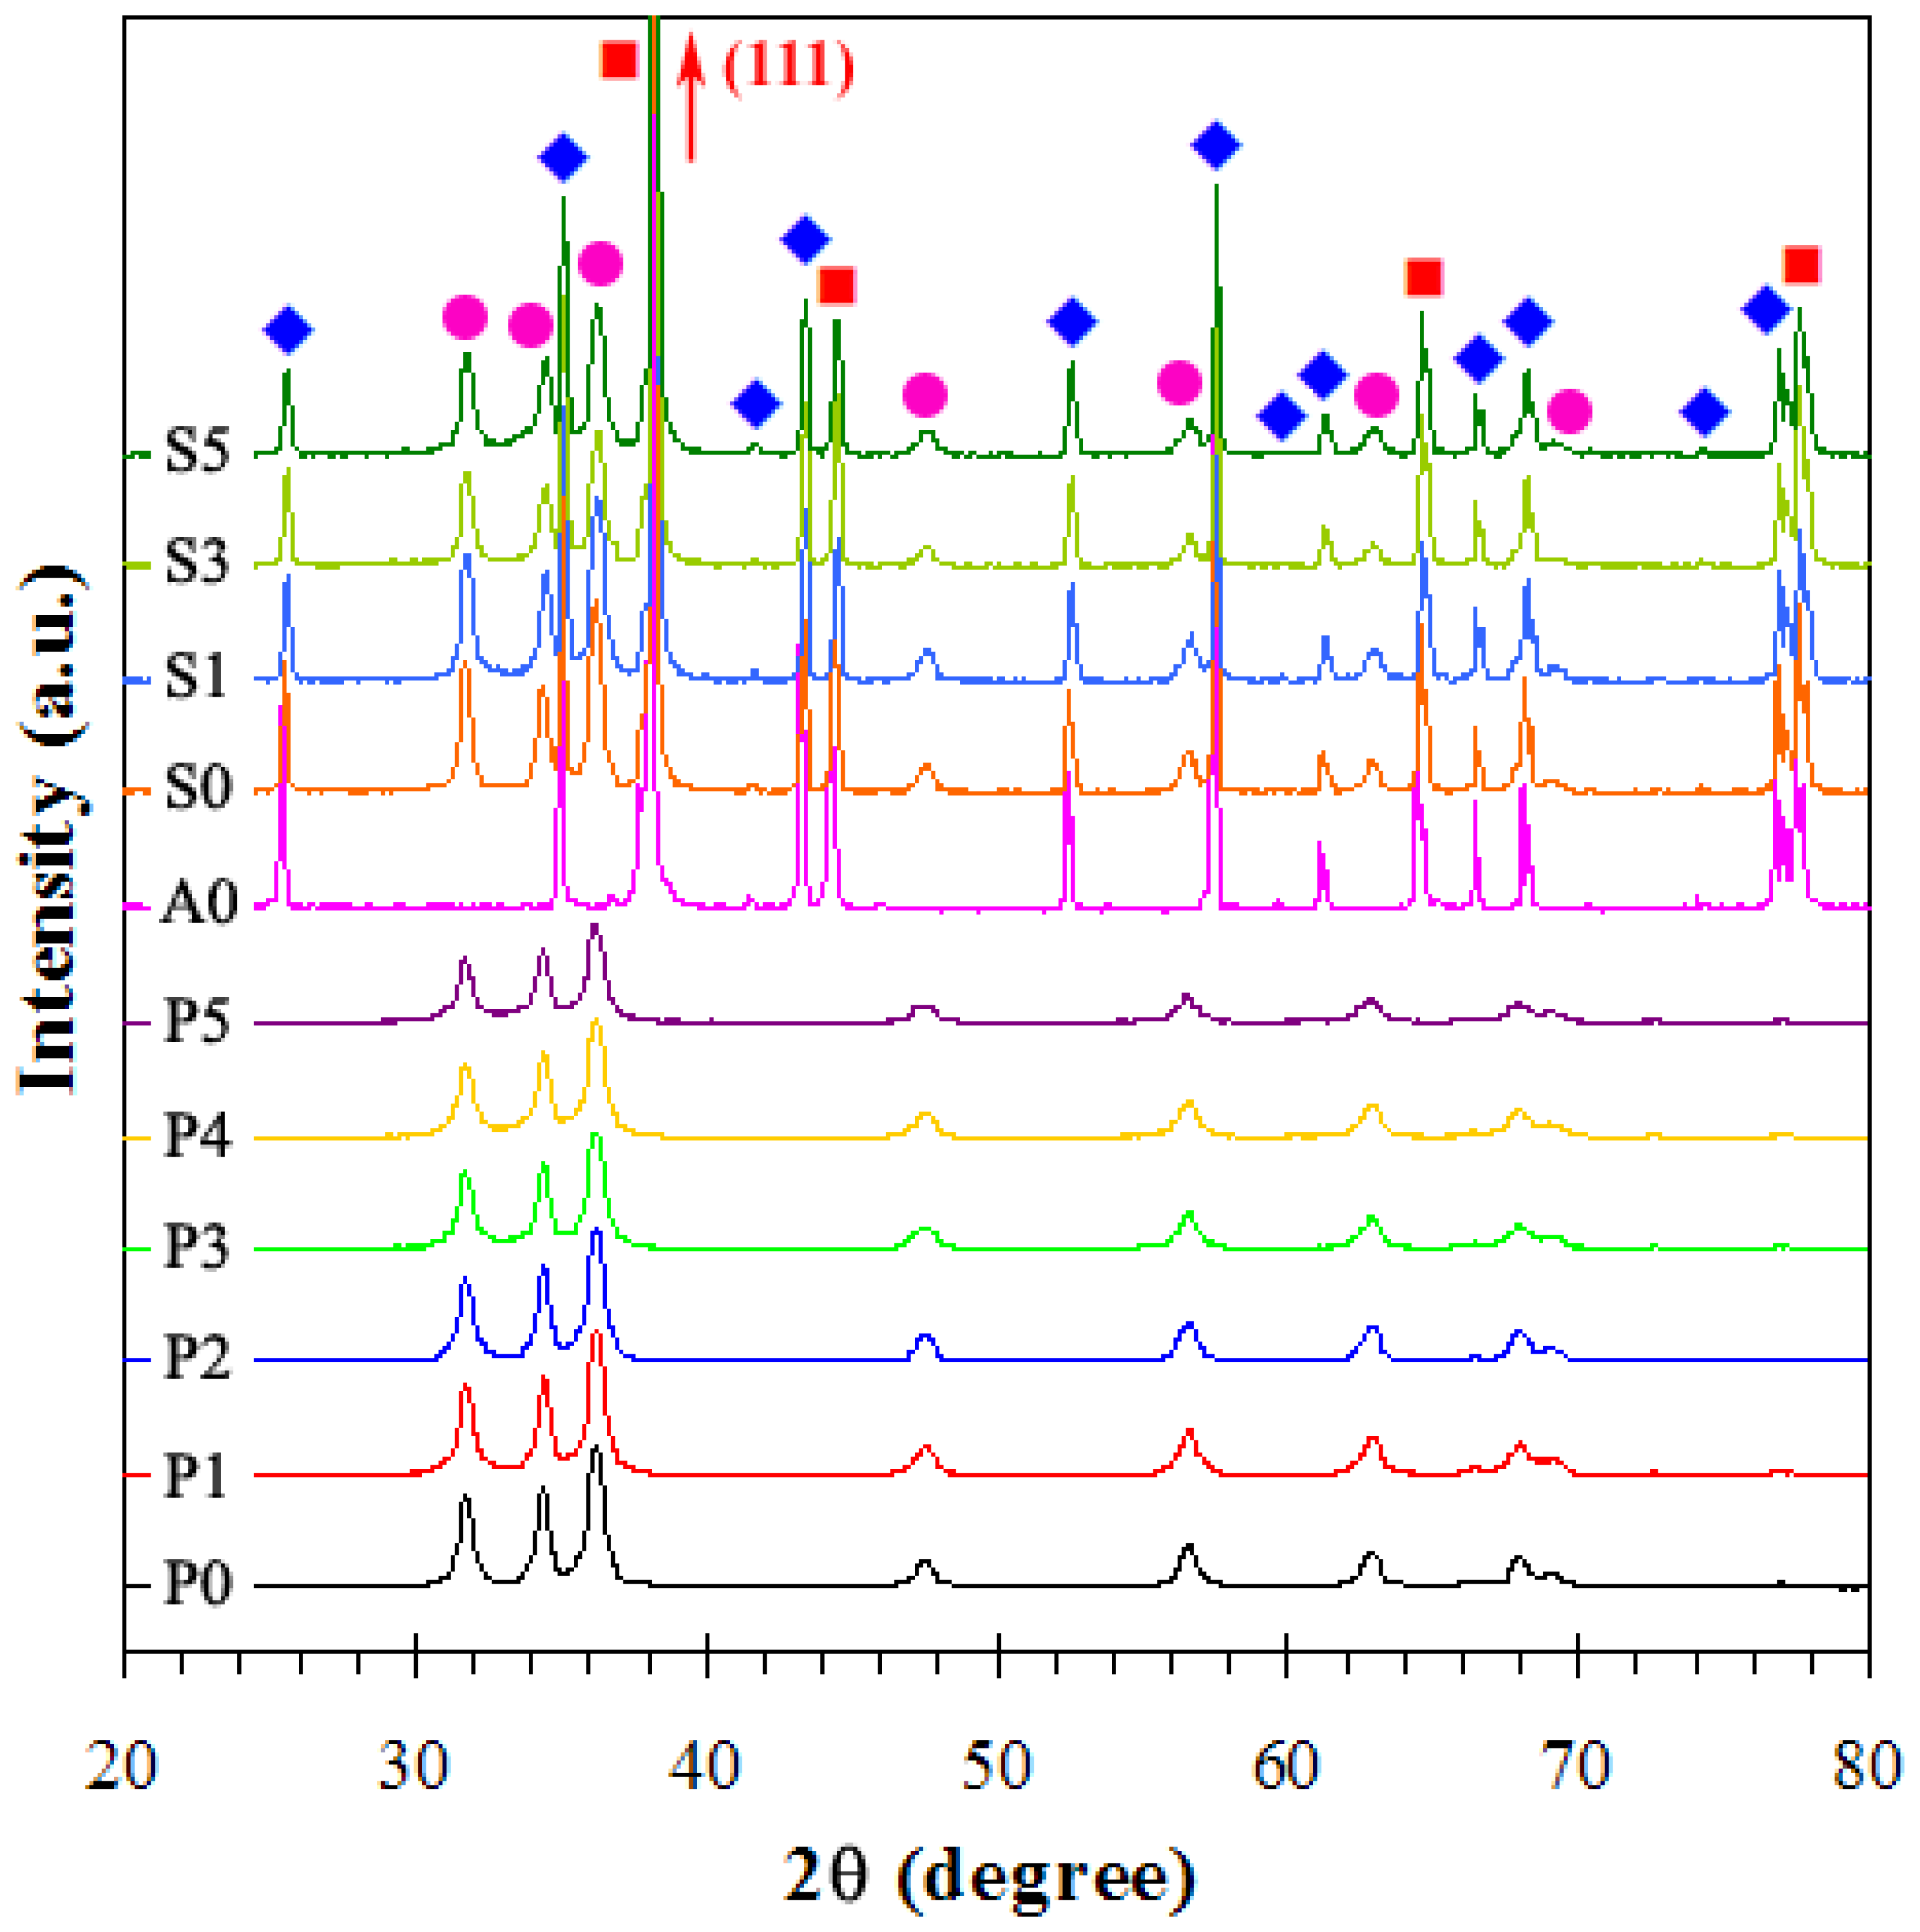
Figure 4.
The specific surface area (SSABET), dBET, and dXRD average sizes as a function of Pd concentration for samples P0-P5.
Figure 4.
The specific surface area (SSABET), dBET, and dXRD average sizes as a function of Pd concentration for samples P0-P5.

Figure 5.
AFM micrographs of (a) pure, (b) 1 mol%, and (c) 5 mol% Pd-doped ZnO nanoparticles. The sectional analysis of surface roughness profiles of (d) pure, (e) 1 mol%, and (f) 5 mol% Pd-doped ZnO nanoparticles.
Figure 5.
AFM micrographs of (a) pure, (b) 1 mol%, and (c) 5 mol% Pd-doped ZnO nanoparticles. The sectional analysis of surface roughness profiles of (d) pure, (e) 1 mol%, and (f) 5 mol% Pd-doped ZnO nanoparticles.
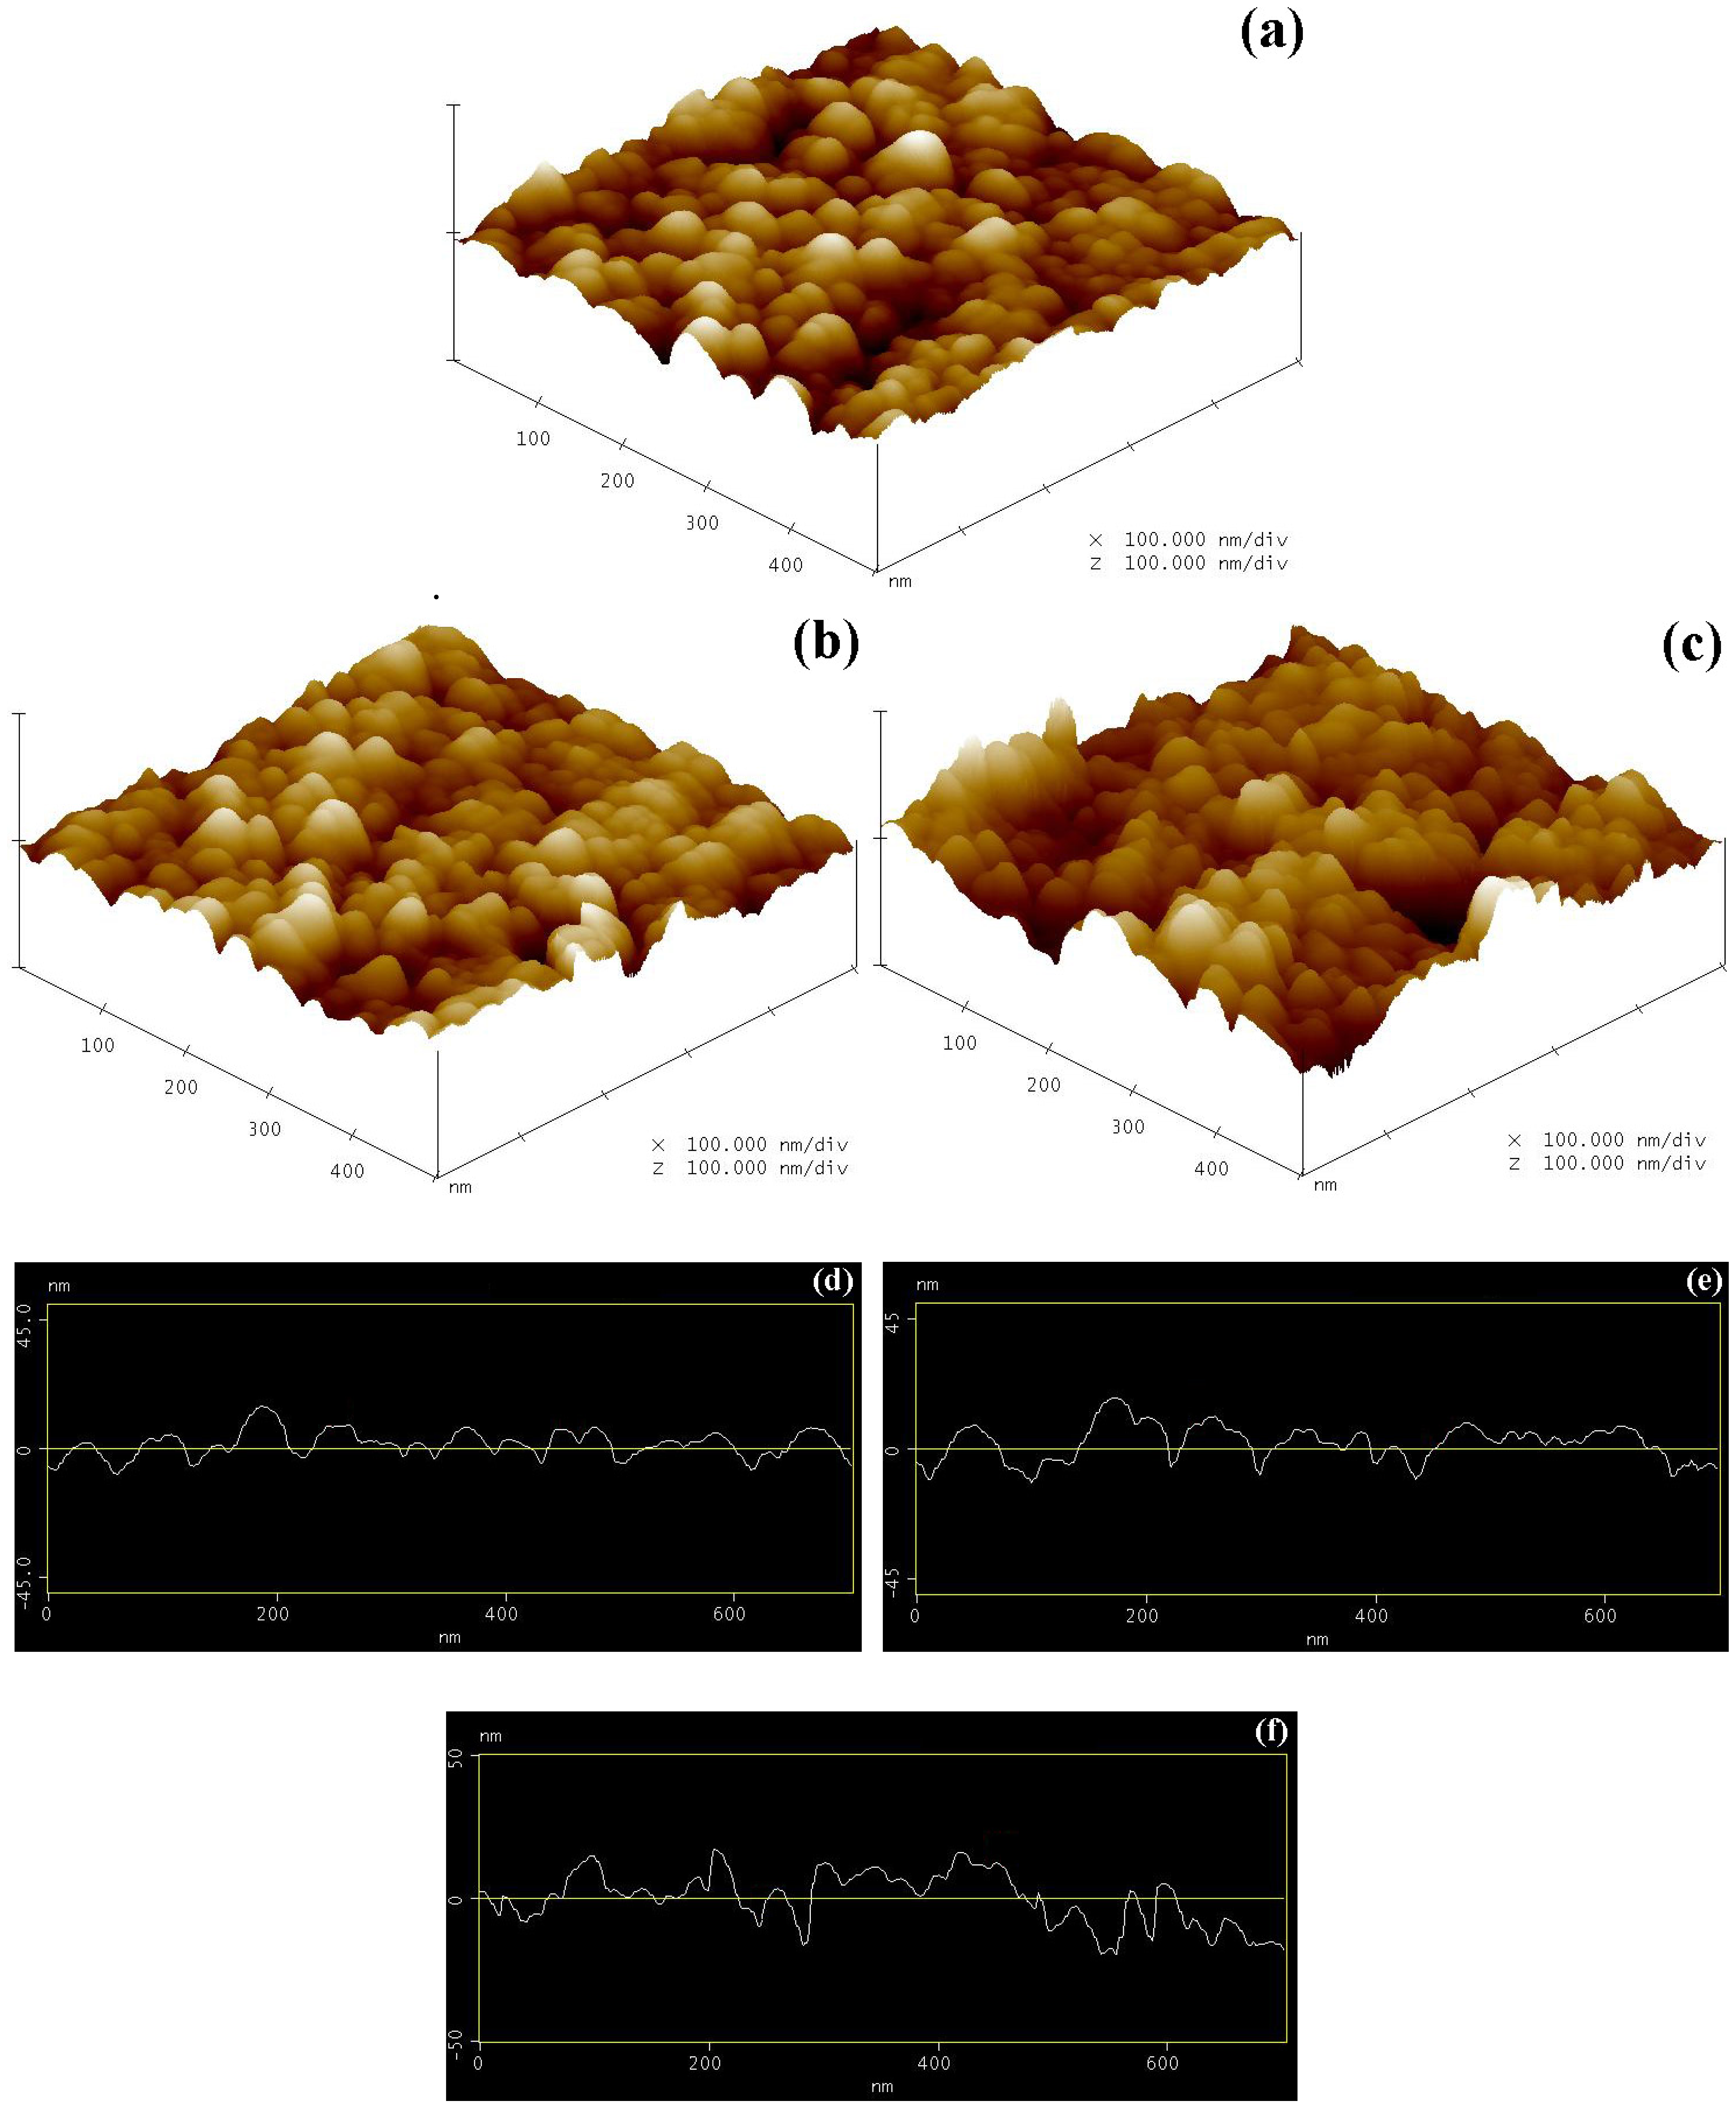
Figure 6.
SEM images of highly crystalline flame-made (5/5) (a) pure ZnO, (b) 1 mol%, (c) 2 mol%, (d) 3 mol%, (e) 4 mol%, and (f) 5 mol% Pd/ZnO nanoparticles.
Figure 6.
SEM images of highly crystalline flame-made (5/5) (a) pure ZnO, (b) 1 mol%, (c) 2 mol%, (d) 3 mol%, (e) 4 mol%, and (f) 5 mol% Pd/ZnO nanoparticles.
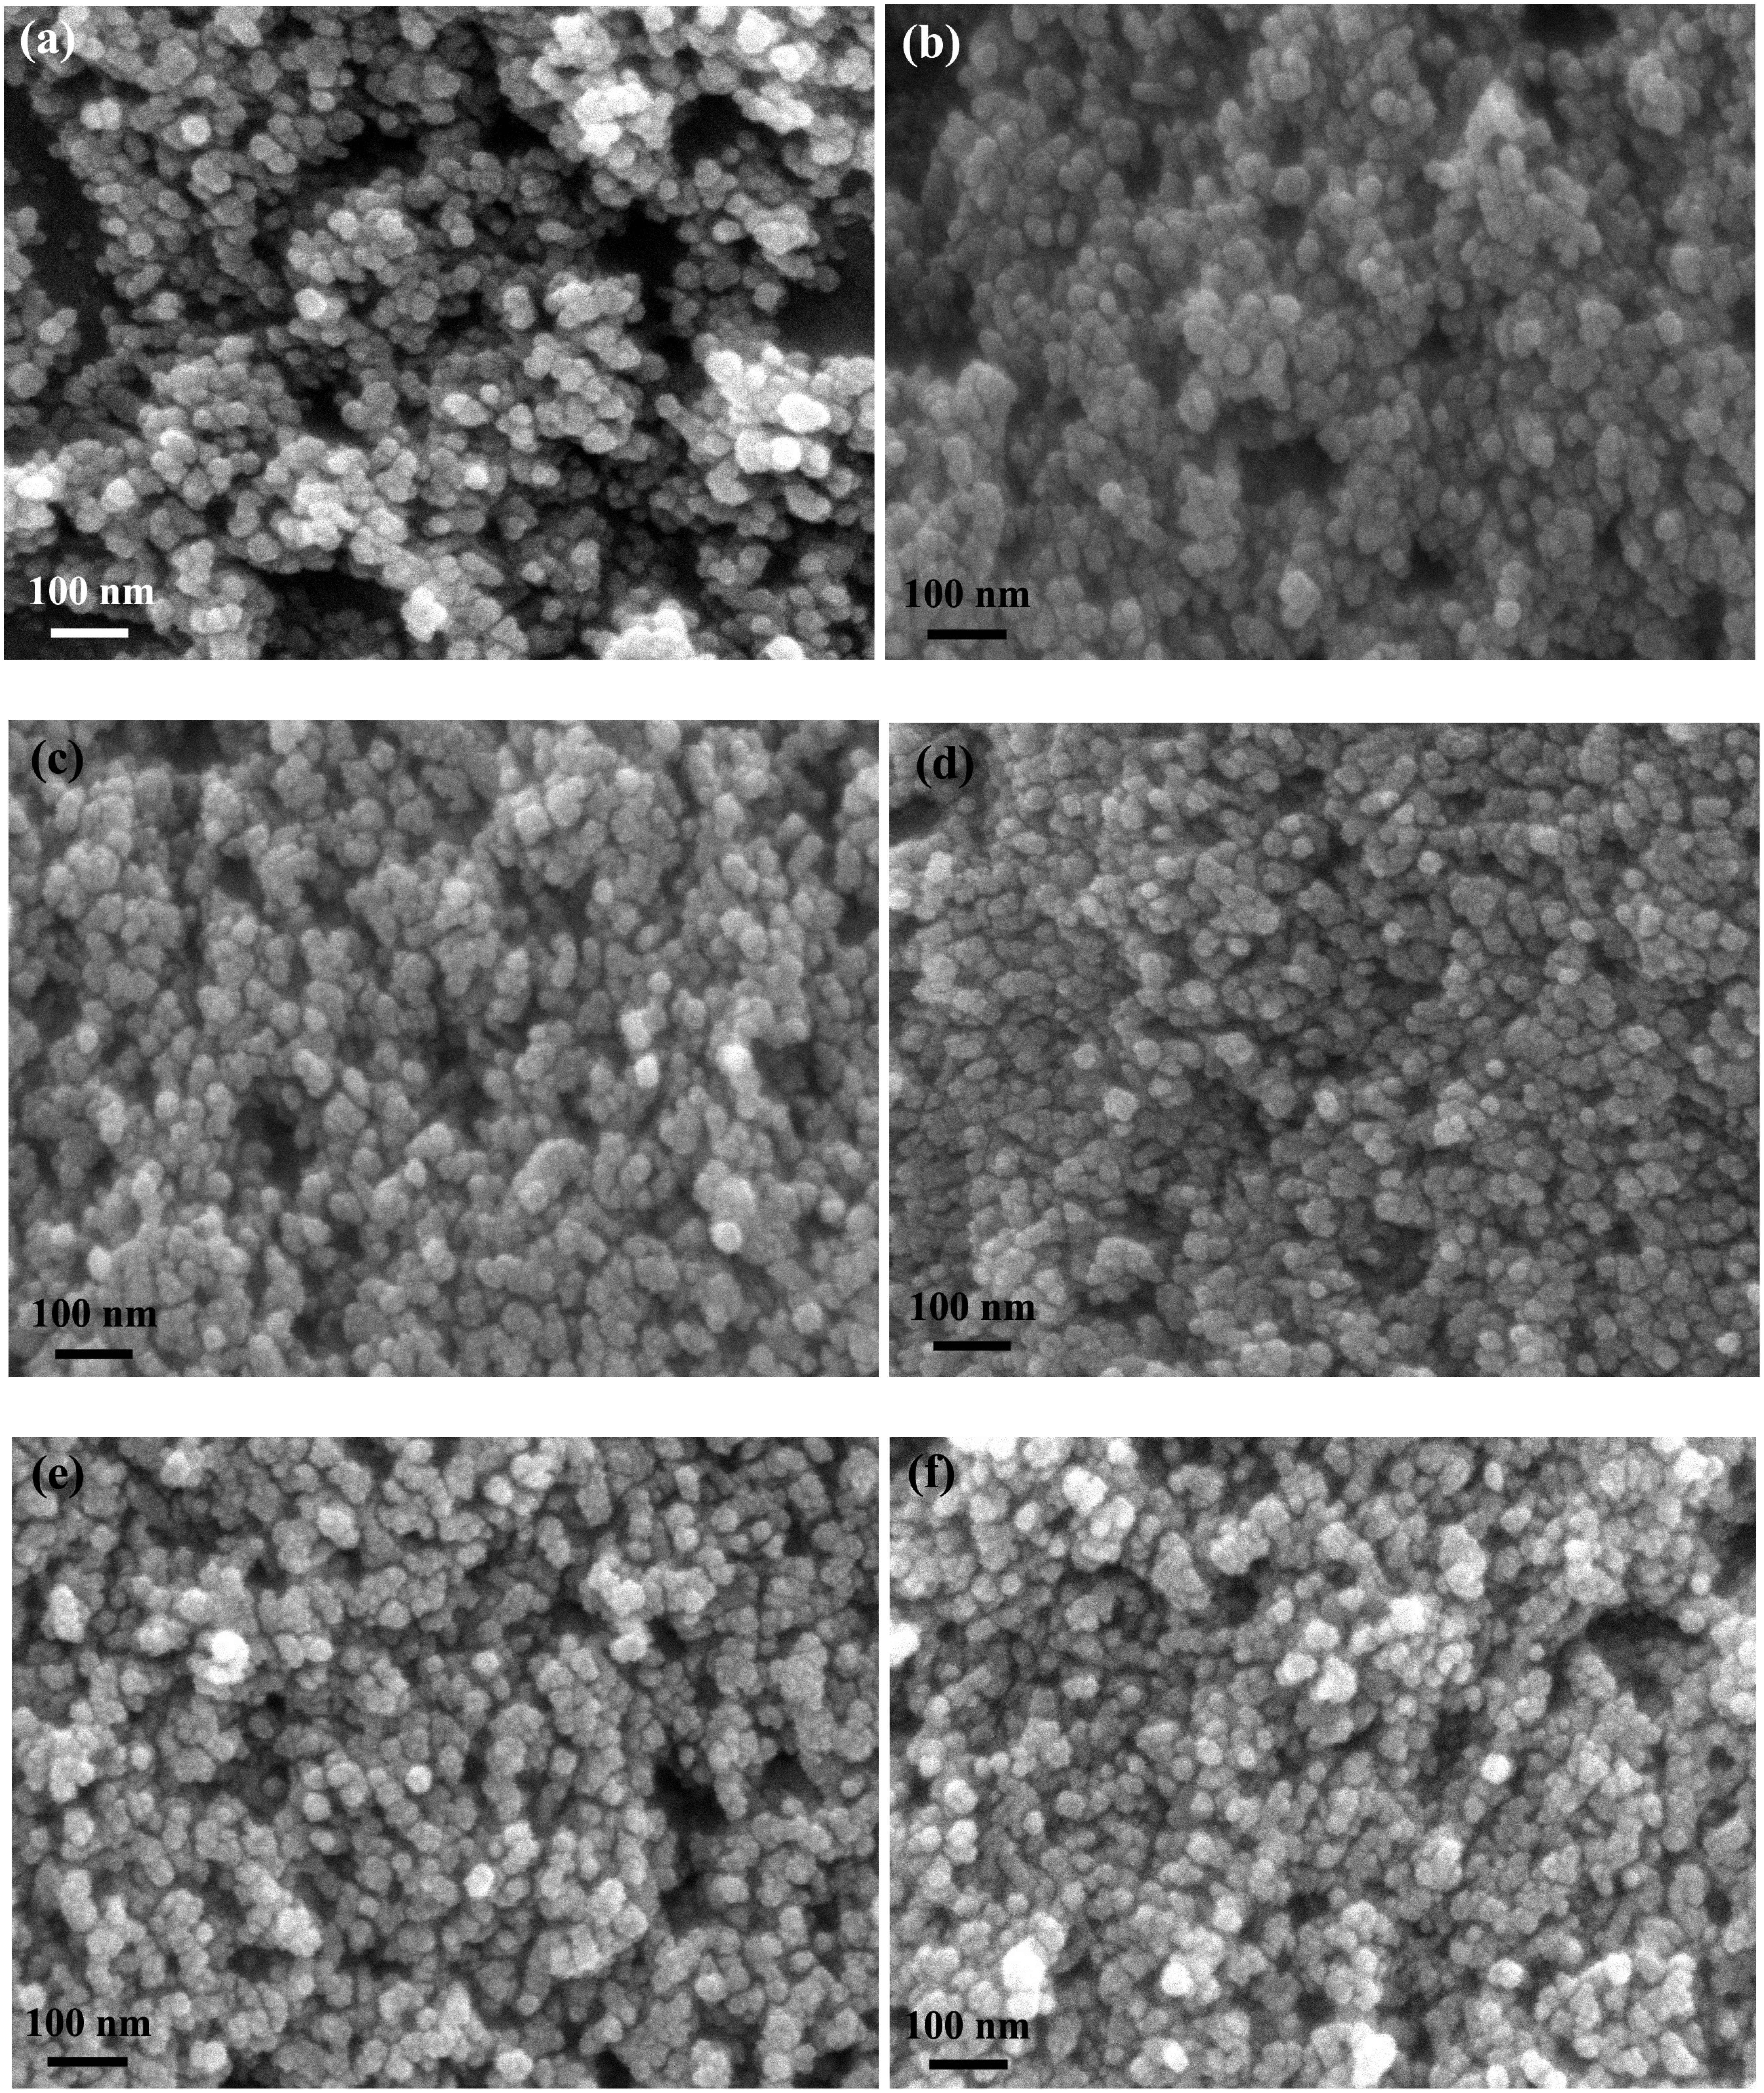
Figure 7.
The EDS line scan mode-SEM analysis of flame-made (a) pure ZnO, (b) 1 mol%Pd/ZnO, and (c) 5 mol% Pd/ZnO nanoparticles. The histograms showed the elemental compositions of samples. The lines scan corresponding to Zn, O, and Pd elements, while Cu and Au caused by the contamination from the copper grid and Au sputtered prior to an analysis.

Figure 8.
(a-c) show HR-TEM bright-fields images of highly crystalline flame-made (5/5) ZnO nanoparticles (P0) and (d-f) 5 mol% Pd/ZnO nanoparticles (P5) with different magnifications. Insets show the corresponding diffraction patterns of the particles.
Figure 8.
(a-c) show HR-TEM bright-fields images of highly crystalline flame-made (5/5) ZnO nanoparticles (P0) and (d-f) 5 mol% Pd/ZnO nanoparticles (P5) with different magnifications. Insets show the corresponding diffraction patterns of the particles.
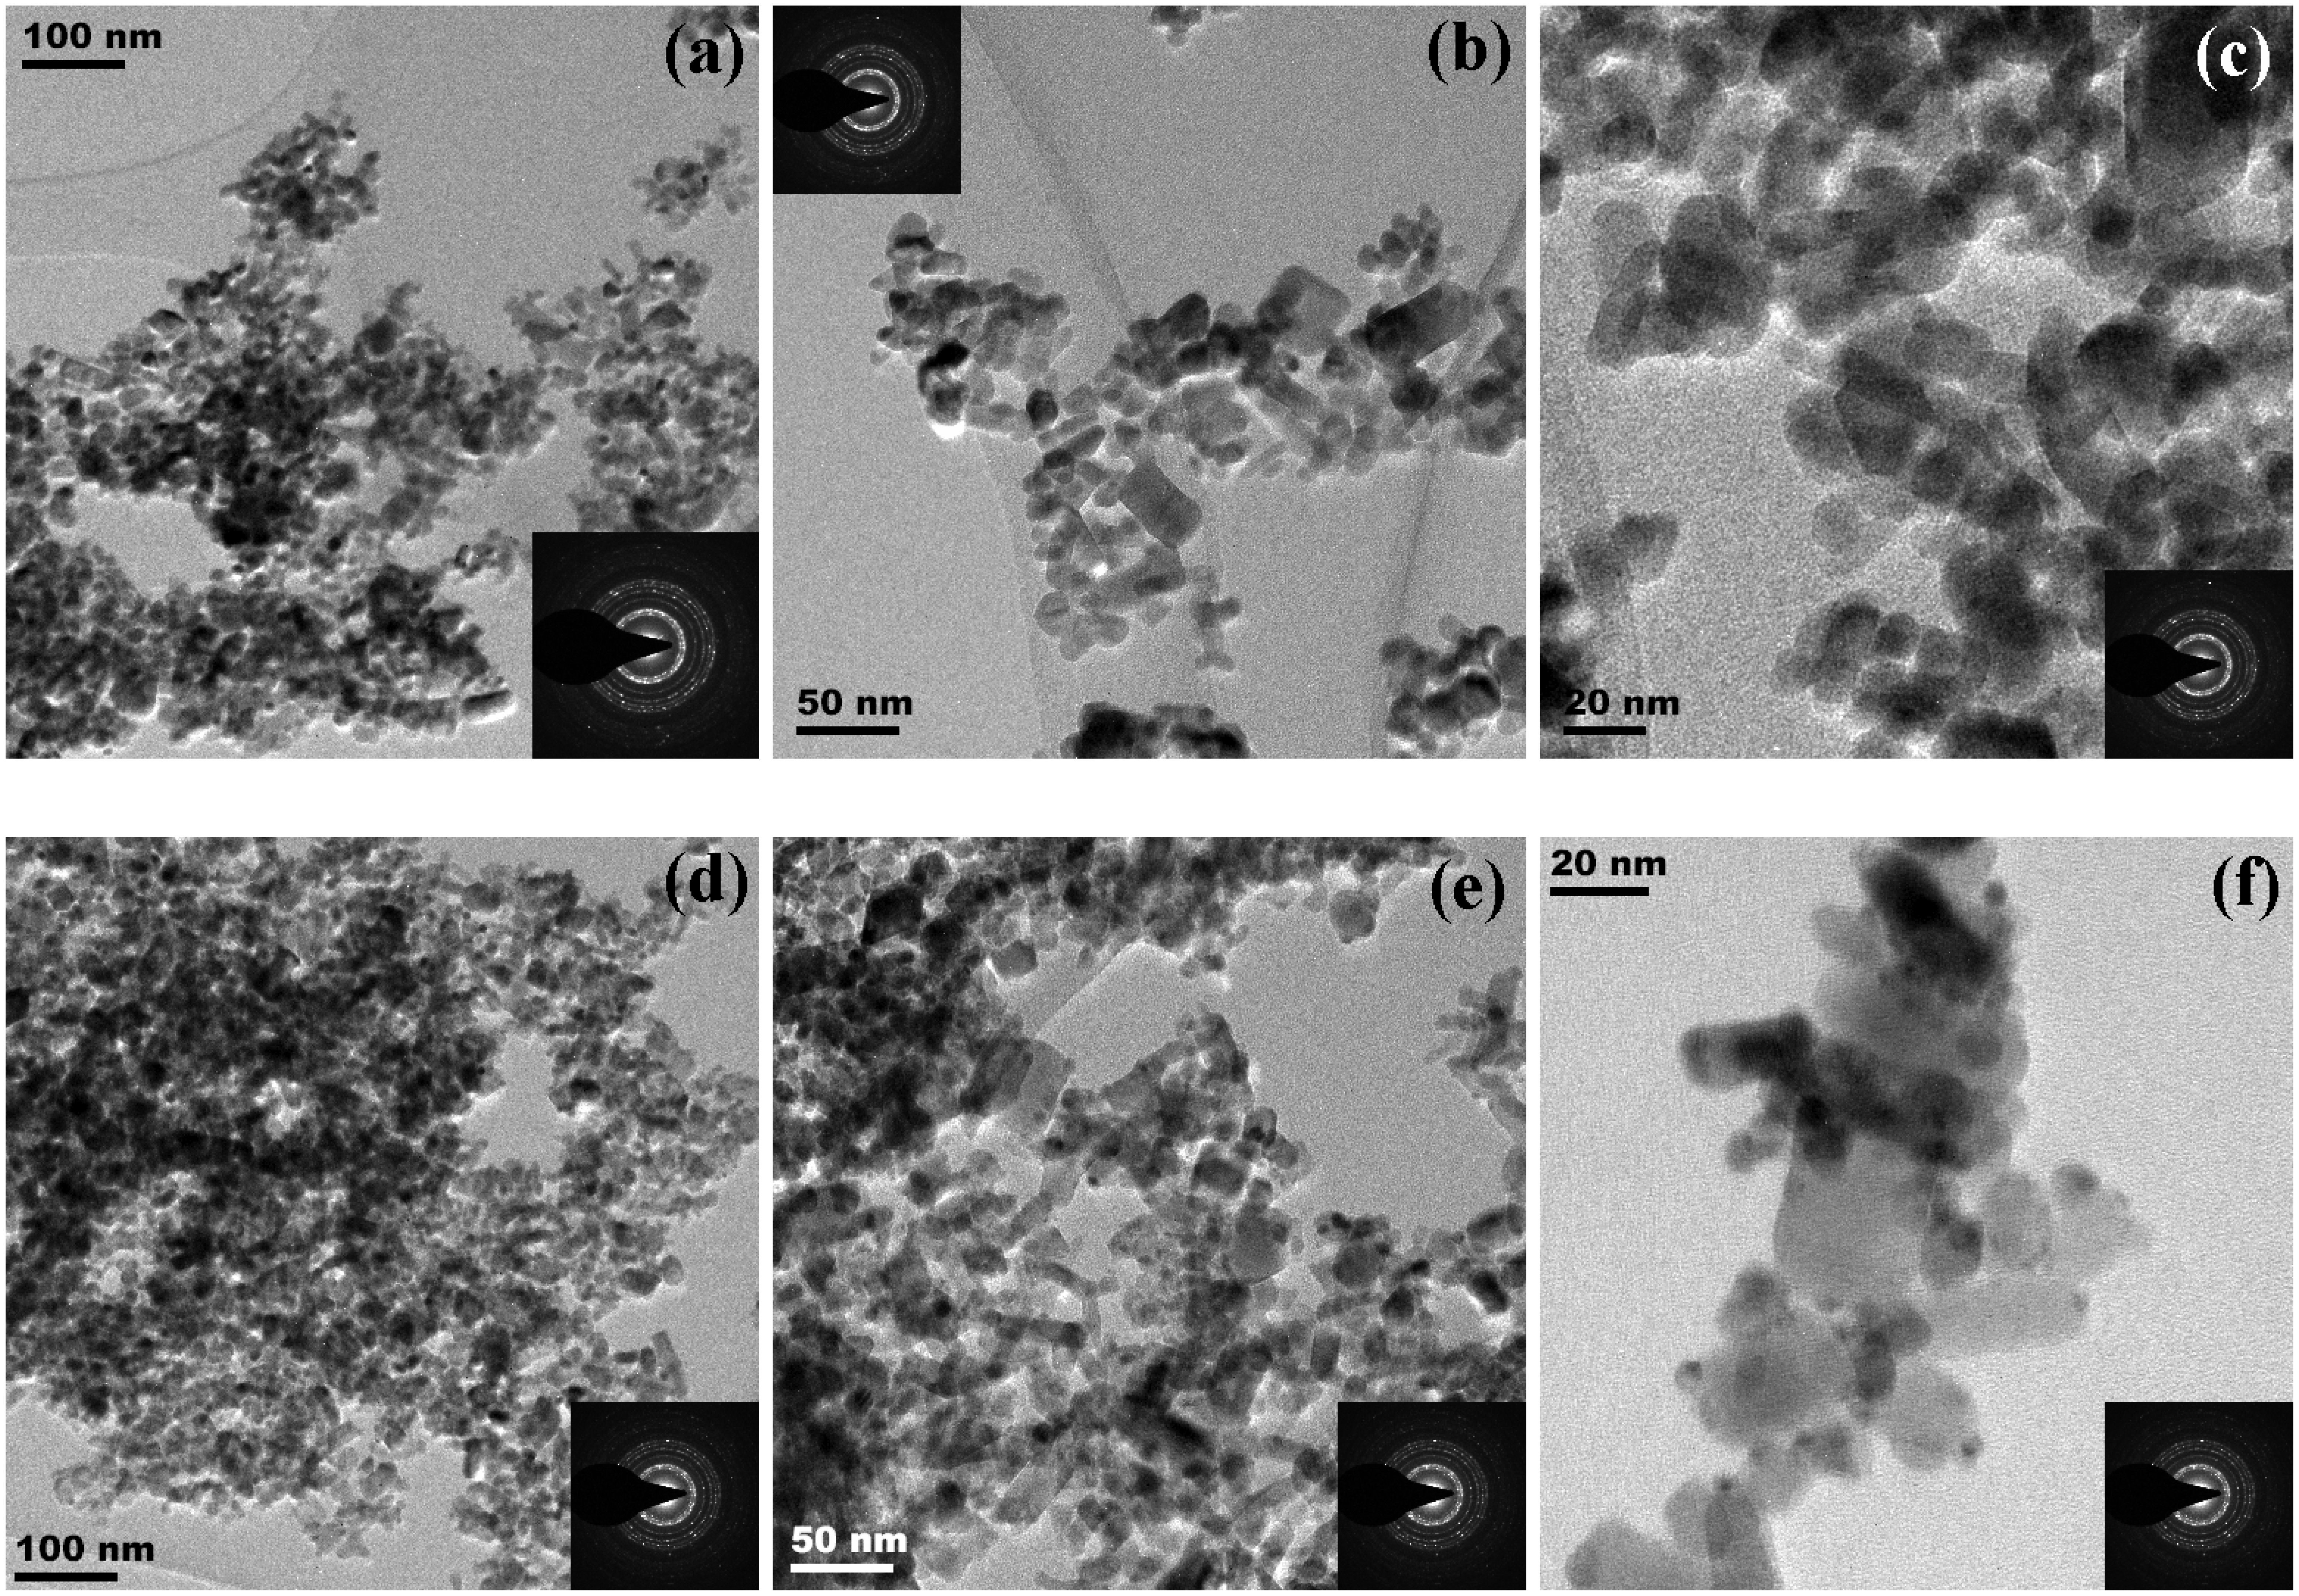
Figure 9.
(a,b). STEM micrographs of flame-made (5/5) 5 mol% Pd/ZnO (P5) nanoparticles. Small Pd particles (2-12 nm) were dispersed and confined to the ZnO surface. The STEM micrographs of sample P5 showing an agglomerated structure of ZnO primary particles (gray) together with Pd clusters (bright spot). EDS spectra for the region indicated in (c) point 1 and (d) 2 (Figure 9(b)) contains Pd deposited on the ZnO support. Cu peaks caused by the contamination from the copper grid.
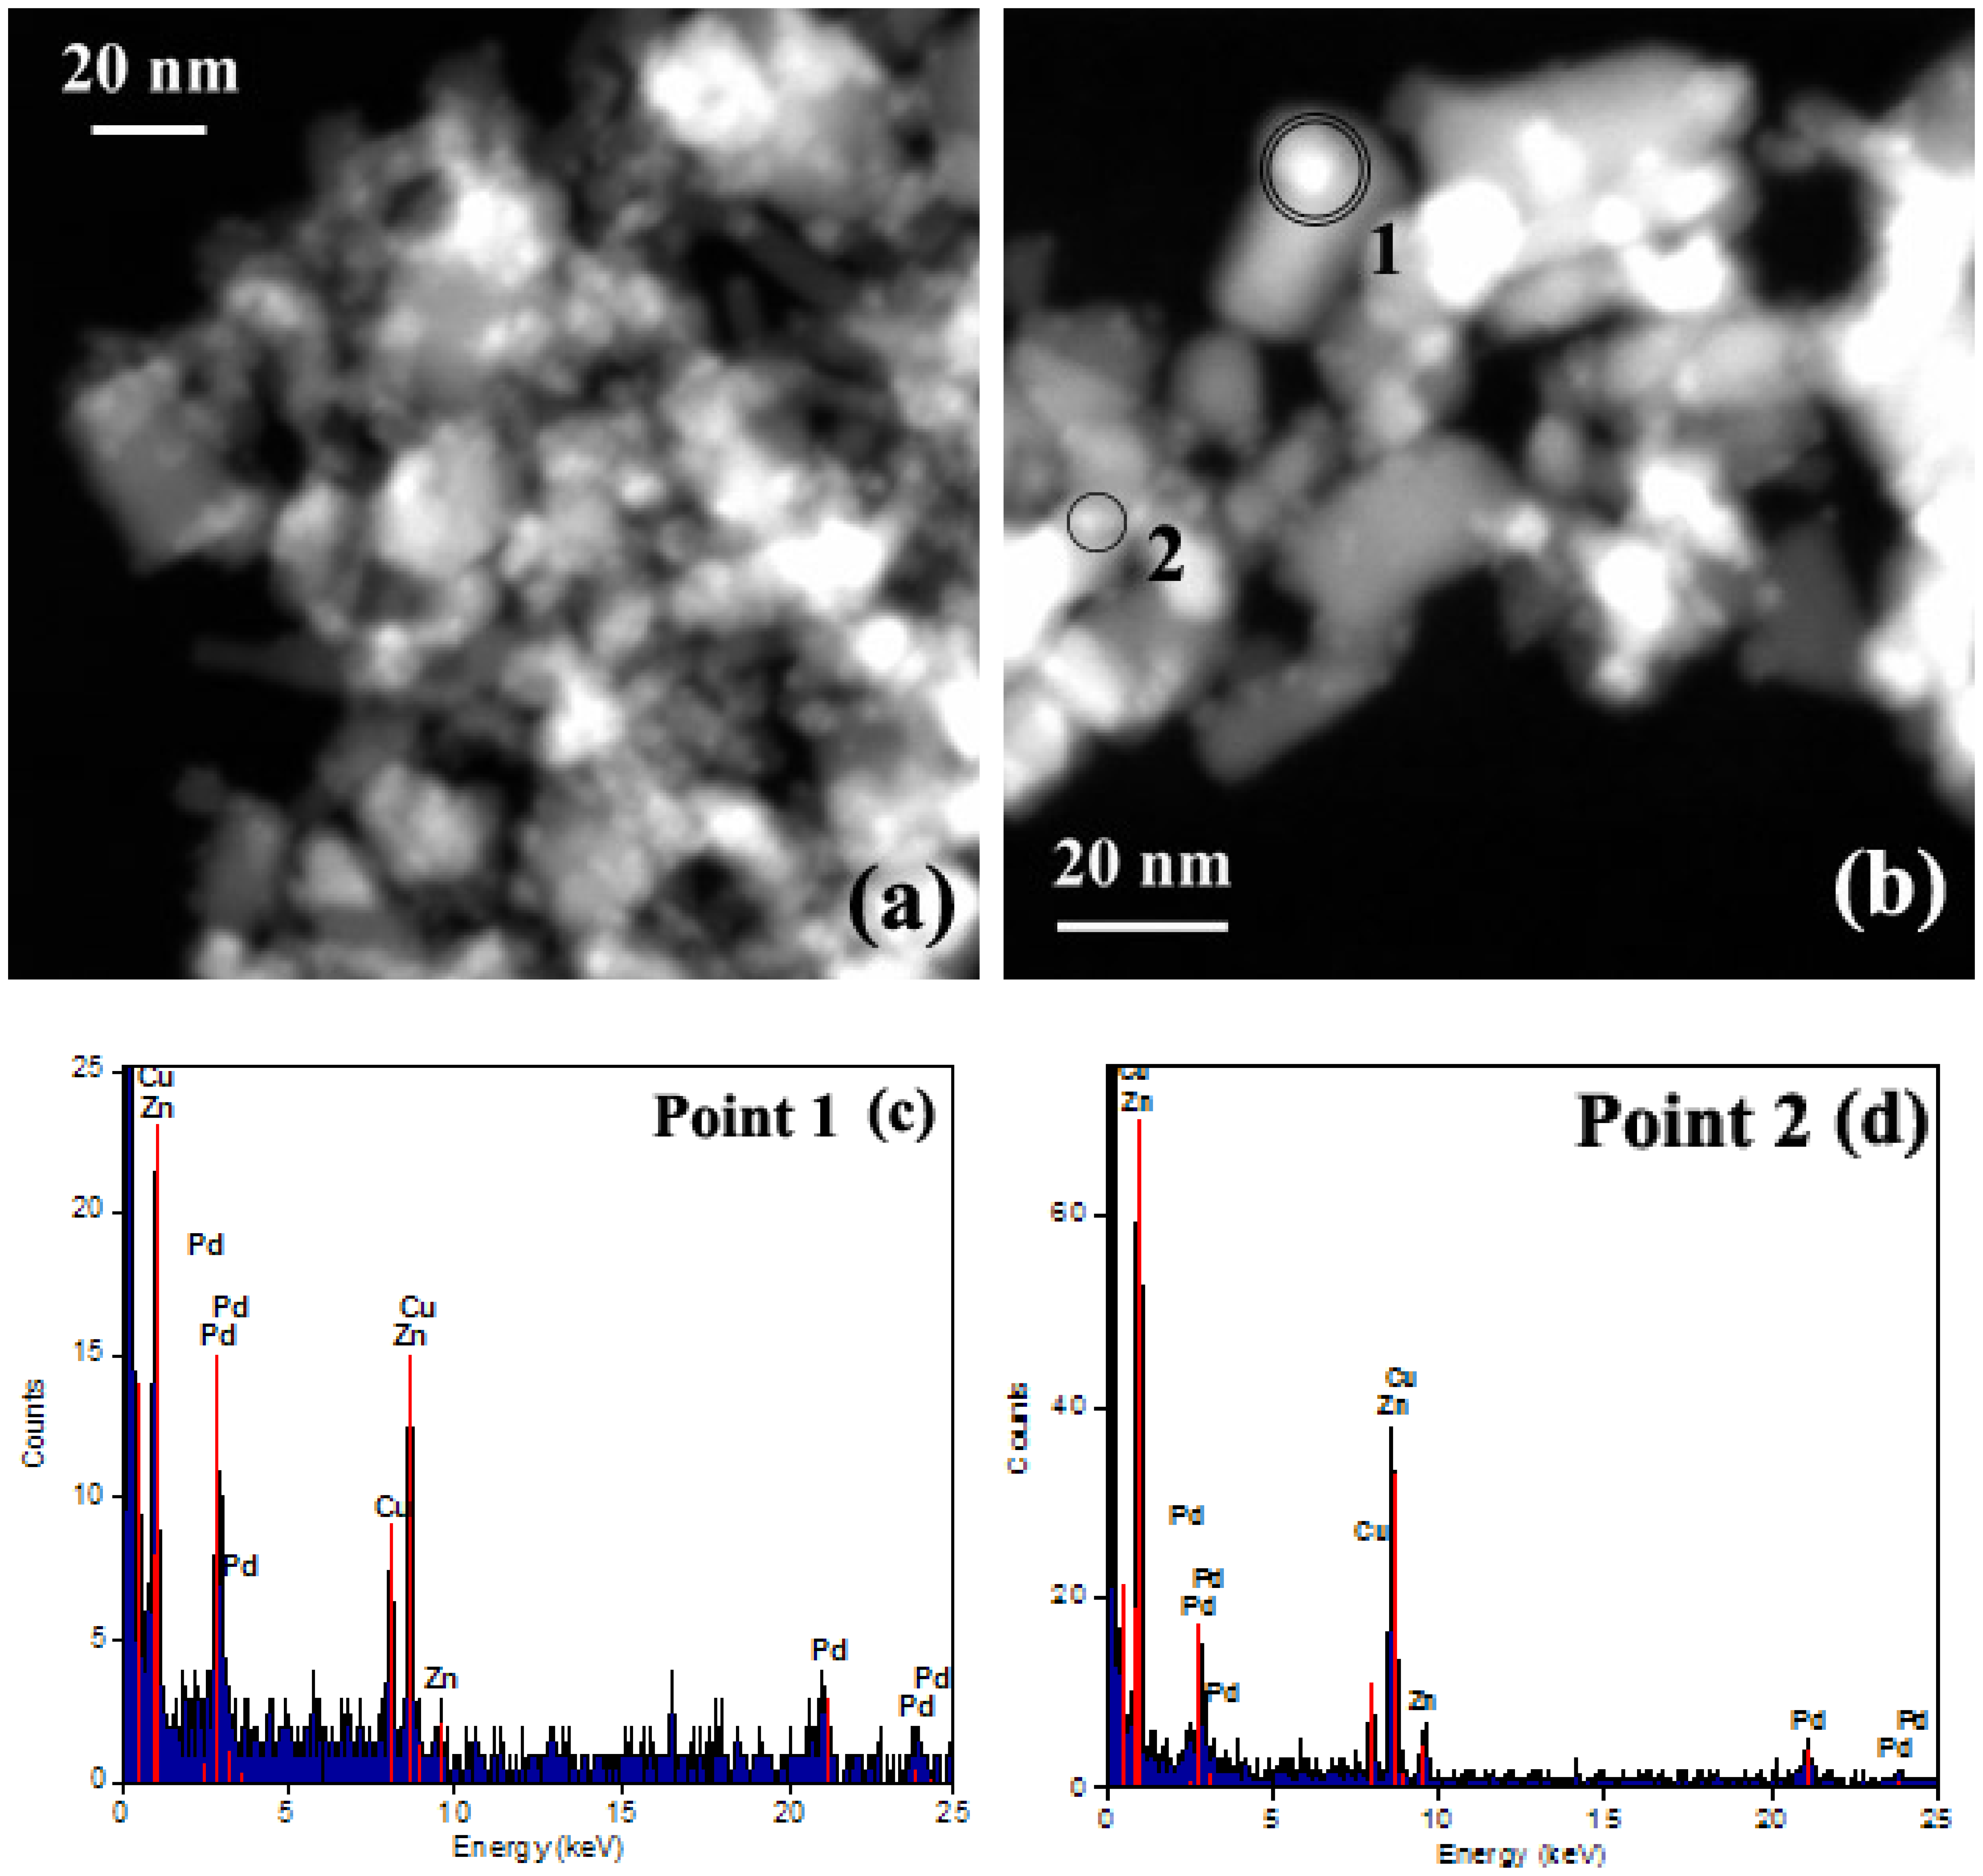
Figure 10.
Pd-dispersion and Pd particle diameters as derived from CO-pulse chemisorption as a function of Pd concentration.
Figure 10.
Pd-dispersion and Pd particle diameters as derived from CO-pulse chemisorption as a function of Pd concentration.
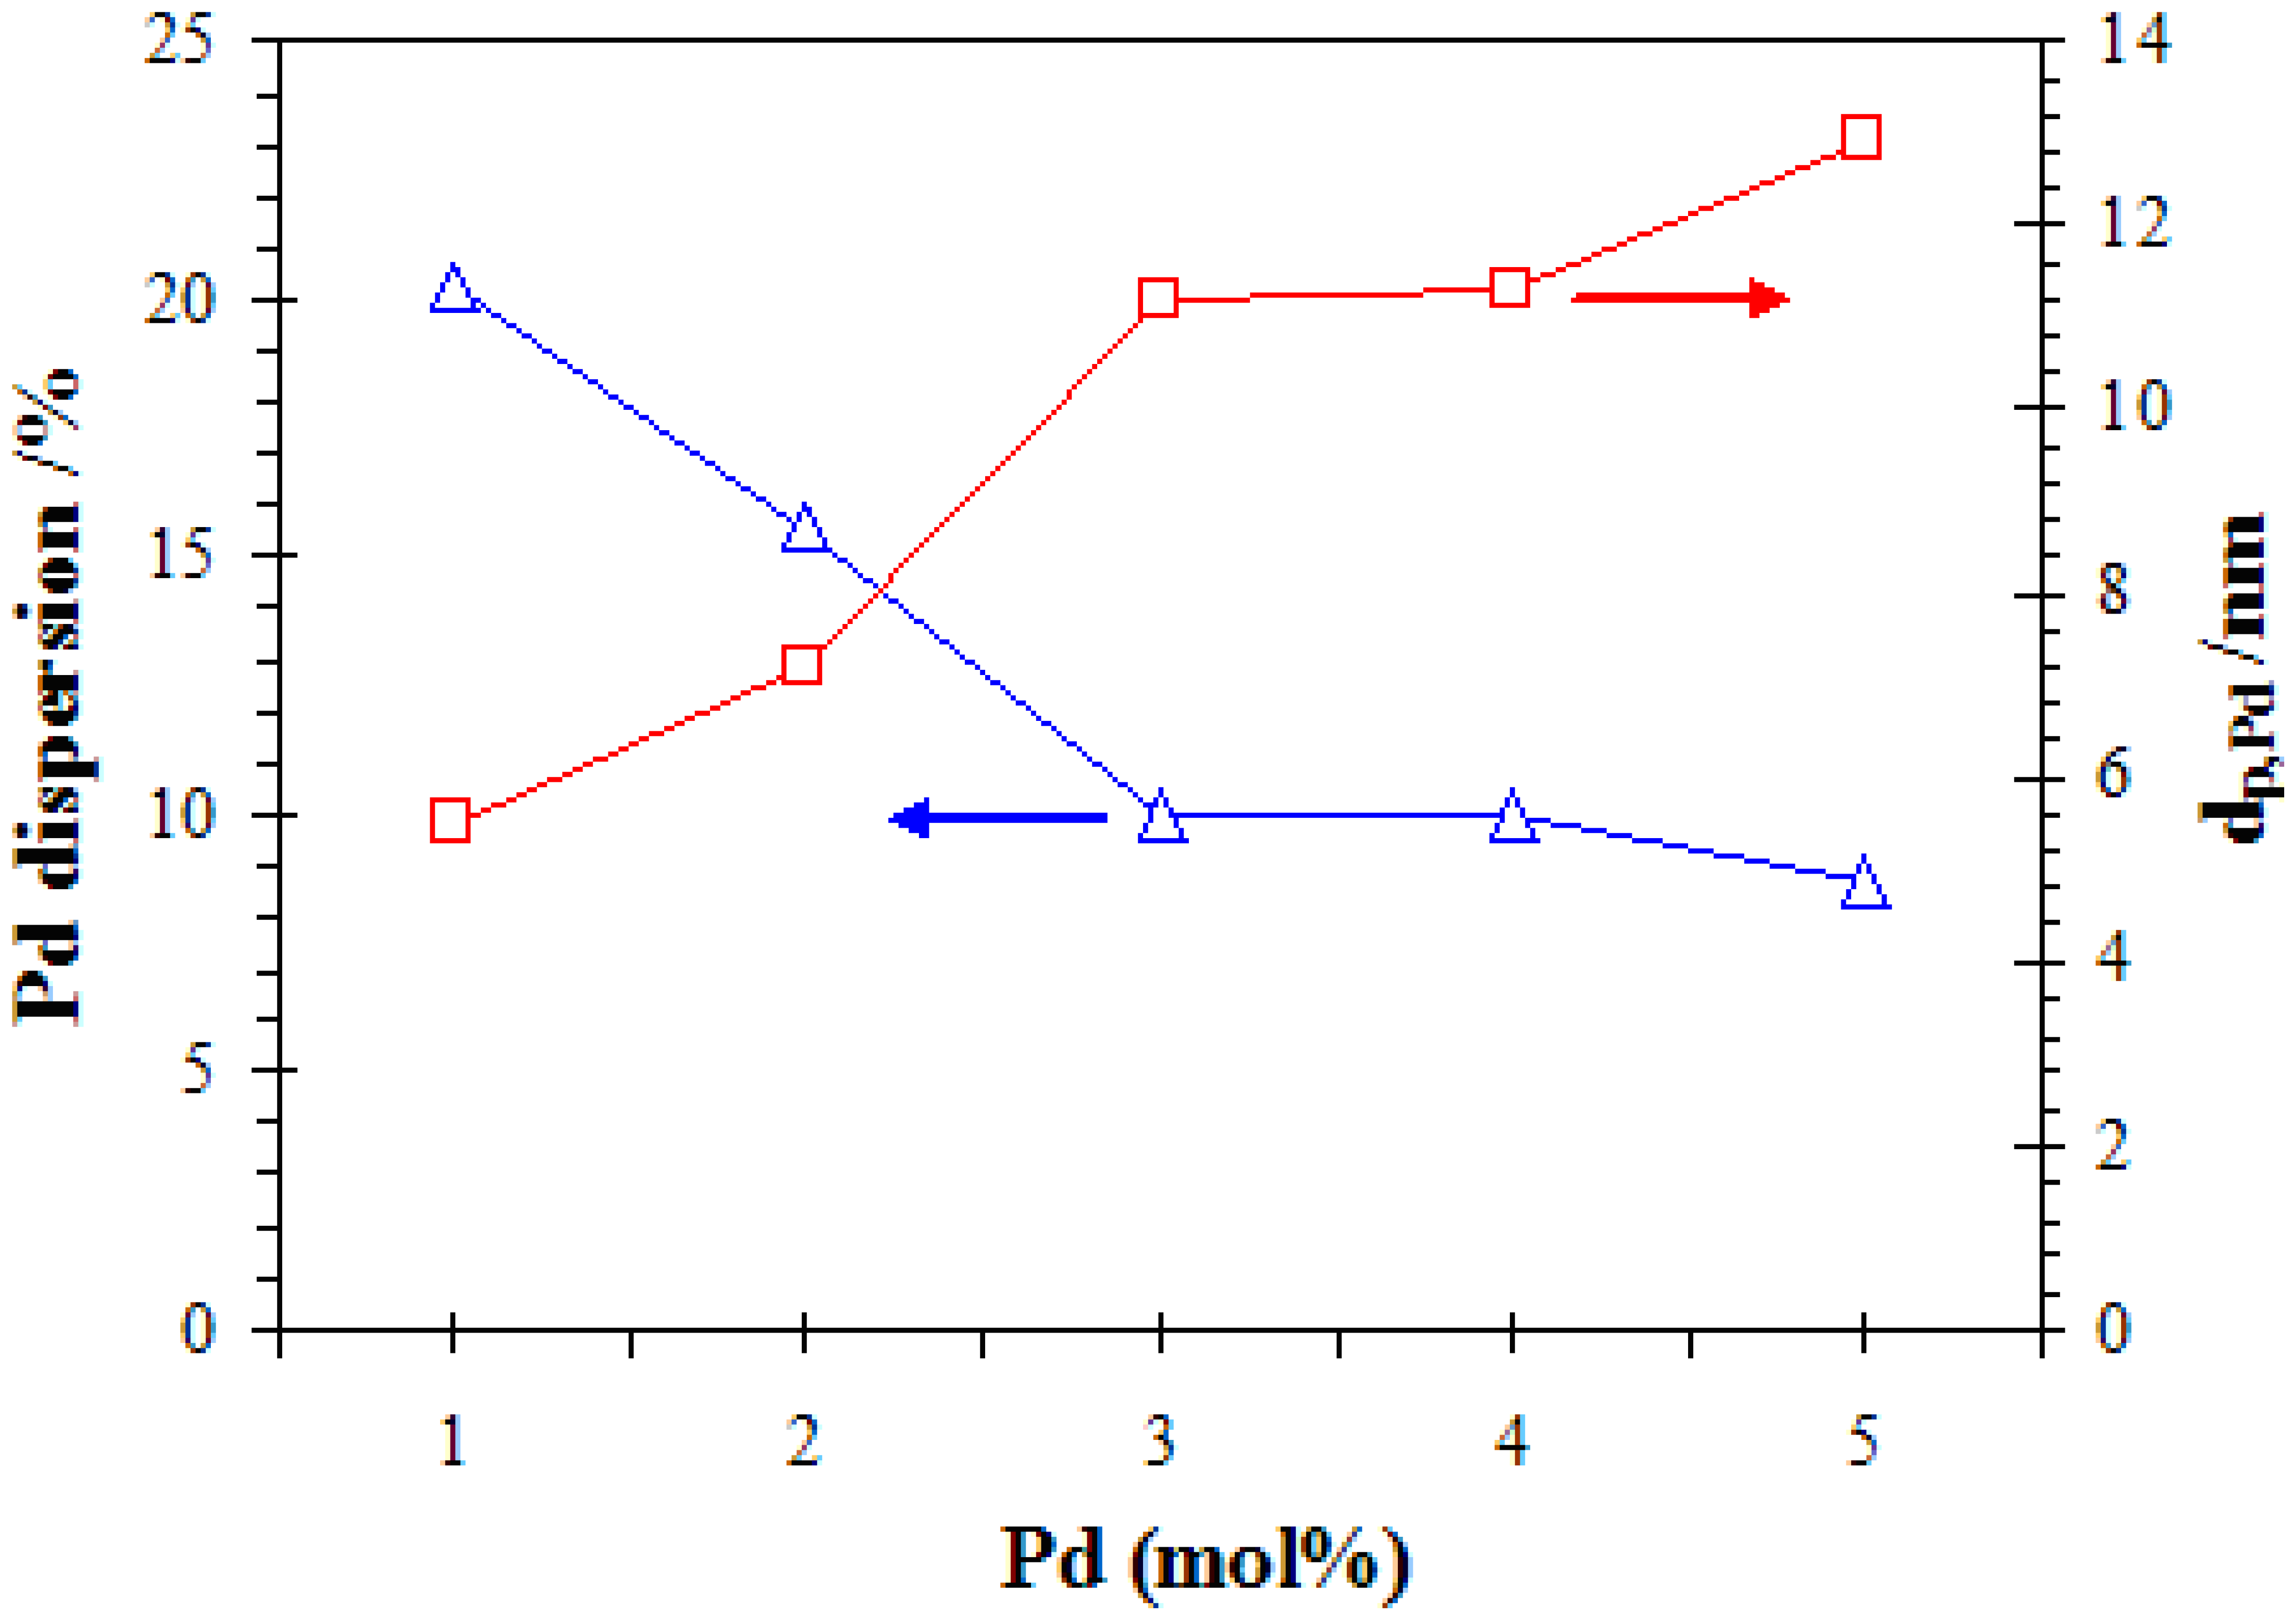
Figure 11.
(a) Sensitivity of S0, S1, S3, and S5 (solid line, left axis) and the corresponding response time (dashed line, right axis), (b) Change in resistance of sensor S1 under exposure to reducing gas ethanol during forward (triangles) and backward (rectangles) cycle and sensitivity (left axis) dependence on ethanol concentration (c) in dry air O2/N2 at 400°C. Response times (Tres, solid line, right axis) were within seconds, recovery times within a few minutes (Trec, dashed line, right axis).
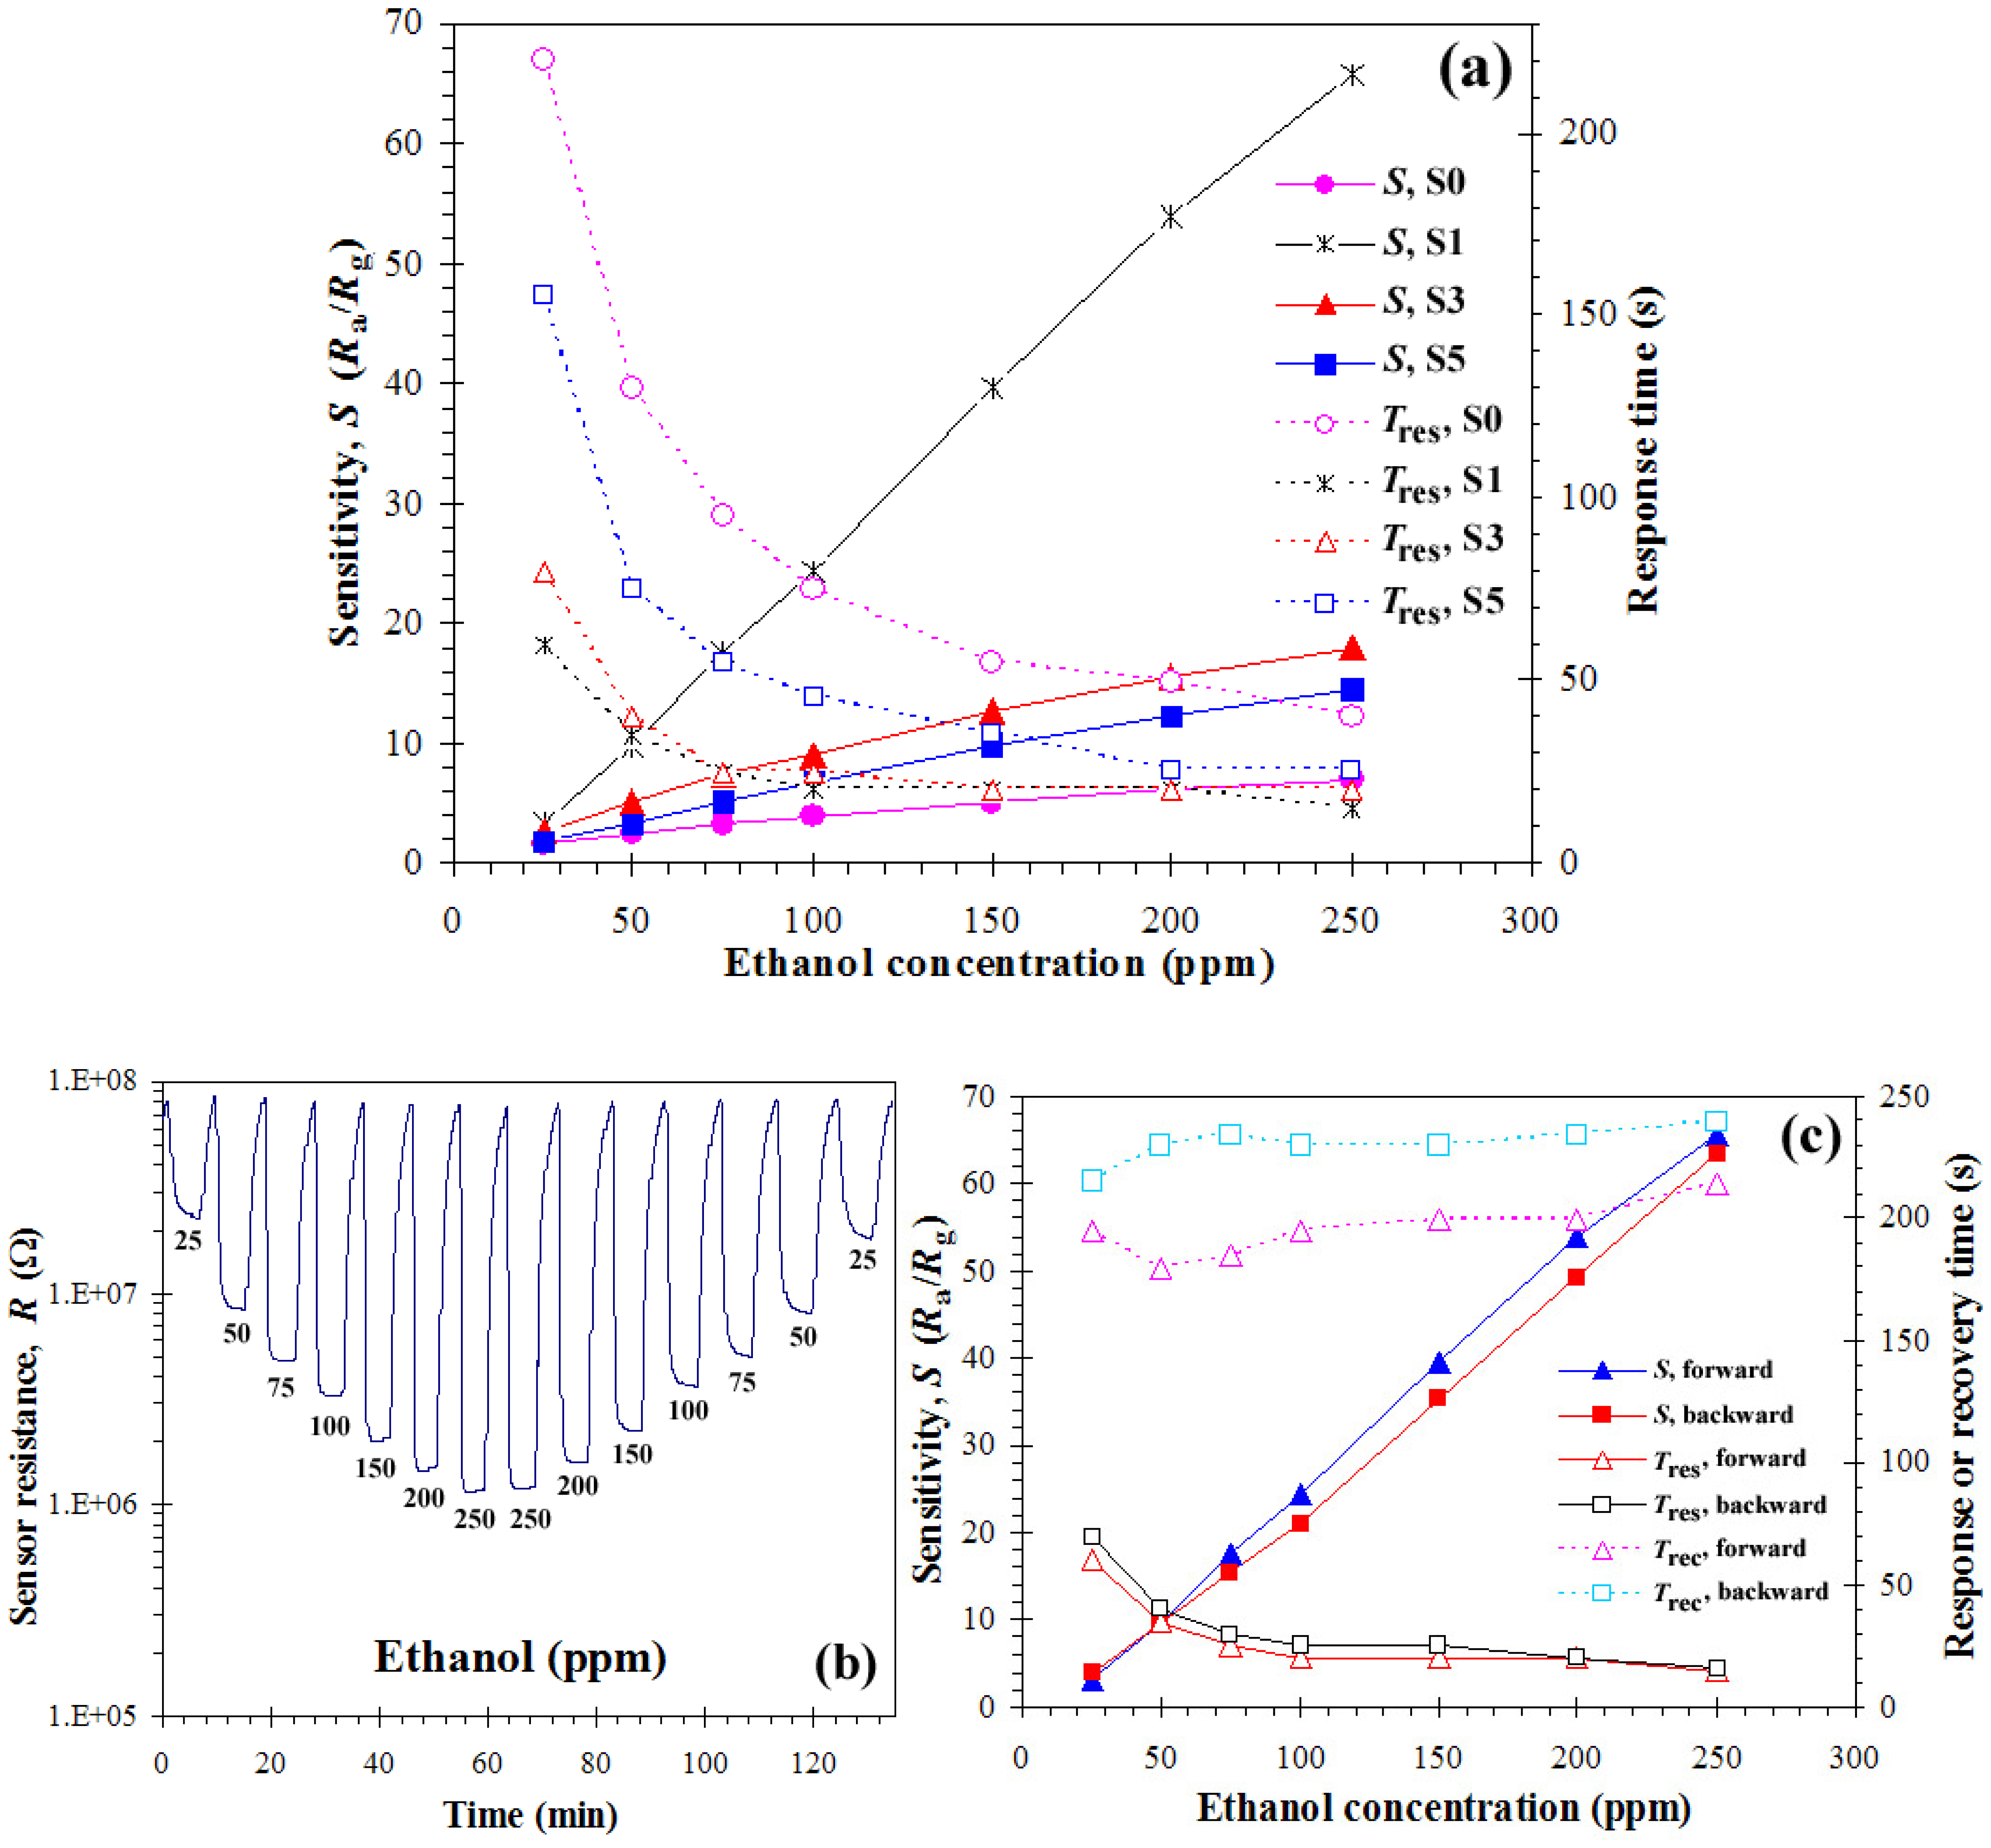
Figure 12.
MS ion intensity as a function of time during ethanol oxidation in dry air at 400°C (25-250 ppm) over a sensor S1 sensing film.
Figure 12.
MS ion intensity as a function of time during ethanol oxidation in dry air at 400°C (25-250 ppm) over a sensor S1 sensing film.
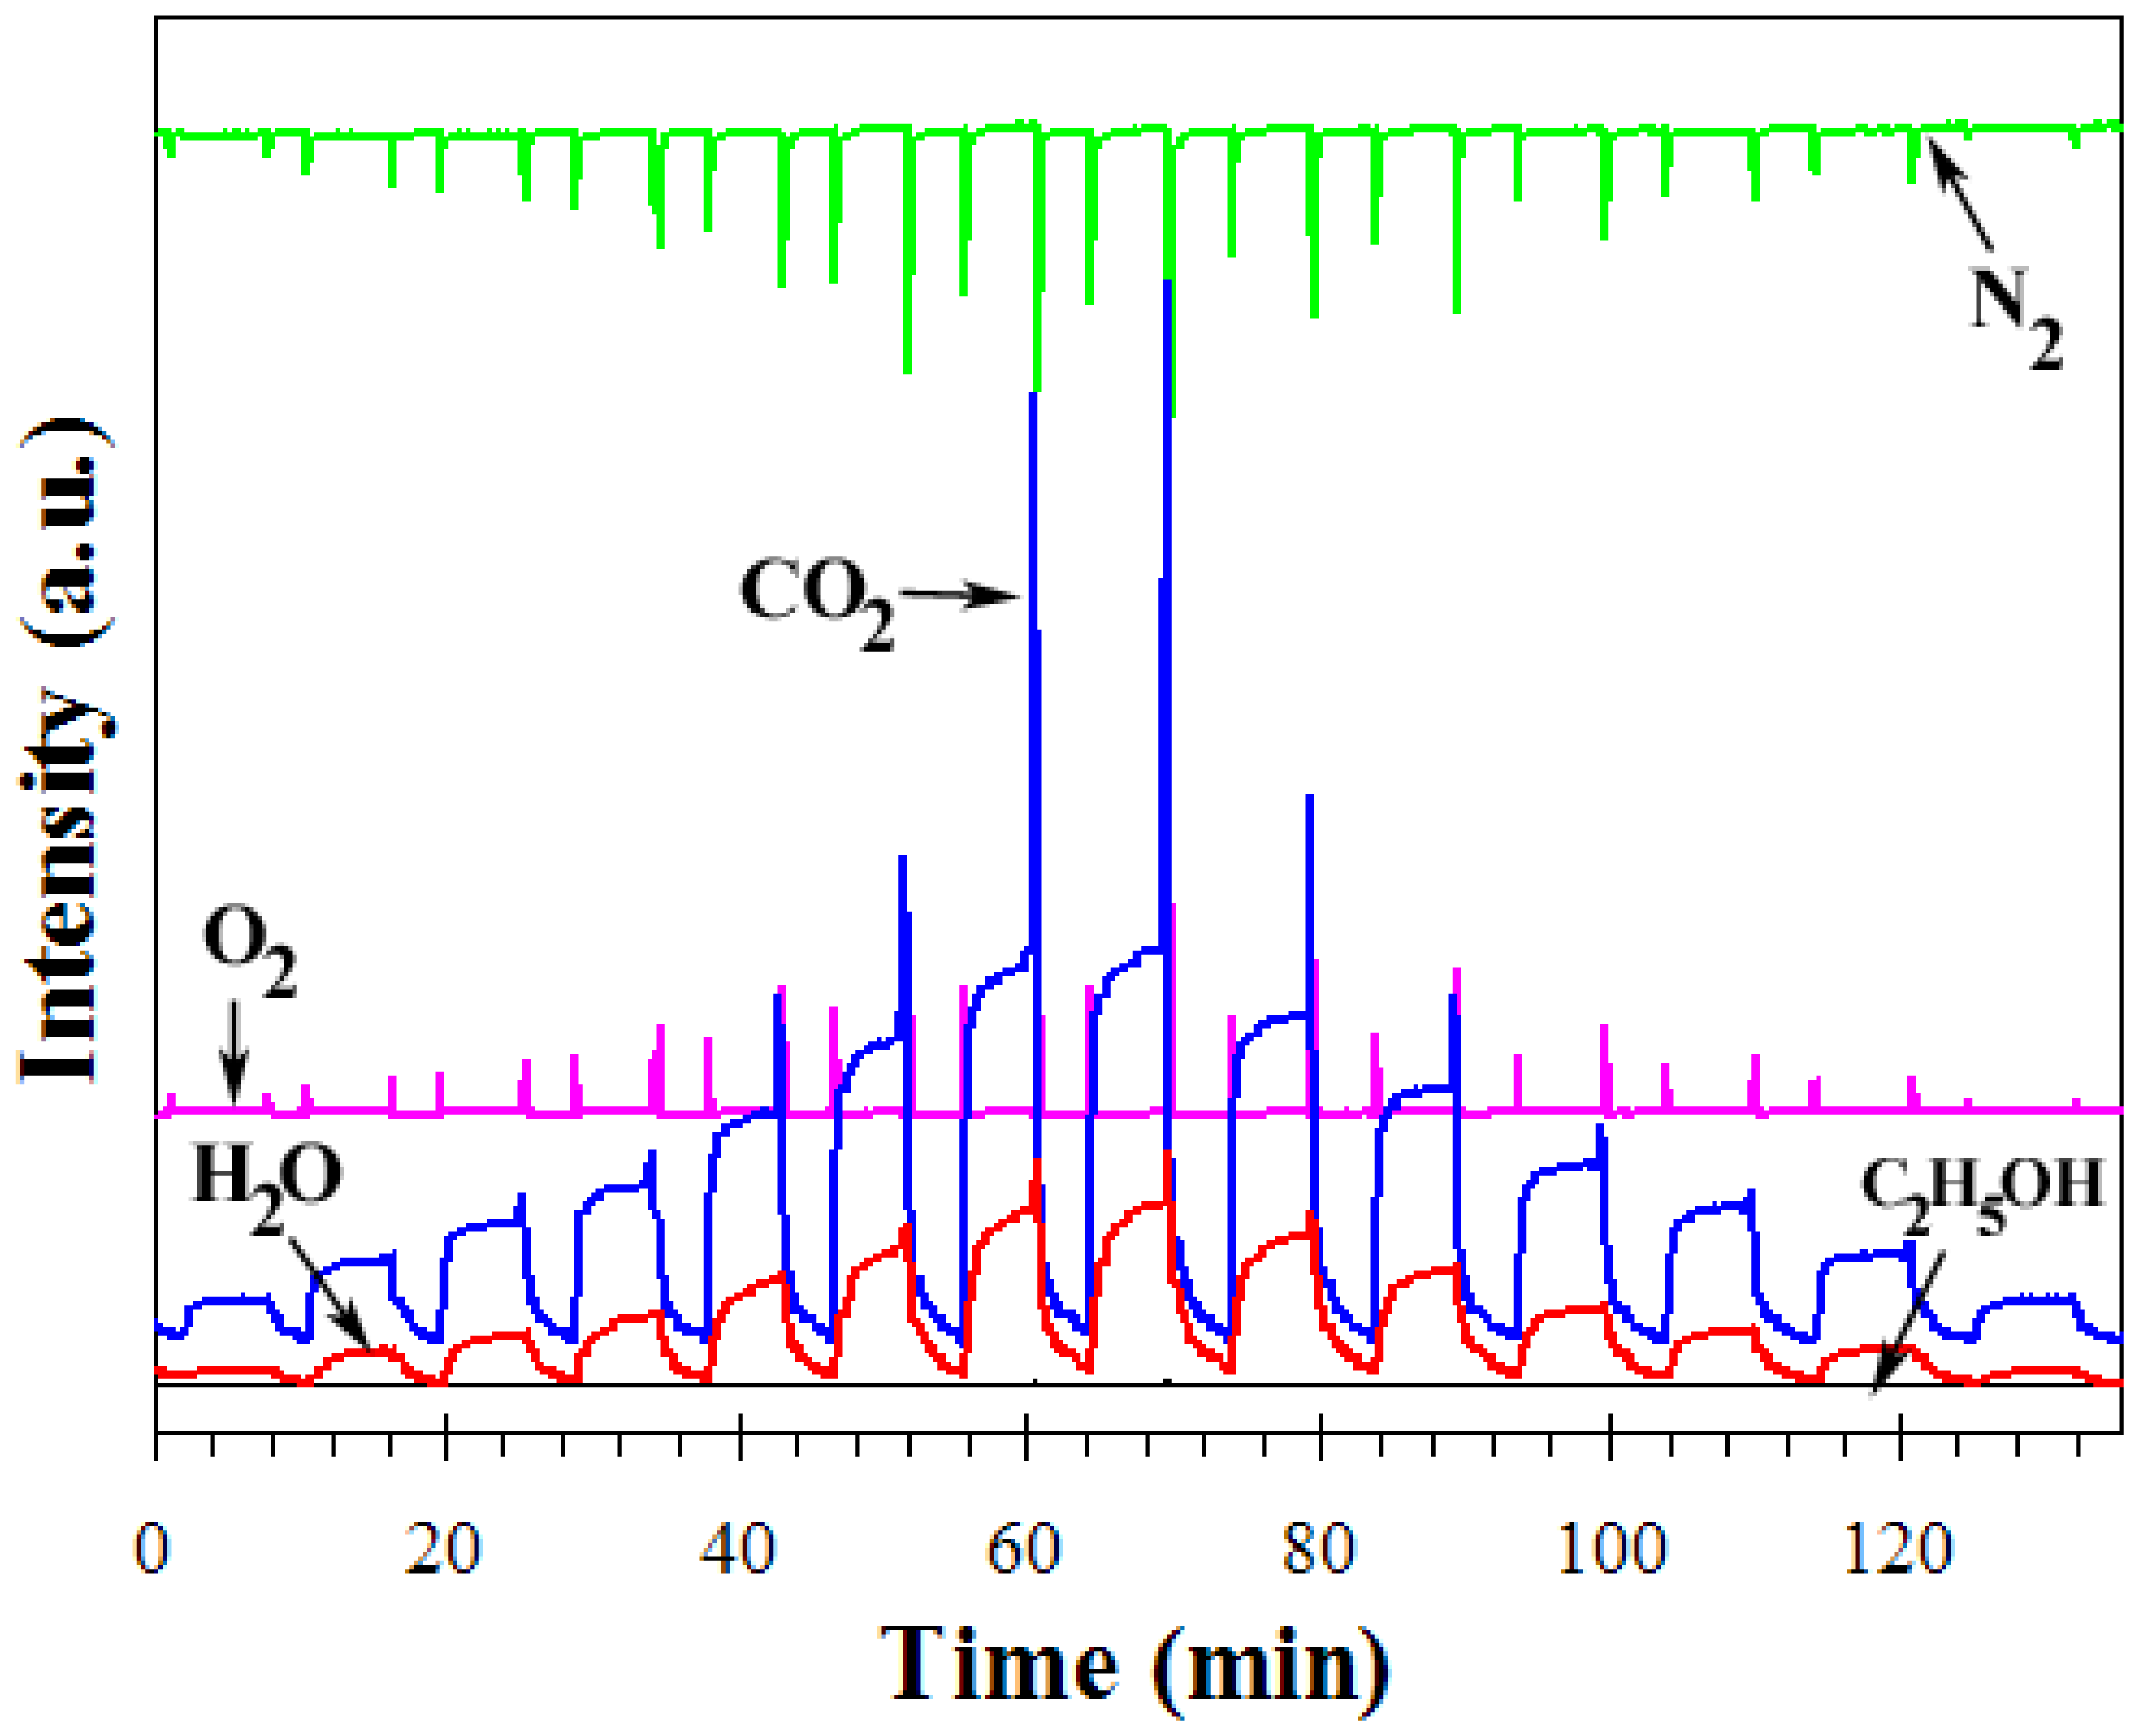
Figure 13.
(a) The film thickness was approximately 5 μm (P1) doctor-bladed onto an Al2O3 substrate interdigitated with Au electrodes (side view) cross-section after sensing at 400°C in dry air (S1). The square emphasized the particle sizes as particles slightly changed after annealing and sensing test are also shown in the inset. (b) The EDS elemental signals emphasized clearly yield the signals corresponding to Al, Zn, O, and Pd, while Au caused by the contamination from the gold sputtering.
© 2007 by MDPI ( http://www.mdpi.org). Reproduction is permitted for noncommercial purposes.
Share and Cite
MDPI and ACS Style
Liewhiran, C.; Phanichphant, S. Effects of Palladium Loading on the Response of Thick Film Flame-made ZnO Gas Sensor for Detection of Ethanol Vapor. Sensors 2007, 7, 1159-1184. https://doi.org/10.3390/s7071159
AMA Style
Liewhiran C, Phanichphant S. Effects of Palladium Loading on the Response of Thick Film Flame-made ZnO Gas Sensor for Detection of Ethanol Vapor. Sensors. 2007; 7(7):1159-1184. https://doi.org/10.3390/s7071159
Chicago/Turabian StyleLiewhiran, Chaikarn, and Sukon Phanichphant. 2007. "Effects of Palladium Loading on the Response of Thick Film Flame-made ZnO Gas Sensor for Detection of Ethanol Vapor" Sensors 7, no. 7: 1159-1184. https://doi.org/10.3390/s7071159