Evaluation of Grassland Dynamics in the Northern-Tibet Plateau of China Using Remote Sensing and Climate Data

Abstract
:1. Introduction
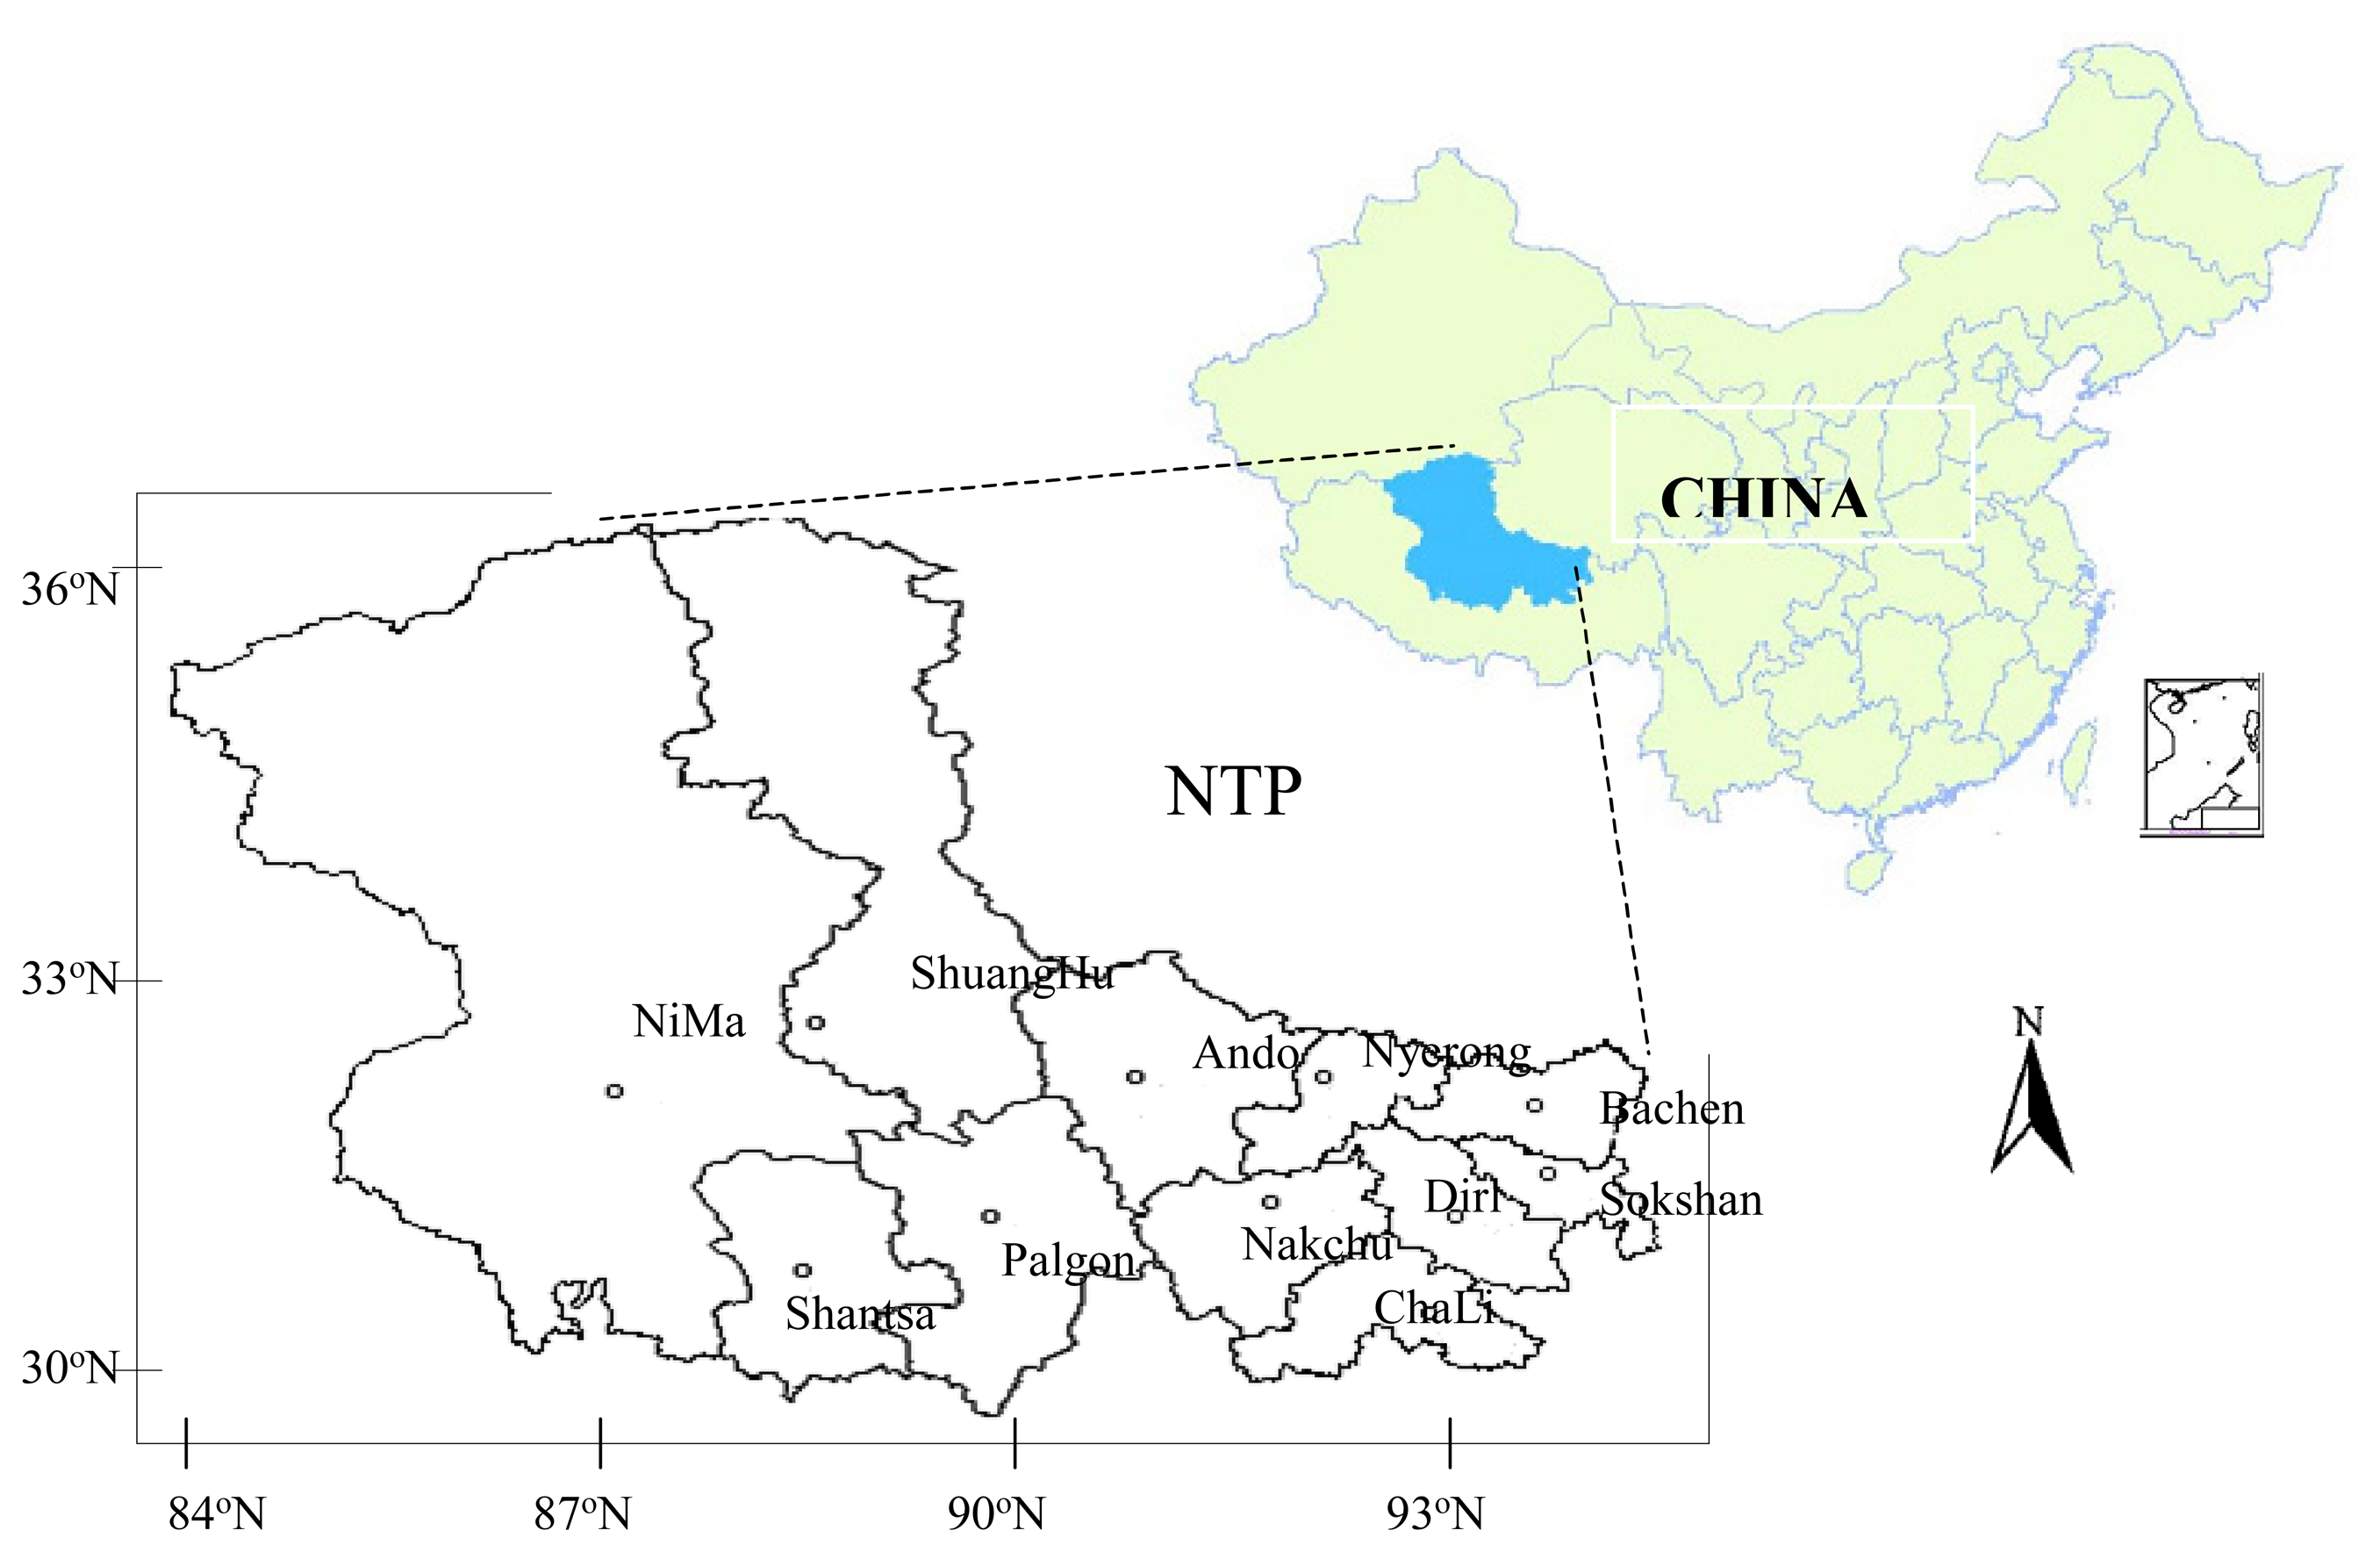
2. The study area
3. Data and methodology
3.1 Satellite data processing and statistical analysis
3.2 Climate data processing
4. Result and discussion
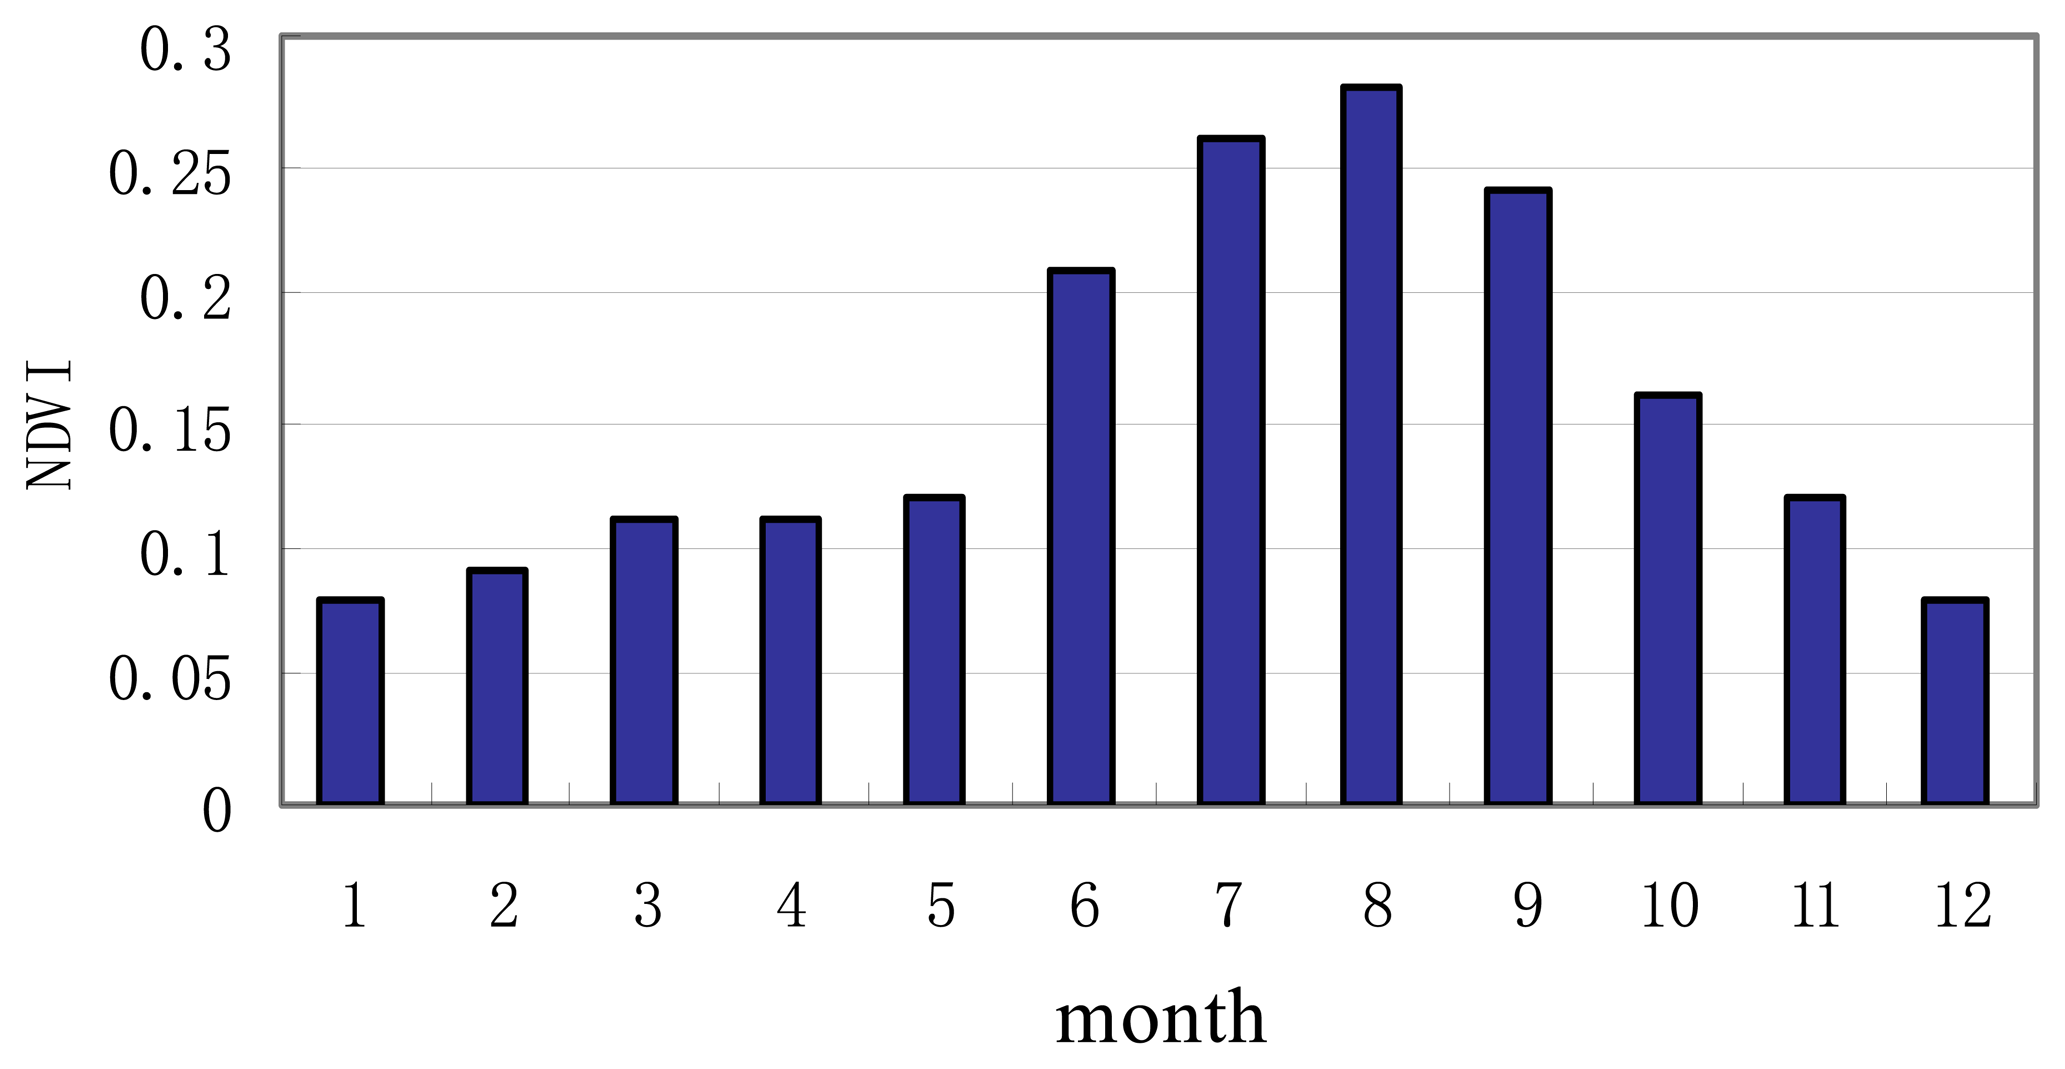
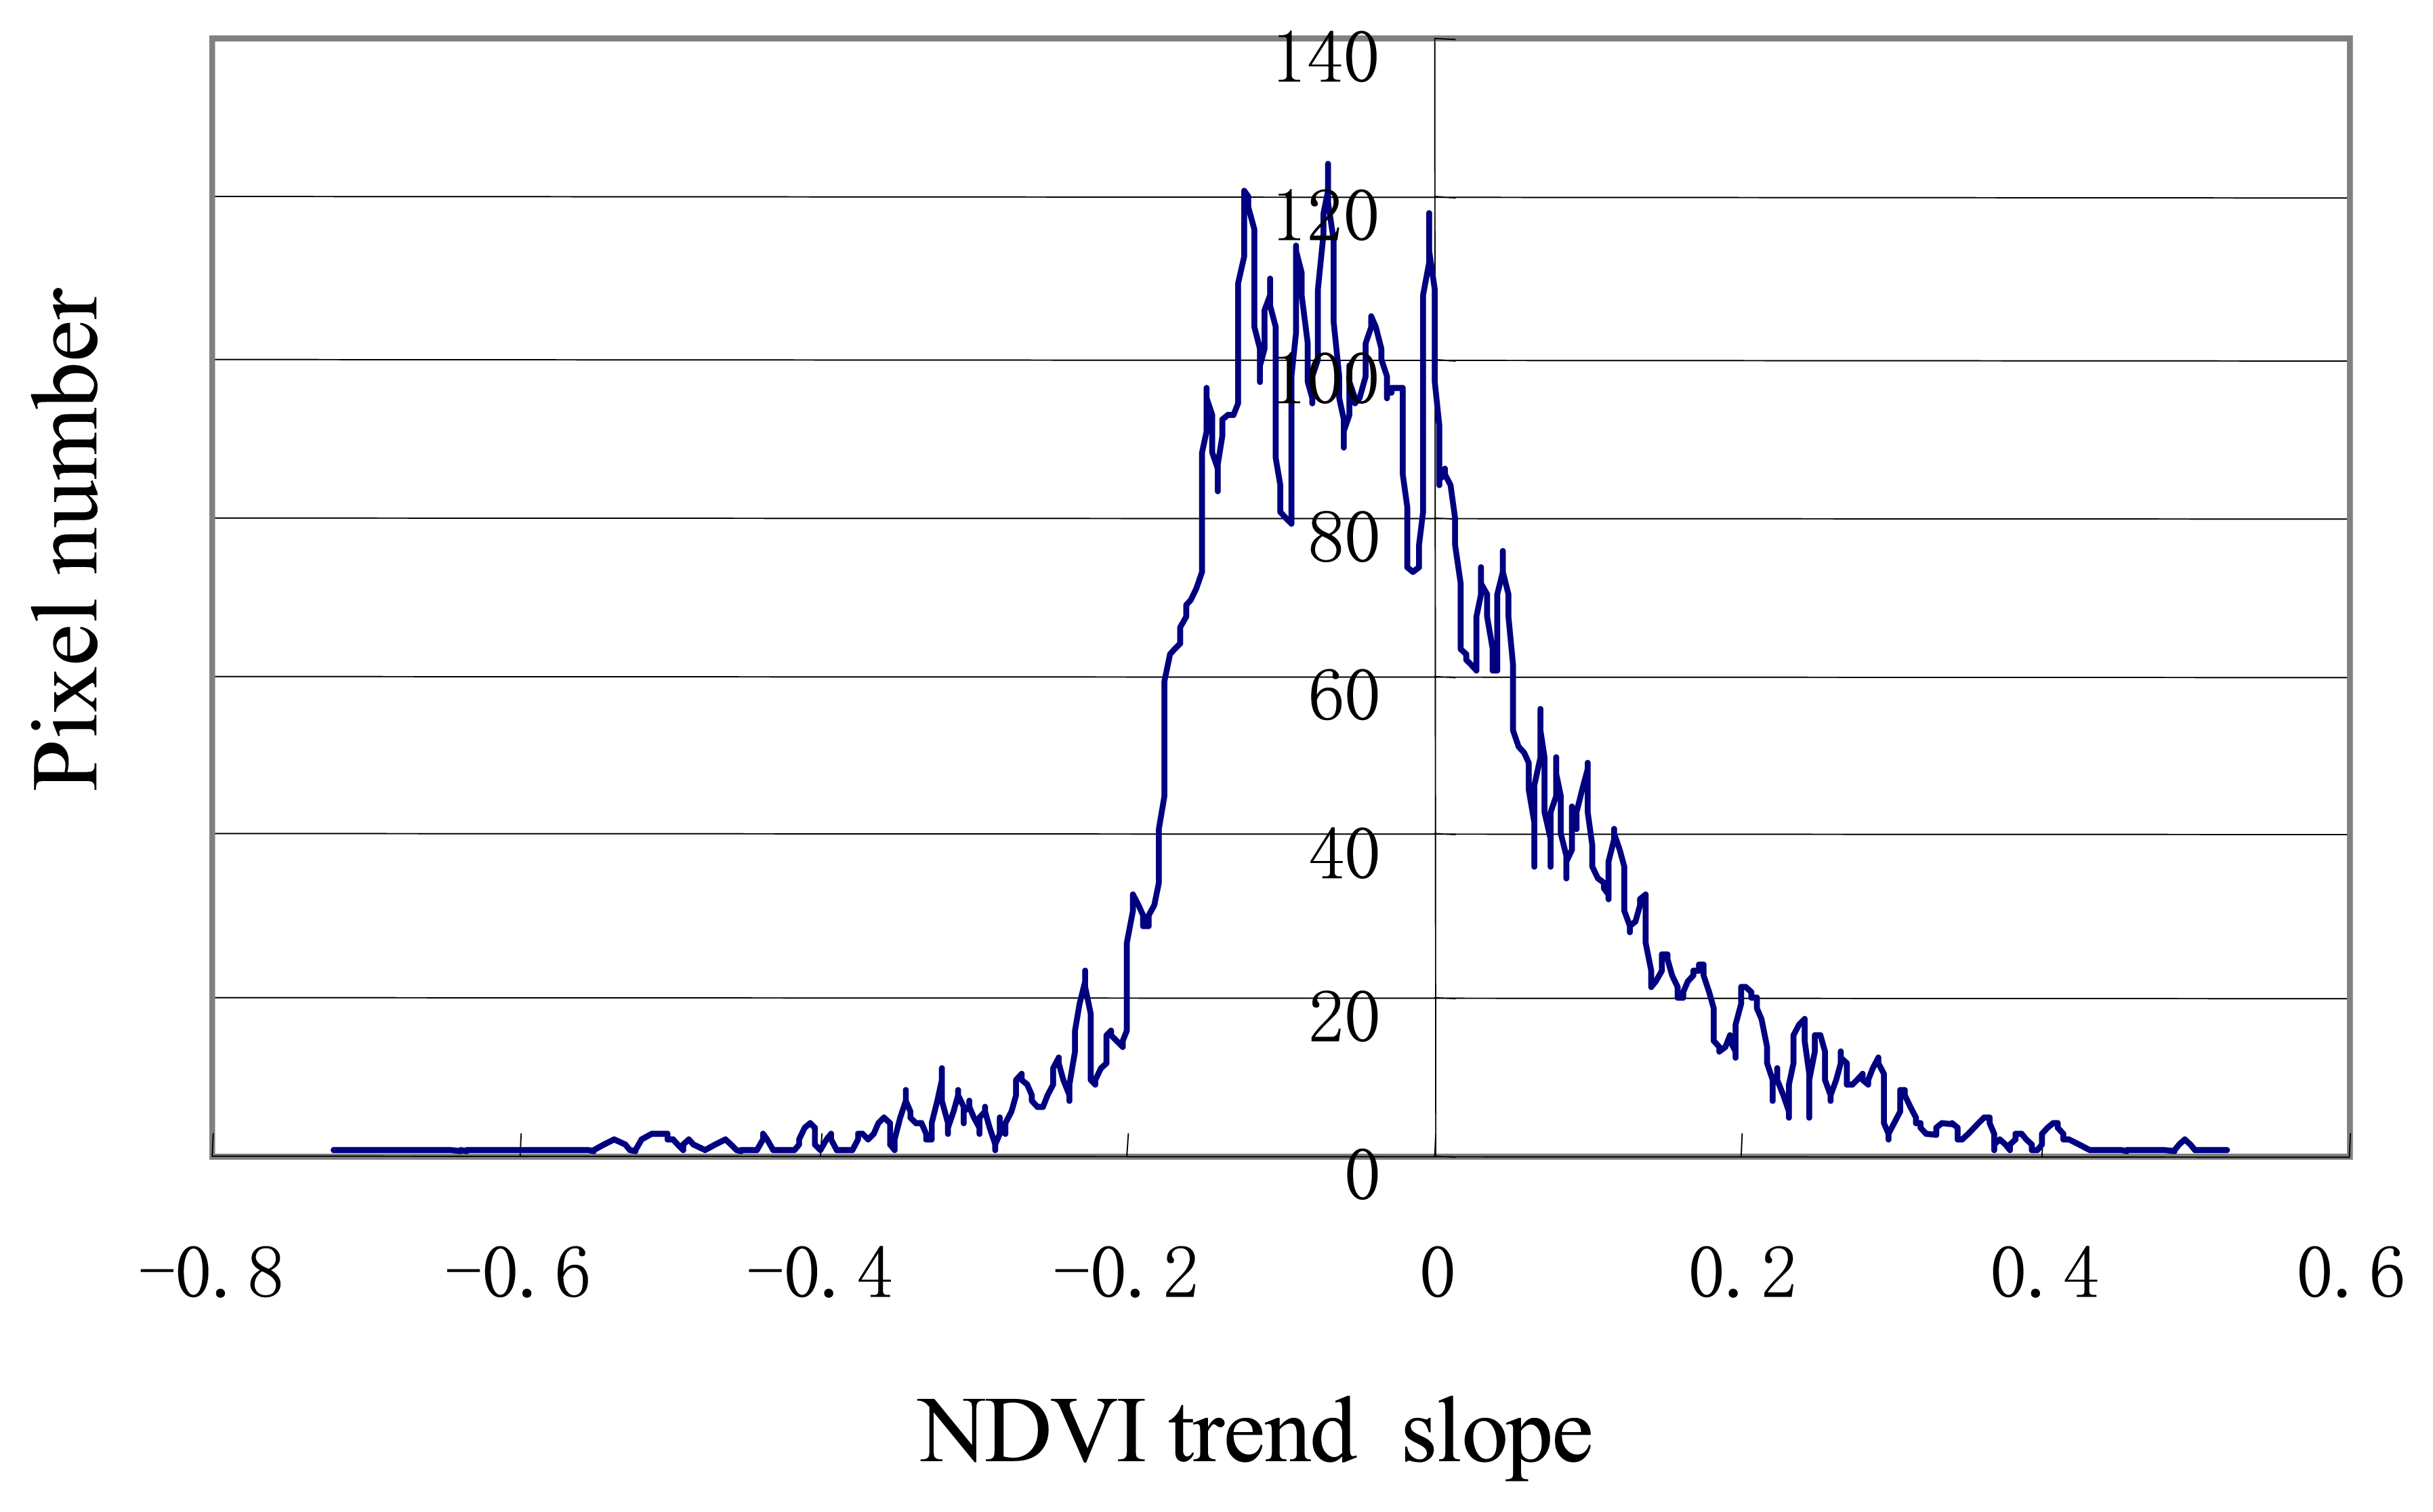
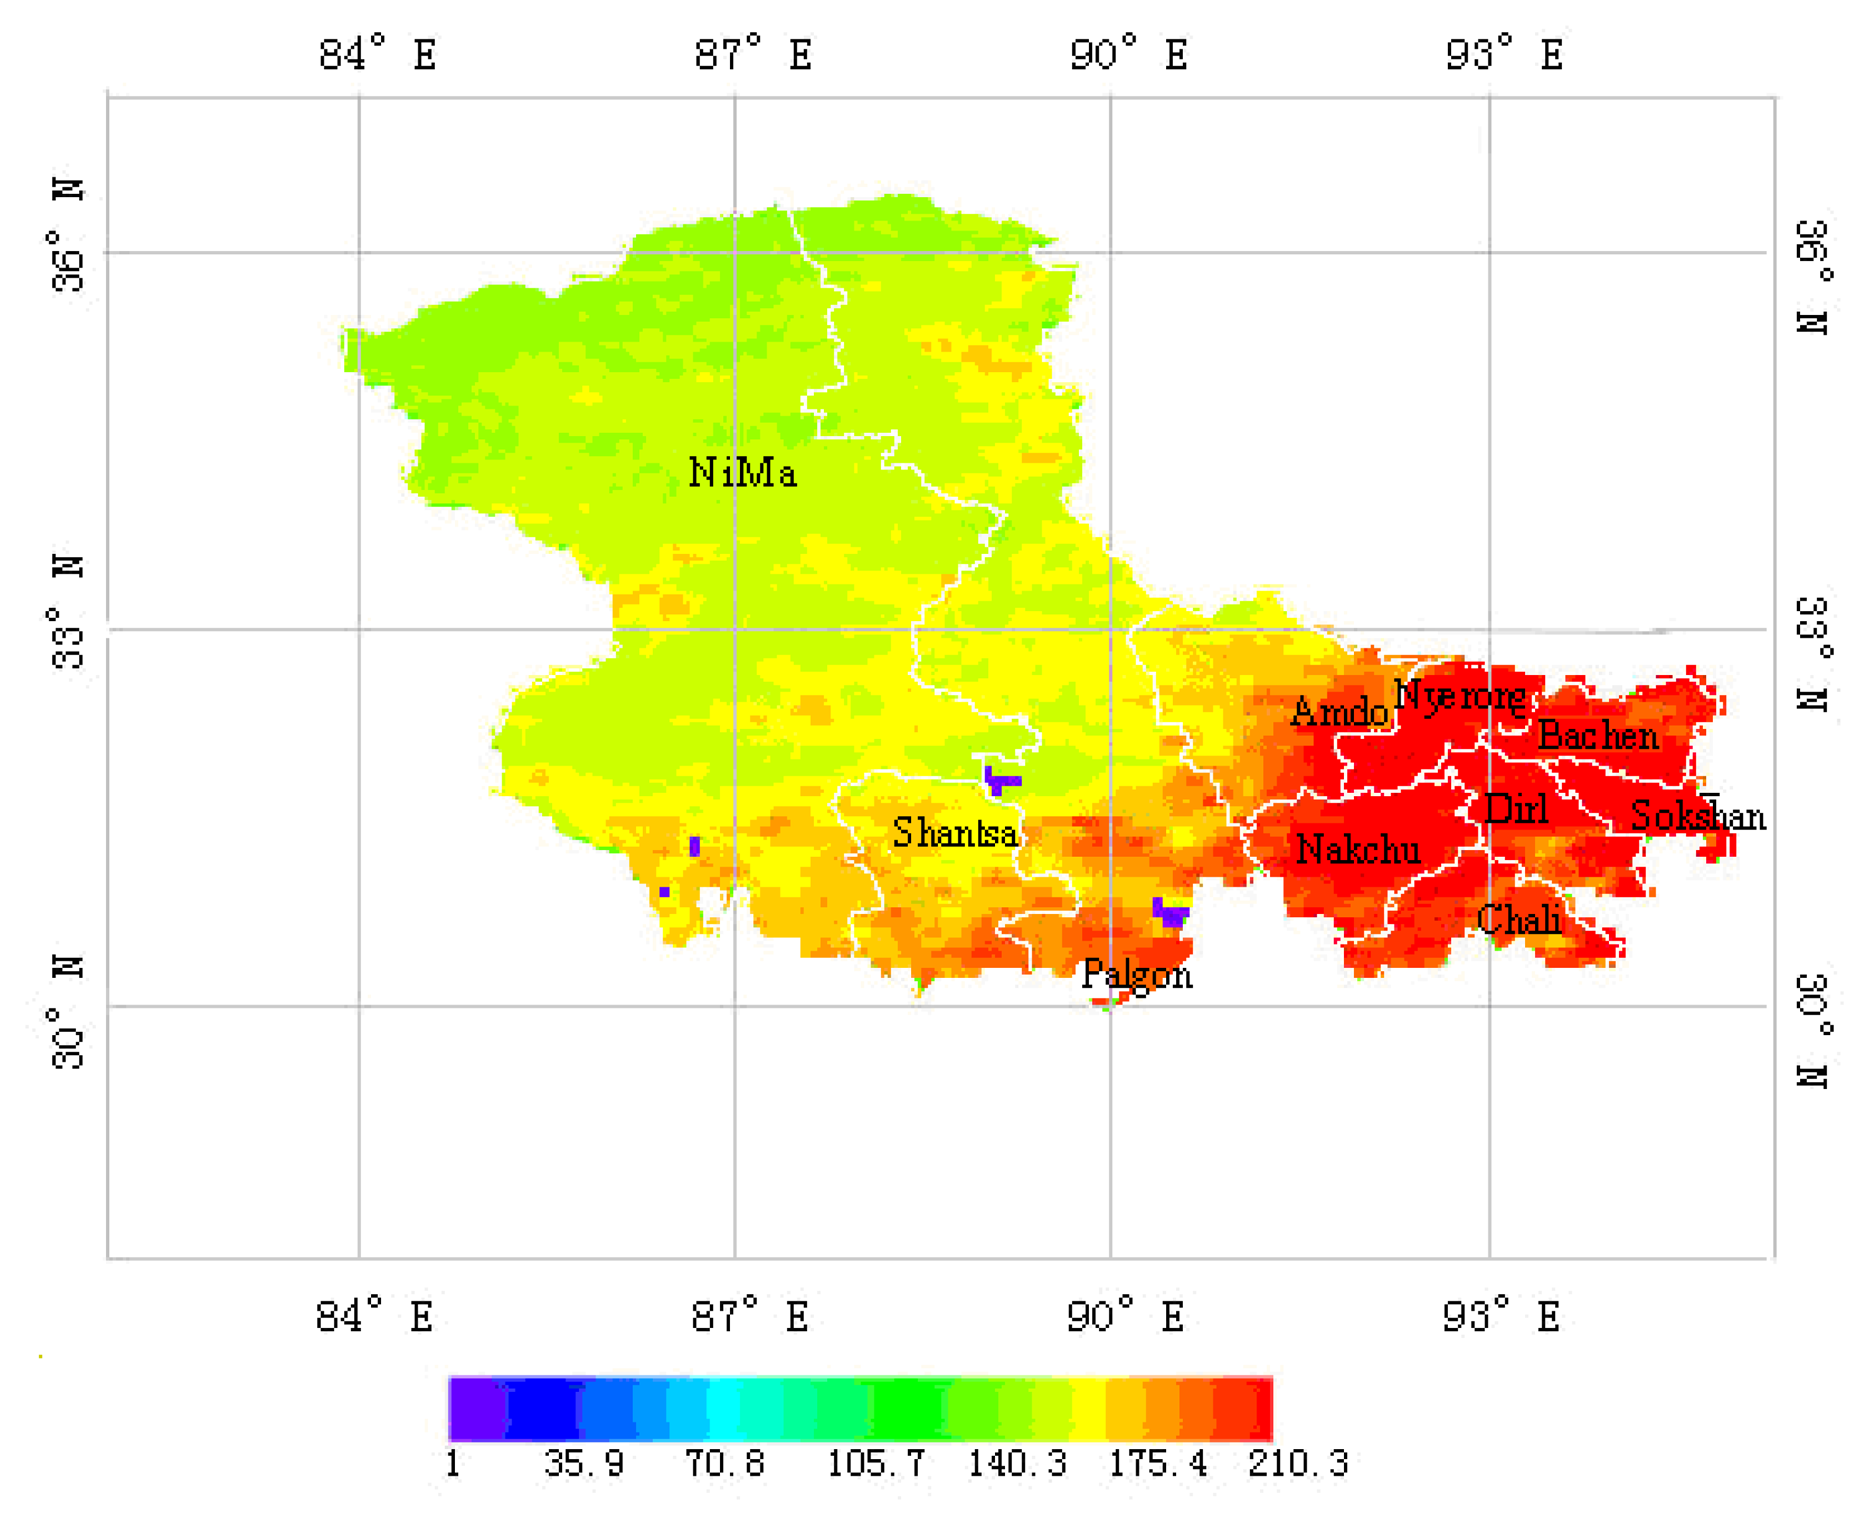
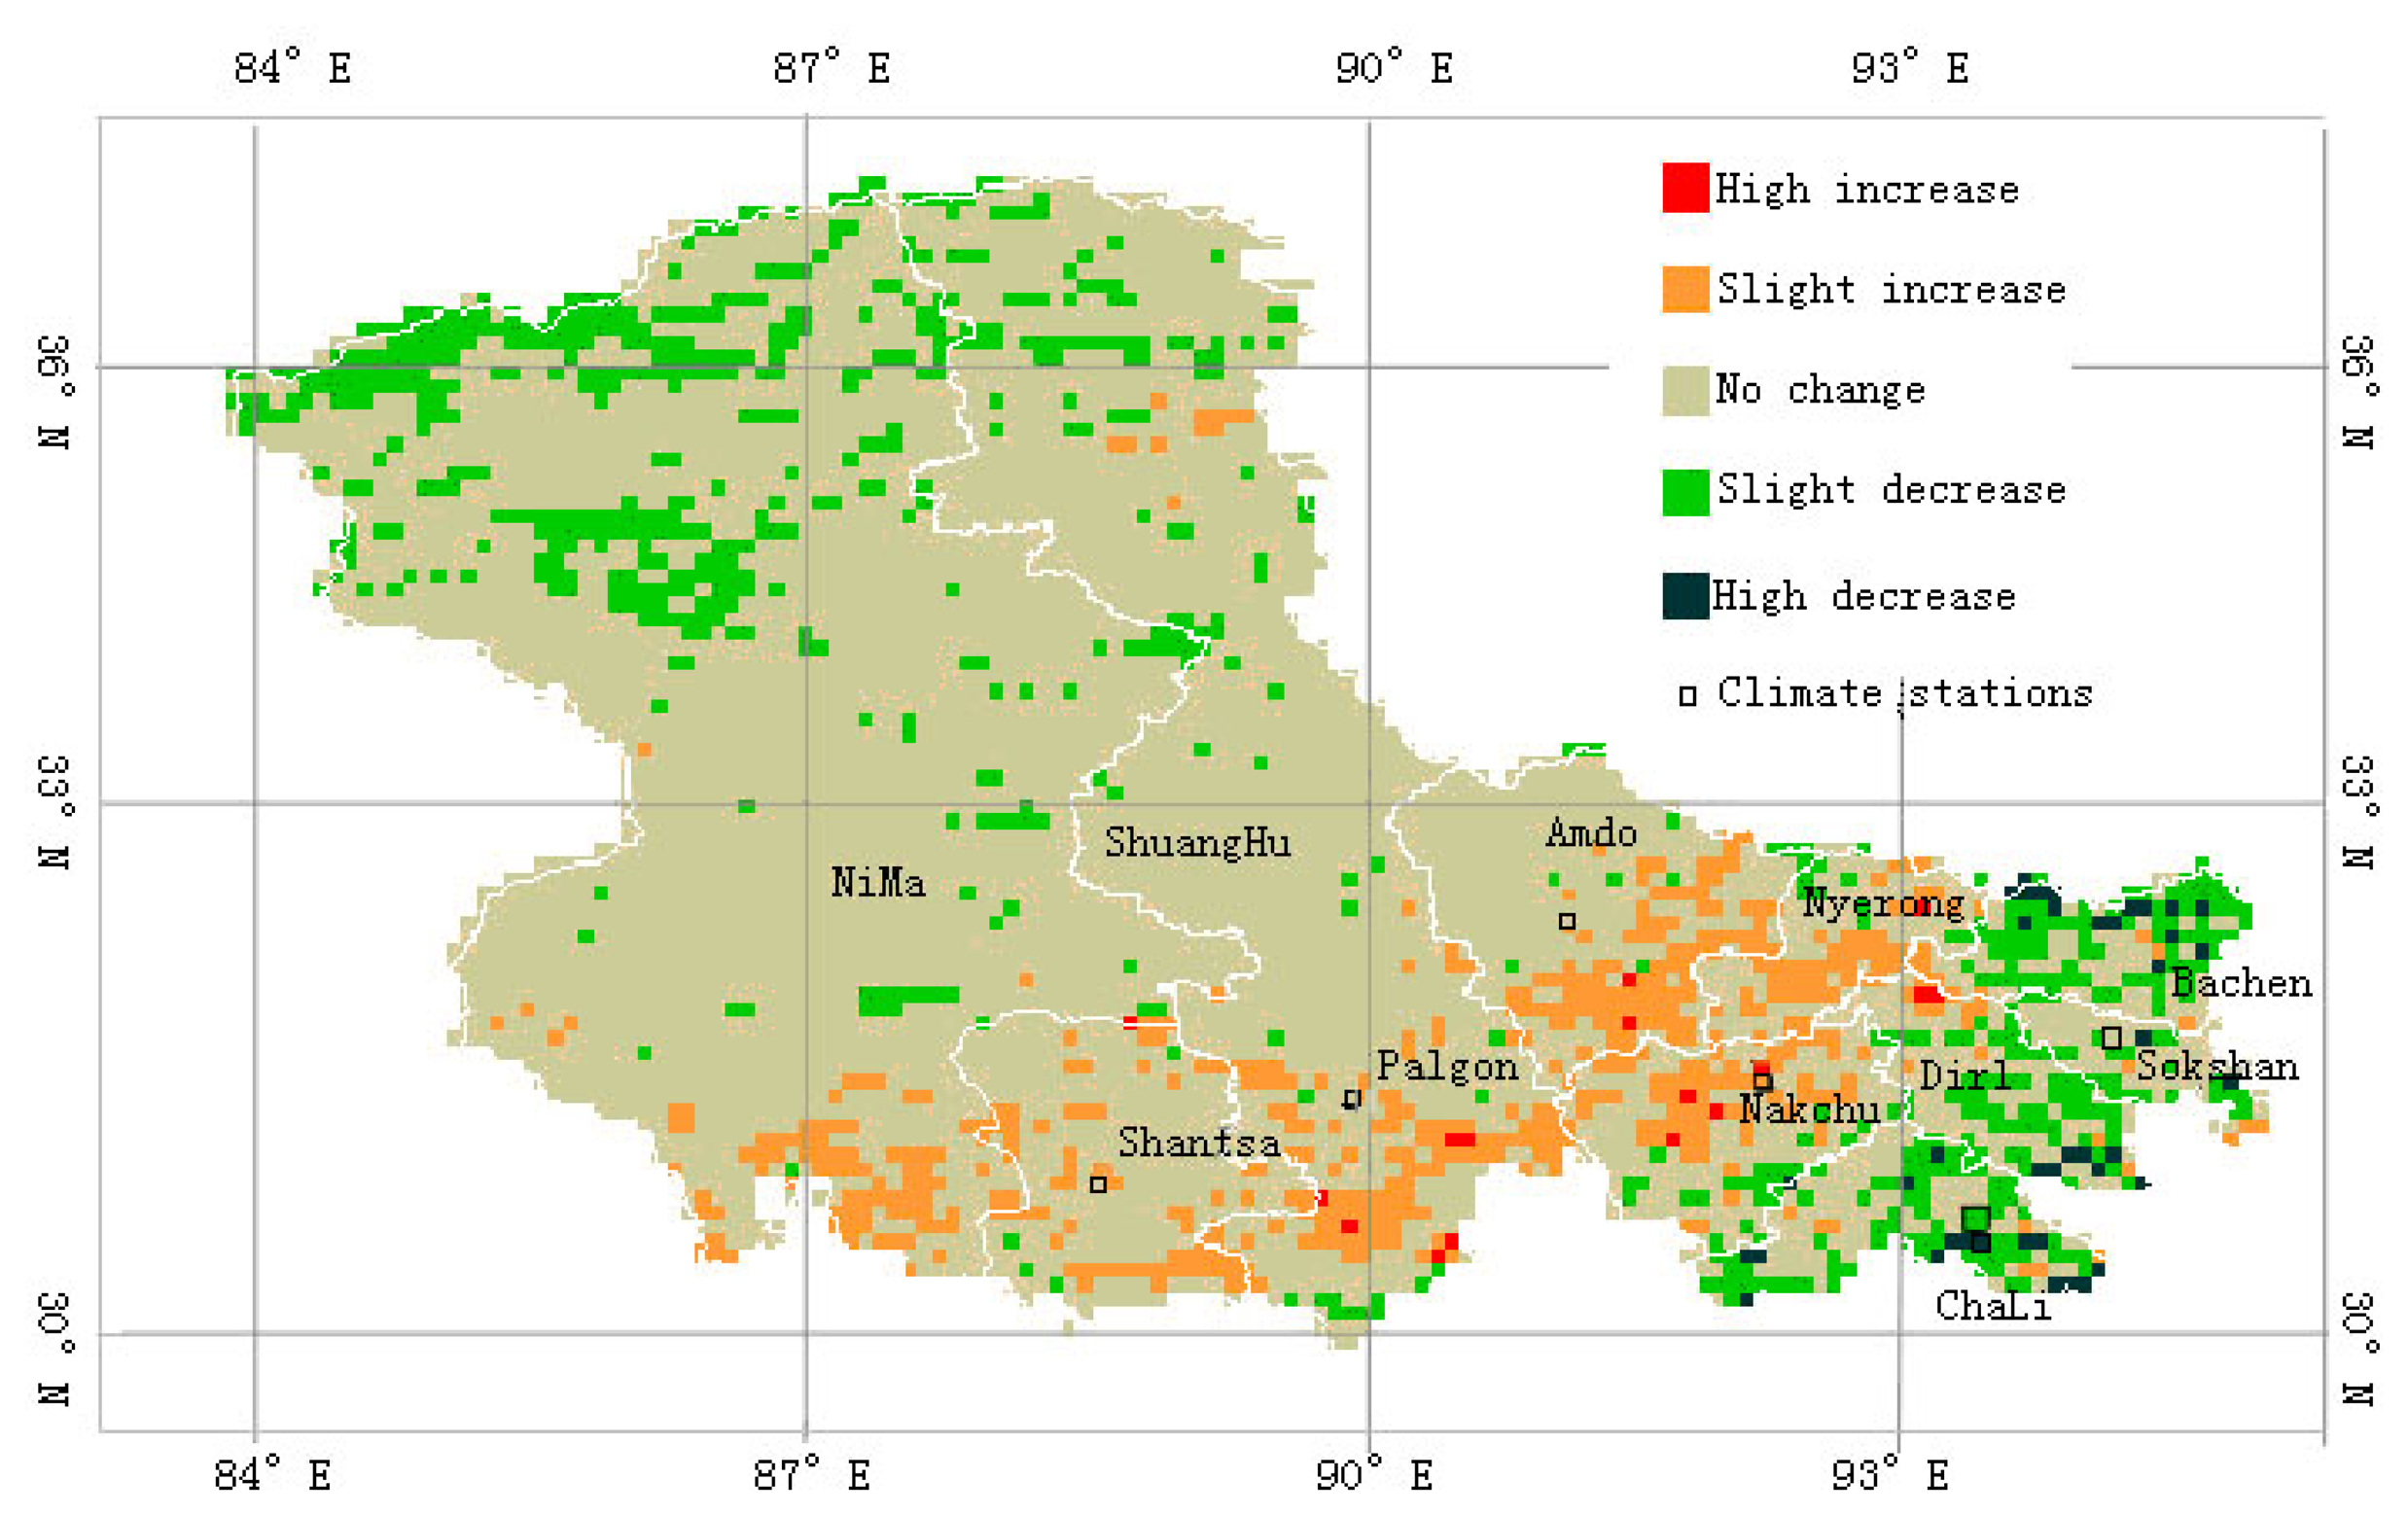
4.1. Spatial and temporal patterns of VP-NDVI of the grassland in the NTP
4.2 NDVI and Climate driving force
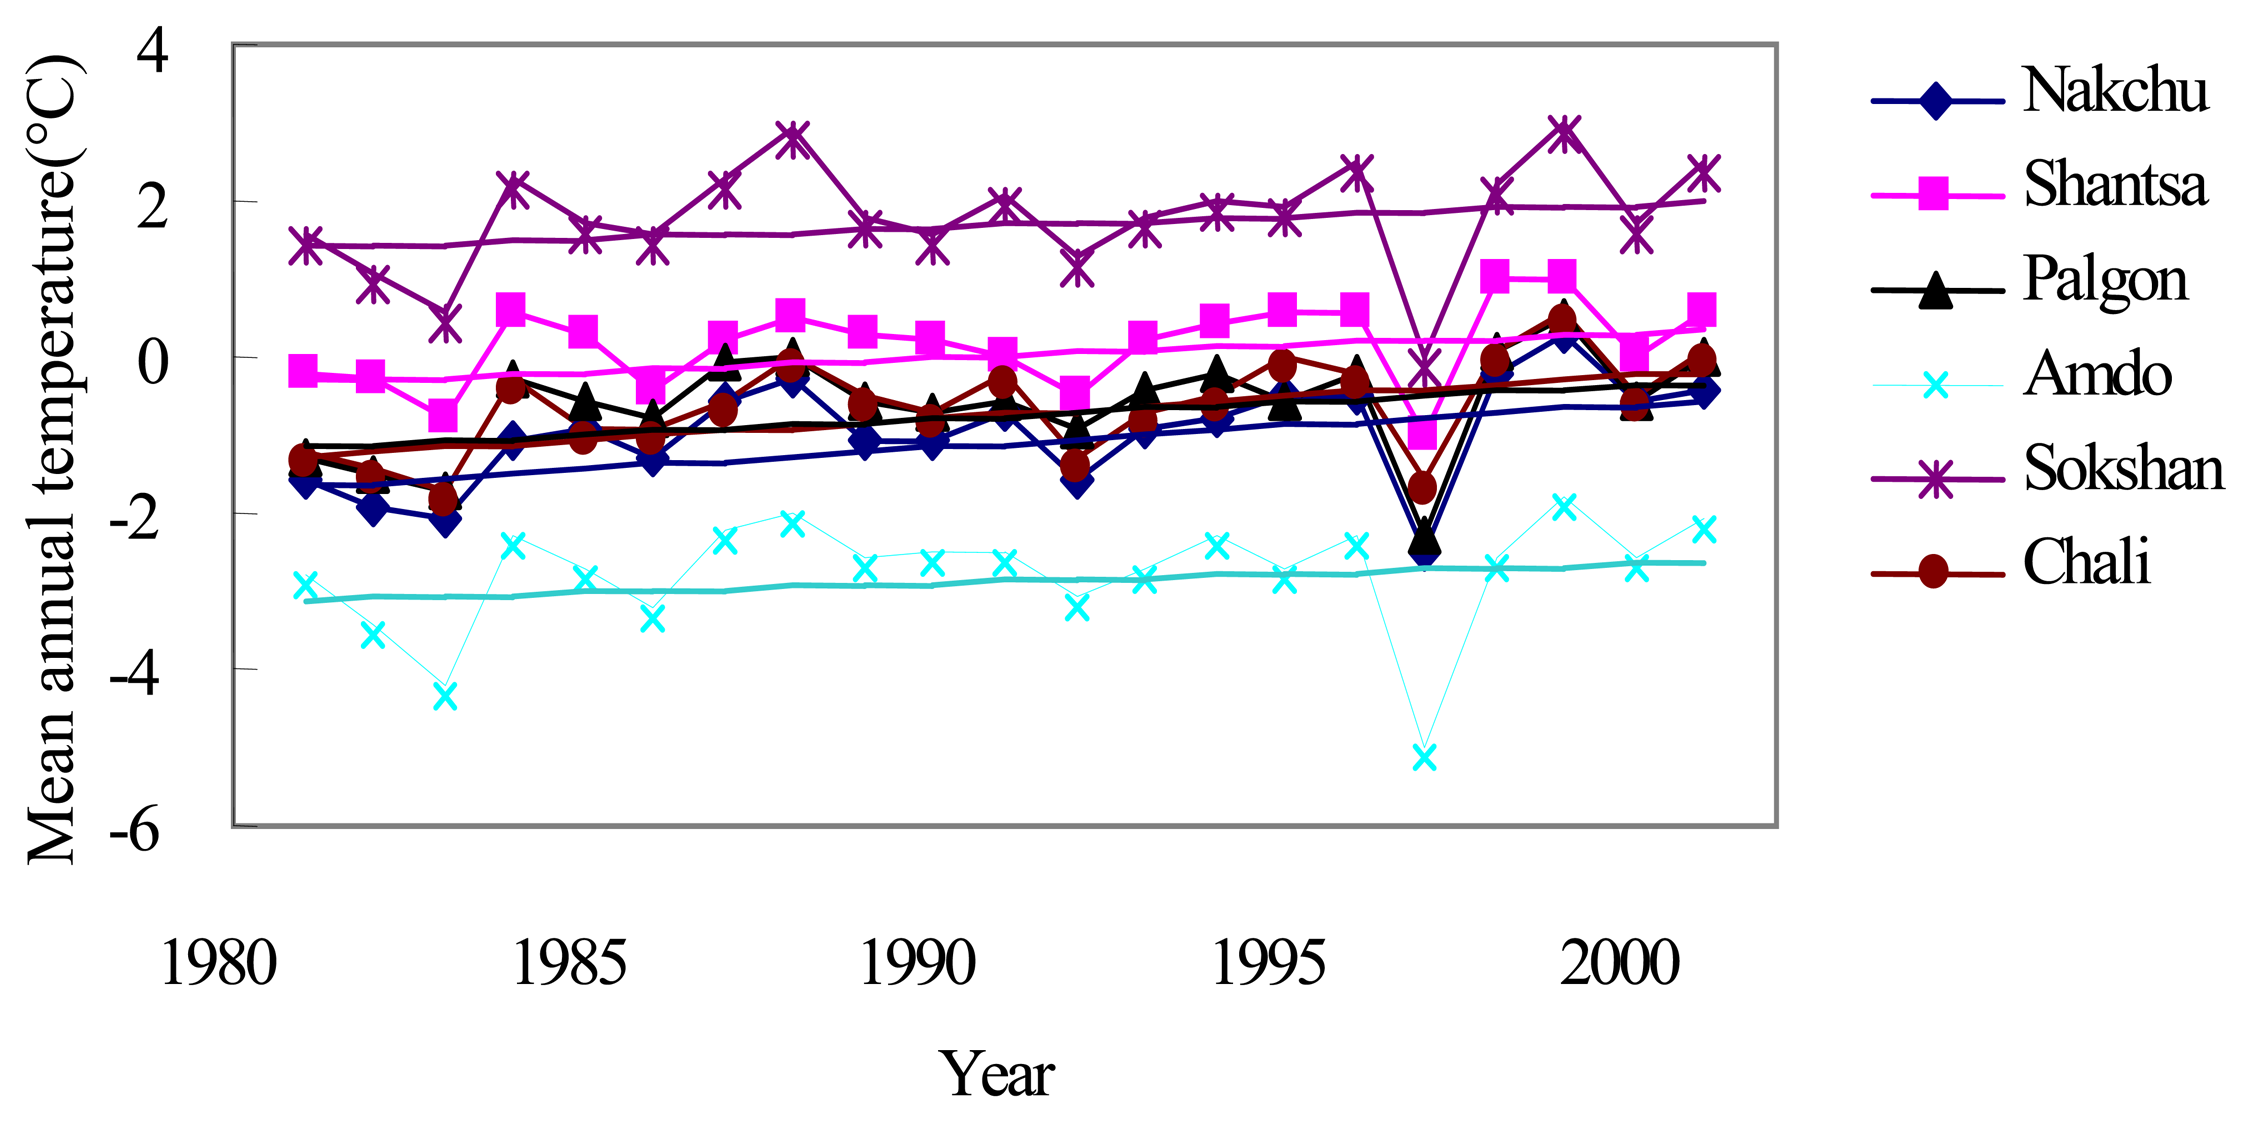
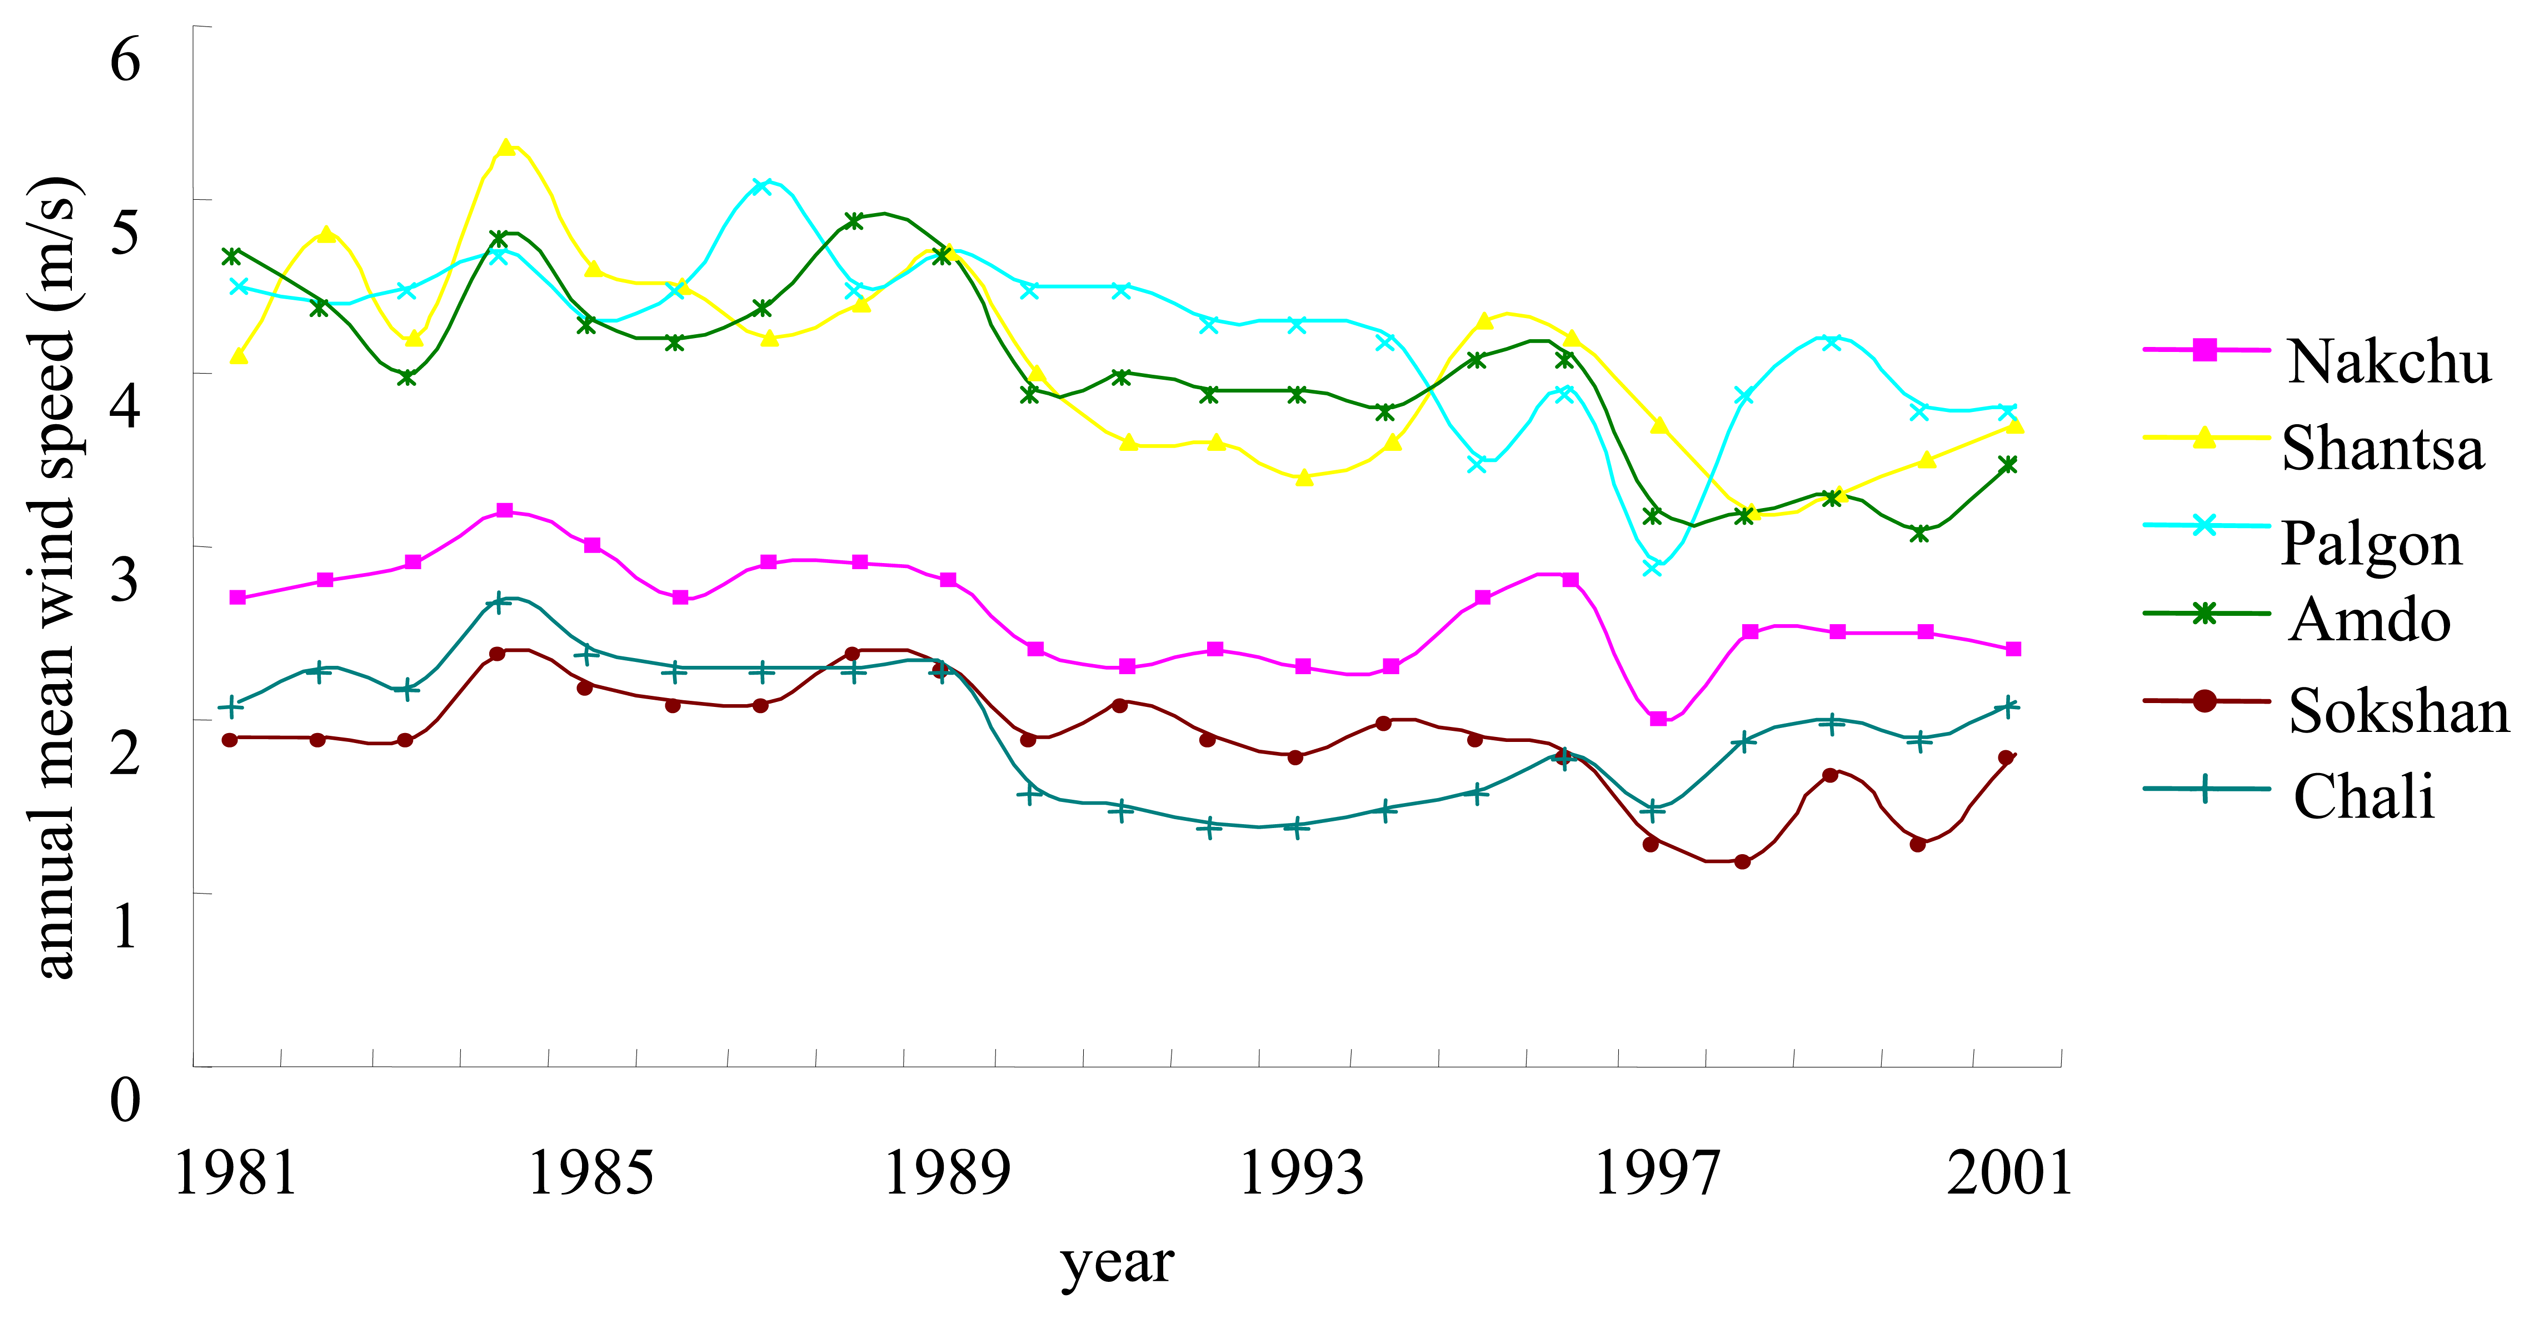
4.2.1 NDVI-climate (temperature, precipitation, evaporation, wind, sunshine duration)
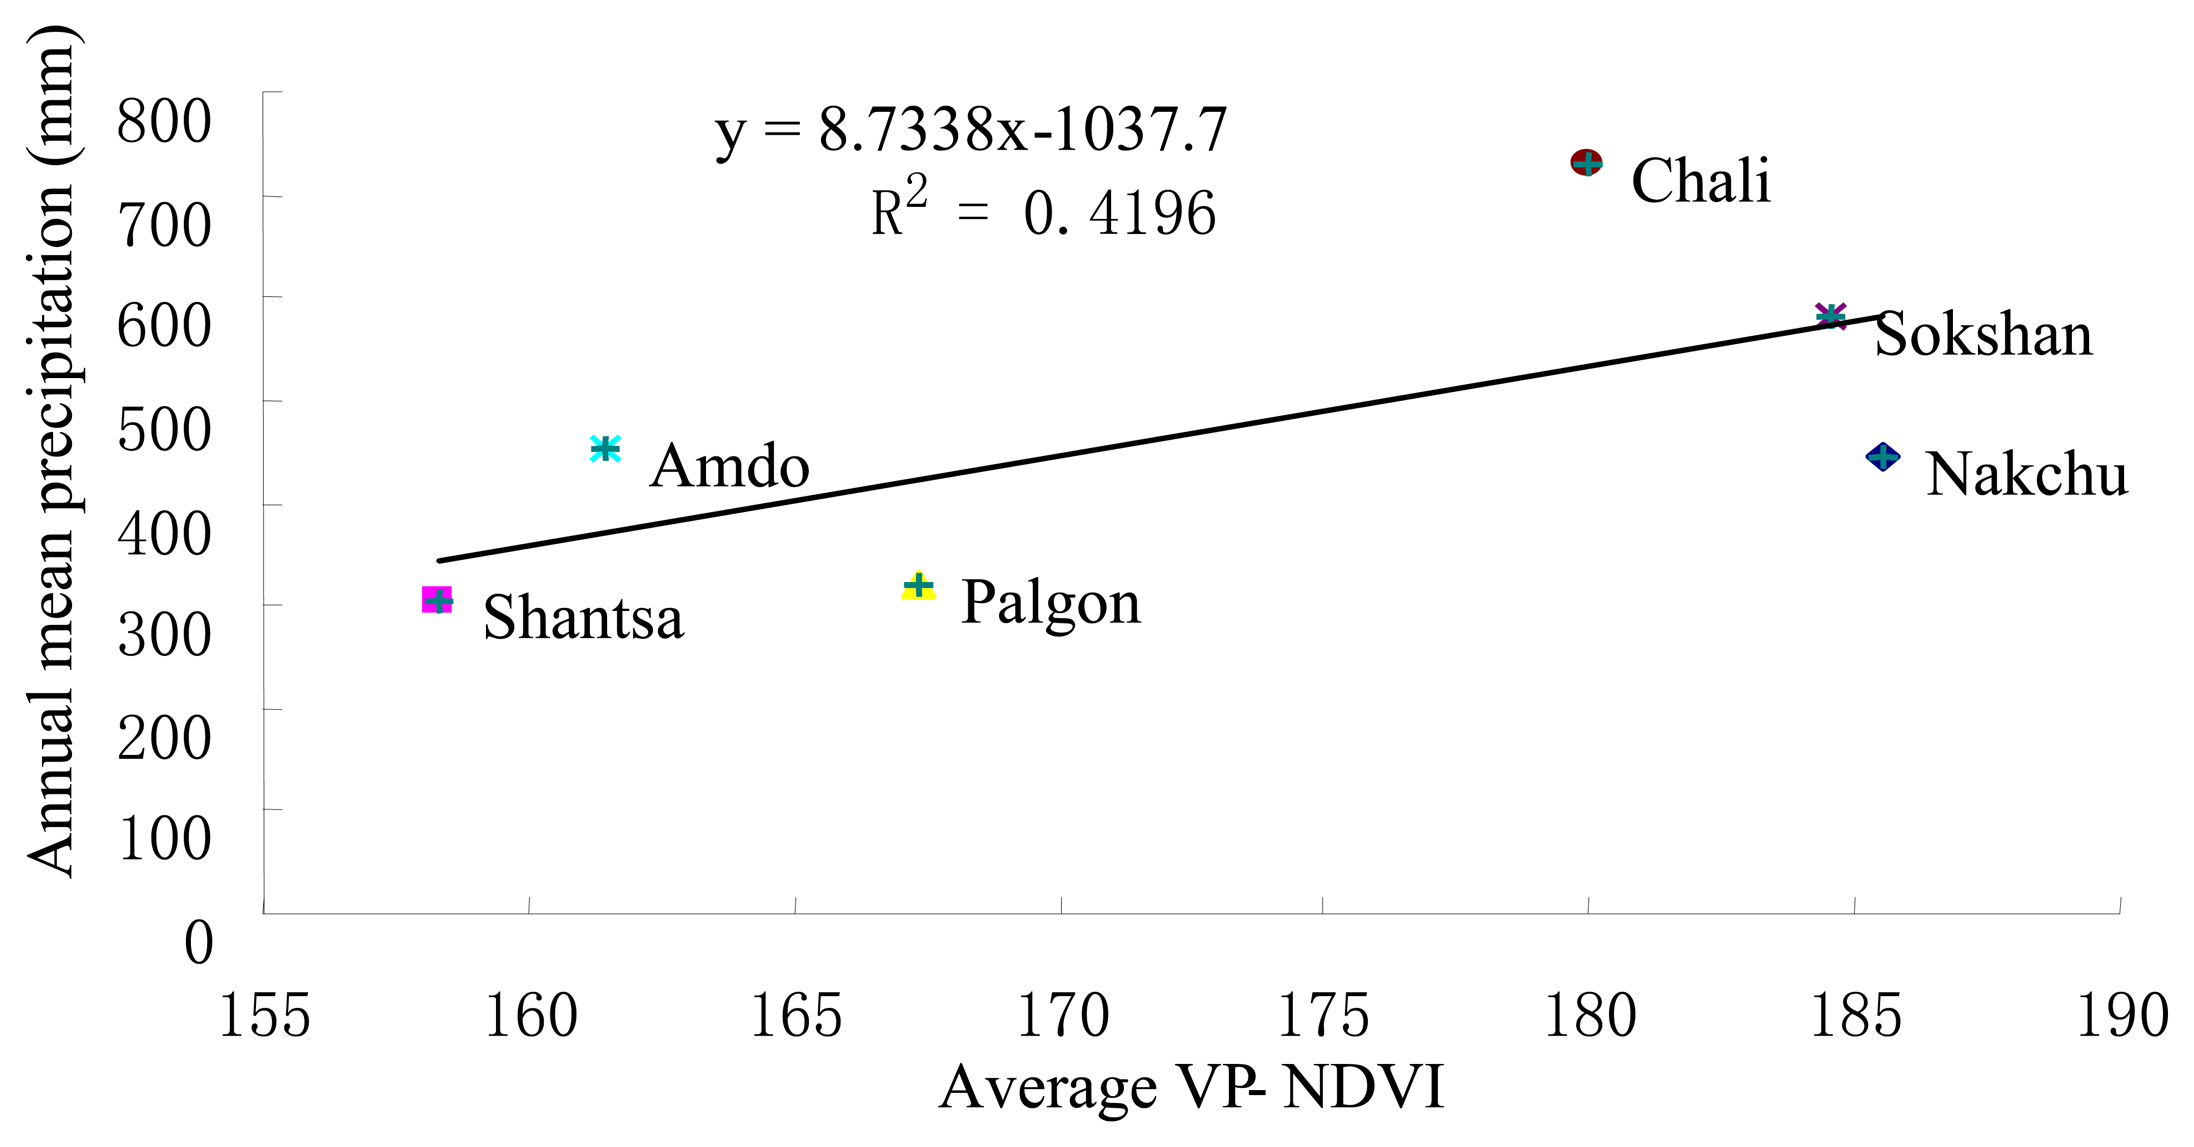
4.2.2 VP-NDVI-climate relationship by counties
Nakchu County
Chali County
Sokshan County
Shantsa County
Palgon and Amdo counties
4.3 NDVI and anthropogenic driving force
5. Conclusions
Acknowledgments
References
- Ye, D.Z.; Gao, Y.X. Meteorology of the Qinghai-Xizang Plateau; Beijing; Science Press, 1979; p. 279. [Google Scholar]
- Liu, S.Z.; Zhou, L.; Qiu, C.S.; Zhang, J.P.; Fang, Y.P.; Gao, W.S. Studies on Grassland Degradation and Desertification of Naqu Prefecture in Tibet Autonomous Region; People's Press: Lhasa, Tibet, 1999; pp. 4–33. [Google Scholar]
- Sun, H.L.; Zheng, D. Formation, evolution and development of Qinghai-Xizang Plateau.; Guang Zhou; Guang Dong Scientific and Technological Press, 1998; pp. 66–148. [Google Scholar]
- An, Z.S.; Kutzbuch, J.E.; Prell, W.L.; Porter, S.C. Evolution of Asian monsoons and phased uplift of the Himalaya Tibetan plateau since Late Miocene times. Nature 2001, 411, 62–66. [Google Scholar]
- Su, D.; Xue, S. Grassland Resources in Tibet Autonomous Region; Science Press: Beijing, 1994; pp. 189–193. [Google Scholar]
- Ye, D.; Wu, G. The role of the heat source of the Tibetan Plateau in the general circulation. Meteor. Atmos. Phys. 1998, 67, 181–198. [Google Scholar]
- Liu, X.S.; Ma, Y.C.; La, B.; Yu, Z.S. Climatic Division of the Animal Husbandry of Naqu Region.; Meteorological Press: Beijing, China, 2003; pp. 6–34. [Google Scholar]
- Zhang, J.H.; Dong, W.J.; Wang, C.Y.; Liu, J.Y.; Yao, F.M. Dynamic of China's cultivated land and land cover changes of its typical regions based on remote sensing data. J. Fore. Res. 2001, 12, 183–186. [Google Scholar]
- Vitousek, P.M.; Mooney, H.A.; Lubchenco, J.; Melillo, J.M. Human domination of Earth's ecosystems. Science 1997, 277, 494–499. [Google Scholar]
- Geist, H.; Lepers, E.; McConnel, W.; Lambin, E.; Ramankutty, N. Land-Use and Land-Cover Change/Meta-analyses of the causes and synthesis of the rates of change. IHDP, UPDATE 2002, 4, 15. [Google Scholar]
- Zhang, J. H.; Bian, L. G.; Liu, X. S. To study eco-environment and meteorological disasters in Northern Tibet-Plateau based on remote sensing information. J. Mountain Sci. 2005, 23, 94–100. [Google Scholar]
- Fang, X.; Han, Y.; Ma, J.; Song, L.; Yang, S.; Zhang, X. Dust storms and loess accumulation on the Tibetan Plateau: A Case study of dust event on 4 March 2003 in Lhasa. Chin. Sci. Bull. 2004, 49, 953–960. [Google Scholar]
- Matthews, E. Global vegetation and land use: New high resolution data bases for climate studies. J. Climatol. Appl. Meteorol. 1983, 22, 474–487. [Google Scholar]
- Tucker, C.J.; Justice, C.O. Satellite remote sensing of primary production. Int. J. Remote Sens. 1987, 7, 1395–1416. [Google Scholar]
- Gutman, G. On the relationship between monthly mean and maximum value composite normalized vegetation indices. Int. J. Remote Sens. 1989, 10, 1317–1325. [Google Scholar]
- Paul, T. Remote sensing technology for rangeland management applications. Int. J. Range Manag. 1989, 42, 1–14. [Google Scholar]
- Plummer, S.E. Perspectives on combining ecological process models and remotely sensed data. Ecol. Model. 2000, 129, 169–186. [Google Scholar]
- García, M.; Villagarcía, L.; Contreras, S.; Domingo, F.; Puigdefábregas, J. Comparison of three operative models for estimating the surface water deficit using ASTER reflective and thermal data. Sensors 2007, 7, 860–883. [Google Scholar]
- Taylor, B.F. Determination of seasonal and inter-annual variation in New Zealand pasture growth from NOAA-7 Data. Remote Sens. Environ. 1985, 18, 177–192. [Google Scholar]
- Cihlar, J.; St.-Laurent, L.; Dyer, J.A. Relation between the normalized difference vegetation index and ecological variables. Remote Sens. Environ. 1993, 35, 279–298. [Google Scholar]
- Ehlrich, D.; Estes, J.E.; Singh, A. Application of NOAA-AVHRR 1km data for environmental monitoring. Int. J. Remote Sens. 1994, 15, 145–161. [Google Scholar]
- Csiszar, I.; Gutman, G. Mapping global land surface albedo from NOAA AVHRR. J. Geophy. Res. 1999, 104, 6215–6228. [Google Scholar]
- Zhang, J.H.; Fu, C.B.; Kanzawa, H. Simulating canopy stomata conductance of winter wheat and its distribution using remote sensing information. J. Environ. Sci. 2001, 13(4), 439–443. [Google Scholar]
- Shabanov, N.V.; Zhou, L.; Knyazikhin, Y.; Myneni, R.B.; Tucker, C.J. Analysis of Inter-annual Changes in Northern Vegetation Activity Observed in AVHRR Data From 1981 to 1994. IEEE. Trans. Geosci. Remote Sens. 2002, 40, 115–130. [Google Scholar]
- Tucker, C.J.; Townshend, J.R.G.; Goff, T.E. African land-cover classification using satellite data. Science 1985, 227, 369–375. [Google Scholar]
- Justice, C. Monitoring the grasslands of semi-arid Africa using NOAA-AVHRR data. Int. J. Remote Sens. 1986, 7, 1383–1622. [Google Scholar]
- Townshend, J.R.G. Global data sets for land applications from the advanced very high resolution radiometer: an introduction. Int. J. Remote Sens. 1994, 15, 3319–3332. [Google Scholar]
- Eidenshink, J.C.; Faundeen, J.L. The 1 km AVHRR global land data set: First stages of implementation. Int. J. Remote Sens. 1994, 15, 3343–3462. [Google Scholar]
- Defries, R.S.; Hansen, M.; Townshend, J.R.G. Global discrimination of land cover types from metrics derived from AVHRR pathfinder data. Remote Sens. Environ. 1995, 54, 209–222. [Google Scholar]
- Gutman, G.; Ignatov, A. Global land monitoring from AVHRR: Potential and limitations. Int. J. Remote Sens. 1995, 16, 2301–2309. [Google Scholar]
- Running, S.W.; Loverland, T.R.; Pierce, L.L.; Nemani, R.R.; Hunt, E.R.J. A remote sensing based vegetation classification logic for global land cover analysis. Remote Sens. Environ. 1995, 51, 39–48. [Google Scholar]
- Loveland, T.R.; Reed, B.C.; Brown, J.F.; Ohlen, D.O.; Zhu, Z.; Yang, L.; Merchant, J.W. Development of a global land cover characteristics database and IGBP DIS cover from 12km AVHRR data. Int. J. Remote Sens. 2000, 21, 1303–1330. [Google Scholar]
- Stow, D. A.; Hope, A.; McGuire, D.; Verbyla, D.; Gamon, J.D.; Daeschner, S.; Petersen, A.; Zhou, L.; Myneni, R. Remote sensing of vegetation and land-cover change in Arctic Tundra Ecosystems. Remote Sens. Environ. 2004, 89, 281–308. [Google Scholar]
- Kogan, F.N. Remote sensing of weather impacts on vegetation in non-homogeneous area. Int. J. of Remote Sens. 1990, 11, 1405–1419. [Google Scholar]
- Anyamba, A.; Eastman, J.R. Interannual Variability of NDVI over Africa and its Relation to EL Nino/Southern Oscillation. Int. J. Remote Sens. 1996, 17, 2533–2548. [Google Scholar]
- Gutman, G.G. Global data on land surface parameters from NOAA AVHRR for use in numerical climate models. J. Clim. 1994, 7, 669–680. [Google Scholar]
- Moulin, S.; Kergoat, L.; Viovy, N.; Dedieu, G.G. Global-scale assessment of vegetation phenology using NOAA/ AVHRR satellite measurements. J. Clim. 1997, 10, 1154–1170. [Google Scholar]
- Goetz, S.J. Multi-sensor analysis of NDVI, surface temperature and biophysical variable at a mixed grassland site. Int. J. Remote Sens. 1997, 18, 71–94. [Google Scholar]
- Los, S.O.; Collatz, G.J.; Sellers, P.J.; Malmstrom, C.M.; Pollack, N.H.; Defries, R.S.; Bounoua, L.; Parris, M.T.; Tucker, C.J.; Dazlich, D.A. A global 9-yr biophysical land. surface dataset from NOAA AVHRR Data. J. Hydrometeorol. 2000, 1, 183–199. [Google Scholar]
- Zhang, J.H.; Yao, F.M.; Fu, C.B.; Yan, X.D. Study on response of ecosystem to the East Asian monsoon in eastern China using LAI data derived from remote sensing information. Prog. Nat. Sci. 2004, 14, 279–282. [Google Scholar]
- Braswell, B.H.; Schimel, D.S.; Linder, E.; Moore, B., III. The response of global terrestrial ecosystems to interannual temperature variability. Science. 1997, 278, 870–873. [Google Scholar]
- Shaw, M.R.; Zavaleta, E.S.; Chiariello, N.R.; Cleland, E.E.; Mooney, H.A.; Field, C.B. Grassland responses to global environmental changes suppressed by elevated CO2. Science 2002, 298, 1987–1990. [Google Scholar]
- Zavaleta, E.S.; Shaw, M.R.; Chiariello, N.R.; Thomas, B.D.; Cleland, E.E.; Field, C.B.; Mooney, H.A. Grassland responses to three years of elevated temperature, CO2, precipitation, and N deposition. Ecol. Monog. 2003, 73, 585–604. [Google Scholar]
- Yang, L.; Wylie, B.K.; Tieszen, L.L.; Reed, B.C. An analysis of relationships among climate forcing and Time-integrated NDVI of grasslands over the U.S. Northern and Central Great Plains. Remote Sens. Environ. 1998, 65, 25–37. [Google Scholar]
- Zhang, R.Z.; Zheng, D.; Yang, Q.Y. A Physical Geography of Tibet.; Science Press: Beijing, China, 1982; p. 178 pp. [Google Scholar]
- Agbu, P.A.; James, M.E. The NOAA/NASA Pathfinder AVHRR Land Data Set User's Manual.; Goddard Distributed Active Archive Center, NASA, Goddard Space Flight Center: Greenbelt, 1994. [Google Scholar]
- Rao, C.R.N.; Chen, J. Revised post-launch calibration of the visible and near-infrared channels of the Advanced Very High Resolution Radiometer on the NOAA-14 spacecraft. Int. J. Remote Sens. 1999, 20, 3485–3491. [Google Scholar]
- Holben, B.N. Characteristics of maximum-value composite images from temporal AVHRR data. Int. J. Remote Sens. 1986, 7, 1417–1434. [Google Scholar]
- Myneni, R.B.; Hall, F.G.; Sellers, P.J.; Marshak, A.L. The interpretation of spectral vegetation indexes. IEEE Trans. Geosci. Rem. Sens. 1995, 33, 481–486. [Google Scholar]
- Runnström, M.C. Is northern China winning the battle against desertification?: Satellite remote sensing as a tool to study biomass trends on the Ordos Plateau in semiarid China. AMBIO 2000, 29(8), 468–476. [Google Scholar]
- Allen, R.G.; Perira, L.S.; Raes, D.; Smith, M. Crop evapotranspiration. FAO Irrigation and Drainage.; Paper 24; Rome. Italy, 1998; p. 290p. [Google Scholar]
- Liu, X.D.; Chen, B. Climate warming in the Tibetan Plateau during recent decades. Int. J. Climatol. 2000, 20, 1729–1742. [Google Scholar]
- Zhang, G.P.; Zhang, J.H.; Sun, Z.X. Quantitative study on Aeolian erosion of soil in China based on GIS/RS techniques. J. Mountain Science 2005, 23 (suppl.), 117–123. [Google Scholar]
- Nakchu Statistical Bureau. The Corpus of Statistical Data of Nakchu Prefecture in Tibet Autonomous Region (1958-2000).; Lhasa; Tibet Statistical Press, 2001. [Google Scholar]
- Beniston, M. Climatic change in mountain regions: a review of possible impacts. Clim. Change 2003, 59, 5–31. [Google Scholar]


| Station names | Longitude (°E) | Latitude (°N) | Altitude (m) | Annual mean precipitation (mm) | Annual mean temperature(°C) |
|---|---|---|---|---|---|
| Nakchu | 92.1 | 31.5 | 4,508 | 428.9 | -1.30 |
| Shantsa | 88.6 | 31.0 | 4,674 | 298.6 | -2.90 |
| Palgon | 90.0 | 31.4 | 4,701 | 320.6 | -0.05 |
| Amdo | 91.1 | 32.4 | 4,801 | 435.3 | -2.80 |
| Sokshan | 93.8 | 31.9 | 4,024 | 572.3 | 1.60 |
| Chali | 93.3 | 30.7 | 4,489 | 708.4 | -0.90 |
| Trend in VP-NDVI | Trend line coefficients value | Pixel number | Proportion |
|---|---|---|---|
| High increase | >0.41 | 16 | 0.27% |
| Slight increase | 0.15∼0.41 | 516 | 8.71% |
| No change | -0.15∼0.15 | 4,578 | 77.27% |
| Slight decrease | -0.41∼-0.15 | 774 | 13.06% |
| High decrease | <-0.41 | 41 | 0.69% |
| Stations | Nakchu | Shantsa | Palgon | Amdo | Sokshan | Chali |
|---|---|---|---|---|---|---|
| bv | 0.409 | 0.238 | 0.058 | -0.018 | -0.069 | -0.161 |
| bp | 4.354 | 5.881 | 0.067 | 1.678 | 0.427 | 4.799 |
| bE | -10.390 | -4.380 | -9.340 | -15.640 | -0.360 | -8.370 |
| Station | Nakchu | Shantsa | Palgon | Amdo | Sokshan | Chali |
|---|---|---|---|---|---|---|
| Vegetation type | alpine meadow | alpine grassland | alpine grassland | alpine meadow | bush meadow | bush meadow |
| Altitude (m) | 4,508 | 4,674 | 4,701 | 4,801 | 4,024 | 4,489 |
| R | 0.81* | 0.67* | 0.86* | 0.74* | 0.77* | 0.71* |
| R | Nakchu | Shantsa | Palgon | Amdo | Sokshan | Chali |
|---|---|---|---|---|---|---|
| Tmin | 0.51* | -0.26 | 0.08 | 0.47* | 0.27 | -0.06 |
| Tmax | 0.21 | -0.04 | -0.19 | -0.12 | 0.28 | 0.40 |
| Precipitation from July to September | 0.33 | 0.39 | 0.17 | 0.10 | 0.53* | -0.15 |
| ET0 | -0.63** | -0.51* | -0.63** | -0.54* | -0.07 | 0.29 |
| Sunshine duration from July to September | -0.71** | -0.44* | -0.47* | -0.60** | -0.24 | 0.17 |
| Annual mean wind speed | -0.28 | -0.40 | -0.25 | -0.19 | 0.21 | 0.03 |
| County | Nakchu | Chali | Amdo | Shantsa | Sokshan | Palgon |
|---|---|---|---|---|---|---|
| Population density in 2002 (persons km-2) | 5.14 | 1.93 | 1.30 | 0.42 | 5.94 | 0.33 |
| Population change (%) 1989-2002 | 23.12 | 24.33 | 17.15 | 20.44 | 21.49 | 22.68 |
© 2007 by MDPI ( http://www.mdpi.org). Reproduction is permitted for noncommercial purposes.
Share and Cite
Zhang, J.; Yao, F.; Zheng, L.; Yang, L. Evaluation of Grassland Dynamics in the Northern-Tibet Plateau of China Using Remote Sensing and Climate Data. Sensors 2007, 7, 3312-3328. https://doi.org/10.3390/s7123312
Zhang J, Yao F, Zheng L, Yang L. Evaluation of Grassland Dynamics in the Northern-Tibet Plateau of China Using Remote Sensing and Climate Data. Sensors. 2007; 7(12):3312-3328. https://doi.org/10.3390/s7123312
Chicago/Turabian StyleZhang, Jiahua, Fengmei Yao, Lingyun Zheng, and Limin Yang. 2007. "Evaluation of Grassland Dynamics in the Northern-Tibet Plateau of China Using Remote Sensing and Climate Data" Sensors 7, no. 12: 3312-3328. https://doi.org/10.3390/s7123312