Article

Gold Nanoparticles With Special Shapes: Controlled Synthesis, Surface-enhanced Raman Scattering, and The Application in Biodetection

Department of Chemistry, Key Laboratory of Bioorganic Phosphorus Chemistry & Chemical Biology, Tsinghua University, Beijing 100084, China
*
Author to whom correspondence should be addressed.
Sensors 2007, 7(12), 3299-3311; https://doi.org/10.3390/s7123299
Submission received: 12 November 2007 / Accepted: 12 December 2007 / Published: 14 December 2007

Abstract

:
Specially shaped gold nanoparticles have intrigued considerable attention because they usually possess high-sensitivity surface-enhanced Raman scattering (SERS) and thus result in large advantages in trace biodetermination. In this article, starch-capped gold nanoparticles with hexagon and boot shapes were prepared through using a nontoxic and biologically benign aqueous-phase synthetic route. Shape effects of gold nanoparticles on SERS properties were mainly investigated, and found that different-shaped gold nanoparticles possess different SERS properties. Especially, the boot-shaped nanoparticles could induce more 100-fold SERS enhancements in sensitivity as compared with those from gold nanospheres. The extremely strong SERS properties of gold nanoboots have been successfully applied to the detection of avidin. The unique nanoboots with high-sensitivity SERS properties are also expected to find use in many other fields such as biolabel, bioassay, biodiagnosis, and even clinical diagnosis and therapy.

1. Introduction

Nano-building blocks with novel shapes exhibit more unique physical and chemical properties in comparison with nanostructures with common shapes (e.g., sphere or rod) since intrinsic properties of metallic nanostructures depend vitally on particle shape [1-3]. Their displaying novel properties have wider and more effective biological and medical applications, for example, these building blocks have potential for fabricating biological labels, biological sensors, bioanalysis and biodiagnosis technologies, diagnosis and monitoring of diseases, drug discovery, environmental detection of biological reagents, and even medical clinical diagnosis and therapy [1, 4-7]. Two major challenges for real-time determination of biomolecules are of key importance: (i) biocompatibility and (ii) high sensitivity in bioanalysis. Achieving an exciting substrate with very high sensitivity plays a pivotal role in biological assays, for example, the urgent need for measuring disease diagnosis markers that present at ultralow levels during early stages of disease progress. This problem can be solved through using polymerase chain reaction (PCR) amplification. However, it is, to some extent, restricted due to its complexity, potential contamination, and cost [8]. Thereby, it is a great challenge to effectively monitor biomolecular interactions in the absence of PCR-like amplification protocols. Nevertheless, nanotechnology offers unique opportunities and good platforms for creating highly sensitive biodetecting devices and ultrasensitive bioassays because nano-building blocks, especially novel-shaped nanoparticles, exhibit unique physical and chemical properties [2, 9, 10].
Bio-detection sensitivity of nanomaterials associates intimately with their physical and chemical properties depending on the component, size, and shape [11-16]. Recent years, nanoparticles with different components and dimensions have been widely applied to detect biological molecules. For example, Keating's group designed a new approach for the detection of DNA hybridization based on nanoparticle-amplified surface plasmon resonance (SPR), using which a more than 1000-fold improvement in sensitivity was obtained for the target oligonucleotide as compared with the unamplified binding event [12]. Nie and his co-workers used colloidal gold nanocrystals to recognize and detect specific DNA sequences and single-base mutations in a homogeneous format [13]. Silica nanoparticles bioconjugated with fluorescent dye were also used to perform a rapid bioassay for single bacterial cell [14]. Recent work in this field was the successful fabrication of a label-free biochip based on noble metal nanoparticles, demonstrating that the sizes of gold nanoparticles with diameters in the range of 12-48 nm significantly affect its sensitivity [15]. For example, the detection limit for streptavidin-biotin binding of a biochip fabricated from 39-nm-diameter nanoparticles was 20-fold better than a previously reported biochip fabricated from 13-nm-diameter gold nanoparticles. Among all nanoparticles, gold nanoparticles as bio-detection precursor should be predominantly interesting because it exhibits the best compatibility with biomolecules. But, bio-detection sensitivity derived from spherical nanoparticles isn't still strong enough to achieve the real-time determination of trace biomolecules and the interaction between biomolecules. Nevertheless, it is reasonable to infer that novel shape nanoparticles might be hopeful to reach this aim because their displaying novel properties may greatly improve biological detection sensitivity [16].
In this article, we report the synthesis of starch-capped gold nanoparticles with hexagon and boot shapes via designing a biologically benign synthetic strategy and their shapes can be controlled through varying D-glucose concentration. In this process, the nanoparticles were prepared by the reduction of chloroauric acid (HAuCl4) with D-glucose in the presence of starch and water respectively served as a biologically benign capping agent and solvent. These starch-capped gold nanoparticles are nontoxicity for biological body and good biocompatibility because the nanoparticle toxicity mainly depends on its capping agent but not nanoparticles itself [17]. We subsequently studied shape effects of metal nanoparticles on SERS properties through using differently shaped gold nanoparticles respectively served as SERS carriers, and found that gold nanoparticles with the boot shape could induce ultrasensitive SERS signals, using which the detections of avidin were successfully acquired.

2. Results and Discussion

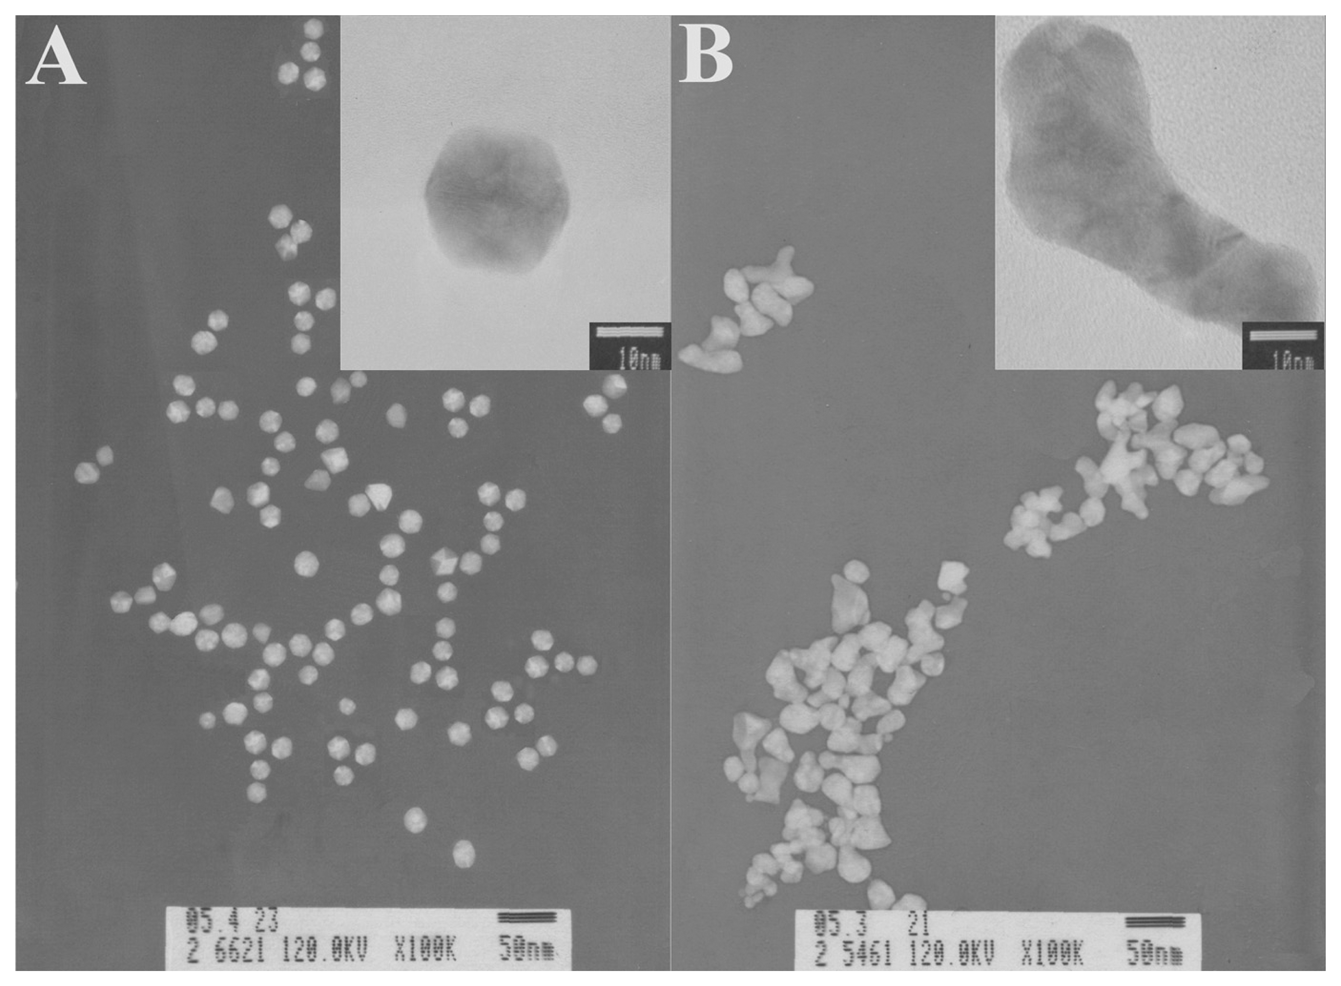
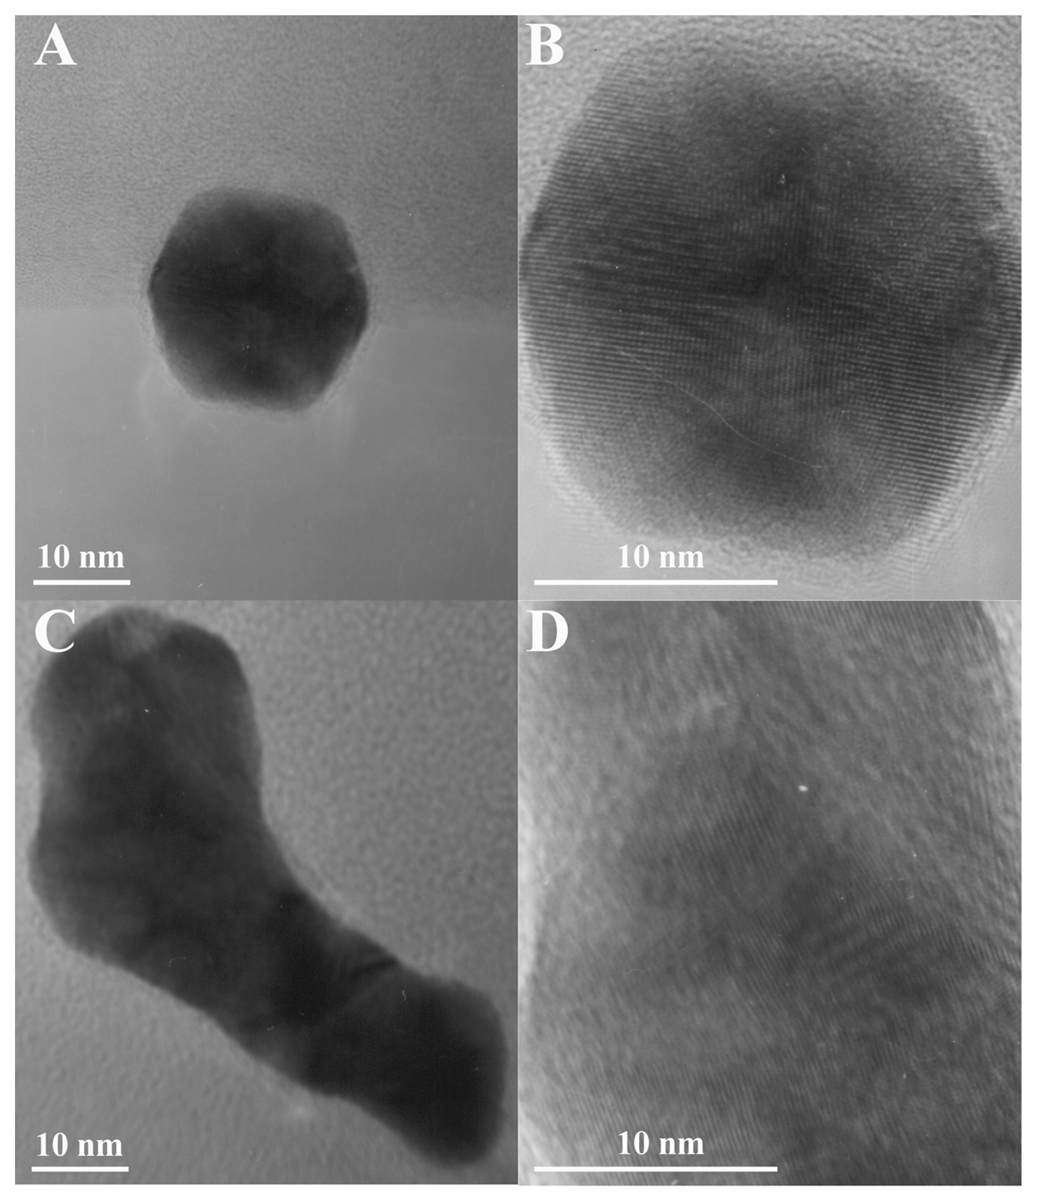
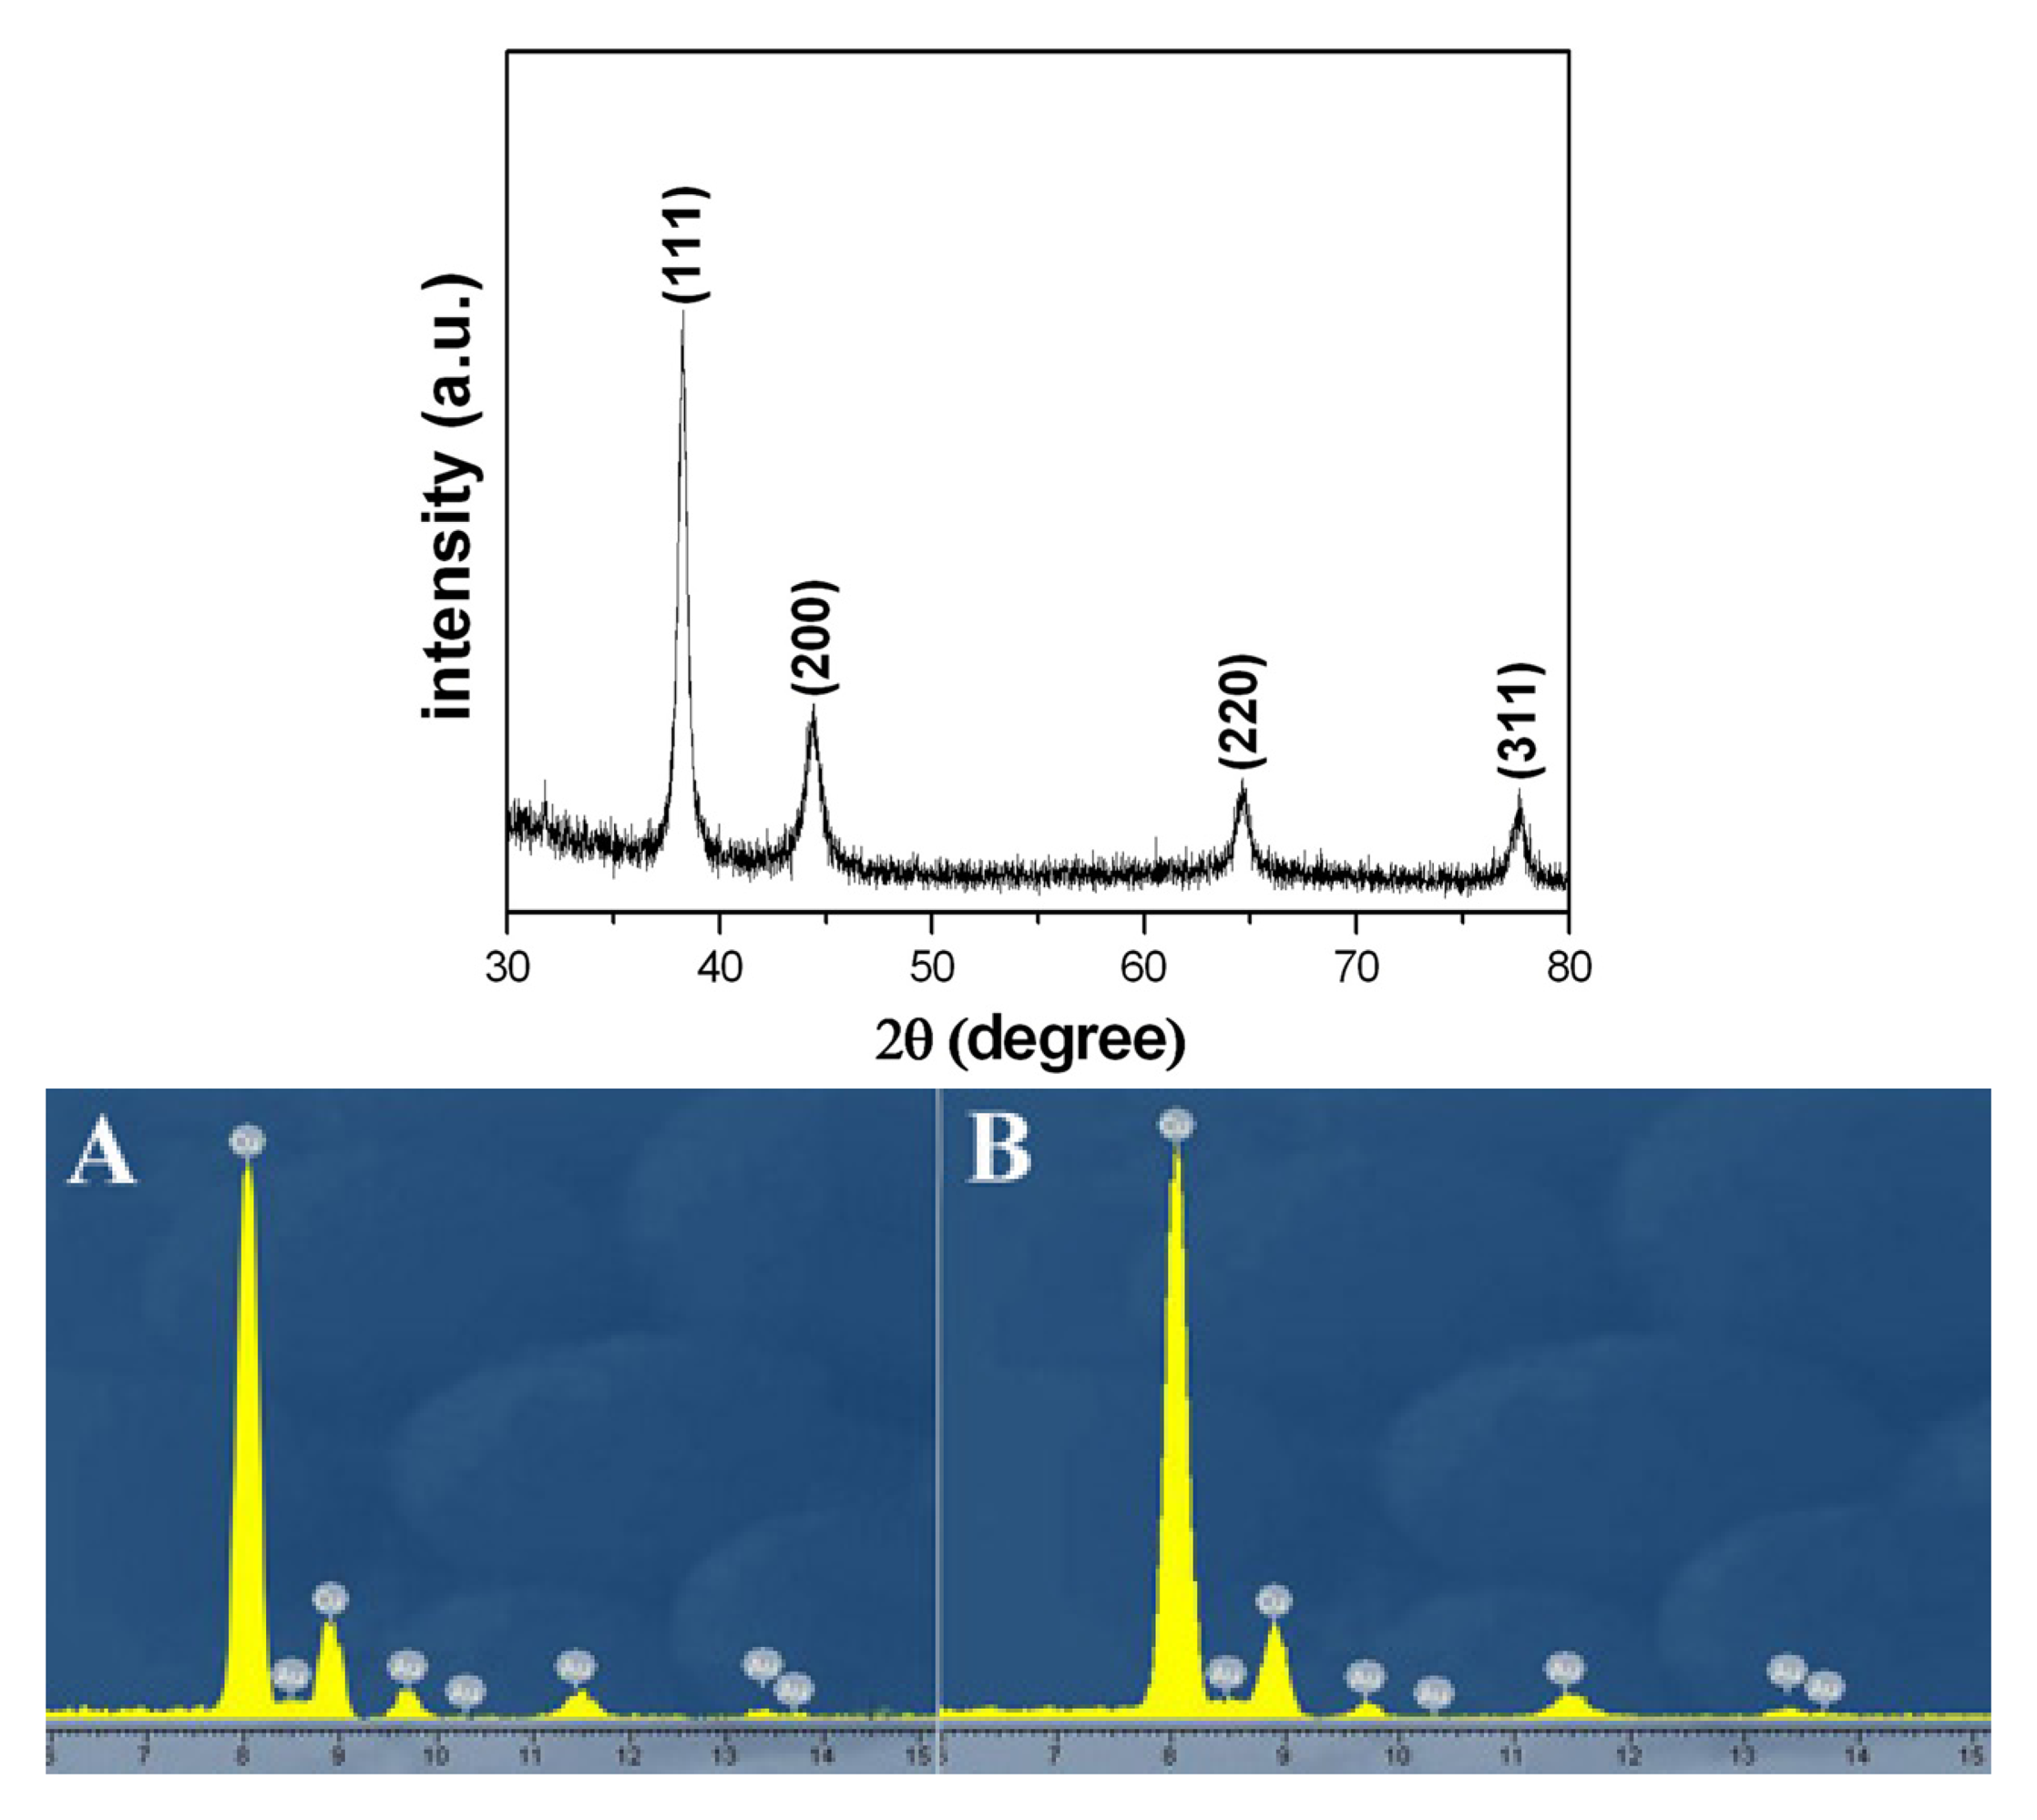
2.1. TEM and HRTEM characterization of Au colloids with hexagon and boot shapes

Our synthesis was performed by the reduction of HAuCl4 with D-glucose in the presence of starch. Fig. 1A and 1B show typical TEM images of differently shaped gold nanoparticles prepared using the present method. Hexagon-shaped gold nanoparticles synthesized using 0.1 mM D-glucose have the side length of 12 ± 2 nm. A decrease in the concentration (0.02 mM) of D-glucose changes gold nanoparticles' shape into a boot shape. Fig. 1B shows the representative TEM image of gold nanoboots, which have the length of 56 ± 9 nm and the narrowing width from 23 ± 5 to 16 ± 3 nm along its longitudinal axis. Their insets are the corresponding TEM images of single magnified gold nanoparticles whose sizes and shapes could be clearly seen, respectively. HRTEM images of the gold nanohexagons and nanoboots are given in Fig. 2, in which the lattice fringes of the gold nanohexagons and nanoboots are respectively visible (20). XRD and EDX spectrum measurements confirm that the crystal structures of the nanohexagons or nanoboots are face-center-cubic (fcc) (Joint Committee for Powder Diffraction Standards (JCPDS), File No. 4-0783) and the samples are pure Au.
Moreover, XRD pattern of the gold sample with the boot shape synthesized using 0.02 mM D-glucose, indicating that crystal structure of the nanoboots was fcc (JCPDS 4-0783). Another sample with hexagon shape had the same result. EDX spectra of the gold nanohexagons (A) and nanoboots (B) synthesized respectively using 0.1 and 0.02 mM D-glucose, indicating that the samples were pure Au.

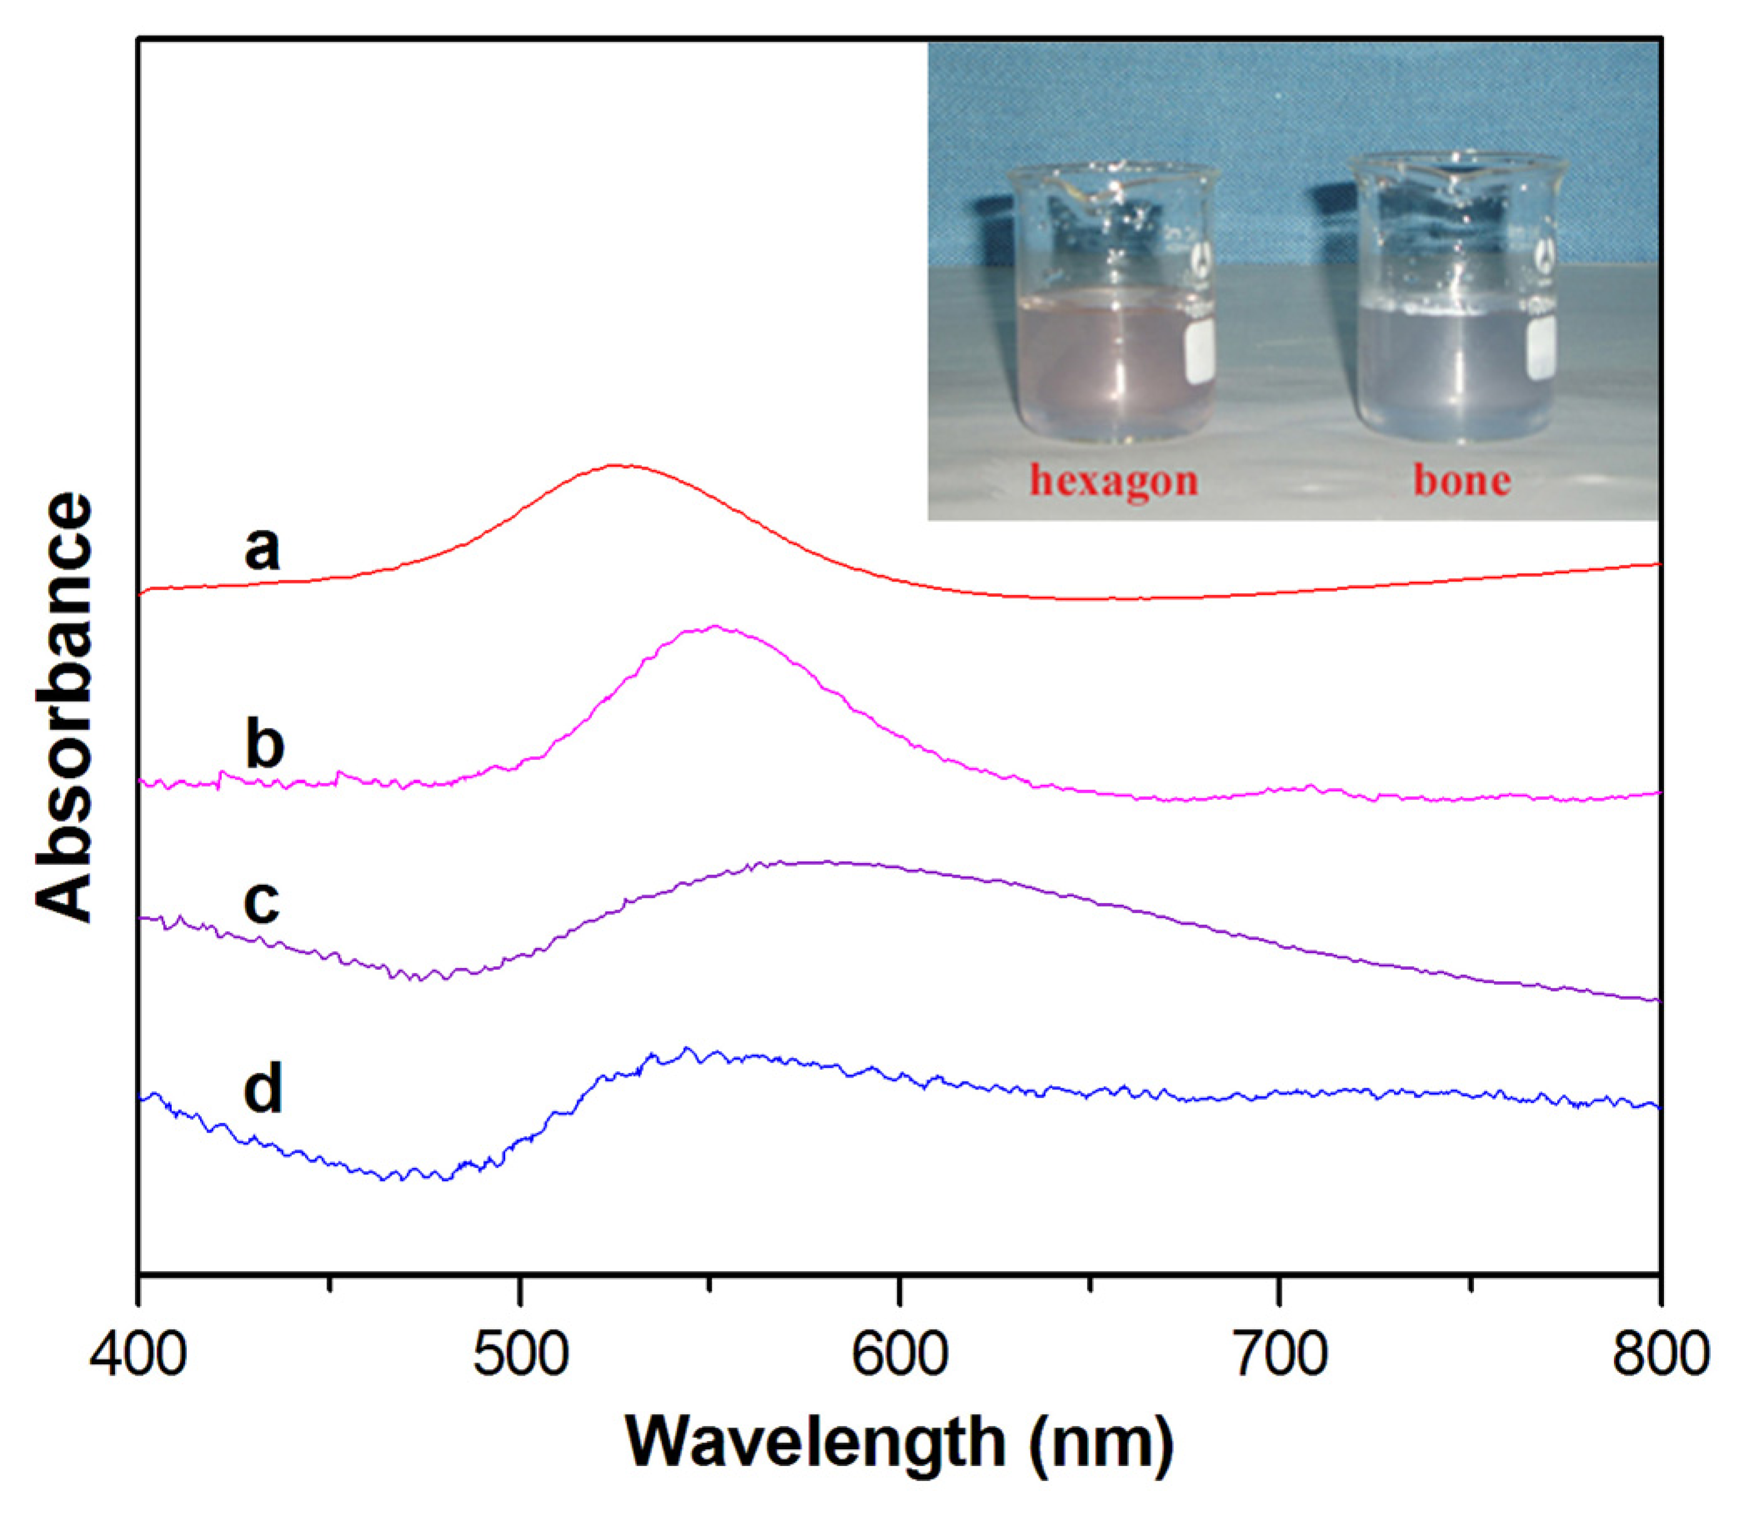
2.2. UV-visible absorption property of different-shaped gold nanoparticles

Novel properties derived from unusually shaped nanoparticles can be generally exhibited through plasmon absorption spectroscopy because their optical properties of aqueous suspensions intimately associate with the shape [1, 3, 16, 18, 19]. For example, the UV-visible spectrum for the colloidal solution of spherical gold nanoparticles prepared using the present method shows a narrow peak at approximately 523 nm (Fig. 4, curve a). Compared with the spherical nanoparticles, the UV-visible absorption of uniquely shaped gold nanoparticles usually shows the red-shift and wider peak [16, 18]. Curves b and d of Fig. 4 give UV-visible absorption spectra taken from the final reaction solutions synthesized using 0.1 and 0.02 mM D-glucose, respectively, whose colors are respectively violet red and light violet (the inset of Fig. 4). The nanohexagon colloidal solution has an absorption band at about 550 nm with the full width at half-maximum (FWHM) of ca. 65 nm (Fig. 4, curve b). In comparison, the nanoboot solution shows, similar to the reported gold nanotadpoles (Fig. 4, curve c) [18], a rather broader peak at about 545 nm with FWHM of ca. 145 nm (Fig. 4, curve d). It can be clearly seen from Fig. 4 that the more irregular nanoparticles possess the more red-shifts and wider absorption peaks, indicating that the UV-visible absorption property of colloidal solution intimately depends on its shape. These broad and multiple absorption peaks should probably result from the variable dimensions along to multiple axes of these particles [16].

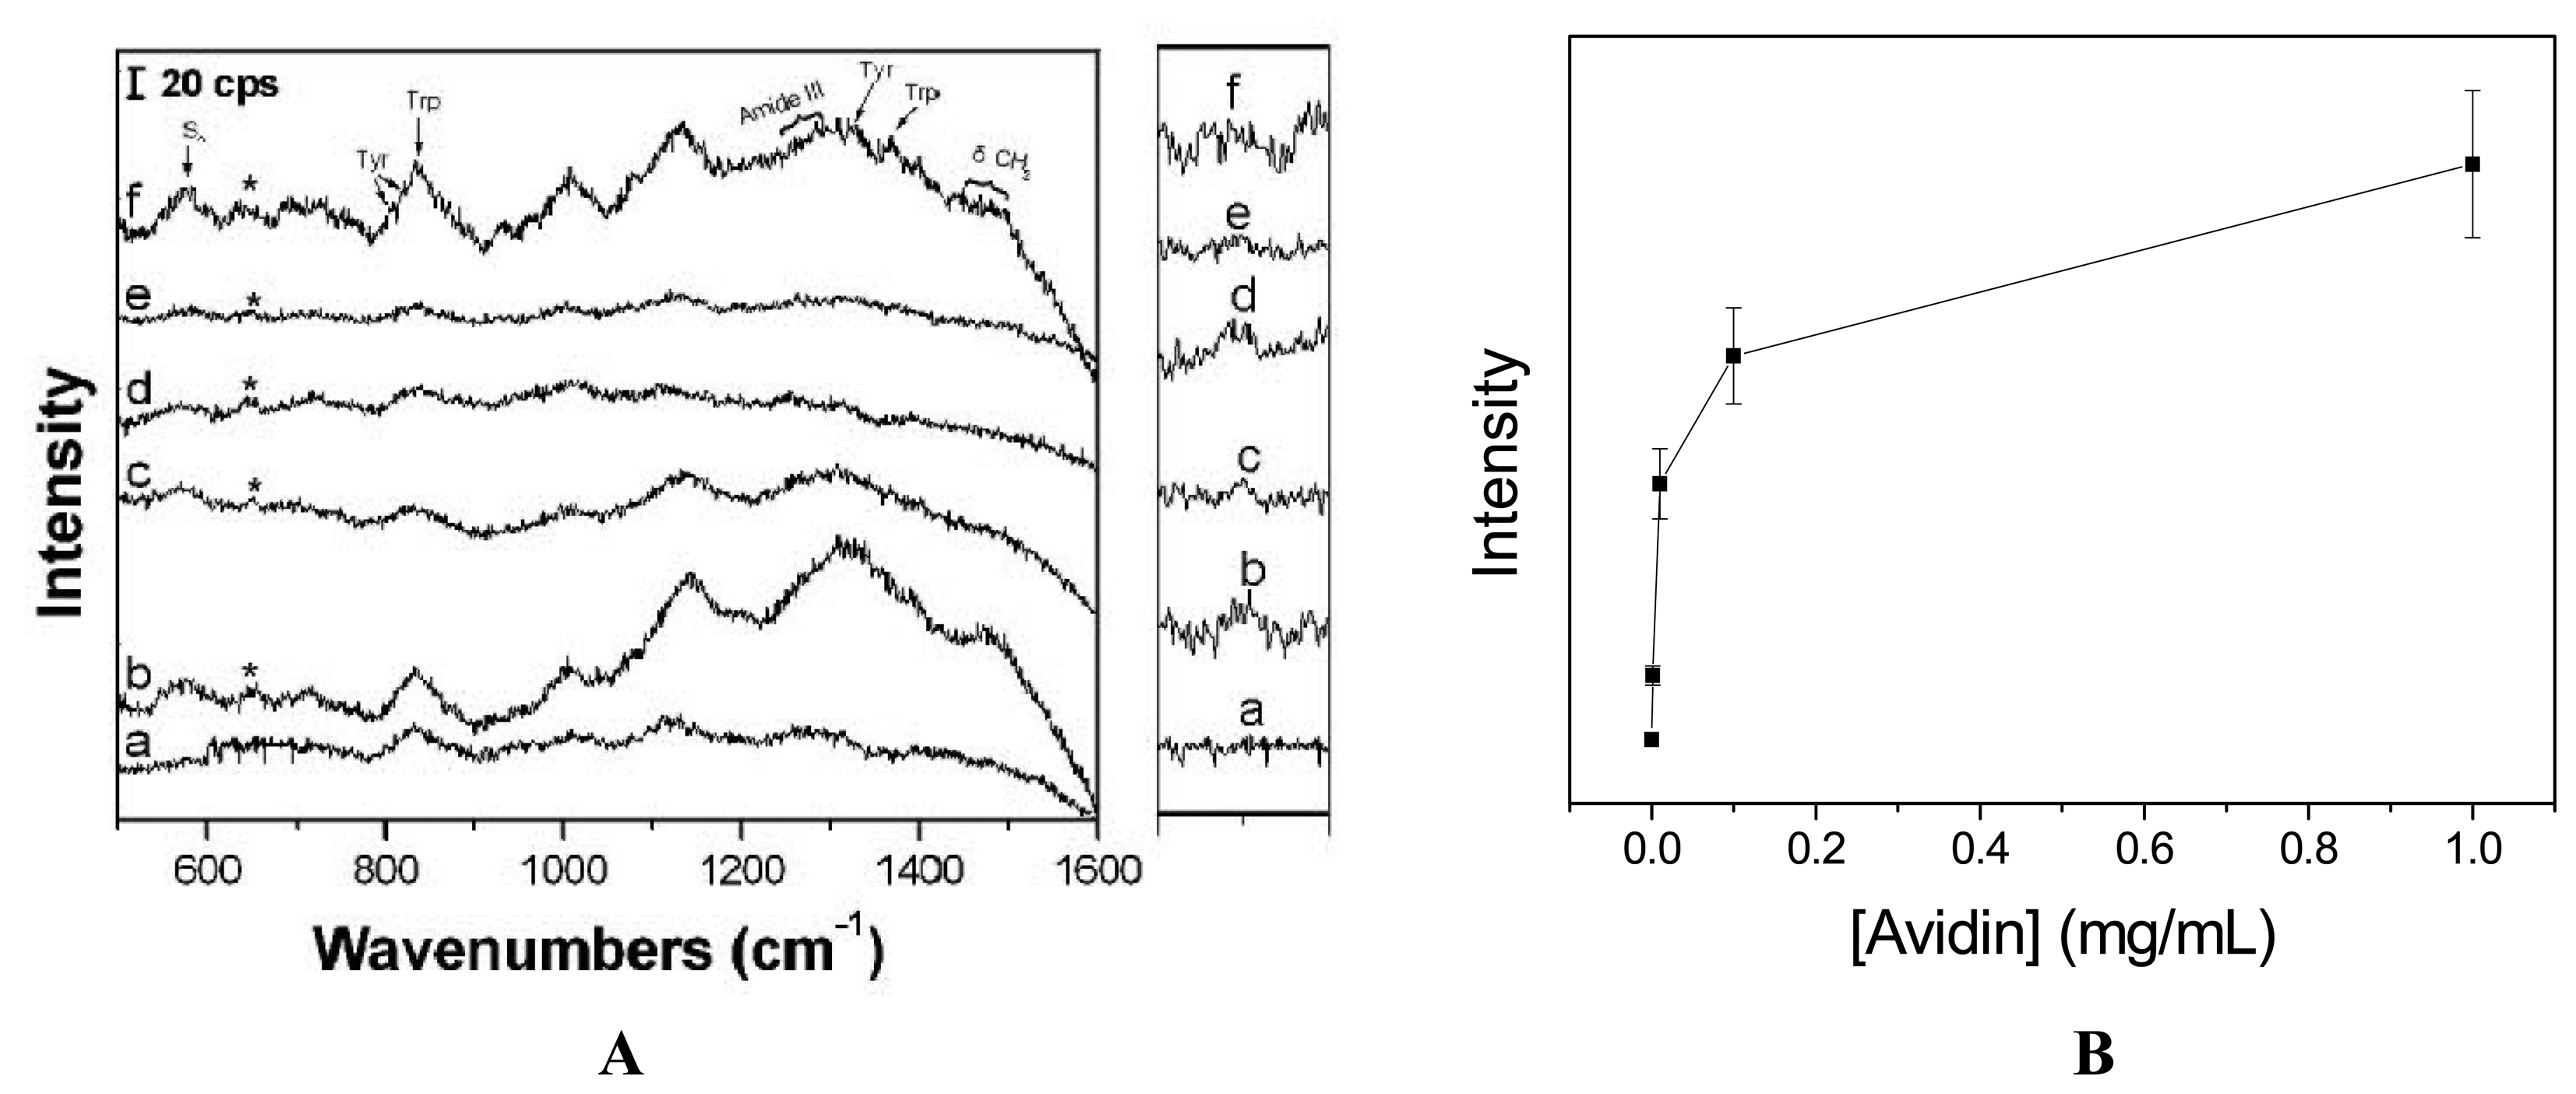
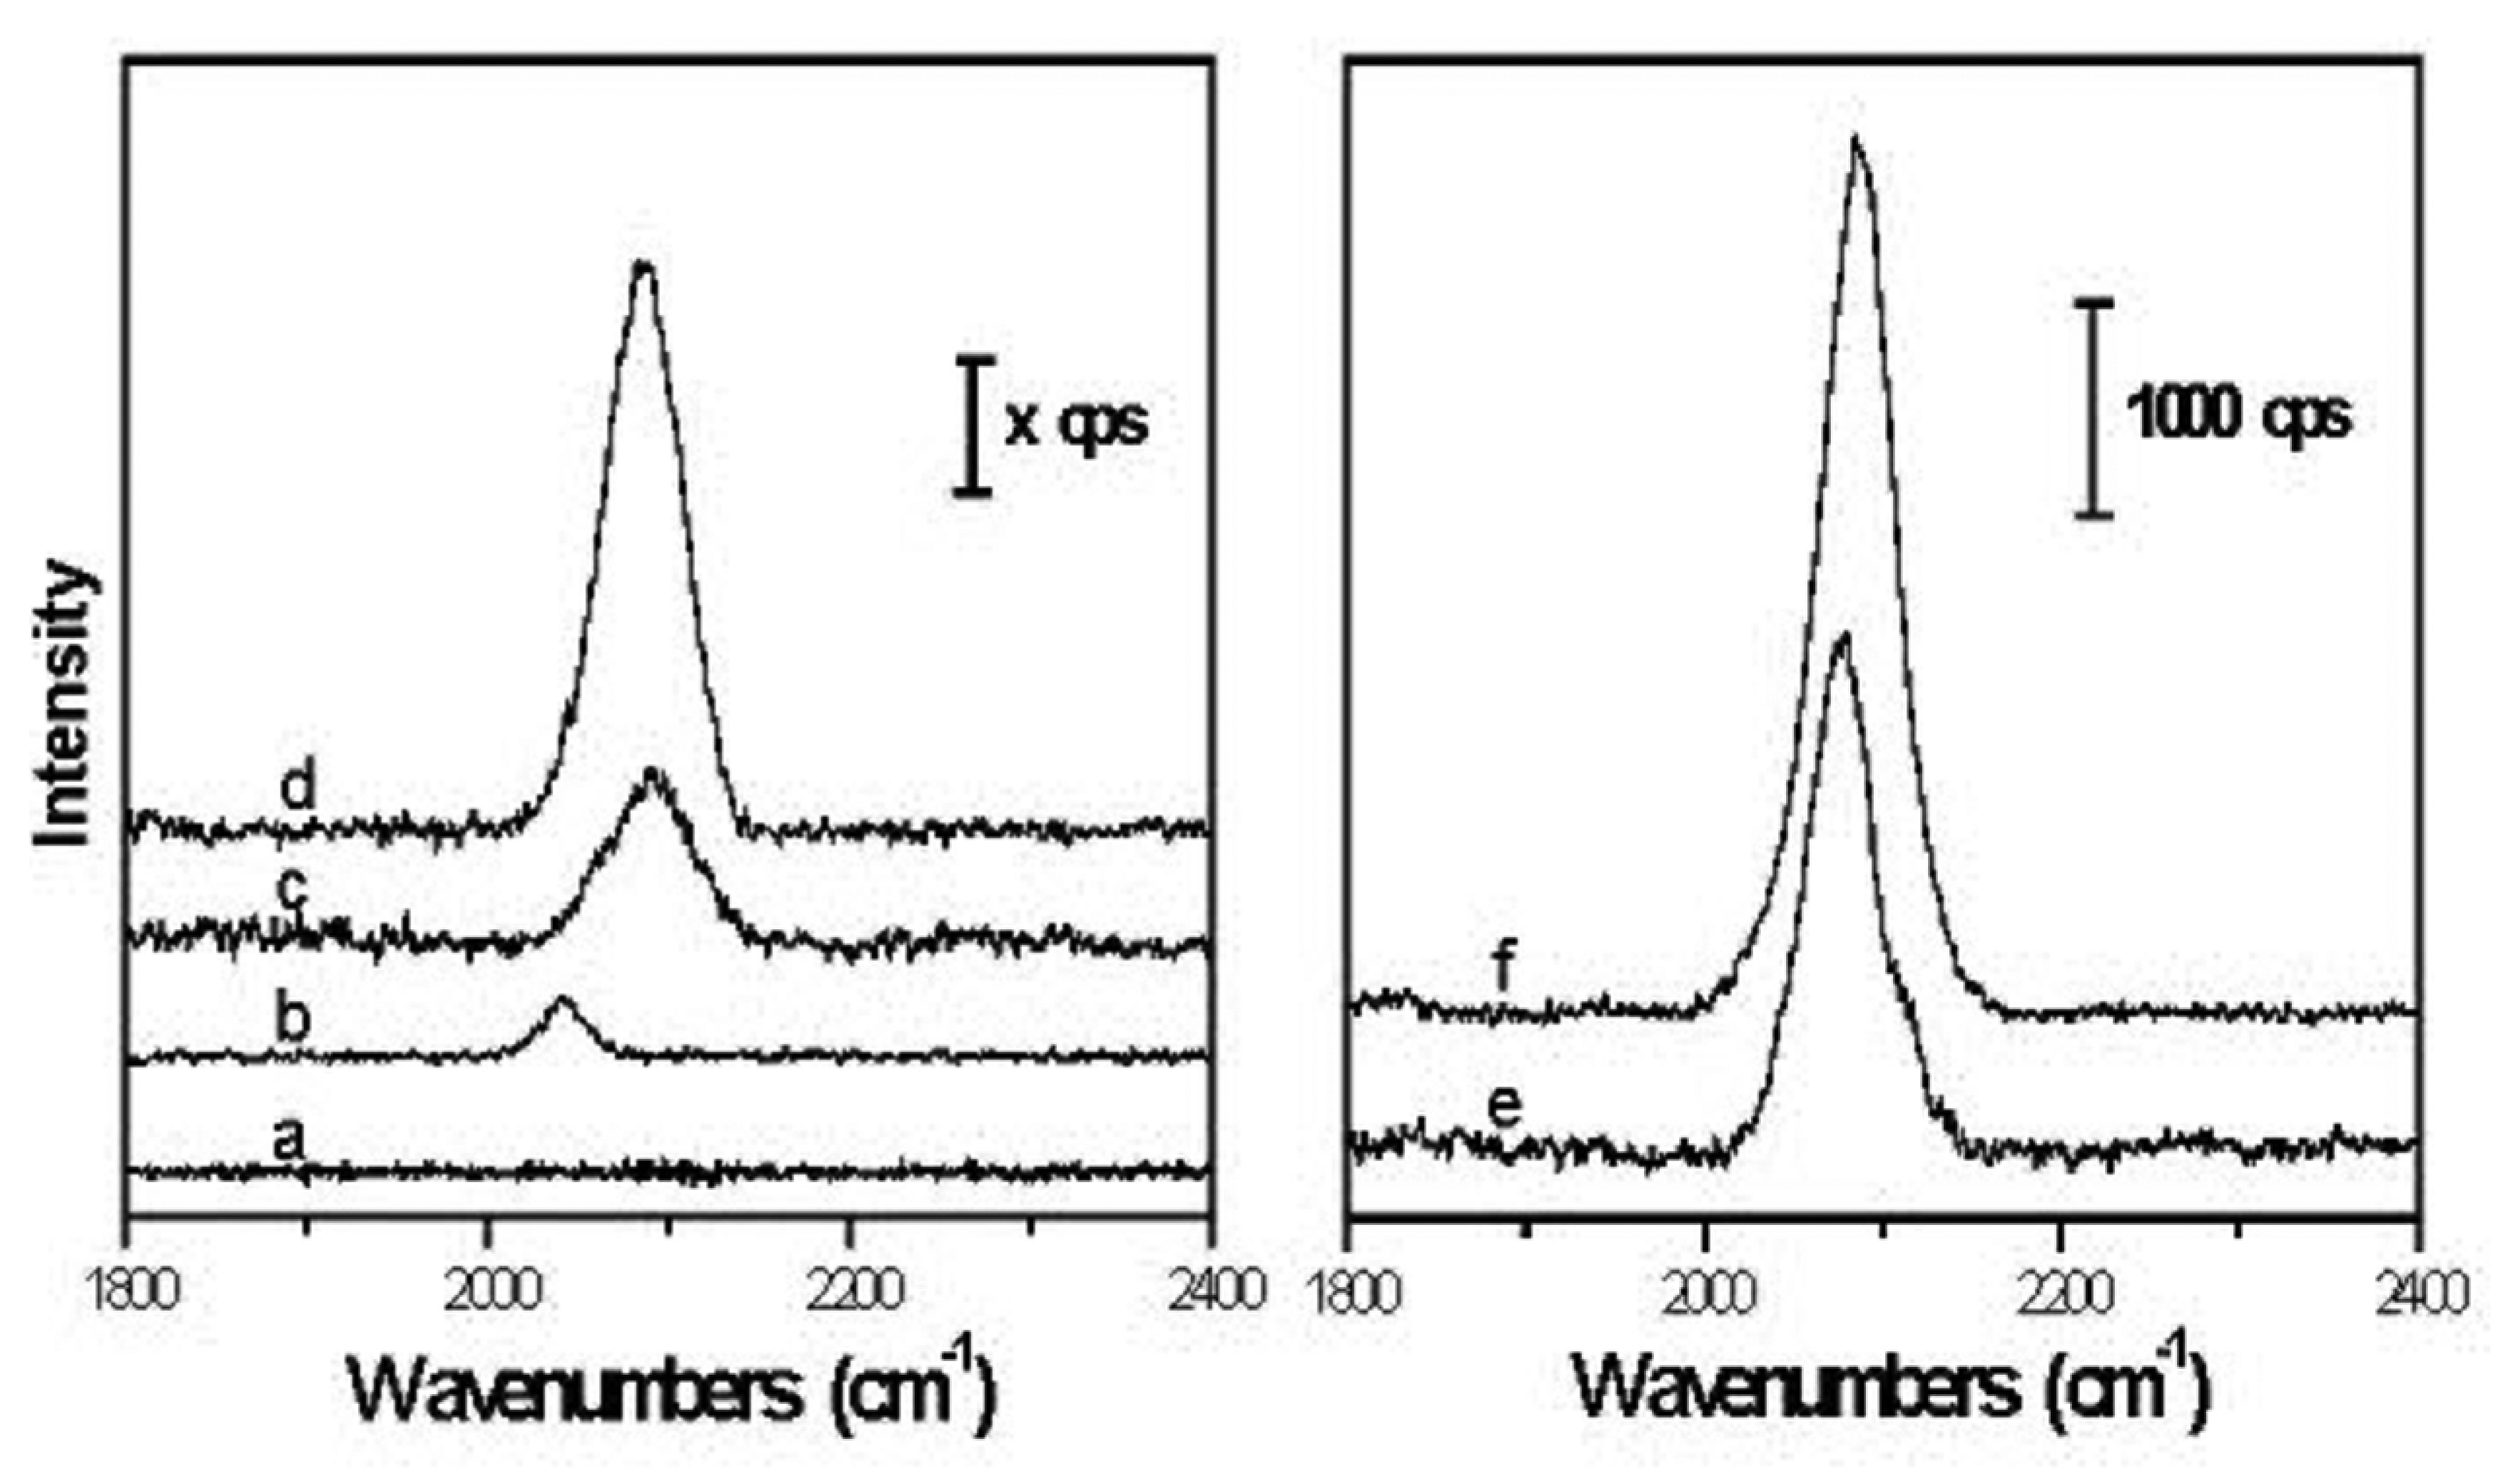
2.3. SERS property of different-shaped gold nanoparticles

SERS is an attractive and promising analytical tool for real-time detection of biomolecules due to its ultrahigh sensitivity [20, 21]. The sensitivity of SERS obtained from noble metal nanoparticles strongly depends on the size and shape, especially the latter [16, 22]. In the nineties of the twentieth century, Nie's group demonstrated size-dependent SERS enhancement in single metal nanoparticles [23]. Suzuki and his co-workers also reported that gold nanoparticle films with different sizes generate different-intensity SERS signals [24]. Spherical gold nanoparticles served as SERS-active substrate usually give an enhancement in the order of from 103 to 106. However, the SERS sensitivity from spherical gold nanoparticles is still insufficient to detect trace biomolecules and/or the interaction between biomolecules, which may be overcome through using novel shape nanomaterials served as SERS substrate for the improvement of bio-detection limit [25, 26]. Fig. 5 shows Raman spectrum of 10 M SCN- solution and SERS spectra of SCN‐ adsorbed at different-shaped gold nanoparticles. The intensities obtained from the nanoboots and nanotadpoles are about two orders of magnitude stronger than those of the nanohexagones and nanospheres, which are consistent with the previously reported SERS spectra for gold nanoparticles with novel shapes [16]. Furthermore, the boot-induced SERS also shows the stronger intensity than that from the nanotadpoles. It is well known that the lightning effect can result in the largest electric field near the sharpest surface, e.g., at the sharp ends of nanoparticles. As a consequence, the Raman enhancement reaches its maximum value at the sharpest surface [27]. On the basis of the electromagnetic enhancement theory, the SERS intensity induced by metal nanoparticles intimately depends on the total number of the sharp ends. From the spheres, hexagons, and tadpoles to boots, the total sharp numbers gradually increase, the SERS activities dramatically increase, too. Indeed, our experimental results showed in Fig. 5 agree well with this theoretical prediction. And that the different SERS frequencies of SCN- absorbed at different shape gold nanoparticles are due to the different interaction between gold nanoparticles and adsorbed molecule [28]. The stronger the interaction is, the higher the frequency shifts to. Among sphere, hexagon, tadpole, and boot, this means that the boots have the highest SERS frequency, followed by the tadpoles, and the lowest frequency belongs to the spheres and hexagons, indicating that the boots have the most active “hot” areas. The most active area of the nanoboots is further evidence of the strongest SERS and CL signals.
We also calculated surface enhancement factors (EF) of the nanoparticles with different shapes using the classical formula, i.e., [ I SERS ] × [ M bulk ] [ I Raman ] × [ M ads ]. Wherein ISERS is the intensity of SCN- in the SERS spectrum, IRaman is the intensity of SCN- in the Raman spectrum, Mbulk is the number of SCN- sampled in the bulk, and Mads is the number of SCN- absorbed and sampled in the SERS substrate. All spectra were standardized for acquisition time. The illuminated focus spot diameter is 2 μm, and thus the absorbed total molecule number of about 1.57 × 10⁻¹⁷ mol in the SERS experiments is calculated by estimating the bonding density of SCN molecules in a self-assembly monolayer (SAM) [29]. Table 1 lists calculated surface EFs for SCN- on ITO glass slices assembled with gold nanoparticles of different shapes. The boots induce the largest surface EFs (more than 108), and the spheres generate the smallest enhancement (ca. 106). The strong enhancement for the boots contributes not only to the total number of its sharp ends but also its absorption at 785 nm that generates effectively plasmon resonance enhancement as compared with the spheres, hexagons, and tadpoles. As a result, the nanoboots could serve as an ideal SERS activity substrate to probe biomolecules because of its enhancement of two orders of magnitude as compared with the nanospheres [30].

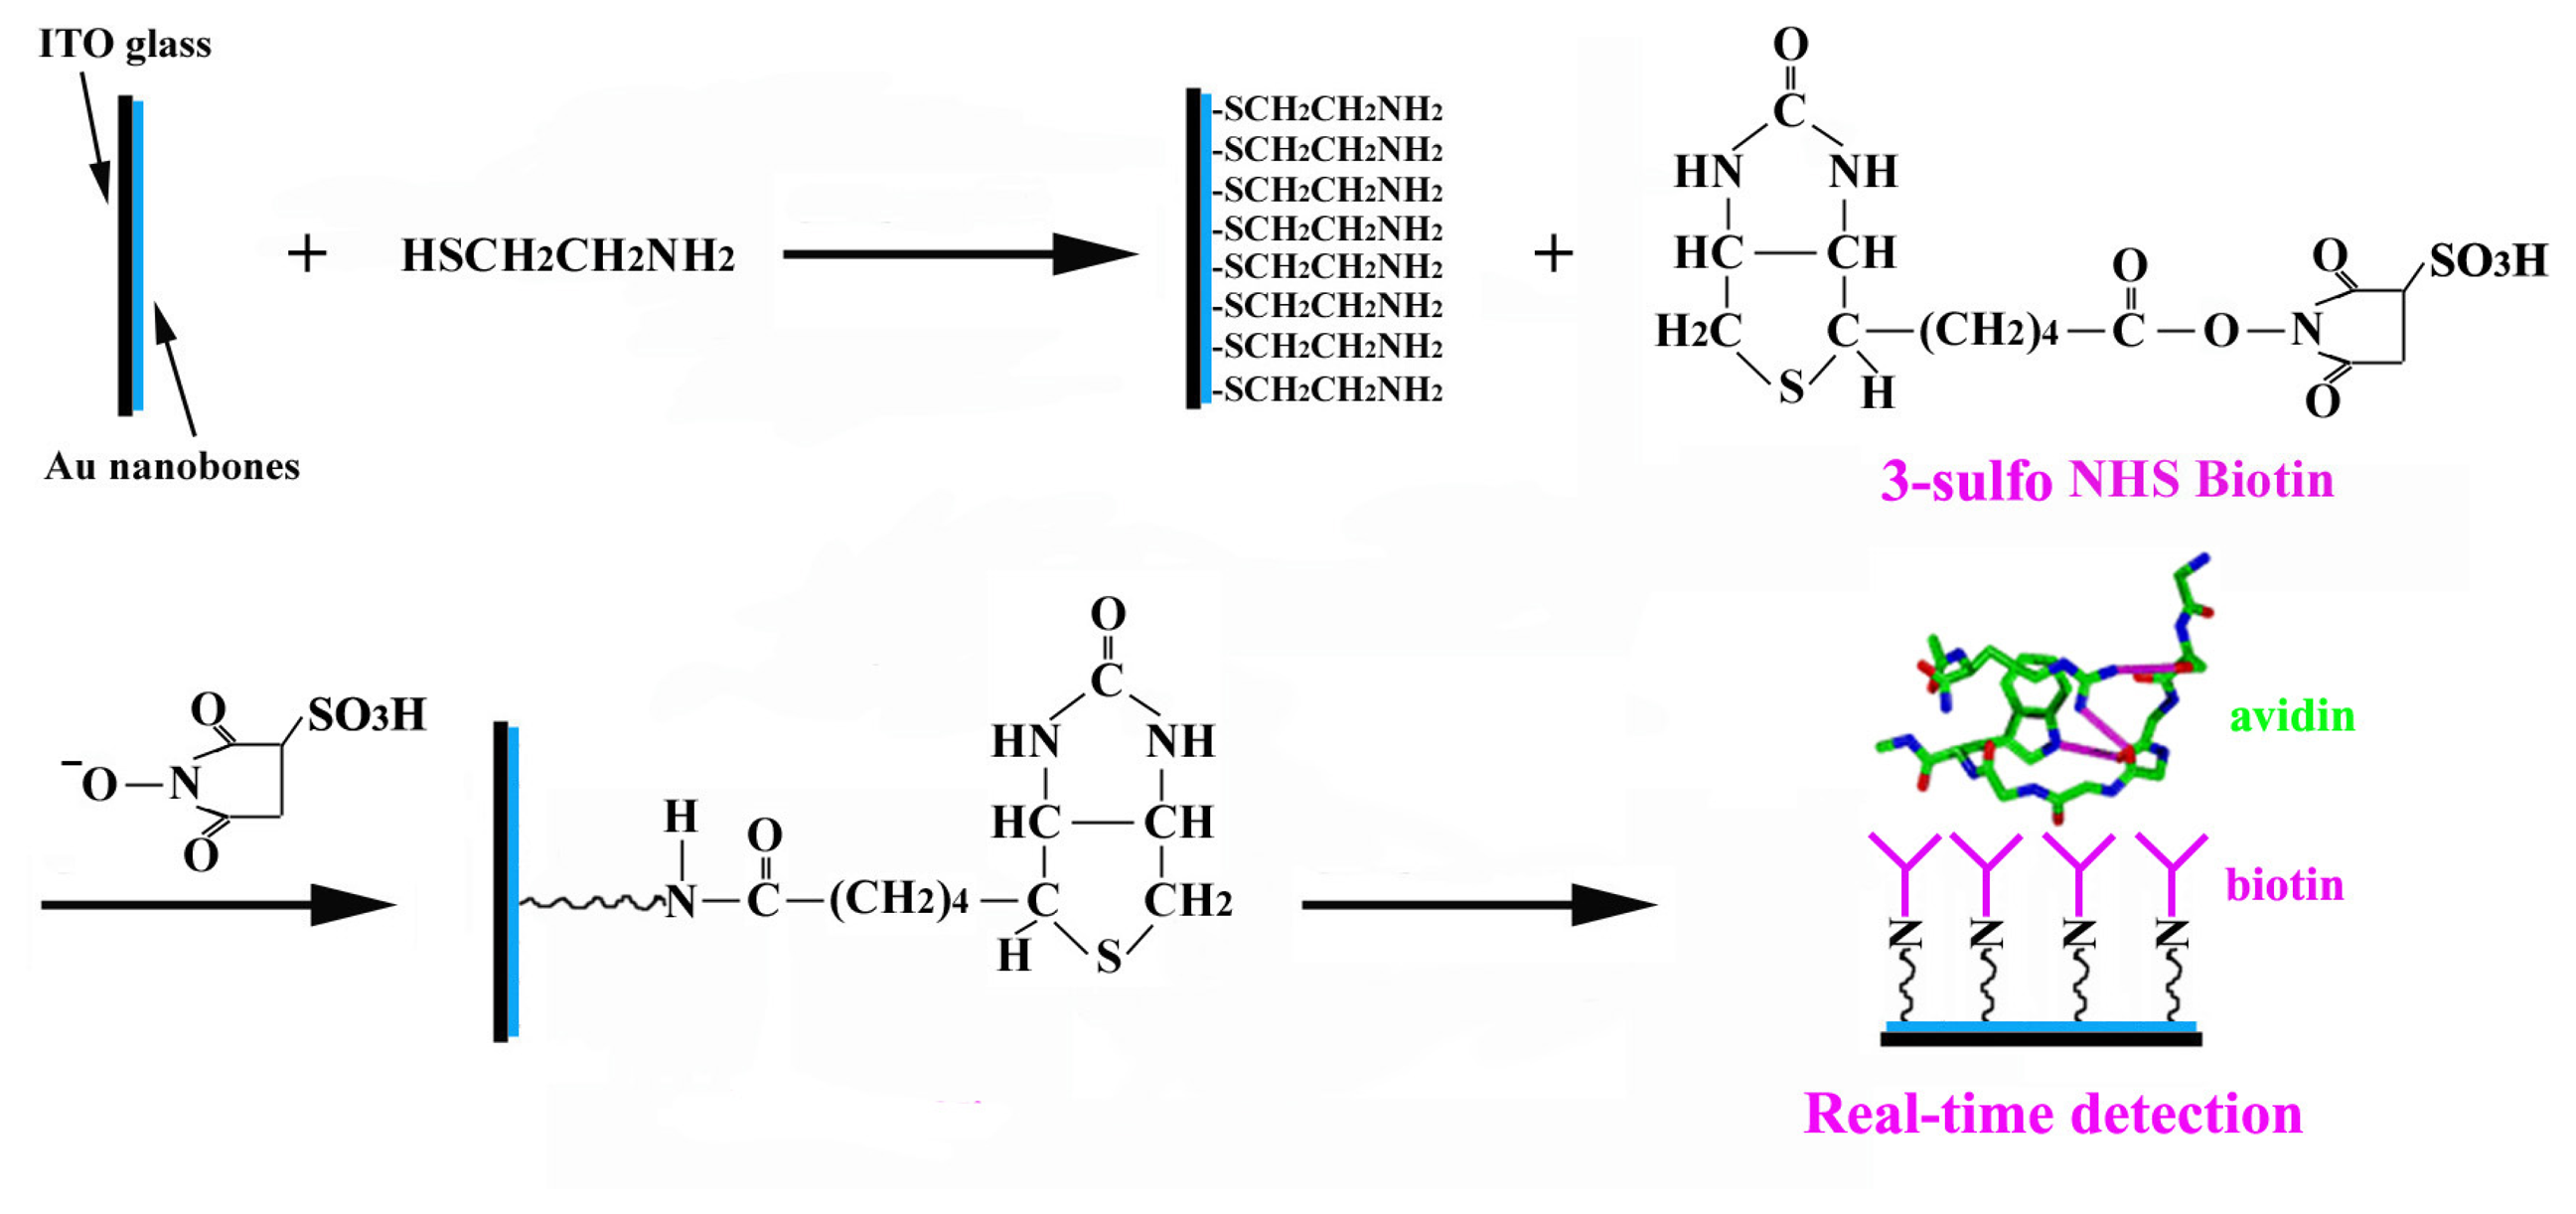
2.4. Real-time determination of avidin by SERS

It is important to note that biotin can form a very high binding affinity with avidin, an egg white protein [31-35]. The strong bonding property between biotin and avidin also offers new opportunities for detecting avidin. As described in Section 3.3. and represented in Fig. 6, a self-assembly procedure was employed on the indium tin oxide (ITO) glass slice for SERS determination of avidin. Fig.7 (A) shows SERS spectra of the coupling complex between mercaptoethylamine-assembled gold nanoboots and biotins and its real-time detection of different concentration avidin. All these SERS spectra are reproducible at different sites on a substrate, with a standard deviation of <20%. The bands (at about 648 cm-1) marked with asterisks attribute to the biotin-avidin complex [36]. As the concentration of avidin decreases from 1mg/mL (Fig. 7b) to 1μg/mL (Fig. 7e), the SERS intensities corresponding to the ligand of biotin and avidin progressively decrease, which can be clearly seen from the magnified spectrum peaks at 600-700 cm-1 from the asterisks (the right plot of Fig. 7(A) and (B)). The band obtained using 1 μg/mL avidin is hardly discernable but it can be again identified clearly if longer integration time is used (Fig. 7f). The appearance of the amide III mode in the 1230-1284 cm-1 region and lone disulfide of avidin subunits at about 545 cm-1 further confirm the presence of the biotin-avidin interactions. Other bands at about 806, 821, 834, 1323, 1364, and 1440-1480 cm-1 correspond respectively to the hydrogen bonds of biotin and its ligand with avidin, the side-chains of avidin, and methylene of biotin or avidin. These results are in agreement with the reported literatures [36-38], indicating that the boot-shaped gold nanoparticles could effectively and real-time detect avidin molecules down to 0.01 unit/mL by making use of its high-sensitivity SERS activity.

3. Experimental Section

3.1. Reagents and materials

Dihydrate chloroauric acid (HAuCl4□2H2O, 99%), biotin 3-sulfo-N-hydroxysuccinimide (biotin 3-sulfo-NHS, 90%), avidin (from egg white (13 units/mg solid)), glucose oxidase (GOD), mercaptoethylamine (99%), tetra-ethylorthosilicate (90%), and sodium dodecylsulfonate (99%) were purchased from Aldrich and ACROS. Luminol was obtained from Merck (Germany). The following analytical pure reagents were purchased from Tianjin VAS Chemical Reagent Co.: starch, D-glucose, tri-sodium citrate, potassium chloroide, potassium thiocyanate, luminol, glucose oxidase, sodium dihydrogen phosphate, disodium hydrogen phosphate, concentrated hydrochloric acid, absolute acetone, and high pure argon gas. All above reagents were used without further purification. 18 MΩ cm-1 water was used to prepare all aqueous solutions. All glassware used was washed with aqua regia and rinsed with ultrapure water prior to use. 0.1 M of phosphate buffer (PBS, pH=7.0) was made by an equal volume mixture of 0.0780 M sodium dihydrogen phosphate and 0.122 M disodium hydrogen phosphate in an aqueous solution.

3.2. Preparation of gold nanoparticles with different shapes

In a typical procedure for the preparation of novel gold nanoparticles with hexagon and boot shapes, two 150 mL round-bottom flasks containing 50 mL (final volume) aqueous solution of 0.1 mM HAuCl4 were first prepared, and then added 5 mL of 0.17% starch (wt%), respectively. The two solutions were purged oxygen with argon for 10 min, respectively. Next, 5 mL and 1 mL of 1 mM D-glucose purged with argon were introduced to the as-prepared solutions, respectively. Finally, each reaction solution kept stirring at 40 °C for 24 h. The two reaction mixtures finally turned turbid with violet red and light violet, respectively. Gold nanoparticles with sphere and tadpole shapes were synthesized according to our previously synthetic procedure with a little modification [18]. The average diameter of the gold nanospheres was around 22 nm; for the gold nanotadpoles, their average length, maximal width, and maximal height were respectively ca. 82 nm, 21 nm, and 6.9 nm.

3.3. Real-time determination of avidin molecules

First, the coupling complex between assembled gold nanoboots and biotins for the determination of avidin was fabricated according to the following procedure (shown in Fig. 6): (i) cleaned indium tin oxide (ITO) glass slice was placed in boot-shaped gold colloid to allow them self-assemble, and the slice was removed after 24 h and blew them with N2. (ii) To form amine-functionalized group on the nanoparticle surfaces, the Au-assembled ITO reacting with 10 mM mercaptoethylamine was similarly taken out after 6 h and washed with 18 MΩ cm-1 water and dried with N2. (iii) The amine-functionalized Au-ITO slice then reacted with 0.1mg/mL biotin 3-sulfo-N-hydroxysuccinimide in 0.1 M PBS (pH 7.0), and was washed and dried with the same procedure. Next, a droplet (approximately 50 μL) of 1000, 100, 10, and 1 μg/mL avidin solutions was pipetted respectively onto as-prepared dried bio-complexes and immediately detected after 2 min. The 785 nm laser was focused, via a 20 × 0.4 NA objective lens, through the sample solution and onto the bio-complex interface by adjusting the microscope stage. Finally, spectrum acquisition was started immediately. Laser intensity at the focal spot was about 1.2 mW/cm. The focus spot size was 5 μm, the spectral resolution was 1 cm-1, and an integration time was 60 s.

3.5. Instruments

Transmission electron microscopic (TEM) measurement was performed with a Hitachi Model H-800 microscope operated at 100 kV. High-resolution TEM (HRTEM) images and energy-dispersive X-ray (EDX) spectra were obtained on a JEOL JEM-2010F microscope operated at 200 kV. UV-visible spectra were acquired using a Shimadzu UV-21005 spectrophotometer using two 1cm quartz cells. X-ray diffraction (XRD) pattern was recorded on a powder sample using a Bruker D8 Advance X-ray diffractometer with CuKhα radiation (λ=1.5418 Å). Raman and surface-enhanced Raman scattering (SERS) spectra were obtained with a microscopic confocal Raman spectrometer (Renishaw, RM 2000) operated with a semiconductor laser (785 nm), laser intensity (about 0.47 W/cm, and objective lens (50 X).

4. Conclusion

In summary, we demonstrated that starch-capped gold nanoparticles with novel and controllable shapes (e.g., boot and hexagon) could be synthesized using a biologically benign synthetic route. Differently shaped gold nanoparticles could excite or induce to give rise to different SERS properties through surface catalysis or electromagnetic field, respectively. Along with the shape change from sphere, hexagon, and tadpole to boot, SERS intensities induced gradually increase. In comparison with the spherical nanoparticles, the boot-shaped nanoparticles could generate the SERS enhancements of more two orders of magnitude. The extremely strong SERS properties induced by the nanoboots have been successfully utilized to probe biomolecules through achieving the success of the coupling between biomolecules and gold nanoboots. To determinate the bio-detection sensitivity of the coupling complex, we selected a representatively probed biomolecule, i.e., avidin. It was found that we could effectively and real-time detect the concentration of avidin down to 0.01 unit/mL. The nanoboots with high-sensitivity SERS properties could be also utilized to detect many other biomolecules and are expected to find use in many fields such as biolabel, bioassay, biodiagnosis, and even clinical diagnosis and therapy.

Acknowledgments

This work was supported financially by the National Natural Science Foundation of China (No. 20435010), National Basic Research Program of China (No. 2007CB310500). We also acknowledged the financial support from Postdoctoral Science Foundation of China (023205035, 2005038302).

References and Notes

  1. Jin, R. C.; Cao, Y. W.; Mirkin, C. A.; Kelly, K. L.; Schatz, G. C.; Zheng, J. G. Photoinduced conversion of silver nanospheres to nanoprisms. Science 2001, 294, 1901–1903. [Google Scholar]
  2. El-Sayed, M. A. Some interesting properties of metals confined in time and nanometer space of different shapes. Acc. Chem. Res. 2001, 34, 257–264. [Google Scholar]
  3. Wang, Z. P.; Hu, J. Q.; Jin, Y.; Yao, X.; Li, J. H. In situ amplified chemiluminescent detection of DNA and immunoassay of IgG using special-shaped gold nanoparticles as label. Clin. Chem. 2006, 52, 1958–1961. [Google Scholar]
  4. Yu, L.; Banerjee, I. A.; Matsui, H. Direct growth of shape-controlled nanocrystals on nanotubes via biological recognition. J. Am. Chem. Soc. 2003, 125, 14837–14840. [Google Scholar]
  5. Penn, S. G.; He, L.; Natan, M. J. Nanoparticles for bioanalysis. Curr. Opin. Chem. Biol. 2003, 7, 609–615. [Google Scholar]
  6. Turner, A. P. F. Biosensors--sense and sensitivity. Science 2000, 290, 1315–1317. [Google Scholar]
  7. Haes, A. J.; Van Duyne, R. P. A nanoscale optical biosensor: sensitivity and selectivity of an approach based on the localized surface plasmon resonance spectroscopy of triangular silver nanoparticles. J. Am. Chem. Soc. 2002, 124, 10596–10604. [Google Scholar]
  8. Wang, J. Nanomaterial-based amplified transduction of biomolecular interactions. Small 2005, 1, 1036–1043. [Google Scholar]
  9. Deng, F. J.; Yang, Y. Y.; Hwang, S.; Shon, Y. S.; Chen, S. W. Fullerene-functionalized gold nanoparticles: electrochemical and spectroscopic properties. Anal. Chem. 2004, 76, 6102–6107. [Google Scholar]
  10. Tsunoyama, H.; Sakurai, H.; Negishi, Y.; Tsukuda, T. Size-specific catalytic activity of polymer stabilized gold nanoclusters for aerobic alcohol oxidation in water. J. Am. Chem. Soc. 2005, 127, 9374–9375. [Google Scholar]
  11. Hu, J. Q.; Wen, Z. H.; Wang, Q.; Yao, X.; Zhang, Q.; Zhou, J. H.; Li, J. H. Controllable synthesis and enhanced electrochemical properties of multifunctional AucoreCo3O4shell nanocubes. J. Phys. Chem. B 2006, 110, 24305–24310. [Google Scholar]
  12. He, L.; Musick, M. D.; Nicewarner, S. R.; Salinas, F. G.; Benkovic, S. J.; Natan, M. J.; Keating, C. D. Colloidal Au-enhanced surface plasmon resonance for ultrasensitive detection of DNA hybridization. J. Am. Chem. Soc. 2000, 122, 9071–9077. [Google Scholar]
  13. Maxwell, D. J.; Taylor, J. R.; Nie, S. M. Self-assembled nanoparticle probes for recognition and detection of biomolecules. J. Am. Chem. Soc. 2002, 124, 9606–9612. [Google Scholar]
  14. Zhao, X. J.; Hilliard, L. R.; John Mechery, S.; Wang, Y. P.; Bagwe, R. P.; Jin, S. G.; Tan, W. H. A rapid bioassay for single bacterial cell quantitation using bioconjugated nanoparticles. P. Natl. Acad. Sci. USA 2004, 101, 15027–15032. [Google Scholar]
  15. Nath, N.; Chilkoti, A. Label-free biosensing by surface plasmon resonance of nanoparticles on glass: optimization of nanoparticle size. Anal. Chem. 2004, 76, 5370–5378. [Google Scholar]
  16. Orendorff, C. J.; Gole, A.; Sau, T. K.; Murphy, C. J. Surface-enhanced Raman spectroscopy of self-assembled monolayers: sandwich architecture and nanoparticle shape dependence. Anal. Chem. 2005, 77, 3261–3266. [Google Scholar]
  17. Derfus, A. M.; Chan, W. C. W.; Bhatia, S. N. Probing the cytotoxicity of semiconductor quantum dots. Nano Lett. 2004, 4, 11–18. [Google Scholar]
  18. Hu, J. Q.; Zhang, Y.; Liu, B.; Liu, J. X.; Zhou, H. H.; Xu, Y. F.; Jiang, Y. X.; Yang, Z. L.; Tian, Z. Q. Synthesis and properties of tadpole-shaped gold nanoparticles. J. Am. Chem. Soc. 2004, 26, 9470–9471. [Google Scholar]
  19. Link, S.; El-sayed, M. A. Spectral properties and relaxation dynamics of surface plasmon electronic oscillations in gold and silver nanodots and nanorods. J. Phys. Chem. B 1999, 103, 8410–8426. [Google Scholar]
  20. O'neal, P. D.; Cote, G. L.; Motamedi, M.; Chen, J.; Lin, W. C. Feasibility study using surface-enhanced Raman spectroscopy for the quantitative detection of excitatory amino acids (vol 8, pg 33, 2003). J. Biomed. Opt. 2003, 8, 316–316. [Google Scholar]
  21. Sulk, R.; Chan, C.; Guicheteau, J.; Gomez, C.; Heyns, J. B. B.; Corcoran, R.; Carron, K. Surface-enhanced Raman assays (SERA): Measurement of bilirubin and salicylate. J. Raman. Spectrosc. 1999, 30, 853–859. [Google Scholar]
  22. Hu, J. Q.; Chen, Q.; Xie, Z. X.; Han, G. B.; Wang, R. H.; Ren, B.; Zhang, Y.; Yang, Z. L.; Tian, Z. Q. A simple and effective route for the synthesis of crystalline silver nanorods and nanowires. Adv. Funct. Mater. 2004, 14, 183–189. [Google Scholar]
  23. Emory, S. R.; Haskins, W. E.; Nie, S. M. Direct observation of size-dependent optical enhancement in single metal nanoparticles. J. Am. Chem. Soc. 1998, 120, 8009–8010. [Google Scholar]
  24. Suzuki, M.; Niidome, Y.; Kuwahara, Y.; Terasaki, N.; Inoue, K.; Yamada, S. Surface-enhanced nonresonance Raman scattering from size- and morphology-controlled gold nanoparticle films. J. Phys. Chem. B 2004, 108, 11660–11665. [Google Scholar]
  25. Sharma, R. K.; Sharma, P.; Maitra, A. J. Size-dependent catalytic behavior of platinum nanoparticles on the hexacyanoferrate(III)/thiosulfate redox reaction. J. Colloid. Interface Sci. 2003, 265, 134–140. [Google Scholar]
  26. Zhang, Y.; Gu, C.; Schwartzberg, A. M.; Zhang, J. Z. Surface-enhanced Raman scattering sensor based on D-shaped fiber. Appl. Phys. Lett. 2005, 87. Art. No. 123105. [Google Scholar]
  27. Gersten, J.; Nitzan, A. Electromagnetic theory of enhanced Raman scattering by molecules adsorbed on rough surfaces. J. Chem. Phys. 1980, 73, 3023–3037. [Google Scholar]
  28. Ren, B.; Lin, X. F.; Yang, Z. L.; Liu, G. K.; Aroca, R. F.; Mao, B. W.; Tian, Z. Q. Surface-Enhanced Raman Scattering in the Ultraviolet Spectral Region: UV-SERS on rhodium and ruthenium electrodes. J. Am. Chem. Soc. 2003, 125, 9598–9599. [Google Scholar]
  29. Taylor, C. E.; Pemberton, J. E.; Goodman, G. G.; Schoenfisch, M. H. Surface enhancement factors for Ag and Au surfaces relative to Pt surfaces for monolayers of thiophenol. Appl. Spectrosc. 1999, 53, 1212–1221. [Google Scholar]
  30. Pieczonka, N. P. W.; Aroca, R. F. Inherent complexities of trace detection by surface-enhanced Raman scattering. Chem. Phys. Chem. 2005, 6, 2473–2484. [Google Scholar]
  31. Clarkson, J.; Sudworth, C.; Masca, S. I.; Batchelder, D. N.; Smith, D. A. Ultraviolet resonance Raman study of the avidin biotin complex. J. Raman. Spectrosc. 2000, 31, 373–375. [Google Scholar]
  32. Wang, L.; Yan, R.; Huo, Z.; Wang, L.; Zeng, J.; Bao, J.; Wang, X.; Peng, Q.; Li, Y. Fluorescence resonant energytransfer biosensor based on upconversion-luminescent nanoparticles. Angew. Chem. Inter. Ed. 2005, 44, 6054–6057. [Google Scholar]
  33. Dong, D.; Zheng, Dong.; Wang, F.-Q.; Yang, X.-Q.; Wang, N.; Li, Y.-G.; Guo, L.-H.; Cheng, J. Quantitative Photoelectrochemical Detection of Biological Affinity Reaction:Biotin-Avidin Interaction. Anal. Chem. 2004, 76, 499–501. [Google Scholar]
  34. Christophe, L.; Nicolas, H.; Thomas, R. W. Artificial metalloenzymes based on biotin-avidin technology for the enantioselective reduction of ketones by transfer hydrogenation. PNAS 2005, 102, 4683–4687. [Google Scholar]
  35. Dimitrijevic, N. M.; Saponjic, Z. V.; Rabatic, B. M.; Rajh, T. Assembly and charge transfer in hybrid TiO2 architectures using biotin-avidin as a connector. J. Am. Chem. Soc. 2005, 127, 1344–1345. [Google Scholar]
  36. Torreggiani, A.; Fini, G. Raman spectroscopic studies of ligand-protein interactions: the binding of biotin analogues by avidin. J. Raman. Spectrosc. 1998, 29, 229–236. [Google Scholar]
  37. Torreggiani, A.; Fagnano, C.; Fini, G. Involvement of lysine and tryptophan side-chains in the biotin-avidin interaction. J. Raman. Spectrosc. 1997, 28, 23–27. [Google Scholar]
  38. Honzatko, R. B.; Williams, R. W. Raman spectroscopy of avidin: secondary structure, disulfide conformation, and the environment of tyrosine. Biochem. 1982, 21, 6201–6205. [Google Scholar]
Figure 1. TEM images of (A) hexagon- and (B) boot-shaped gold nanoparticles prepared using the present synthetic route. Their insets are the corresponding TEM images of single gold nanoparticles, respectively. Scale bars: 50 nm and 10 nm (inset).
Sensors 07 03299f1
Figure 2. (A, C) TEM and (B, D) HRTEM images of the gold nanohexagons and nanoboots synthesized respectively using 0.1 and 0.02 mM D-glucose.
Sensors 07 03299f2
Figure 3. XRD pattern of gold nanoboots and EDX spectra of gold nanohexagons (A) and nanoboots (B).
Sensors 07 03299f3
Figure 4. UV-visible absorption spectra of sphere-shaped (a), hexagon-shaped (b), tadpole-shaped (c), and boot-shaped (d) gold nanoparticles taken respectively from their corresponding colloidal solutions, and the inset is digital photos of the reaction mixtures of the nanoparticles with hexagon and boot shapes, respectively.
Sensors 07 03299f4
Figure 5. SERS spectrum of (a) blank on ITO glass slice assembled with spherical gold nanoparticles, Raman spectrum of (b) 10 M SCN- solution, and SERS spectra of SCN- on ITO glass slices assembled with (c) spheres, (d) hexagons, (e) tadpoles, and (f) boots. Integration times are (a) 60 s, (b) 800 s (scale bar: 0.25 cps), (c) 20 s (scale bar: 10 cps), (d) 20 s (scale bar: 10 cps), (e) 1 s (scale bar: 1000 cps), and (f) 1 s (scale bar: 1000 cps).
Sensors 07 03299f5
Figure 6. Schematic illustration of the real-time determination of avidin.
Sensors 07 03299f6
Figure 7. (A) SERS spectra of (a) the coupling complex between mercaptoethylamine-assembled gold nanoboots and biotins and its real-time detection of (b) 1mg/mL, (c) 0.1mg/mL, (d) 0.01mg/mL, and (e, f) 0.001mg/mL avidin. Except curve f (integration time: 50 s; scale bar: 8 cps), integration times of all SERS spectra were 20 s (scale bar: 20 cps). The right plot shows magnified spectrum peaks at 600-700 cm-1 from the asterisks of the left plot. (B) Plot of SERS intensity respond to the concentration of avidin.
Sensors 07 03299f7
Table 1. Calculated Surface Enhancement Factors (EF) for SCN- on ITO Glass Slices Assembled with Gold Nanoparticles of Different Shapes
Nanoparticle shapeEF*
Sphere1.26 ± 0.52 × 10⁶
Hexagon4.01 ± 0.97 × 10⁶
Tadpole2.45 ± 0.23 × 10⁸
Boot4.04 ± 0.33 × 10⁸
*The EFs from the SERS peaks at about 2075 cm-1 of SCN- were calculated using the typical expression of {[ISERS] × [Mbulk]}/{[IRaman] × [Mads]}.

