Article

Non-Destructive Evaluation of Historical Paper Based on pH Estimation from VOC Emissions

1
University College London, Centre for Sustainable Heritage, The Bartlett School of Graduate Studies (Torrington Place site), Gower Street, London WCIE 6BT, UK,
2
University of Ljubljana, Faculty of Chemistry and Chemical Technology, Ljubljana, Slovenia
3
National and University Library, Ljubljana, Slovenia
4
Nationaal Archief, The Hague, The Netherlands
*
Author to whom correspondence should be addressed.
Sensors 2007, 7(12), 3136-3145; https://doi.org/10.3390/s7123136
Submission received: 12 November 2007 / Accepted: 4 December 2007 / Published: 5 December 2007

Abstract

:
Volatile organic compounds (VOCs) emitted from materials during degradation can be a valuable source of information. In this work, the emissions of furfural and acetic acid from cellulose were studied using solid-phase micro-extraction (SPME) in combination with gas chromatography-mass spectrometry. Two sampling techniques were employed: static headspace sampling using SPME for 1 h at 40 °C after 18-h sample preparation at 80 °C in a closed glass vial, and contact SPME in a stack of paper (or a book). While a number of VOCs are emitted from paper under conditions of natural or accelerated degradation, two compounds were confirmed to be of particular diagnostic value: acetic acid and furfural. The emissions of furfural are shown to correlate with pH of the cellulosic environment. Since pH is one of the most important parameters regarding durability of this material, the developed method could be used for non-destructive evaluation of historical paper.

1. Introduction

The analysis of historical objects is often difficult due to restricted sampling. The value of historical substance and its integrity is rarely outweighed by the information we gain through destructive sampling and subsequent chemical analysis. In the analysis of paper, we are often interested in the parameter, which is crucial for its durability, i.e. pH [1]. The degradation pathway and the rate of chain scission depend on this parameter: in an acidic environment, cellulose degrades according to acid-catalysed hydrolysis, while in a moderately alkaline environment, it degrades through autoxidation. The latter process is much slower and the lifetime of traditionally produced moderately alkaline paper (produced prior to ∼1850) is thought to be several millennia. This is in a stark contrast with acidic paper produced between 1850 and 1990: some documents from this period are not expected to survive another century. The catastrophic circumstance is that it is estimated that more than 70% of documents in Western libraries are acidic [2].
This is why the determination of acidity in historical paper is a major analytical task [3]. Most of the techniques presently available are based on traditional pH sensors, such as flat surface pH electrode. Unfortunately, the material surface needs to be wetted for the purpose, which is unacceptable for valuable objects. Micro-pH sensors have been developed, with which only a few micrograms of fibres are analysed since micro-sampling is occasionally permitted [4].
There is a source of information which has been largely overlooked in development of analytical methods for cultural heritage: emissions of volatile organic compounds (VOCs). Ever since Shafizadeh had summarised his pioneering work on pyrolysis of biomass in 1982 [5], it has been known that VOCs are information-rich: using HPLC and IEC with cryo-trap sampling differences were shown in degradation pathways of paper in different reaction conditions [6]. Following the advent of solid-phase micro-extraction (SPME) [7-9], the use of this technique was recently explored also for characterisation of paper [10,11] and selection of the appropriate fibre material and different sampling techniques were studied. It was found out that the DVB/CAR/PDMS SPME fibre was the most appropriate for extraction of the variety of VOCs emitted from paper. Contact sampling was carried out for 15 days at room temperature and a wide array of volatiles was identified. The concept of contact SPME was developed for a variety of purposes, including studies of emissions from live insects [12].
The presence of VOCs, especially acetic acid, formic acid and formaldehyde in museum environments can have corrosive effects on a variety of materials. SPME in combination with GC-MS has been proposed as the method of choice for such analyses [13]. While paper is a source of VOCs, it is also a potent adsorbent [14] and during quantitative work this effect has to be taken into account.
It was our primary interest to relate the information on VOC emission, which can be obtained using contact-SPME sampling with chemical information on the emitting material. VOCs can be produced in a variety of cellulose degradation reactions. It is known that low-MW organic acids form during end-wise degradation of polysaccharide chains, especially acetic and formic acid and similarly, furfural is a well-known product of acid-catalysed hydrolysis of cellulose [15]. It might be expected that during natural ageing, these products accumulate in a book and are emitted only slowly [16]. Thus, the degradation pathway may influence the VOC profile of a degrading paper to an appreciable extent.
In this paper, we used two SPME techniques: static headspace sampling at an elevated temperature and well-defined conditions, and contact sampling at room conditions. The extracted VOCs were analysed using GC-MS and the relative abundances were compared with paper pH. It turned out that contact SPME can be used to estimate the pH of paper in a non-destructive manner.

2. Experimental Section

2.1. Samples

A description of papers and pulp samples used in the study are given in Table 1, along with the type of raw material used in paper production, determined according to SCAN-G3:90 and SCAN-G4:90 standard procedures. In addition to these real samples, Whatman filter paper no. 1 (Maidstone) was used as a model paper. It contains purified cotton linters with an addition of bleached softwood pulp. The samples were impregnated with phosphate buffers (0.1 mol L-1) of pH 5, 6, 7, 8, 9 and 10, and dried.

2.2. pH measurement

For determination of pH of real and model samples, the methodology of cold extraction taking into account the role of atmospheric CO2 was used [3]. Following the extraction, pH of extracts was measured. The typical uncertainty of pH determination using this technique was <0.3 pH unit.

2.3. Solid-phase micro-extraction (SPME)

For sampling, SPME fibres (Supelco, Bellefonte) with DVB/CAR/PDMS stationary phase, thickness 50/30 μm were used. Before each sampling, the fibre was pre-conditioned at 230 °C for 30 min.

2.4. Static headspace sampling (SHS)

For SHS-SPME sample preparation procedure, approximately 100 mg of paper was placed in a closed 20-mL vial and thermostated for 18 h at 80 °C. After closed vial was cool down to 40 °C in 5 minutes. During actual sampling, the pre-conditioned SPME fibre was then placed in the vial for 1 h at 40 °C.
During the 18-h sample preparation procedure at 80 °C, degradation of the sample leads to formation of VOCs, the determination of which follows in the subsequent step.

2.5. Contact sampling (CS)

The pre-conditioned SPME fibre was inserted into the paper stack (or a book) and the VOCs were extracted for 24 h at room temperature (22 °C). During sampling, the paper stack was wrapped into aluminium foil.

2.6. Instrumentation

A Hewlett-Packard 5890 series II gas chromatograph, coupled to a Hewlett-Packard 6890 quadrupole mass spectrometer (Palo Alto) was used. Manual splitless injection was used at 230 °C. A 60-m VOCOL column, I.D. 0.25 mm and stationary phase thickness 1,5 μm was used (Supelco, Bellefonte). The mobile phase used was helium (99.999%, He 5,0, Messer, Frankfurt, Germany) at a flow of 1 mL min-1. The following temperature program was used after injection: 2 min at 50 °C, then heating to 210 °C at the rate of 10.0 °C min-1, after which the temperature was kept constant for 30 min.
Ionisation was performed using standard EI mode using 70 eV at 170 °C. The interface was heated to 280 °C. The detection was initially performed using total ion current, and after the identification of the most informative paper degradation products, selected-ion monitoring was used (m/z 60 for acetic acid and m/z 95 for furfural) for quantitative determinations.
The results were comparatively assessed, i.e. not attempt was made at quantification of emissions, as this was not necessary. Instead, we comparatively evaluated the results in terms of peak areas for acetic acid and furfural at constant conditions of static sampling, which was considered as the most suitable sampling strategy for the purpose. For quantification of emissions during degradation, dynamic sampling would have to be used. However, this was not the purpose of our study.

3. Results and Discussion

Two modes of SPME sampling were tested: static headspace sampling (SHS) after a certain period of annealing the sample at 80 °C and contact sampling (CS). For SHS, 100 mg of sample have to be available for the analysis, while CS is non-destructive.

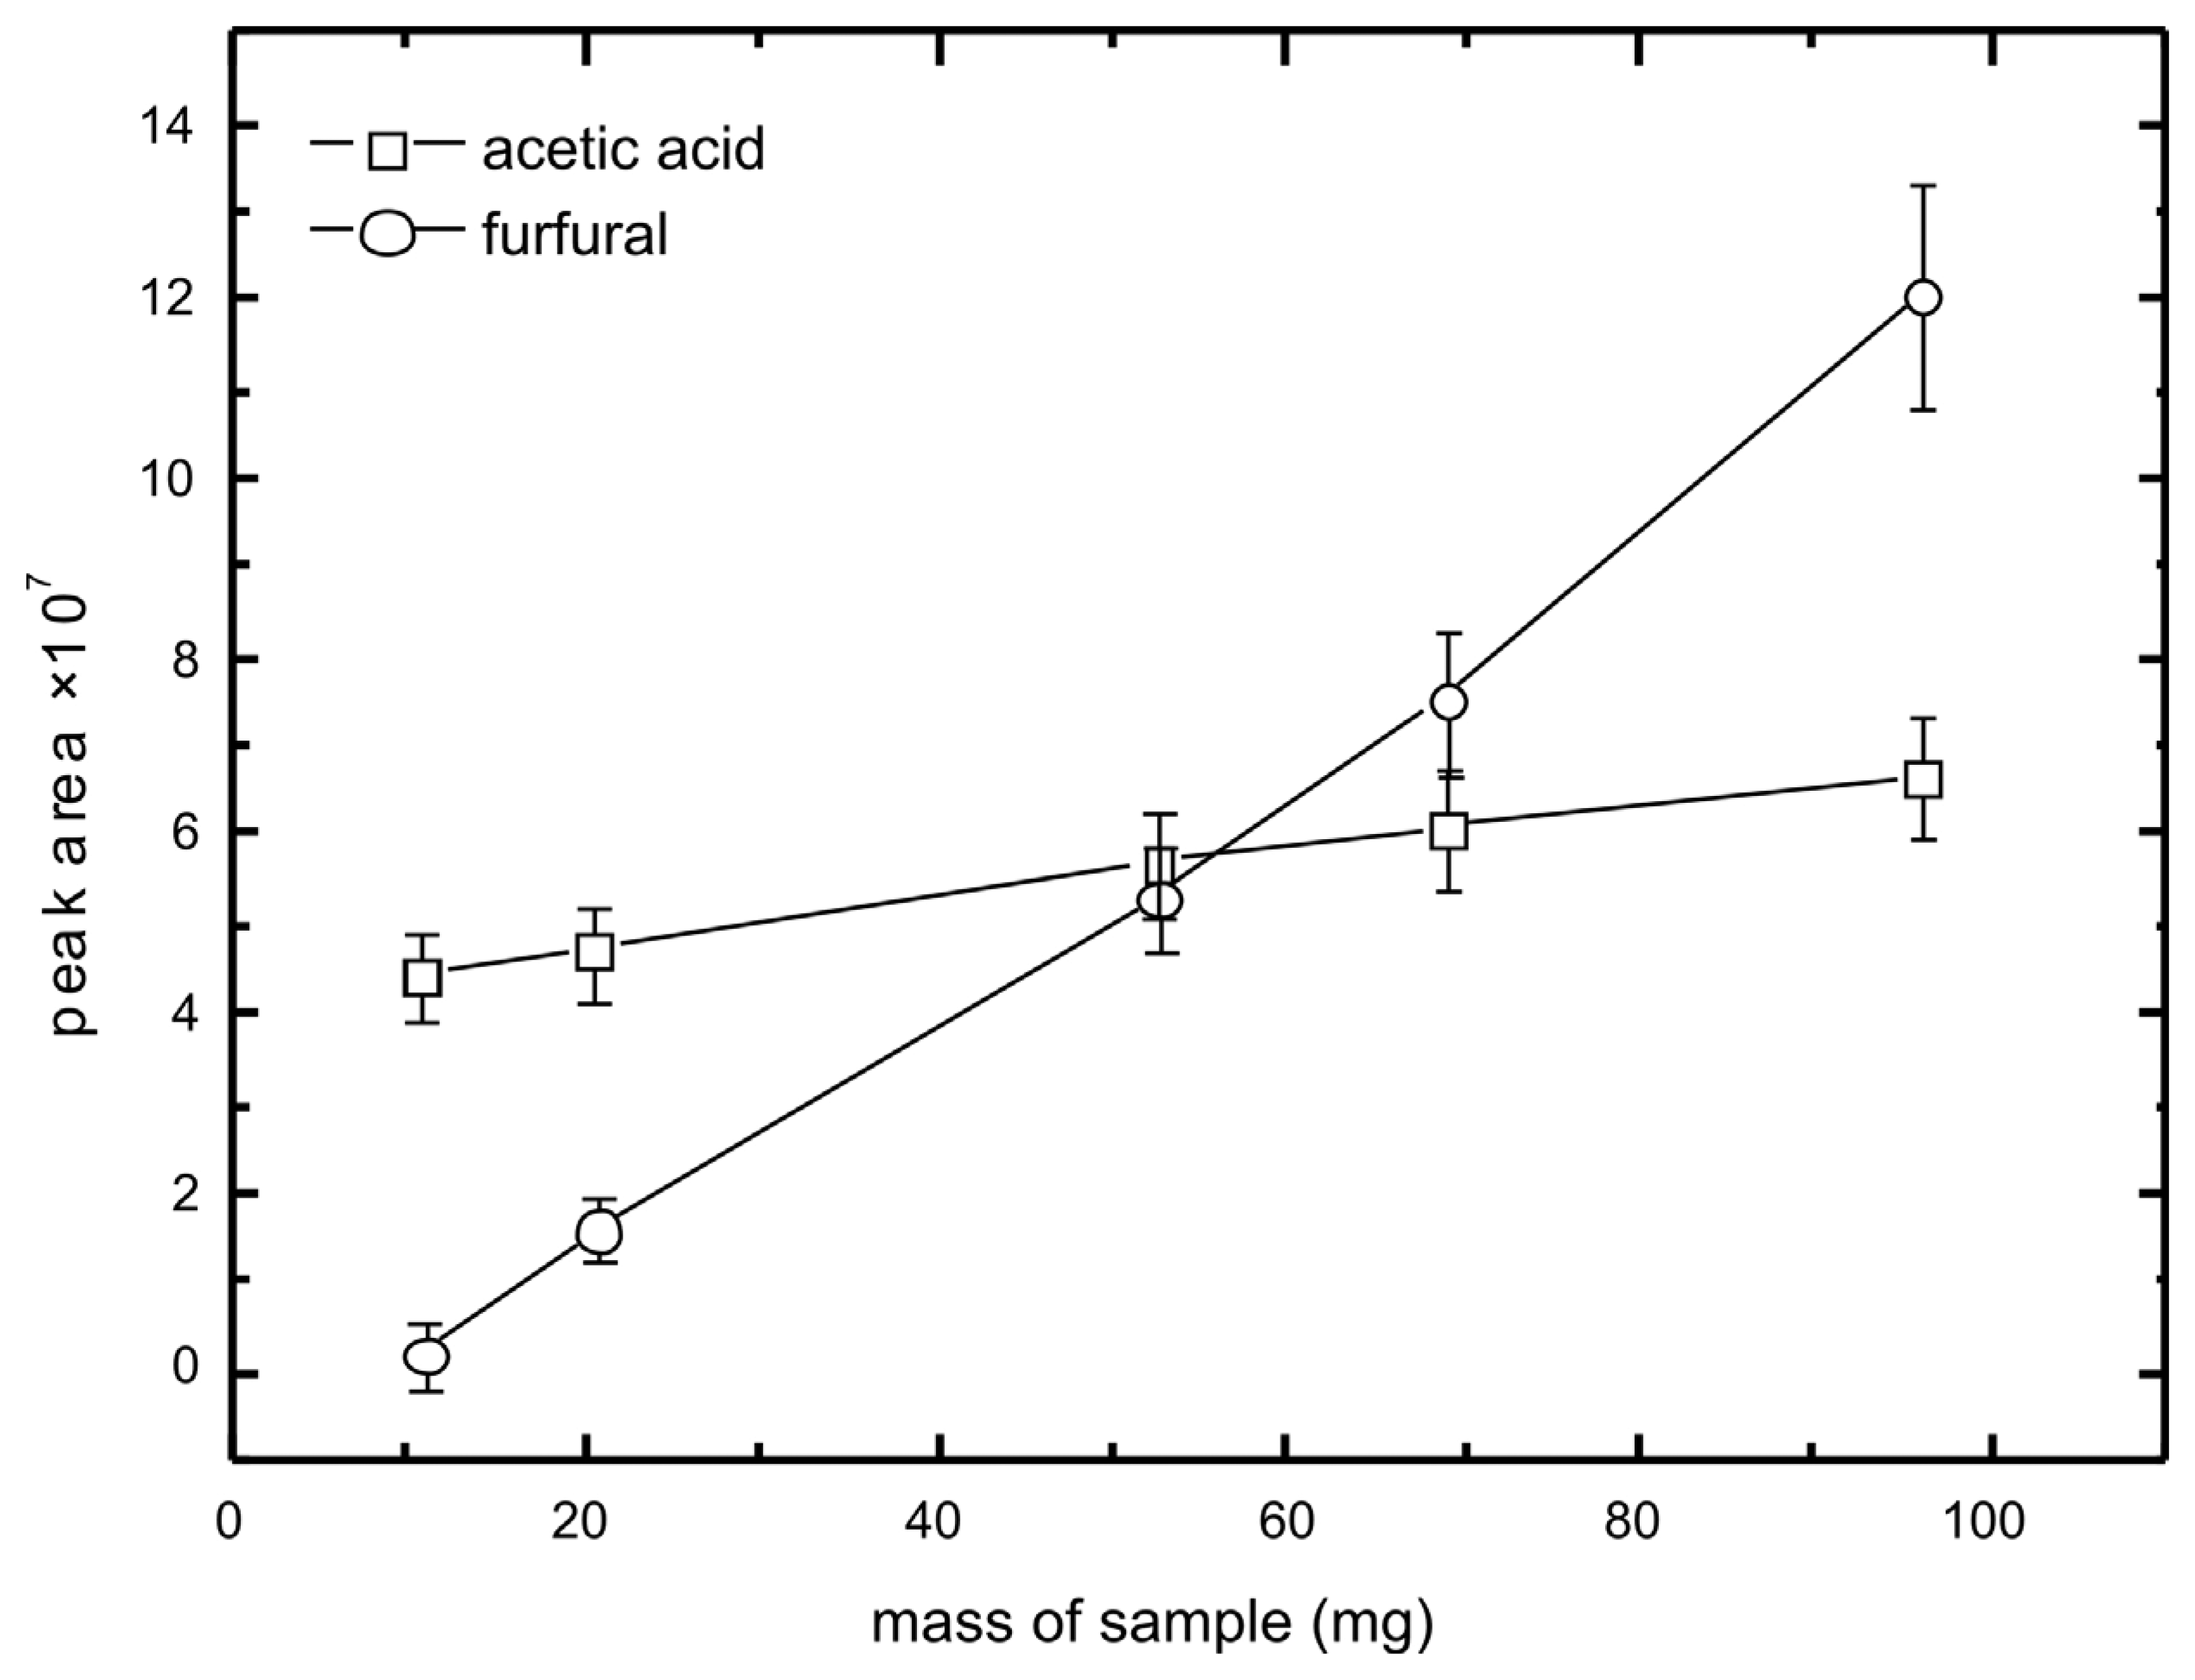
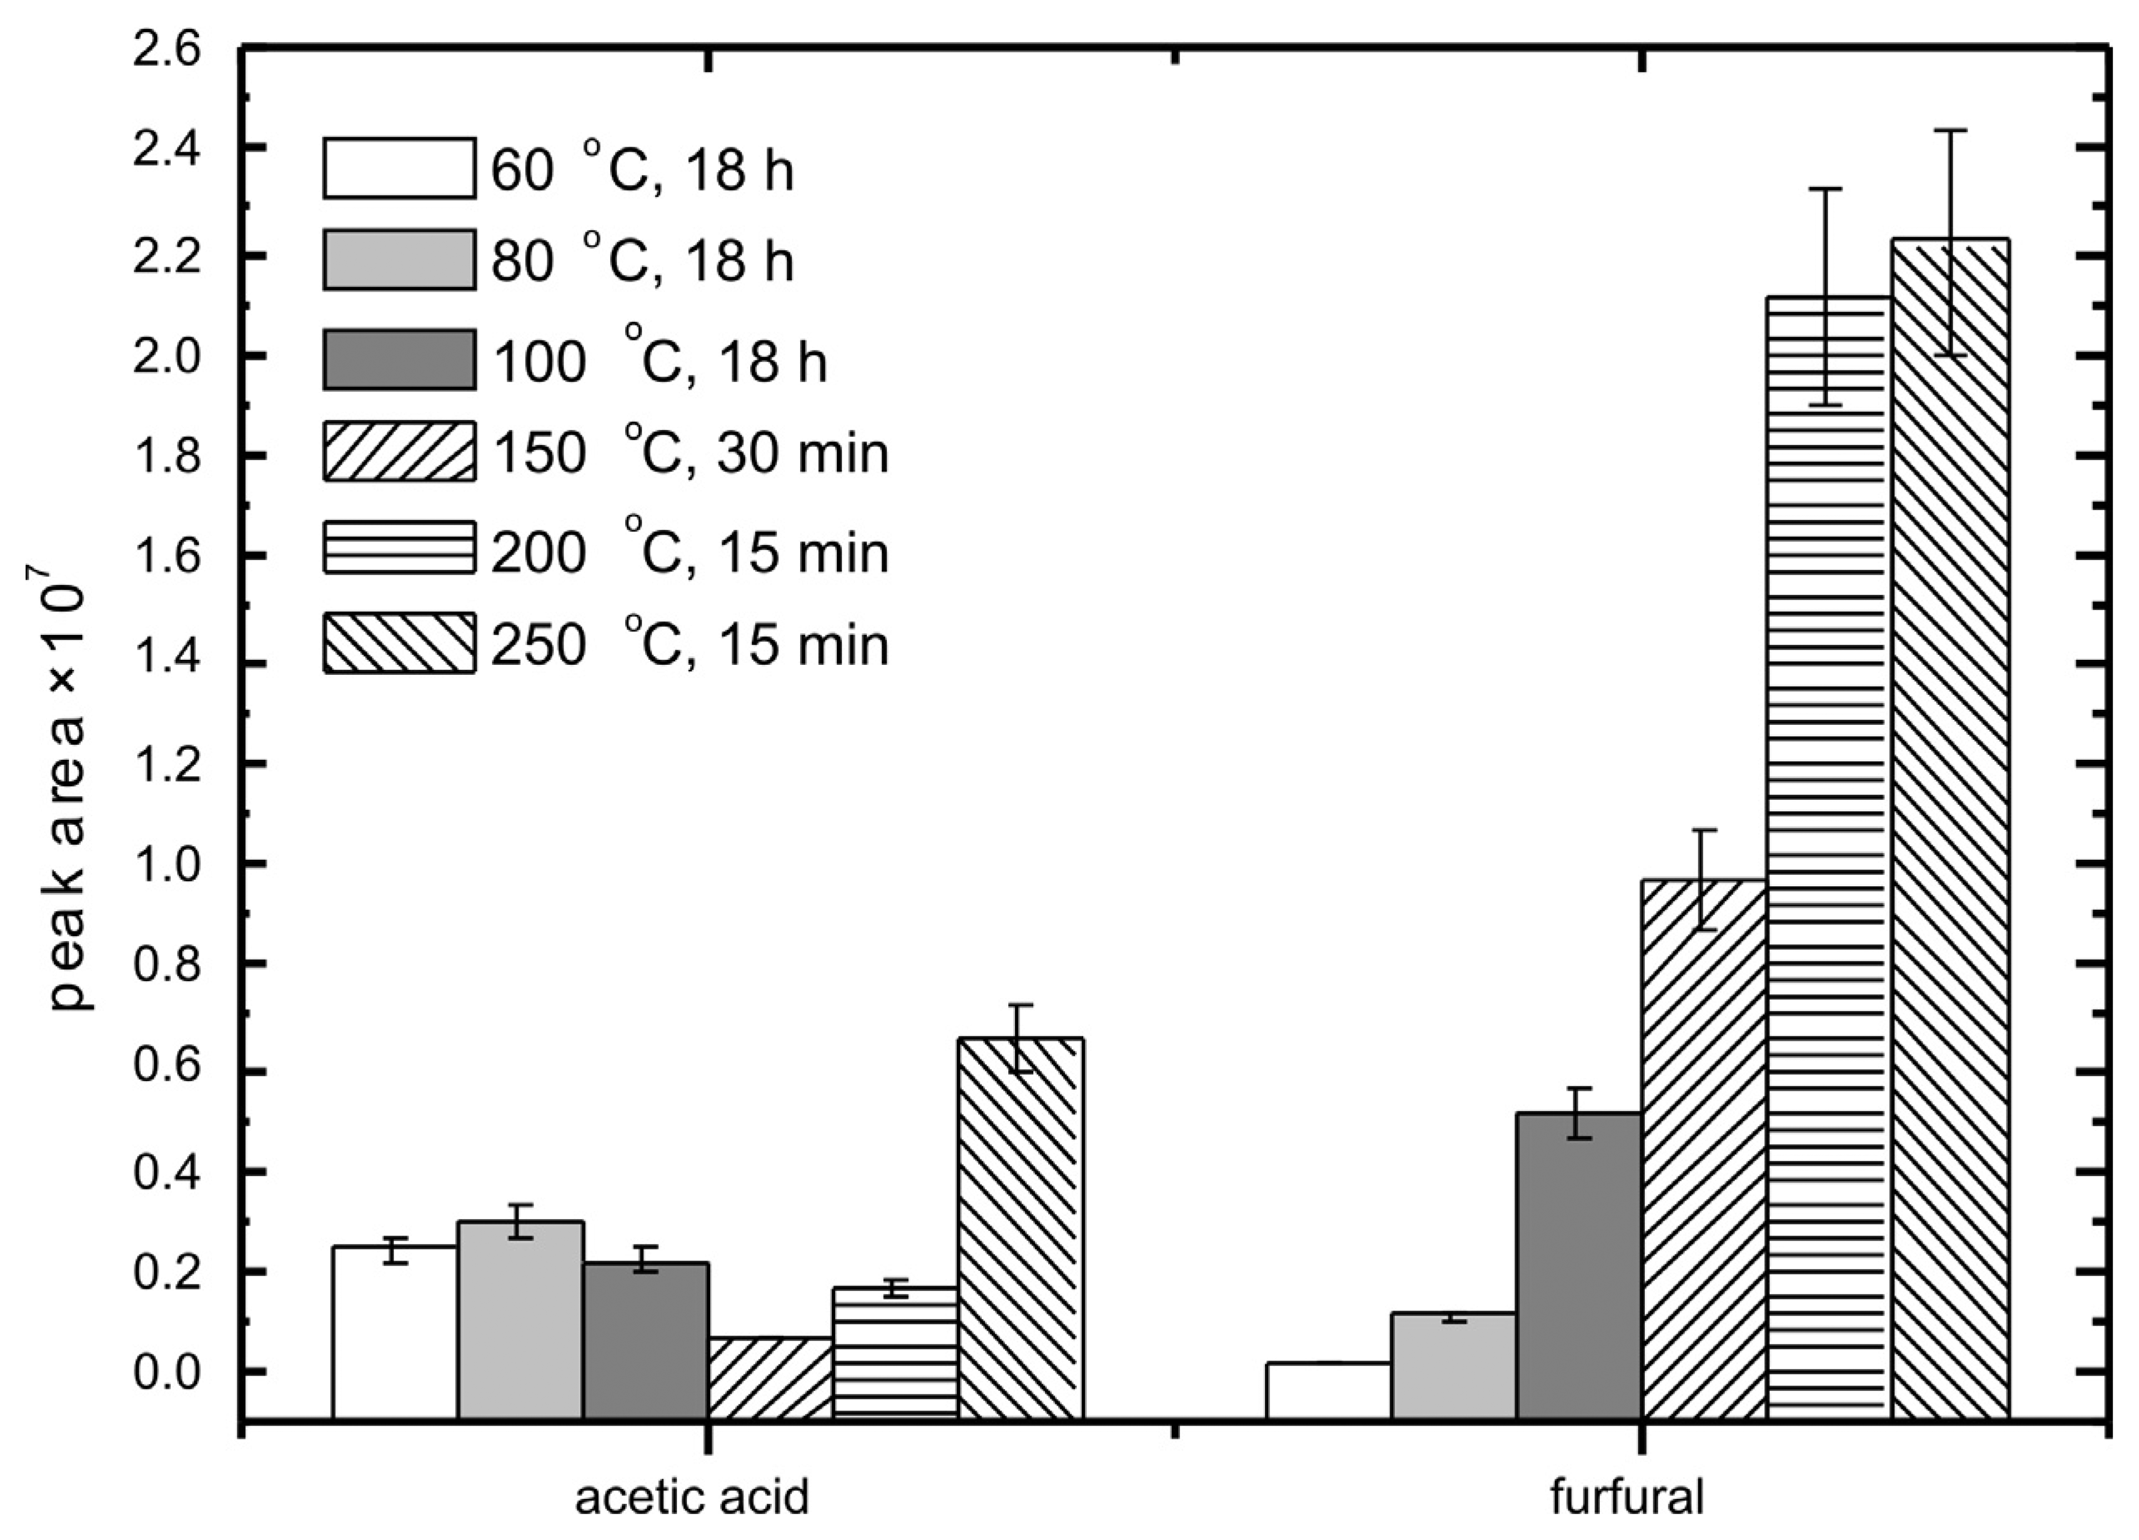
3.1. Static Headspace Sampling

Using this methodology, the sample (paper, pulp or cellulosic) is inserted into a glass vial, which is then closed and thermostated at 80 °C for 18 h. The mass of sample, temperature and duration of this sample preparation procedure were optimised in order to obtain appropriate signal-to-noise (S/N) ratios for compounds of interest and thus well repeatable results. For this purpose, sample no. 14 was chosen randomly. The sample size may vary, although it has to be taken into account that smaller samples lead to less emitted VOCs and as a consequence, less reliable results (Figure 1). With the proposed procedure, the typical uncertainty of determination of chromatographic peak areas was less than 10%, which was considered satisfactory.
A certain period of time is needed for the paper sample to equilibrate with the surrounding atmosphere. A prolonged period of heating as used in the proposed procedure leads to accelerated degradation of sample and as a consequence, it leads to increased emission of volatiles. This procedure of sample pre-treatment is important, as we may assume that the emissions from sample predominantly mirror the degradation, which occurred during the 18-h heating period and not during previous natural degradation. Thus, better reproducibility may be expected. Certainly, this procedure is not suitable for valuable objects.
As can be seen in Figure 2, release of acetic acid is almost independent of the temperature during the sample preparation (degradation) phase, and an increased content is only determined at 250 °C. The detected emissions of furfural increase considerably with temperature. Although at higher temperatures we detect more degradation products, leakage of VOCs from vials needs to be taken into account. In addition, the degradation of paper at temperatures >100 °C is likely to be less representative of the degradation observed at <100 °C, where water undoubtedly plays an important role and the conditions more closely resemble those of natural ageing.
Optimisation of this step is thus not possible in view of production of VOCs. We thus decided for the most reasonable procedure, both from the viewpoint of duration and from the aspect of degradation reactions we are interested in (i.e. temperature). Thus, the conditions of 80 °C for 18 h were finally chosen. In view of the temperature, the experimental conditions also reflect the ISO 5630-3:1996 standard on accelerated degradation of paper.
The fact that the content of emitted VOCs in a vial reflects degradation during the 18-h sample preparation period is important in comparative studies of freshly prepared samples made of filter paper, impregnated with phosphate buffer solutions of various pH (Figure 3). The results clearly show that the area of the peak representing acetic acid does not vary with pH in the observed pH range, while that of furfural does. In fact, a satisfactory correlation between furfural peak area and pH has been obtained.
It is of interest to see that the emission of acetic acid is almost independent of the sample pH – this must be a consequence of not only the degradation chemistry but also of the fact that above pH 5 acetic acid exists mainly in the form of acetate. Since acetate readily absorbs at pH above 5 emissions of volatile acetic acid will be expected only from a highly acidic sample (pH < 4).
Furfural is a neutral molecule and its volatility is not affected by sample pH. As seen from Fig. 3 emission of furfural seems to be inversely proportional to the pH of cellulosic sample. This indicates that production of furfural is accelerated by acid hydrolysis of polysaccharides in cellulosic materials. Correlation between pH and emission of furfural from paper can be therefore exploited for non-destructive estimation of paper pH as well as for the indication of cellulose degradation via the acid-catalysed mechanism.
Using real samples (Table 1), a satisfactory correlation between furfural emission and sample pH was obtained (Figure 4). This is remarkable, considering the wide variety of paper samples used, especially in view of their composition – from cotton, containing almost pure cellulose to groundwood, containing up to ∼50% lignin. We attempted to normalise the peak area for furfural against the peak area of acetic acid, however, no improvement in the quality of correlation was obtained. This may be understandable, as while furfural is predominantly a degradation product of carbohydrates, acetic acid may form also during degradation of other paper components (e.g. lignin).
The methodology allows for estimation of paper sample pH without an addition of water, which is needed for pH measurements using electrochemical techniques. This is important in cases, where sample wetting interferes with sample chemistry. However, as stressed above, the destructive sampling procedure prevents the methodology to be used for historical papers.

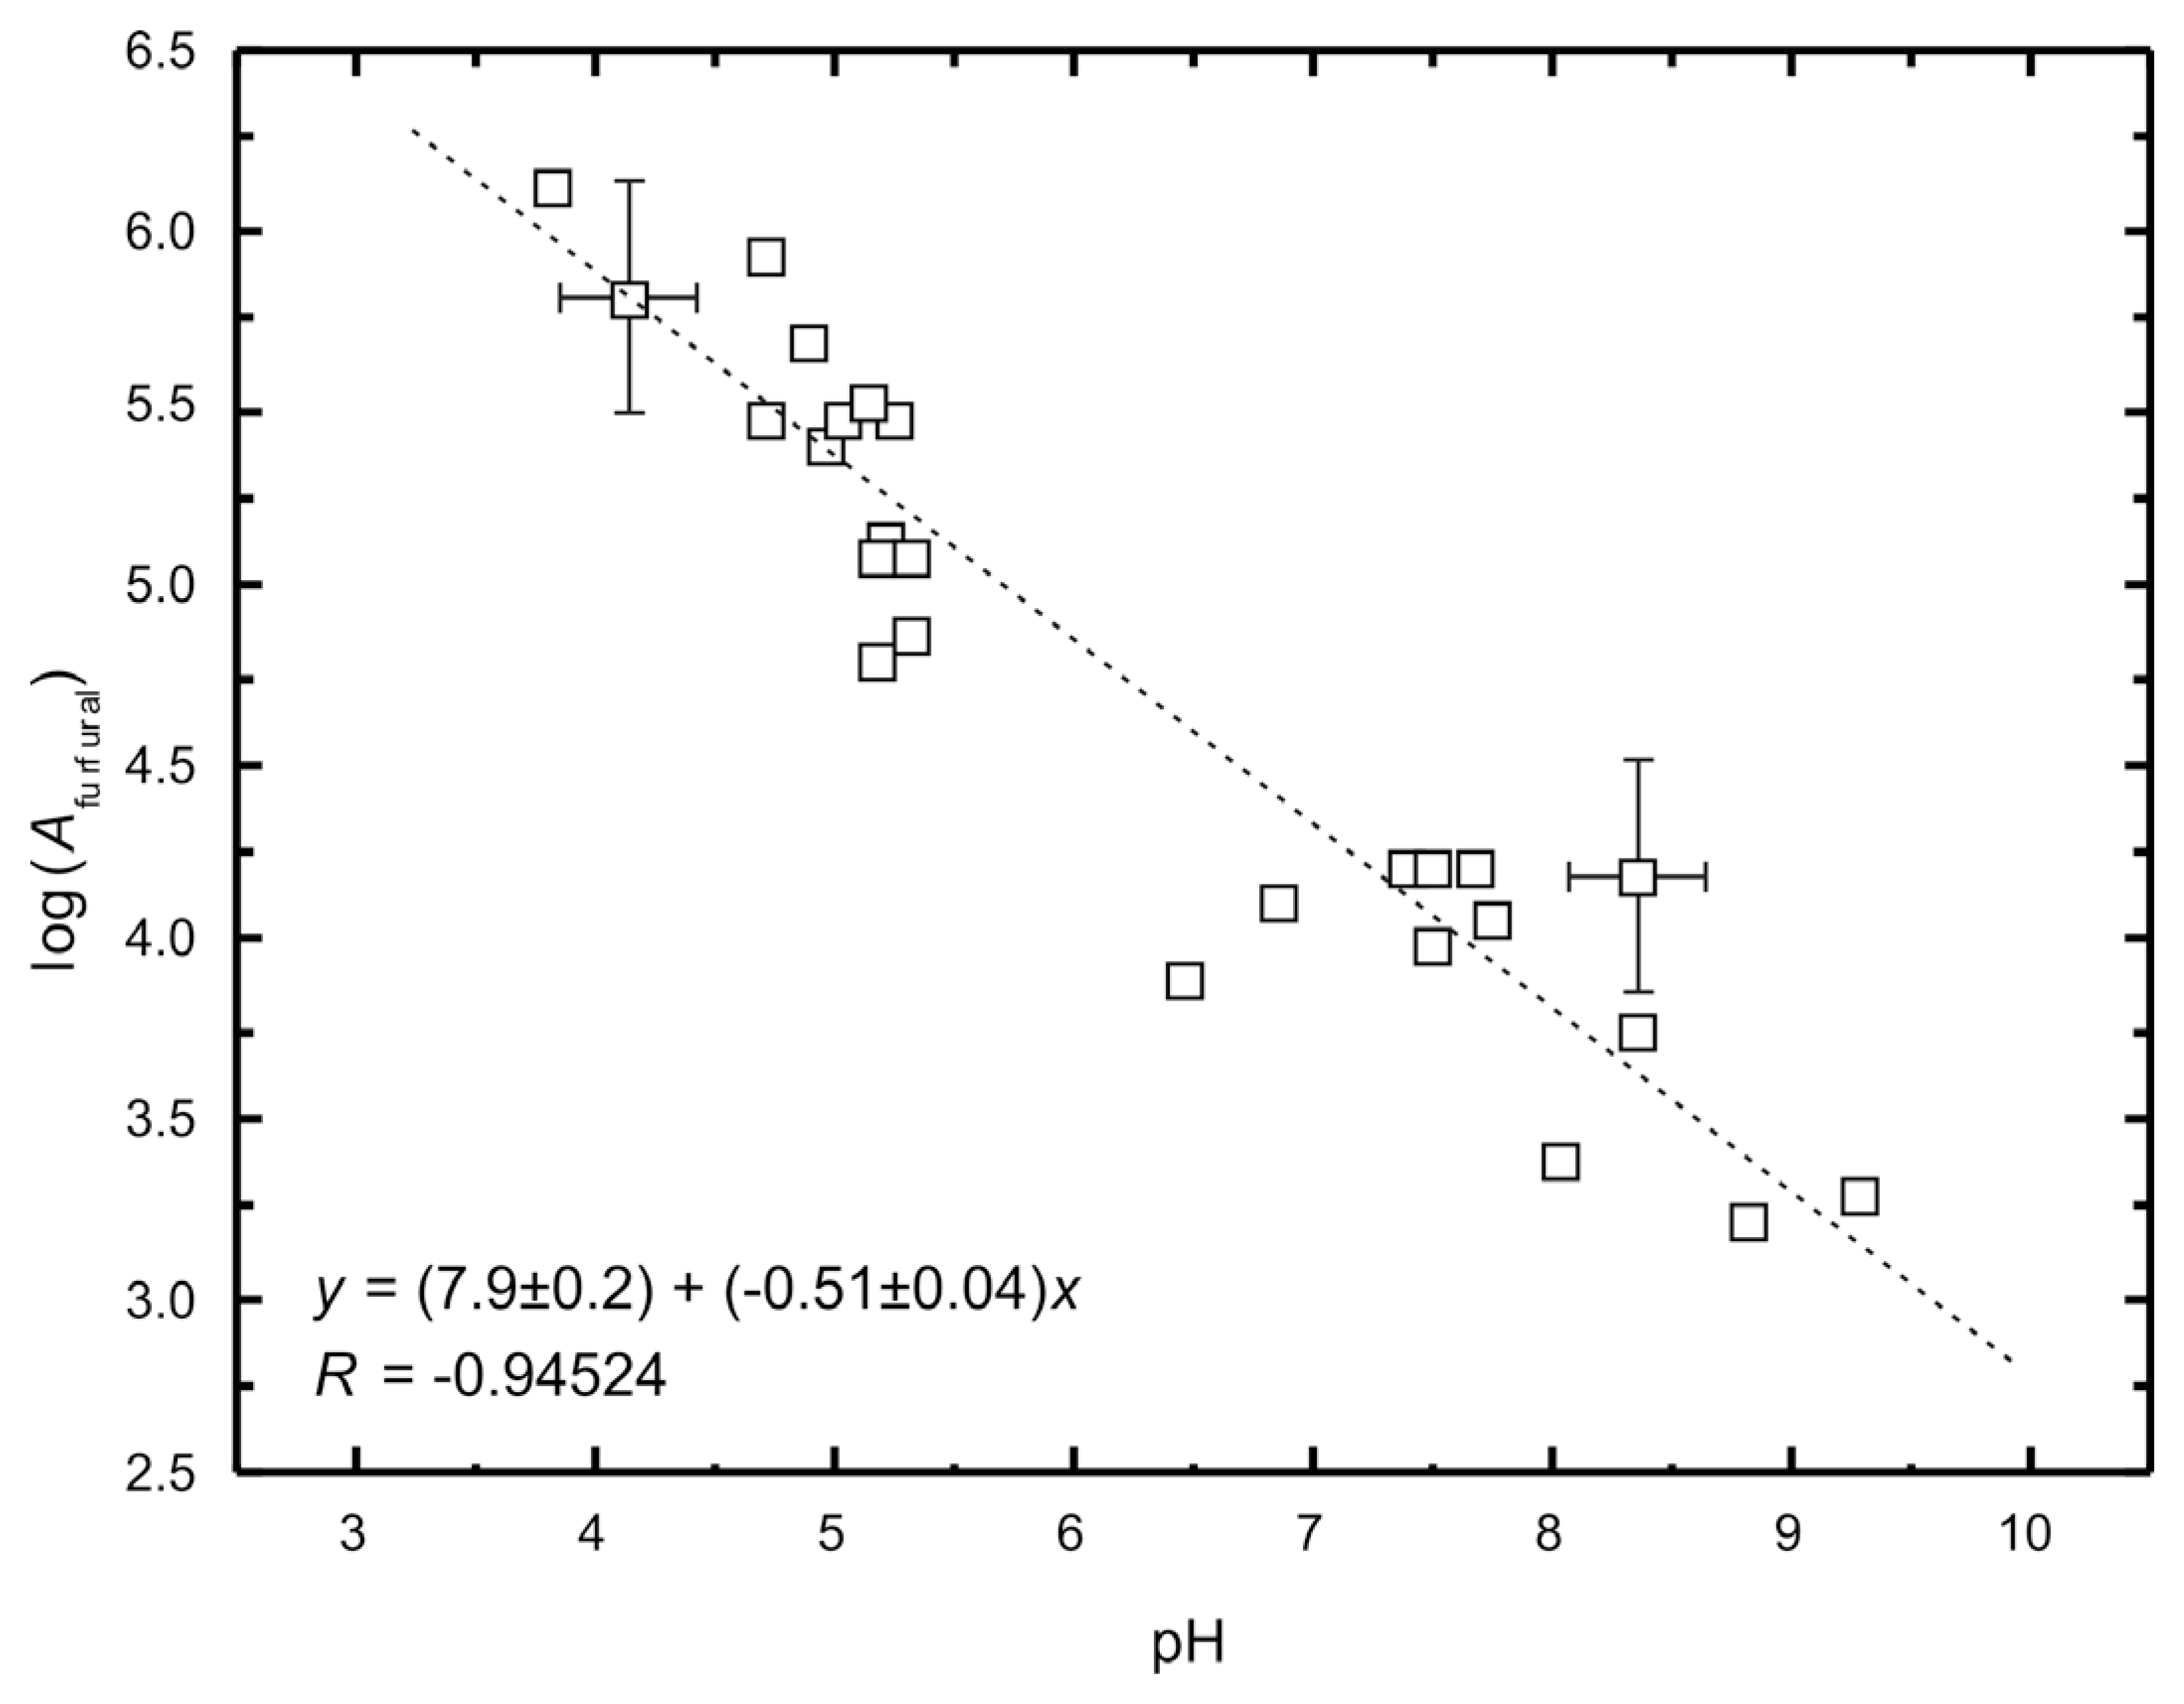
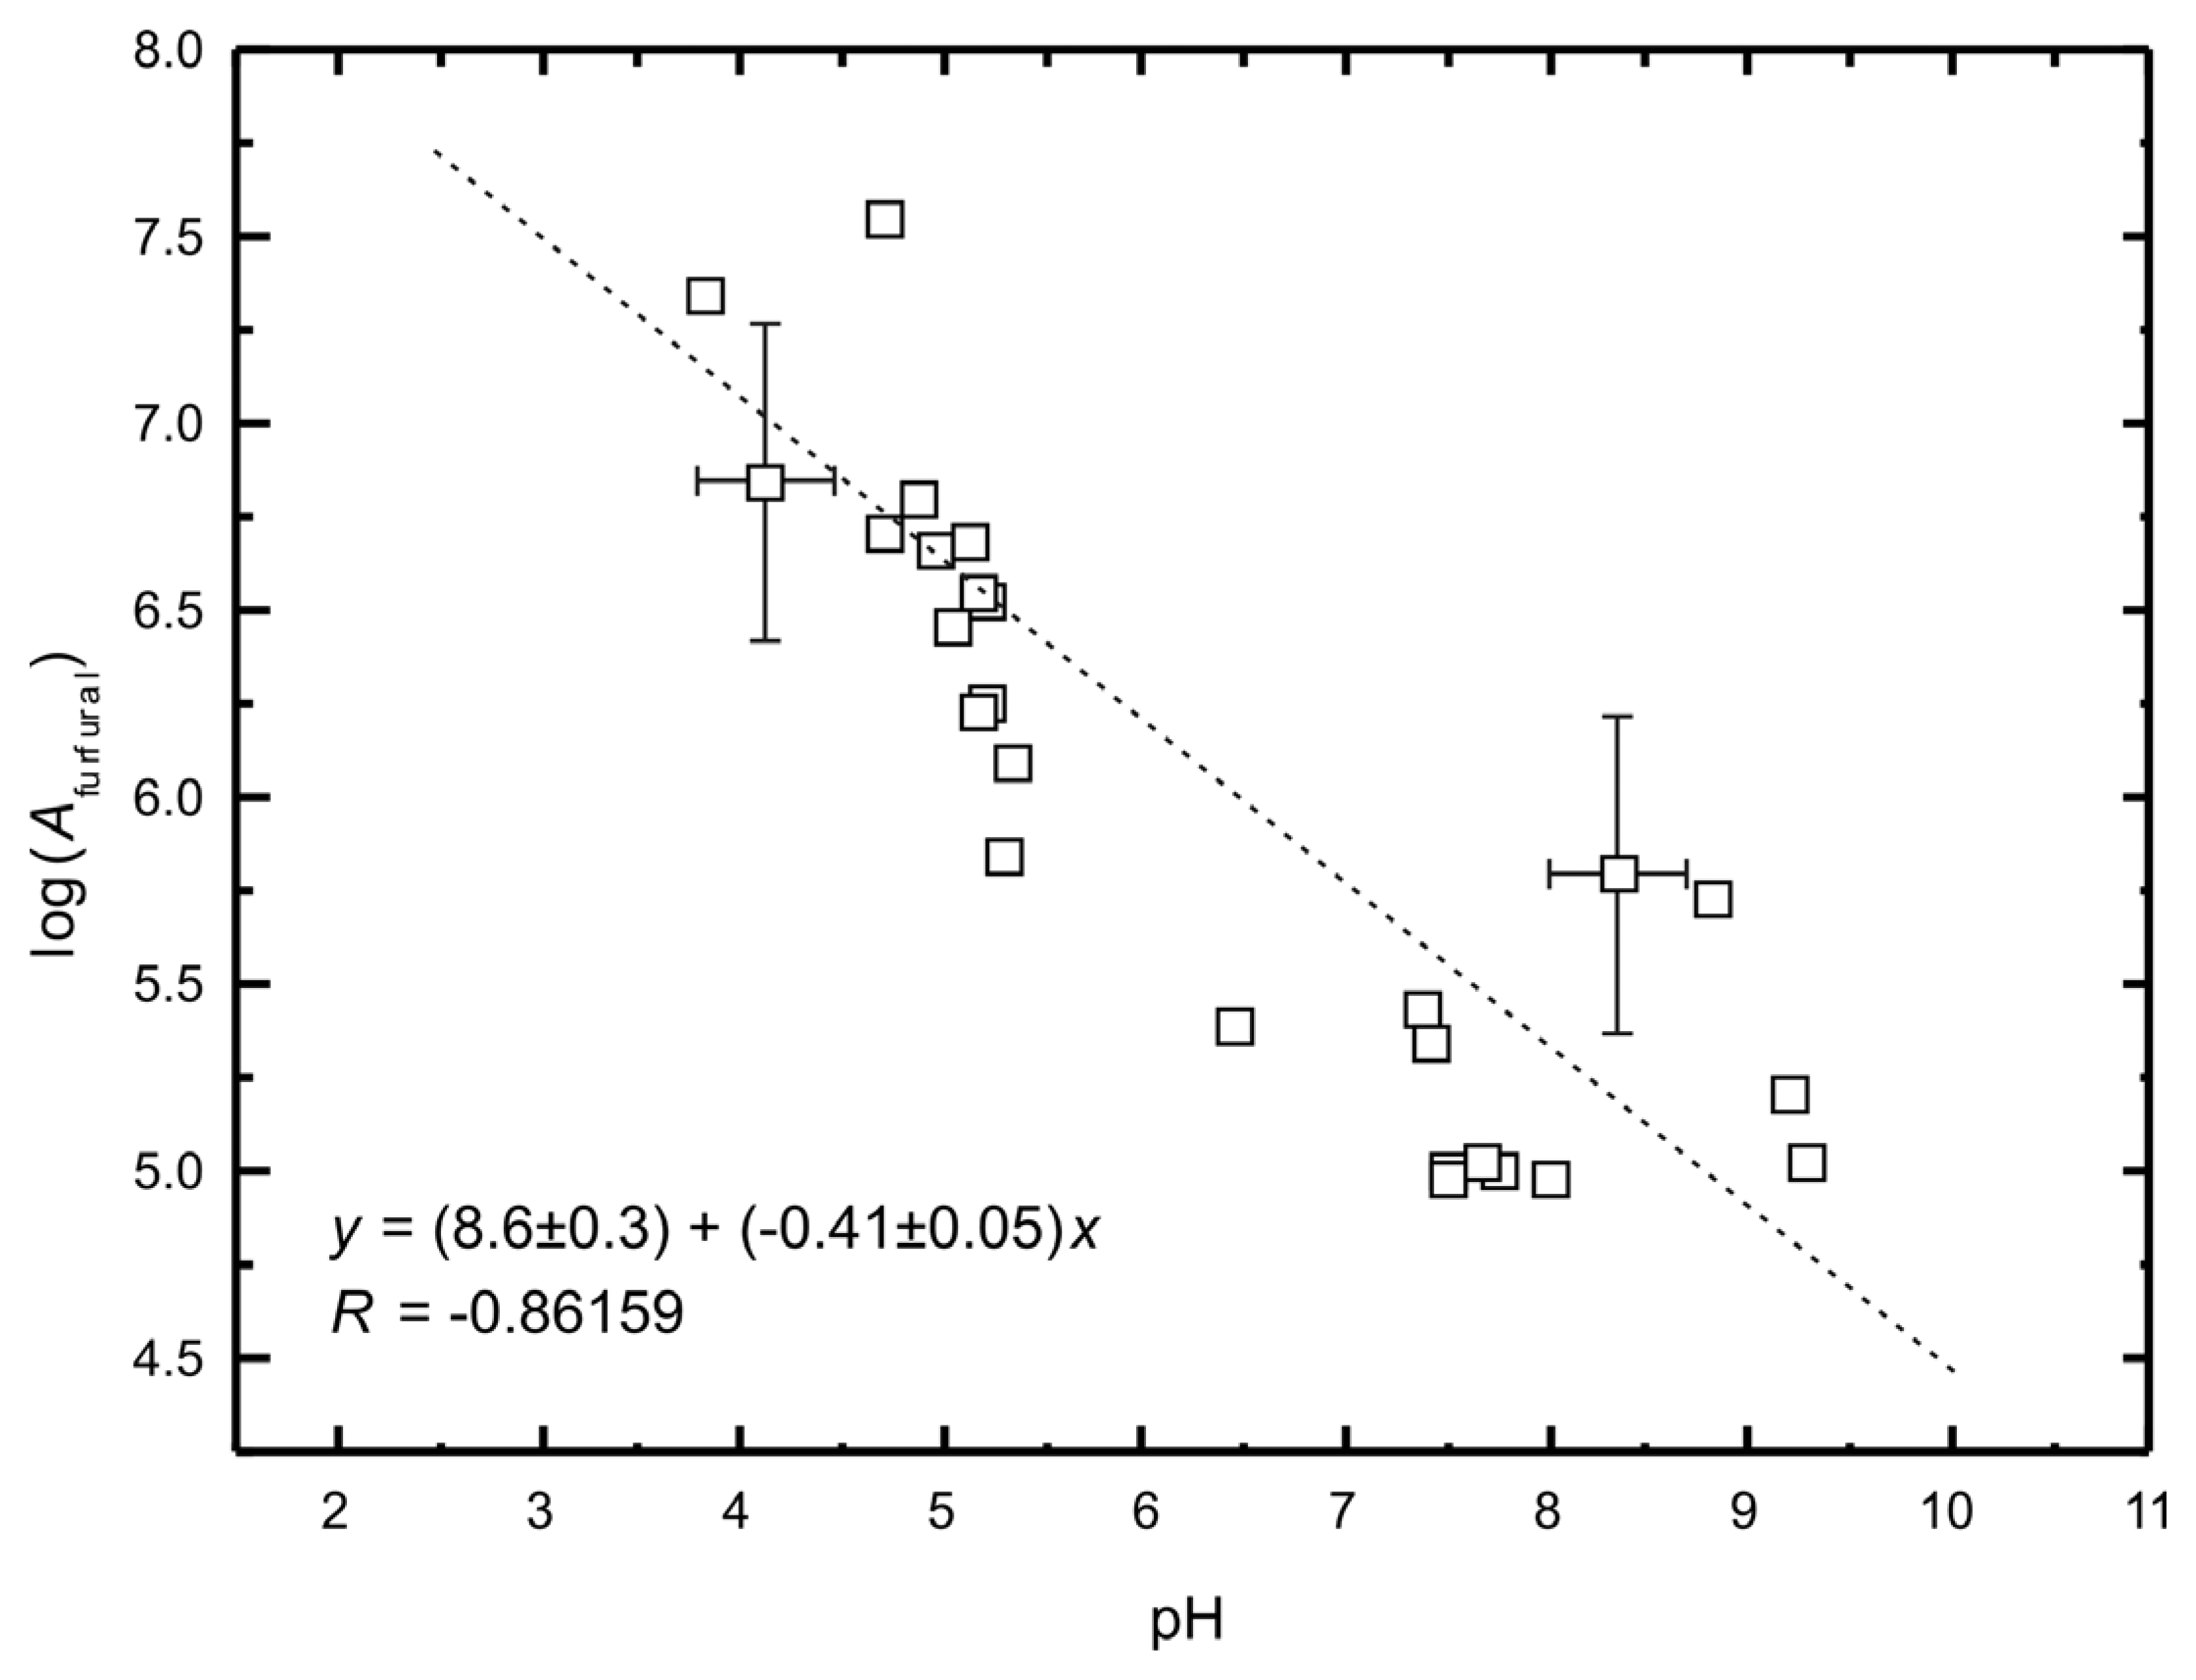
3.2. Contact sampling

Using the contact sampling approach, VOCs are extracted from samples, which underwent natural ageing, i.e. no sample preparation is needed. The sample should be in direct contact with the SPME fibre for 24 h. Since furfural is a relatively non-volatile compound (boiling point 162 °C), it does not readily migrate from paper and it may thus accumulate with time. On the other hand, acetic acid is known to migrate out of paper stacks [10].
The extracted amount of furfural during this procedure was considerably lower than in SHS-SPME, which was reflected in a lower S/N ratio and consequently in a less convincing correlation (Figure 5). The results demonstrate that, given the high uncertainty, this non-destructive approach could be used only for an estimation of pH of historical paper.

4. Conclusions

We developed a non-destructive approach for estimation of pH of historical paper using solid-phase micro-extraction and gas-chromatographic analysis with mass-spectrometric detection. The principle is based on semi-quantitative determination of emissions of furfural from paper during degradation. Furfural production namely depends on the degradation pathway and this in turn depends on sample pH. Two possibilities were explored:
static headspace sampling, which is destructive and requires the sample (∼100 mg) to be heated at 80 °C for 18 h in a glass vial. After this sample preparation procedure, the VOCs are extracted using SPME,
contact sampling, which is a non-destructive procedure and requires the SPME fibre to be inserted into a paper stack for 24 h after which the GC-MS analysis is performed.
Despite the uncertainty in determination using the described method, the approach is advantageous over traditional wet techniques of determination of pH of paper due to its non-destructive character. The innovative approach of using emissions of VOCs from materials as source of information not only on material identity but also on its quality deserves further attention.

Acknowledgments

The authors gratefully acknowledge the financial support of the Slovenian Research Agency, programme no. P1-503, project C8 in the frame of Slovenian-Italian Bilateral Cooperation in Science and Technology and project PaperVOC. Financial support of the Nationaal Archief for the latter project is also gratefully acknowledged. We thank T. Pugelj for technical assistance.

References

  1. Strlič, M.; Kolar, J. (Eds.) Ageing and Stabilisation of Paper; National and University Library: Ljubljana, 2005.
  2. Barański, A.; Konieczna-Molenda, A.; Łagan, J. M.; Proniewicz, L. M. Catastrophic Room Temperature Degradation of Cotton Cellulose. Restaurator 2003, 24, 36–45. [Google Scholar]
  3. Strlič, M.; Kolar, J.; Kočar, D.; Drnovšek, T.; Šelih, V.-S.; Susič, R.; Pihlar, B. What is the pH of Alkaline Paper? e-Preserv. Sci 2004, 1, 35–47. [Google Scholar]
  4. Strlič, M.; Pihlar, B.; Mauko, L.; Kolar, J.; Hočevar, S.; Ogorevc, B. A New Electrode for Micro-Determination of Paper pH. Restaurator 2005, 26, 159–171. [Google Scholar]
  5. Shafizadeh, F. Introduction to Pyrolysis of Biomass. J. Anal. Appl. Pyrolysis 1982, 3, 283–305. [Google Scholar]
  6. Levart, A.; Strlič, M.; Kolar, J.; Pihlar, B.; Veber, M. Determination of Volatile Cellulose Degradation Products by HPLC, IEC and CE Using Cryo-Trap Sampling, Balaton symposium on high-performance separation methods, Siófok, Hungary, Book of abstracts. September 1-3, 1999; p. P-154.
  7. Pawliszyn, J. New Directions in Sample Preparation for Analysis of Organic Compounds. Trends Anal. Chem. 1995, 14, 113–122. [Google Scholar]
  8. Prosen, H.; Zupančič-Kralj, L. Solid-Phase Microextraction. Trends Anal. Chem. 1999, 18, 272–281. [Google Scholar]
  9. Vas, G.; Vékey, K. Solid-Phase Microextraction: a Powerful Sample Preparation Tool Prior to Mass Spectrometric Analysis. J. Mass Spectrom. 2004, 39, 233–254. [Google Scholar]
  10. Lattuati-Derieux, A.; Bonnassies-Termes, S.; Lavédrine, B. Identification of volatile organic comounds emitted by a naturally aged book using solid-phase microextraction/gas chromatography/mass spectrometry. J. Chrom. A 2004, 1026, 9–18. [Google Scholar]
  11. Lattuati-Derieux, A.; Bonnassies-Termes, S.; Lavédrine, B. Characterisation of Compounds Emitted During Natural and Artificial Ageing of a Book. Use of Headspace-Solid-Phase Microextraction/Gas Chromatography/Mass Spectrometry. J. Cult. Herit. 2006, 7, 123–133. [Google Scholar]
  12. Bland, J.M.; Osbrink, W.L.A.; Cornelius, M.L.; Lax, A.R.; Vigo, C.B. Solid-Phase Microextraction for the Detection of Termite Cuticular Hydrocarbons. J. Chromatogr. A 2001, 932, 119–127. [Google Scholar]
  13. Godoi, A.F.L.; Van Vaeck, L.; Van Grieken, R. Use of Solid-Phase Microextraction for the Detection of Acetic Acid by Ion-Trap Gas Chromatography–Mass Spectrometry and Application to Indoor Levels in Museums. J. Chromatogr. A 2005, 1067, 331–336. [Google Scholar]
  14. Wenzl, T.; Lankmayr, E. Reduction of Adsorption Phenomena of Volatile Aldehydes and Aromatic Compounds for Static Headspace Analysis of Cellulose Based Packaging Materials. J. Chromatogr. A 2000, 897, 269–277. [Google Scholar]
  15. Nevell, T. P.; Zeronian, S. H. (Eds.) Cellulose chemistry and its applications; John Wiley: New York, 1985.
  16. Carter, H.; Begin, P.; Grattan, D. Migration of Volatile Compounds Through Stacked Sheet of. Paper During Accelerated Ageing. Restaurator 2000, 21, 77–84. [Google Scholar]
Figure 1. Comparison of chromatographic peak areas for acetic acid and furfural emitted by sample no. 14 in a glass vial at 80 °C in 18 h. Conditions of extraction using SPME fibre: 40 °C, 1 h. The intervals denote standard deviation of triplicate experiments.
Sensors 07 03136f1
Figure 2. Comparison of chromatographic peak areas for acetic acid and furfural emitted by sample no. 14 in a glass vial at different conditions. Conditions of extraction using SPME fibre: 40 °C, 1 h. The intervals denote standard deviation of triplicate experiments.
Sensors 07 03136f2
Figure 3. Comparison of chromatographic peak areas for acetic acid and furfural emitted by cellulosic samples (Whatman filter paper no.1) impregnated with different phosphate buffers after an 18-h annealing period in a glass vial and equilibrium pH of the same samples. Conditions of extraction using SPME fibre: 40 °C, 1 h. Typical relative standard deviation in determination of log(A) was <5%.
Sensors 07 03136f3
Figure 4. Comparison of chromatographic peak areas for furfural emitted by paper samples (Table 1) after an 18-h annealing period in a glass vial and equilibrium pH of the same samples. Conditions of extraction using SPME fibre: 40 °C, 1 h. Error bars represent typical uncertainties.
Sensors 07 03136f4
Figure 5. Comparison of chromatographic peak areas for furfural emitted by paper samples (Table 1) during contact sampling and equilibrium pH of the same samples. Error bars represent typical uncertainties.
Sensors 07 03136f5
Table 1. Samples of paper and pulps. Where available, the source and date are provided.
SampleDescriptionCompositionpH

1Book, 1938100% sulphite softwood pulp4.9
2Book, 190250% groundwood, 50% sulphite softwood pulp5.0
3Book, 187450% groundwood, 50% sulphite softwood pulp4.9
4Book, 195760% groundwood, 40% sulphite softwood pulp5.2
5Book, 194070% groundwood, 30% sulphite softwood pulp5.1
6Book, 198450% bleached hardwood kraft pulp, 50% bleached sulphite softwood pulp5.3
7Book, 196220% bleached hardwood kraft pulp, 80% bleached sulphite softwood pulp7.5
8Book, 187070% cotton pulp, 30% annuals (alkaline wheat straw)4.7
9Book, 192270% groundwood, 30% sulphite pulp4.1
10Book, 200270% bleached hardwood kraft pulp, 30% bleached sulphate softwood pulp.8.8
11Book, 195150% groundwood, 50% sulphite pulp5.2
12Book, 195160% groundwood, 40% sulphite pulp5.3
13Book, 193060% groundwood, 40% sulphite pulp4.7
14Book, 196050% groundwood, 50% sulphite softwood pulp3.8
15Book, 199075% groundwood, 25% bleached sulphite softwood pulp5.1
16Book, 198650% groundwood, 50% kraft pulp (softwood/hardwood = 1/1)5.2
17Newspaper, 200360% groundwood, 40% recycled fibres8.3
18Filter paper Whatman No. 1 (Maidstone, UK), 200190% cotton, 10% bleached softwood pulp6.4
19Bleached softwood sulphate pulp (Pöls, Austria), 20016.8
20Cotton pulp (Radeče, Slovenia), 2001100% cotton8.1
21sample 18, impregnated with Ca(HCO3)28.0
22sample 19, impregnated with Ca(HCO3)28.3
23sample 20, impregnated with Ca(HCO3)28.1
24sample 18, impregnated with Mg(HCO3)29.3
25sample 19, impregnated with Mg(HCO3)29.3
26sample 20, impregnated with Mg(HCO3)29.2

