A H2O2 Biosensor Based on Immobilization of HorseradishPeroxidase in a Gelatine Network Matrix

Key Lab. of Analytical Chemistry for Life Science, Department of Chemistry, Nanjing University, Nanjing 210093, P.R. China
*
Author to whom correspondence should be addressed.
Sensors 2005, 5(4), 277-283; https://doi.org/10.3390/s5040277
Submission received: 8 June 2004
/
Accepted: 14 November 2004
/
Published: 4 May 2005
(This article belongs to the Special Issue Papers presented at I3S2004, Nanjing)
Abstract
:A simple and promising H2O2 biosensor has been developed by successful entrapment of horseradish peroxidase (HRP) in a gelatine matrix which was cross-linked with formaldehyde. The large microscopic surface area and porous morphology of the gelatine matrix lead to high enzyme loading and the enzyme entrapped in this matrix can retain its bioactivity. This biosensor exhibited a fast amperometric response to hydrogen peroxide (H2O2). The linear range for H2O2 determination was from 2.5×10⁻⁵ to 2.5×10⁻³ M, with a detection limit of 2.0×10⁻⁶ M based on S / N = 3. This biosensor possessed very good reproducibility.
Introduction
During the past few decades, numerous investigations have been carried out on electrochemical biosensors, due to the possibility of combining speed, selectivity and sensitivity in a low cost chemical analysis method [1,2,3]. Our target is to construct the simplest possible biosensor which can be used for measurement purposes, consisting of only a thin layer of protein such as an enzyme or antibody. Many materials, such as chitosan [4,5], agar [6], alginate [7], carrageenan [8], Nafion [9], TCAP [10], DDAB [11], Eastman AQ polymer [12], etc. have been used as immobilization matrices, but only a few reports have been cited in the literature concerning the use of gelatine as a matrix.
Gelatine consists of different amounts of 18 amino acids, where glycine, proline and hydroxyproline are the most abundant. It is obtained from cattle skins or bones through an alkaline treatment process [13]. Gelatine was selected here because of its unusual combination of properties, which includes excellent membrane-forming ability, good adhesion, biocompatibility, and nontoxicity. The optimized conditions of the enzyme electrode were studied, and the analytical performance of the biosensor was evaluated.
Different factors can impede direct electron transfer between electrodes and proteins, including the deep burial of the electroactive cofactors in the protein structure, adsorption denaturation of the protein at the electrode surface, and unfavorable orientation of the protein structure. In order to resolve the problem, a series of organic dyes have been used as electrode surface modifiers, such as methylene blue, which is a cationic dye whose electrochemical properties are very well known in the solution phase, and the dye has also been used as a redox indicator since its formal potential, E°, is between 0.08 and –0.25 V (vs. SCE) in the solution with pH between 2 and 8. This redox potential is close to that of most biomolecular redox potentials and a modified carbon electrode based on using this dye as an electron mediator system may be of great interest [14]. In this work, methylene blue was used as mediator.
2. Experimental
2.1. Reagents
Horseradish peroxidase (HRP, BE 1841) was obtained from Sigma Company (USA). Methylene blue (MB, not purified before use) and H2O2 (30% w/v solution) was purchased from Shanghai Chemical Reagent Company respectively. The concentration of the more diluted hydrogen peroxide solutions prepared was determined by titration with cerium (IV) to a ferroin endpoint. All other reagents were of analytical grade. All the solutions were prepared with doubly distilled water.
2.2. Apparatus and measurements
All electrochemical experiments were carried out in a three-electrode cell controlled by CHI 660 Electrochemical workstation (CH Instruments, USA). An electrode with gelatine and HRP was used as the working electrode. Reference and counter electrodes were a saturated calomel reference electrode (SCE) and platinum wire, respectively.
2.3. Preparation of biosensor
Gelatine solution (1%) was prepared by dissolving gelatine flakes in hot doubly distilled water. Gold working electrodes (0.5 mm diameter) were polished successively with 1.0, 0.3, and 0.05 μm alumina powder on chamois leather, and rinsed thoroughly with doubly distilled water between each polishing step. Next, the polished electrode was sonicated in acetone and doubly distilled water and the allowed to dry at room temperature. HRP (0.2 mg) was dissolved in gelatine solution (1%, 0.5 mL) and then formaldehyde solution (10 μL) was added into the enzyme solution. The mixture was hand-mixed completely. The gold electrode was coated with a 10 μL drop of the resulting mixture, and then was left for at least 24 h at 4°C. HRP was thus entrapped in the gelatine crosslinked membrane. Then the biosensor was immersed into 0.1 mmol/L MB solution. During this process the dye was incorporated into the gelatine matrix. The electrode was then rinsed with doubly distilled water and immersed into the blank PBS solution to remove the non-firmly adsorbed dye molecules until a steady electrochemical response was achieved. The enzyme biosensor was stored at 4°C in a refrigerator when not in use.
3. Results and Discussion
3.1. Electrochemical studies
3.1.1. Electrochemical Characteristics of the Coimmobilization of HRP in Gelatine Membrance Modified Au Electrode
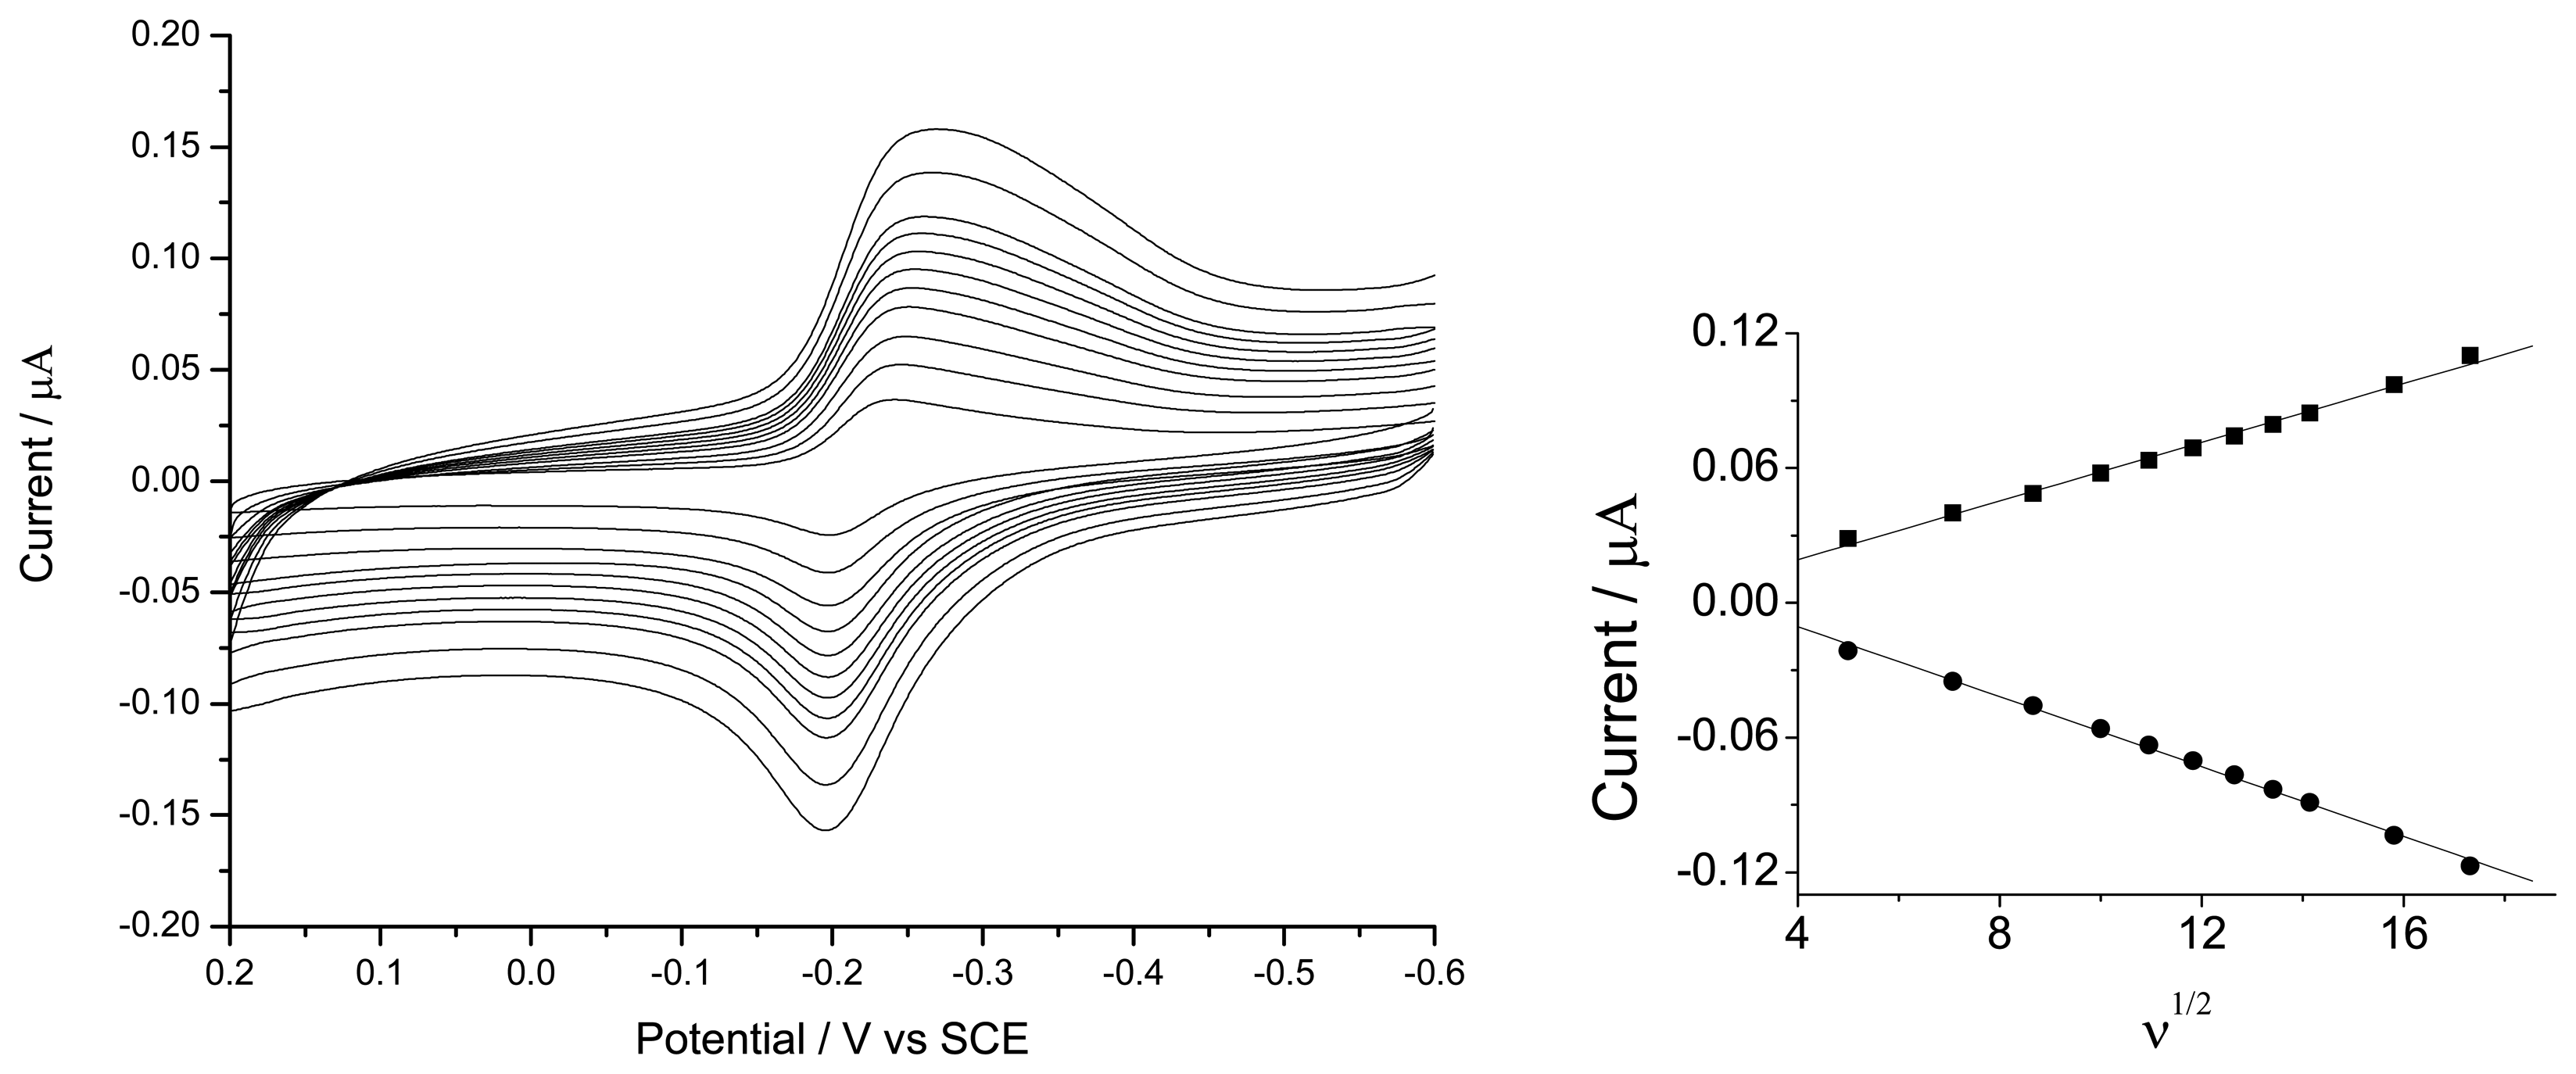
Typical cyclic voltammograms of MB/HRP in 0.1 M phosphate buffer solution (pH 7.0) at different scan rates are shown in Figure 1. It is clear that the potentials of the anodic peak and the cathodic peak hardly change with the scan rate, υ, i.e., the peak potential is independent of the scan rate in the range between 25 and 300 mV s-1. Both the anodic peak current and the cathodic peak current are proportional to υ1/2 at the above scan rate range, suggesting that the electrode reaction is a diffusion-controlled process [15].
3.1.2. Electrochemical Response to Hydrogen Peroxide
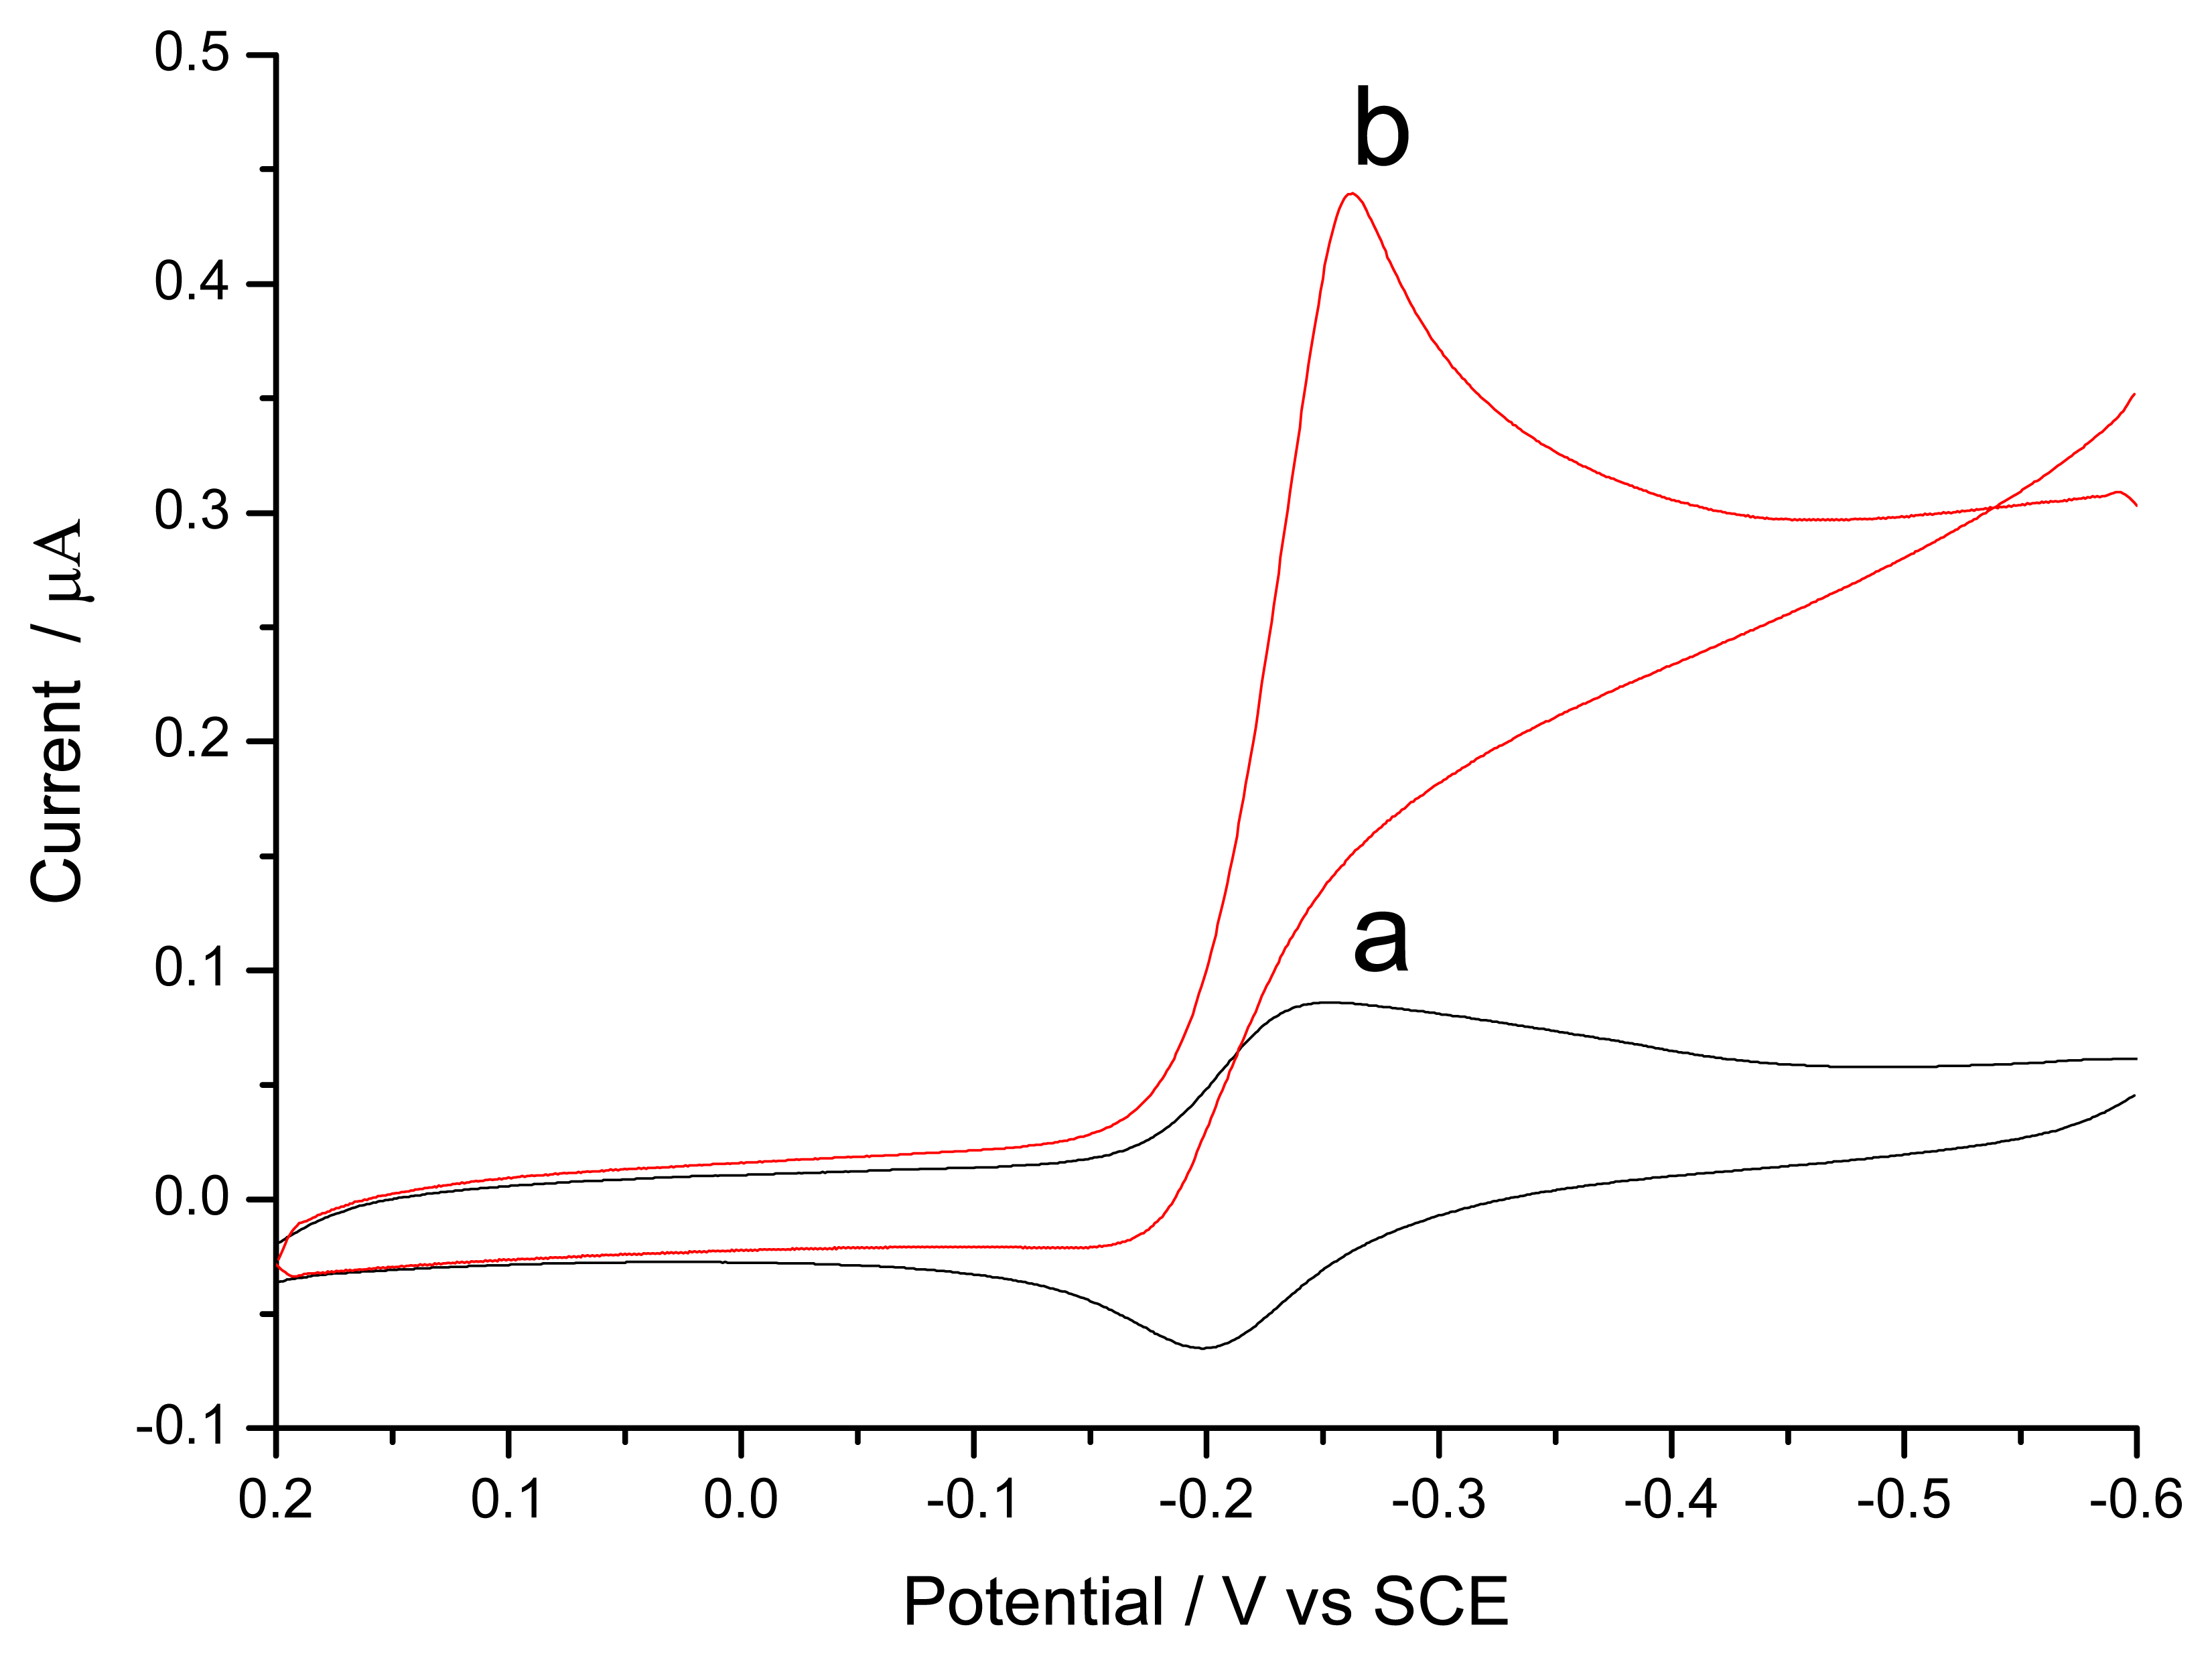
Figure 2 shows the cyclic voltammetric behavior of the enzyme electrode. In blank phosphate buffer, the enzyme electrode only gives the electrochemical behavior of methylene blue. There is a pair of quasi-reversible anodic and cathodic waves. When 2.5 mM H2O2 was added into the solution, cathodic peak current increased significantly. With an increase of reduction peak current, the oxidation peak current decreased. It was observed that a small peak-potential shifted toward negative direction with the increase of H2O2 concentration. The reaction mechanism of the sensor was summarized as follows [2].
The HRP reduces hydrogen peroxide to water,
HRP can be regenerated by using a mediator through two separate one-electron steps,
The MB can then be recycled at the electrode as the mediator leading to an increase of its reduction current, which indicated that methylene blue incorporated in this matrix could effectively shuttle electrons between the Au electrode and the bioactive center of HRP in the membrane.
3.1.3. Optimization of Hydrogen Peroxide Monitoring
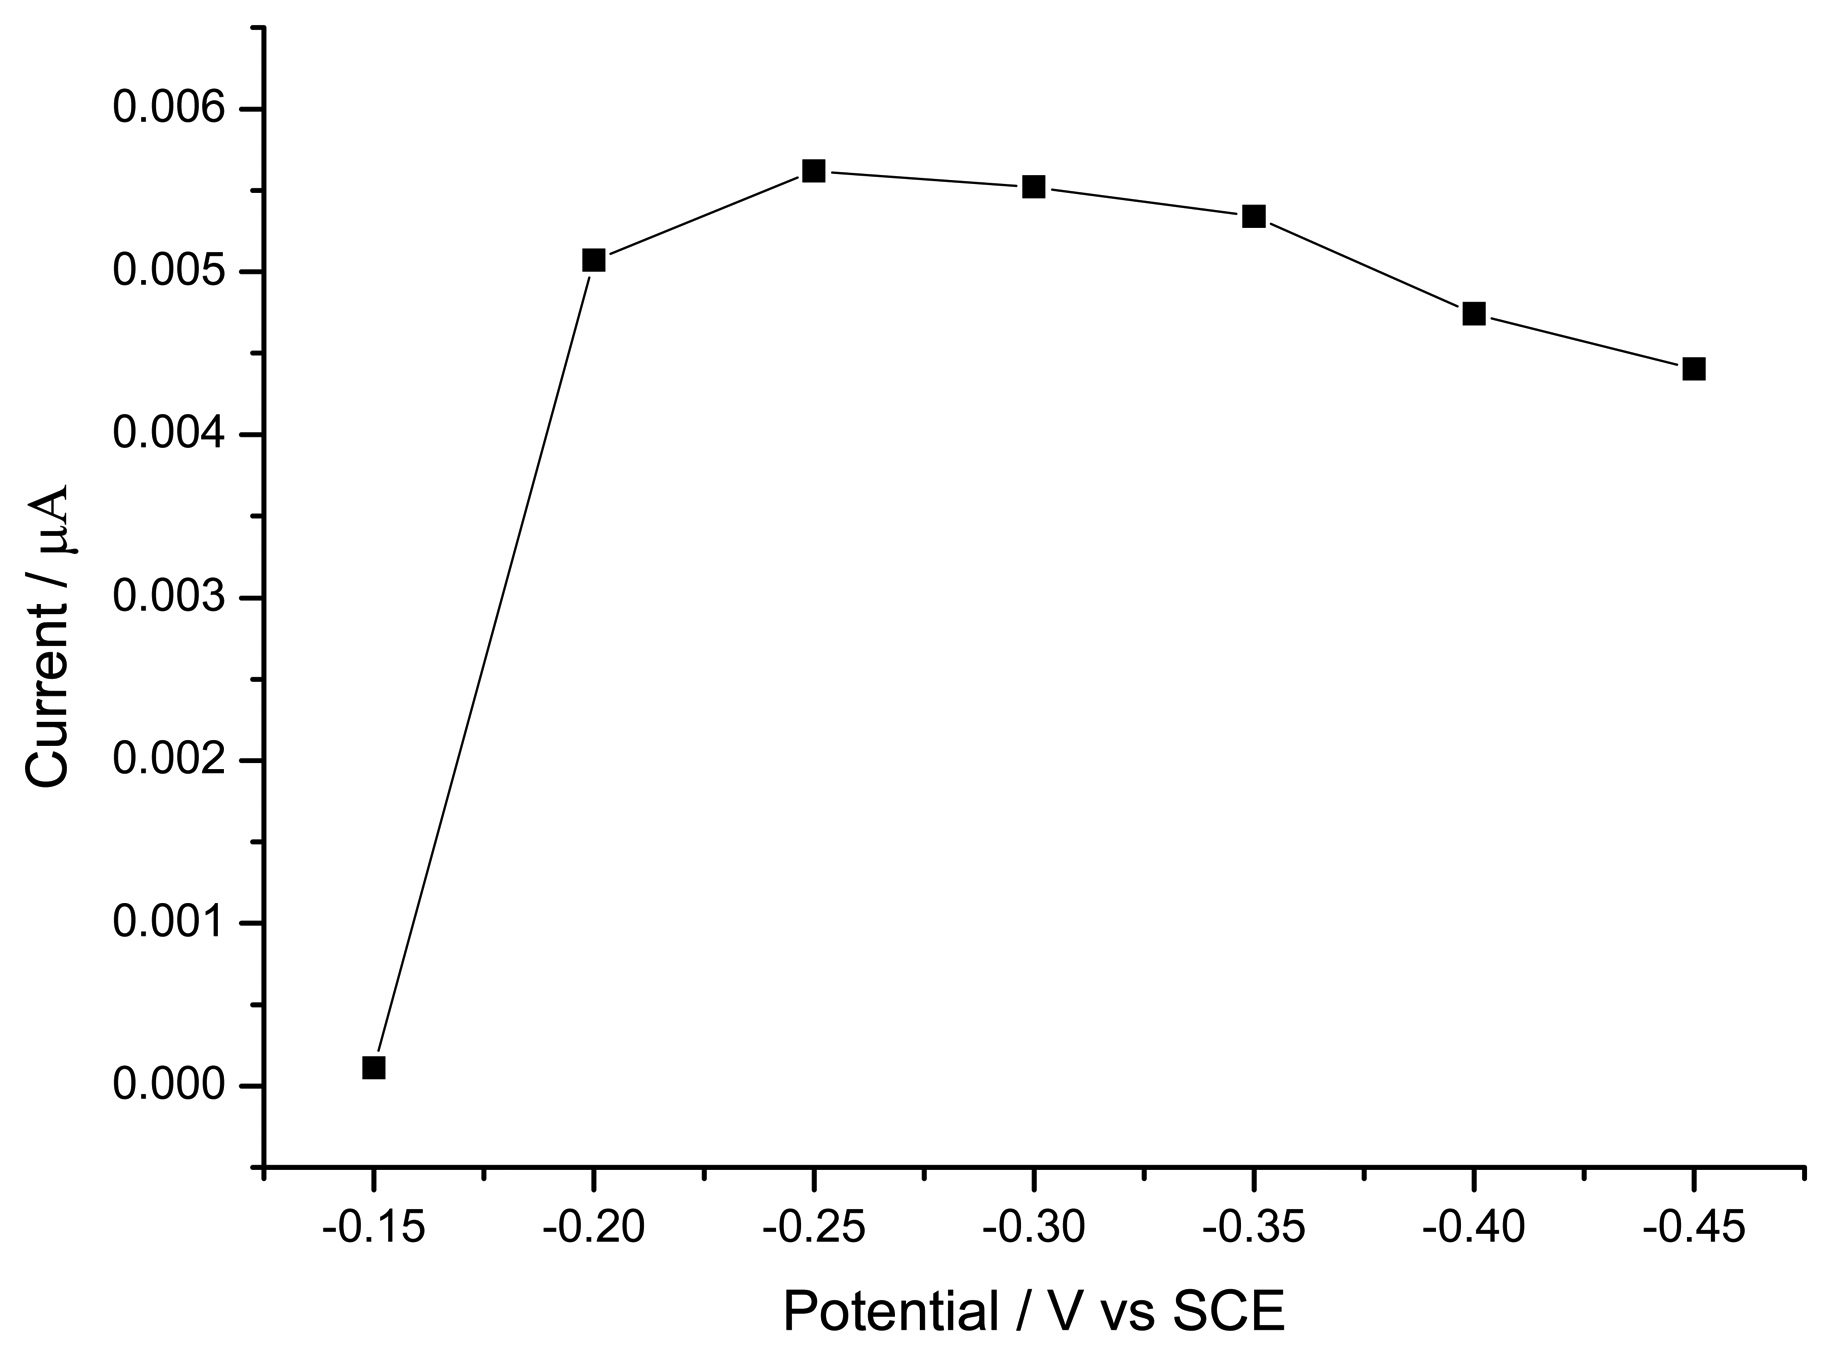
In order to determine the optimal working potential for the H2O2 sensing, a plot of chronoamperometric current vs. working potential was made as shown in Figure 3. One may observe in Figure 3 that the steady-state current changed with an increase of applied potential from –0.15 to –0.5 V, and when the potential reached –0.25 V, the electroreduction of H2O2 reached a plateau. Hence, the potential of –0.25V was selected as optimized monitoring potential.
The effect of pH on the enzyme electrode response was also investigated in the pH range 4.5∼9.0 in the presence of 0.05 mM H2O2 at working potential –0.25 V (Figure 4). It could be observed that the current response of the electrode was suitable in the pH range 7.5-9, however, it dropped quickly from pH 7.0 to 4.5. Therefore, pH 7.0 phosphate buffer solution was selected in the experiments, this value is the optimum active spot for soluble peroxidase [16].
3.1.4. Steady-State Amperometric Response to Hydrogen Peroxide
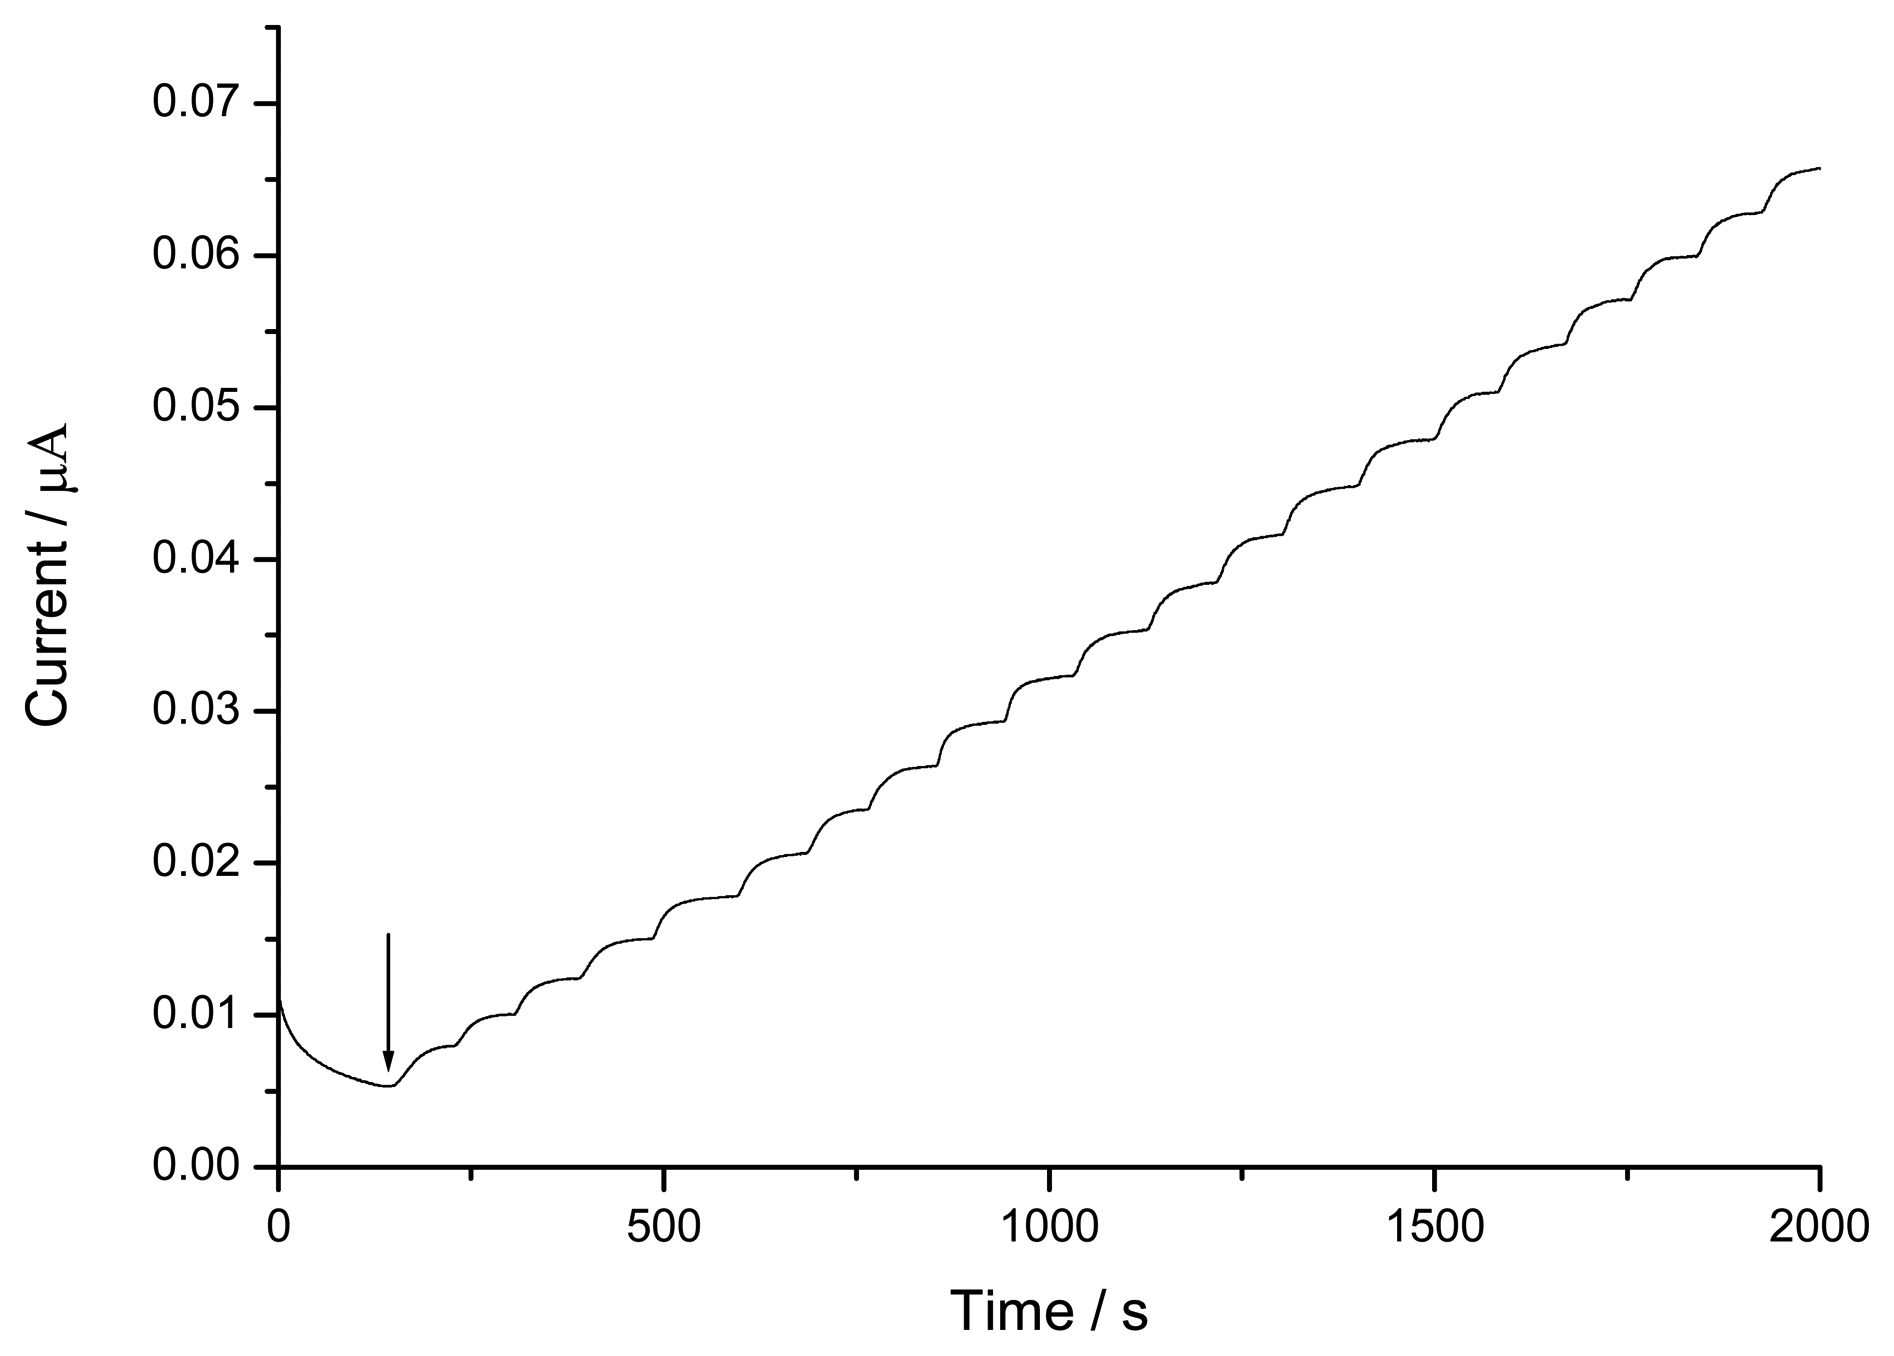
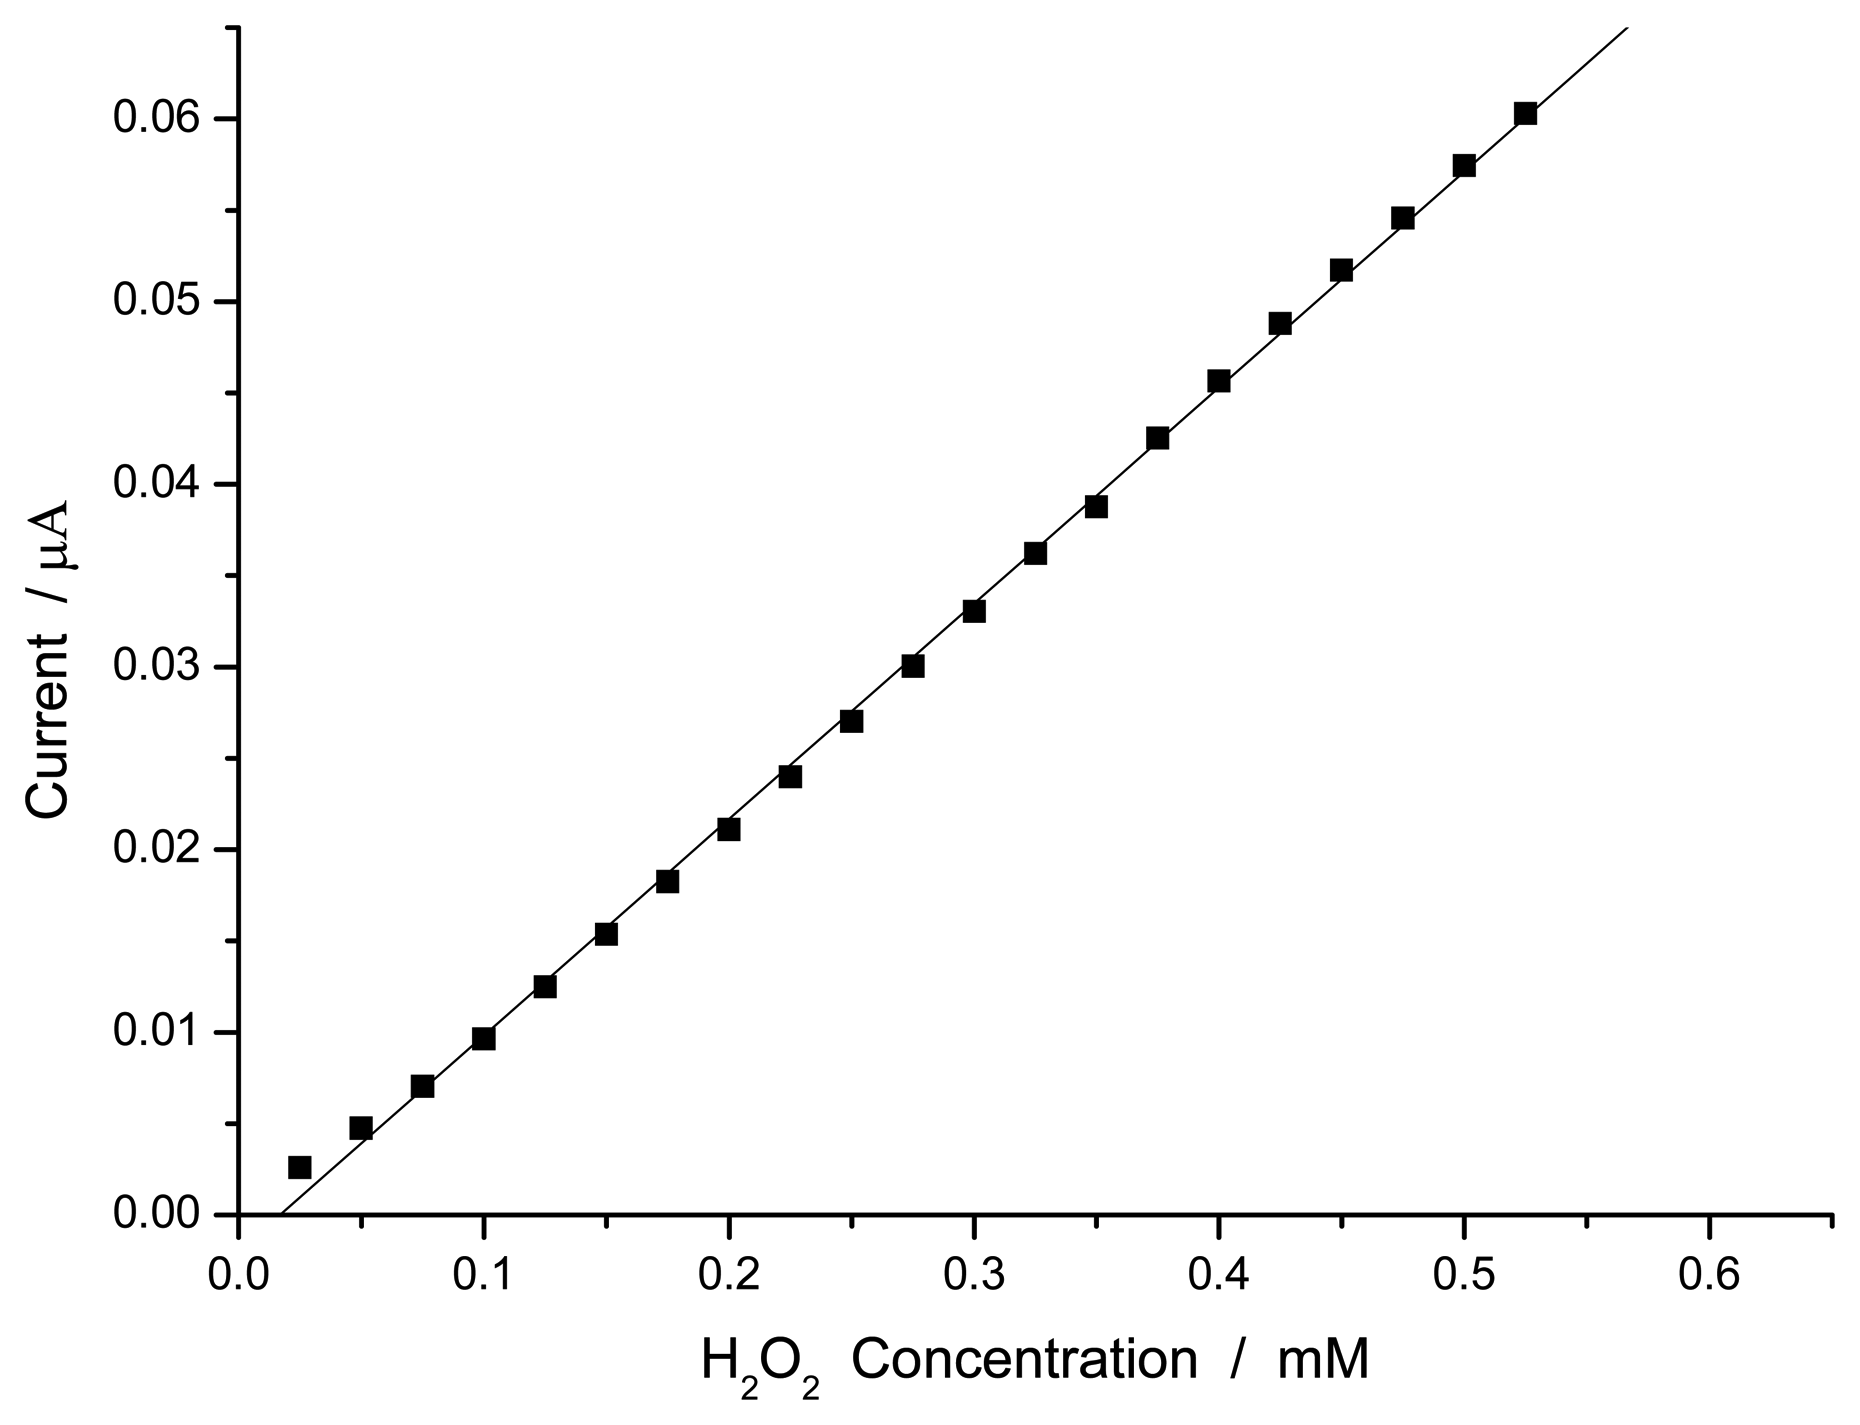
Figure 5 displays the dynamic response of the electrode under the optimal experimental conditions with successive injections of H2O2 to the phosphate buffer solution under stirring. The trace clearly demonstrates the fast response and high sensitivity of the electrode to H2O2. The response to H2O2 is linear in the range from 2.5×10⁻⁵ to 2.5×10⁻³ M (Figure 6). The detection limit was 2.0×10⁻⁶ M when the signal to noise ratio is 3.
Conclusions
In this paper, horseradish peroxidase was successfully entrapped in gelatine to make a H2O2 sensor. The good biocompatibility of gelatine can make the HRP retain its native state in the films and show good electrocatalytic activity. Cyclic voltammetry and chronamperometric measurements have been used to illustrate the feasibility of MB in gelatine matrix as an electron transfer mediator between immobilized HRP and a gold electrode. This biosensor exhibited a fast amperometric response to H2O2. Work to exploit other enzyme electrodes using the new immobilization material is in progress.
Acknowledgments
This work was supported by the National Natural Science Foundation of China (Grant No. 20325516) and the Foundation of State Key Laboratory of Electroanalytical Chemistry from Changchun Institute of Applied Chemistry.
References
- Amalvy, J.I.; Percy, M.J.; Armes, S.P. Langmuir 2001, 17, 4770.
- Aoki, K.; Kaneko, H. J. Electroanal. Chem. 1988, 247, 17.
- Arvand, M.; Sohrabnezhad, S.; Mousavi, M.F.; Shamsipur, M.; Zanjanchi, M.A. Anal. Chim. Acta 2003, 491, 193.
- Miao, Y.; Tan, S.N. Analyst 2000, 125, 1591.
- Zhou, G.; Wang, G.; Xu, J.; Chen, H. Sensor & Actuators B 2002, 81, 334.
- Jouenne, T.; Tresse, O.; Junter, G.A. FEMS Microbiol. Lett. 1994, 119, 237.
- Martinsen, A.; Storro, I.; Skjak-Brack, G. Biotechnol. Bioeng. 1992, 39, 186.
- Tziboula, A.; Horne, D.S. Colloids Surface B 1999, 12, 299.
- John, S.A.; Ramaraj, R. J. Electroanal. Chem. 2004, 561, 119.
- Kong, Y.T.; Boopathi, M.; Shim, Y.B. Biosens. Bioelectron. 2003, 19, 227.
- Tang, J.L.; Wang, B.Q.; Wu, Z.Y.; Han, X.J.; Dong, S.J.; Wang, E.K. Biosens. Bioelectron. 2003, 18, 867.
- Chen, X.; Zhang, J.; Wang, B.; Cheng, G.; Dong, S. Anal. Chim. Acta 2001, 434, 255.
- Segtnan, V.H.; Kvaal, K.; Rukke, E.O.; Schüller, R.B.; Isaksson, T. Food Hydrocolloid 2003, 17, 585.
- Dias, S.L.P.; Fujiwara, S.T.; Gushikem, Y.; Bruns, R.E. J. Electroanal. Chem. 2002, 531, 141.
- Zaitseva, G.; Gushike, Y.; Ribeiro, E.S.; Rosatto, S.S. Electrochim. Acta 2002, 47, 1469.
- Maehly, A.C. Plant peroxidases: Methods in Enzymology; Vol. 11, Academic Press: New York, 1995; p. p.807. [Google Scholar]
Figure 1.
Typical cyclic voltammograms of MB-HRP/gelatine and the plot of the wave current at different scan rates (from inner to outer): 25, 50, 75, 100, 120, 140, 160, 180, 200, 250, 300 mV/s.
Figure 1.
Typical cyclic voltammograms of MB-HRP/gelatine and the plot of the wave current at different scan rates (from inner to outer): 25, 50, 75, 100, 120, 140, 160, 180, 200, 250, 300 mV/s.

Figure 2.
Cyclic voltammograms of the H2O2 sensor in the absence of H2O2 (a), and in the presence of 2.5 mM H2O2 (b) at a scan rate of 100 mV/s in pH 7.0 PBS.
Figure 2.
Cyclic voltammograms of the H2O2 sensor in the absence of H2O2 (a), and in the presence of 2.5 mM H2O2 (b) at a scan rate of 100 mV/s in pH 7.0 PBS.

Figure 3.
Effect of working potential on the response of the biosensor. Experimental conditions: 0.05 mM H2O2 in pH 7.0 PBS
Figure 3.
Effect of working potential on the response of the biosensor. Experimental conditions: 0.05 mM H2O2 in pH 7.0 PBS

Figure 4.
Effect of the pH on the response of the biosensor to 0.025 mM H2O2 in PBS at the working potential of –0.25 V.
Figure 4.
Effect of the pH on the response of the biosensor to 0.025 mM H2O2 in PBS at the working potential of –0.25 V.
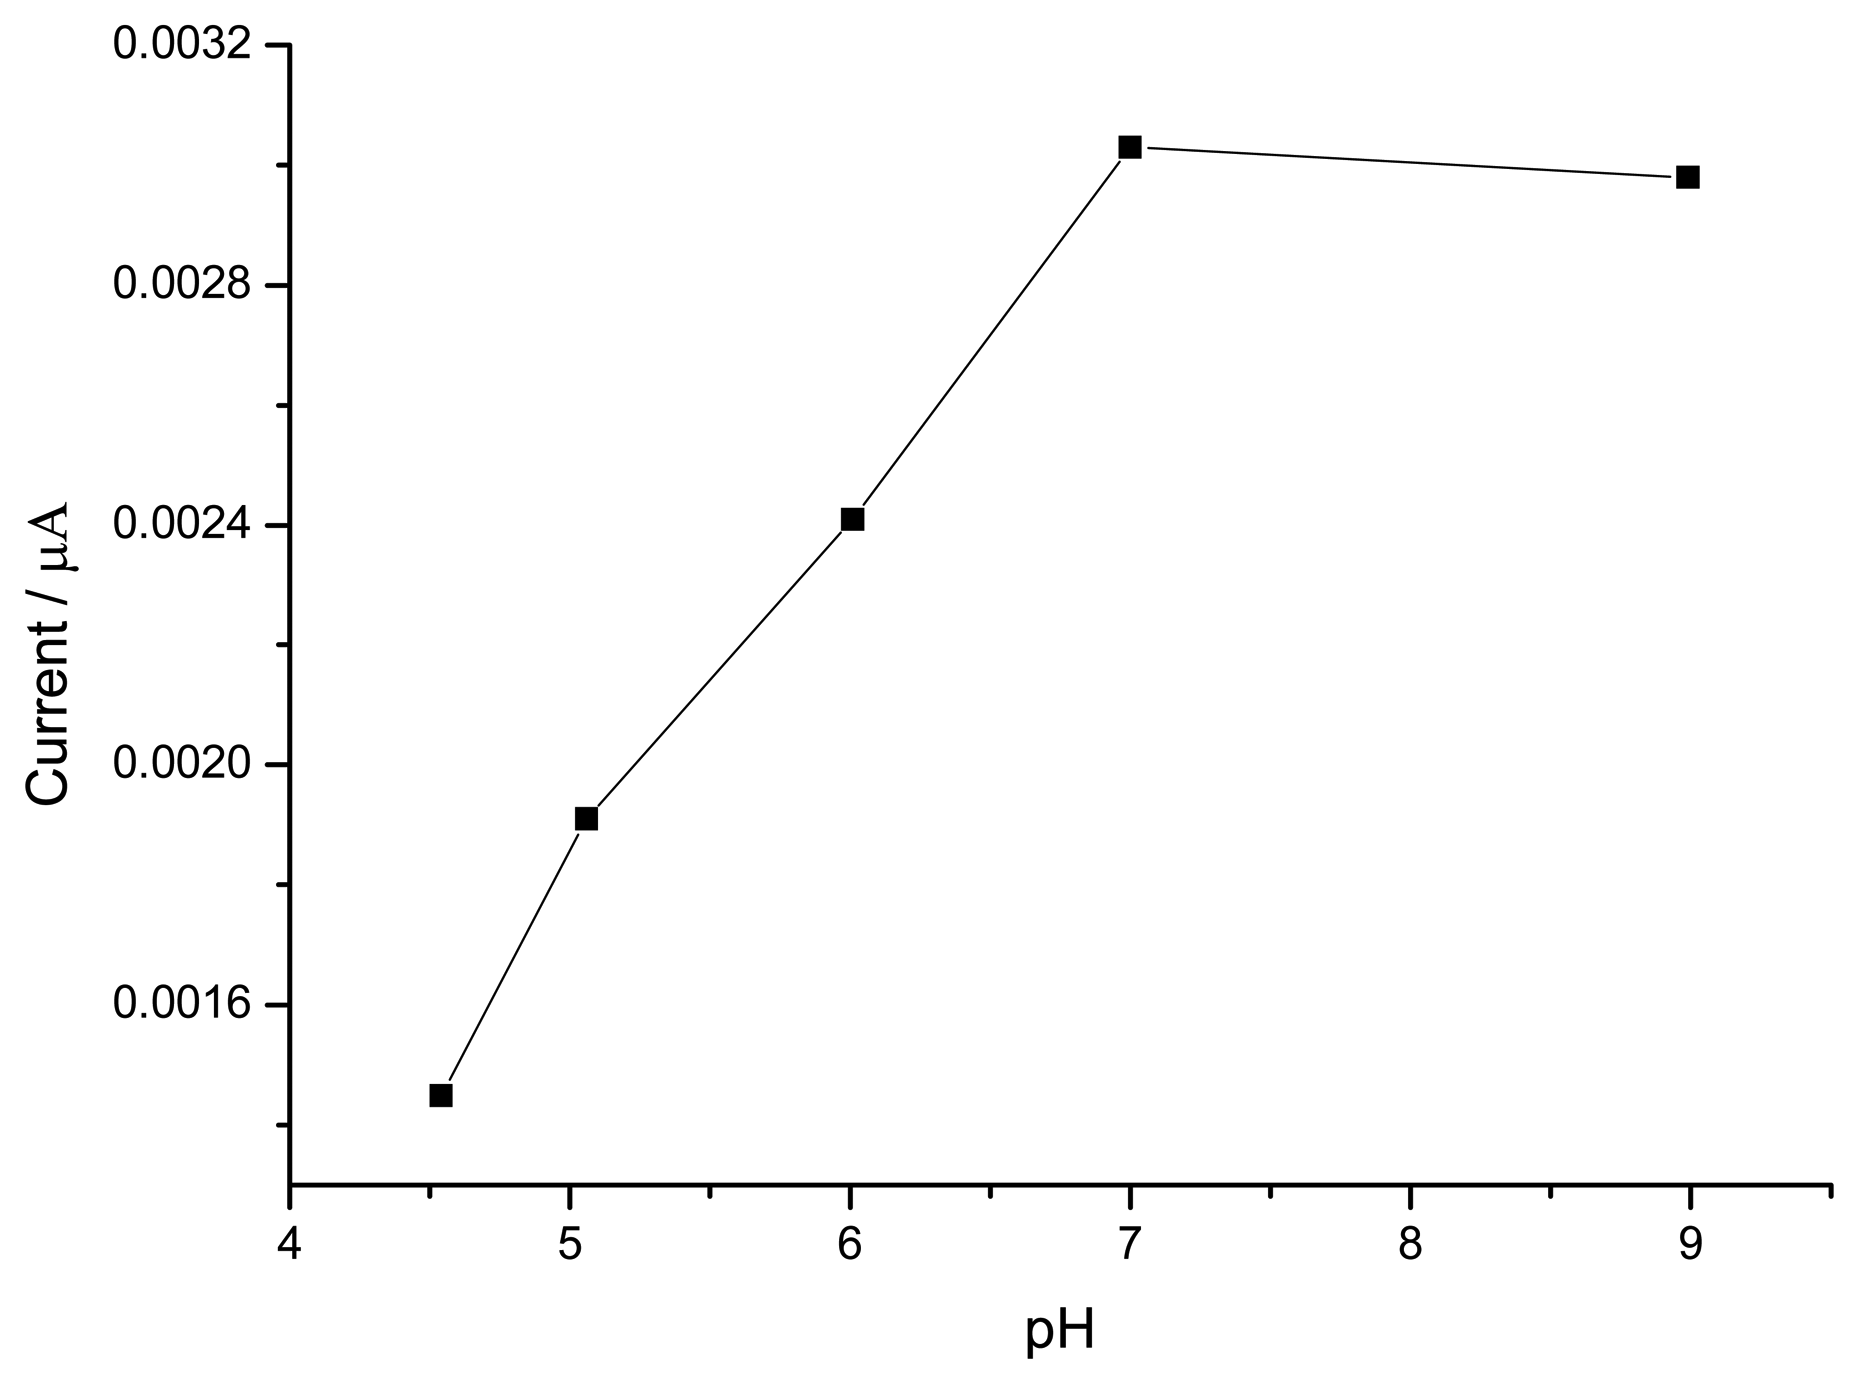
Figure 5.
Dynamic response of the H2O2 sensor to successive addition of 0.025 mM H2O2 steps in the solution at the applied potential of –0.25 V.
Figure 5.
Dynamic response of the H2O2 sensor to successive addition of 0.025 mM H2O2 steps in the solution at the applied potential of –0.25 V.
Figure 6.
Calibration plot between current and H2O2 concentration.

© 2005 by MDPI ( http://www.mdpi.org). Reproduction is permitted for noncommercial purposes.
Share and Cite
MDPI and ACS Style
Yao, H.; Li, N.; Wei, Y.-L.; Zhu, J.-J. A H2O2 Biosensor Based on Immobilization of HorseradishPeroxidase in a Gelatine Network Matrix. Sensors 2005, 5, 277-283. https://doi.org/10.3390/s5040277
AMA Style
Yao H, Li N, Wei Y-L, Zhu J-J. A H2O2 Biosensor Based on Immobilization of HorseradishPeroxidase in a Gelatine Network Matrix. Sensors. 2005; 5(4):277-283. https://doi.org/10.3390/s5040277
Chicago/Turabian StyleYao, Hui, Nan Li, Yan-Li Wei, and Jun-Jie Zhu. 2005. "A H2O2 Biosensor Based on Immobilization of HorseradishPeroxidase in a Gelatine Network Matrix" Sensors 5, no. 4: 277-283. https://doi.org/10.3390/s5040277