Brain Tissue Oxygen: In Vivo Monitoring with Carbon Paste Electrodes

Department of Pharmacology, Conway Institute of Biomolecular & Biomedical Research, University College Dublin, Belfield, Dublin 4, Ireland
*
Author to whom correspondence should be addressed.
Sensors 2005, 5(11), 473-487; https://doi.org/10.3390/s5110473
Submission received: 28 April 2005
/
Accepted: 1 July 2005
/
Published: 16 November 2005
(This article belongs to the Special Issue Carbon Paste Electrodes)
Abstract
:In this communication we review selected experiments involving the use of carbon paste electrodes (CPEs) to monitor and measure brain tissue O2 levels in awake freely-moving animals. Simultaneous measurements of rCBF were performed using the H2 clearance technique. Voltammetric techniques used include both differential pulse (O2) and constant potential amperometry (rCBF). Mild hypoxia and hyperoxia produced rapid changes (decrease and increase respectively) in the in vivo O2 signal. Neuronal activation (tail pinch and stimulated grooming) produced similar increases in both O2and rCBF indicating that CPE O2currents provide an index of increases in rCBF when such increases exceed O2 utilization. Saline injection produced a transient increase in the O2 signal while chloral hydrate produced slower more long-lasting changes that accompanied the behavioral changes associated with anaesthesia. Acetazolamide increased O2 levels through an increase in rCBF.
Introduction
Molecular O2 was one of the first substances detected voltammetrically in vivo, both in brain [1,2] and peripheral tissues [3], using noble metal and carbon electrodes that continue to be the electrode materials of choice for this analyte [4-7]. Brain tissue O2 is one of the most important substrate for energy metabolism delivered by the blood and responds to a range of perturbations including electrical stimulation [8] and neuromediator release [9], with more rapid turnover in cerebral cortex compared with other brain areas [10]. The tissue concentration is determined by the balance between supply and utilization and the anatomical distribution of concentrations reported within the brain is wide, depending on the depth of penetration of the sensor into the tissue [11] and the heterogeneity of the tissue [12,13]. The spread of mean concentrations reported ranges from 40 μM [12], through 50 μM [10] and 60 μM [14], to 80 μM [8,15].
The majority of such measurements have generally been obtained amperometrically using constant potential amperometry (CPA) at a noble metal microelectrode where the measured current is taken to be proportional to the dissolved O2 [16]. The use of carbon-based electrodes as cathodes for O2 reduction, instead of the more commonly used Pt, has recently been reported by several groups [17-20]. Carbon electrodes have the advantage that they are less prone to surface poisoning and as such do not require the use of protecting membranes which are a characteristic of metal-based O2 electrodes, including the most commonly used Clark electrode. Carbon electrodes are also more stable and in the case of carbon paste electodes (CPEs) have been found to be stable over several months in vivo [21]. Recently, a new method for the measurement of dissolved O2 in vivo involving Nafion™-modified carbon fibre disk electrodes (CFEs) and fast cyclic voltammetry has been reported by Wightman's group [18,20,22]. As a fast-scan technique this method also has advantages associated with subsecond time resolution. However, because of the small dimensions of CFEs (typically 10 μm) the concentration of O2 observed varies depending on the orientation of the electrode relative to the blood vessels and metabolically active sites. Since the dimension (typically 125-μm active internal diameter) of CPEs is greater than the scale of a capillary zone (< 100 μm) [23], an average tissue O2 level should be detected, thus offering a practical advantage over the use of CFEs for O2 measurements. In this communication we present a review of selected experiments involving the use of CPEs to successfully monitor and measure brain tissue O2 levels in awake freely-moving animals.
Experimental
Reagents
The acetazolamide (Diamox) and chloral hydrate were obtained from Sigma Chemical Co. (Dorset, UK) and BDH Laboratory Supplies (Poole, UK) respectively. Solutions of normal saline (0.5 mL, 0.9% NaCl), chloral hydrate (350 mg/kg), and Diamox (50 mg/kg) were administered intraperitoneally (i.p.). All solutions were prepared using doubly distilled deionised water.
Working Electrode Preparation
CPEs were made from 5T (125-μm bare diameter, 160-μm coated diameter) Teflon-coated silver wire (Advent Research Materials, Suffolk, UK). The Teflon insulation was slid along the wire to create an approximately 2-mm deep cavity which was packed with carbon paste using a bare silver wire as plunger. Carbon paste was prepared by thoroughly mixing 2.83 g of carbon powder (UCP-1-M, Ultra Carbon Corp., Bay City, MI, USA) and 1.0 mL of silicone oil (Aldrich, Catalogue No. 17,563-3) [24]. The H2 detection electrodes for rCBF measurements (see Voltammetric Techniques) were made from 2T (50-μm bare diameter, 75-μm coated diameter) Teflon-coated Pt/Ir wire as reported previously [25]. All electrodes were soldered to gold connectors, which were cemented into a six-pin plastic socket (both from Plastics One, Roanoke, VA, USA).
Voltammetric Techniques
Changes in O2 at CPEs were monitored using differential pulse amperometry (DPA). For DPA O2 reduction, two equally sized cathodic pulses were applied, the first from a resting potential at -150 mV to -350 mV that corresponds to the foot of the reduction wave for O2 at lipid-modified CPEs, and the second from -350 mV to -550 mV that corresponds to the peak of the reduction wave. The difference in the current (ΔI) sampled during these respective pulse pairs was calculated, and changes in ΔI used as a measure of changes in O2 that have been shown to be interference free [19]. Because the CPE DPA signal has a significant capacitance (background) current (mean value: -244.8 ± 59.7 nA, n = 23) [26] changes in the signal cannot be calculated as a percentage [25].
The CPEs were calibrated for O2 in vitro after removal from the brain because implantation affects the sensitivity of these paste electrodes [27,28]. All in vitro experiments were carried out in a standard three-electrode glass electrochemical cell (capacity 25 mL) in phosphate buffered saline (PBS) solution (20 mL), pH 7.4 (150 mM NaCl, 40 mM NaH2PO4 and 40 mM NaOH). A saturated calomel electrode (SCE) was used as the reference electrode, and a large silver wire, isolated in a compartment containing PBS, served as the auxiliary electrode. Calibrations were performed in N2-purged, air-saturated and O2-saturated solutions where the concentrations of solution O2 were taken as 0, 200 [29,30] and 1,250 μM [29], respectively.
Measurements of rCBF were performed using the H2 clearance technique. CPA, where the detecting electrode is held at a constant potential sufficient to detect the oxidation or reduction of the target substance, was performed by holding the CPE at the peak potential for H2 oxidation (+250 mV). The methods of H2 administration and analysis used in these experiments have been described in detail in a previous publication [25].
Surgical Procedures
Male Sprague-Dawley rats weighing 200-300 g were anaesthetized, following published guidelines [31], with a mixture of Hypnorm (Fentanyl citrate/Fluanisone, Janssen Pharmaceuticals Ltd., Oxford, UK), Hypnovel (Midazolam, Roche Products Ltd., Herts, UK), and sterile water, mixed 1:1:2 and injected i.p. at a volume of 3.3 mL/kg, as described previously [32,33]. Once surgical anesthesia was established animals were placed in a stereotaxic frame and the electrodes implanted following a previously described procedure [32]. Animals were implanted with either one of two combinations of sensors: (i) carbon paste electrodes, for monitoring tissue O2, one in the right and one in the left striatum (coordinates with the skull leveled between bregma and lambda, were: A/P +1.0 from bregma, M/L ±2.5, and D/V -5.0 from dura [32]; (ii) a 2T Pt/Ir electrode, for monitoring rCBF by the H2 clearance method, was implanted in the right striatum (coordinates: A/P +1.0 from bregma, M/L +2.5, and D/V -8.5 from dura), and a carbon paste electrode, for monitoring tissue O2, in the left striatum (coordinates: A/P +1.0 from bregma, M/L -2.5, and D/V -5.0 from dura). A reference electrode (8T Ag wire, 200-μm bare diameter; Advent Research Materials) was placed in the cortex, an auxiliary electrode (8T Ag wire) placed between the skull and dura, and an earth wire (8T Ag wire) attached to one of the support screws. The reference potential provided by the Ag wire in brain tissue is very similar to that of the SCE [27]. The electrodes and probe were fixed to the skull with dental screws and dental acrylate (Associated Dental Products Ltd., Swindon, UK). Surgery typically lasted 40 min and anesthesia was reversed by an i.p. injection of naloxone (0.1 mg/kg, Sigma Chemical Co.). Post-operative analgesia was provided in the form of a single injection (0.1 mg/kg, s.c.) of Vetergesic (Buprenorphine hydrochloride, Reckitt and Colman Pharmaceuticals, Hull, UK) given immediately following the surgery. Animals were allowed to recover after surgery and were assessed for good health according to published guidelines [34] immediately after recovery from anesthesia and at the beginning of each day. This work was carried out under license in accordance with the Animals (Scientific Procedures) Act, 1986.
Experimental Conditions
Rats were housed in large plastic bowls (diameter ca. 50 cm), in a windowless room under a 12 h light, 12 h dark cycle, lights coming on at 8 a.m., with free access to water. Food was available ad libitum. All experiments were carried out with the animal in its home bowl. Implanted electrodes were connected to the potentiostat at least 60 min prior to the start of each experiment, through a six-pin Teflon socket, and a flexible screened six core cable which was mounted through a swivel above the rat's head (Semat Technical Ltd.). This arrangement allowed free movement of the animal. Once the background currents for the various sensors had stabilized (typically 5-10 min for the O2 CPEs, and 30 min for the rCBF Pt/Ir electrodes) experiments were begun. All signals were recorded at 2-s intervals (see Instrumentation and Software).
Mild hypoxia and hyperoxia were produced by the administration of O2/air and N2/air mixtures; plastic tubing, connected to the respective gas cylinder (British Oxygen Co. (BOC), Guildford, UK) was held ca. 2-3 cm from the animal's snout for 3-min periods. A flow rate of ca. 150 mL/min was used. This procedure resulted in the inhalation of an air/gas mixture.
Instrumentation and Software
A low-noise potentiostat (Biostat II, Electrochemical and Medical Systems, Newbury, UK) was used in all experiments. For CPA experiments, either a Macintosh IIx computer or a Mitac 486 PC was used with data acquisition performed using National Instruments (NI, National Instruments Corp., Austin, TX, USA) multifunction data acquisition boards: NB-MIO-16X (Macintosh) and AT-MIO-16 (PC). Further noise reduction was achieved by averaging 75 (Mac) and 100 (PC) determinations to give 1 data point every 2 s. For DPA experiments, all data acquisition was performed on a Mitac 486 PC with data sampling performed at a rate of 250 determinations/pulse and averaged to give 1 data point/pulse [19]. A complete pulse sequence was performed every 2 s. All experiments were performed using in house developed software: PC (LabWindows, NI version 2.1); Macintosh (LabVIEW, NI version 2.2.1). All analysis was performed using both in house developed software and the commercial package Prism (version 4.03, GraphPad Software Inc., CA, USA).
The significance of differences observed was estimated using the Student's t-test for paired observations (StatView, Abacus Concepts, Inc., CA, USA). Two-tailed levels of significance were used and p < 0.05 was considered to be significant. All data are presented as mean ± S.E.M.
Results and Discussion
Hypoxia and Hyperoxia
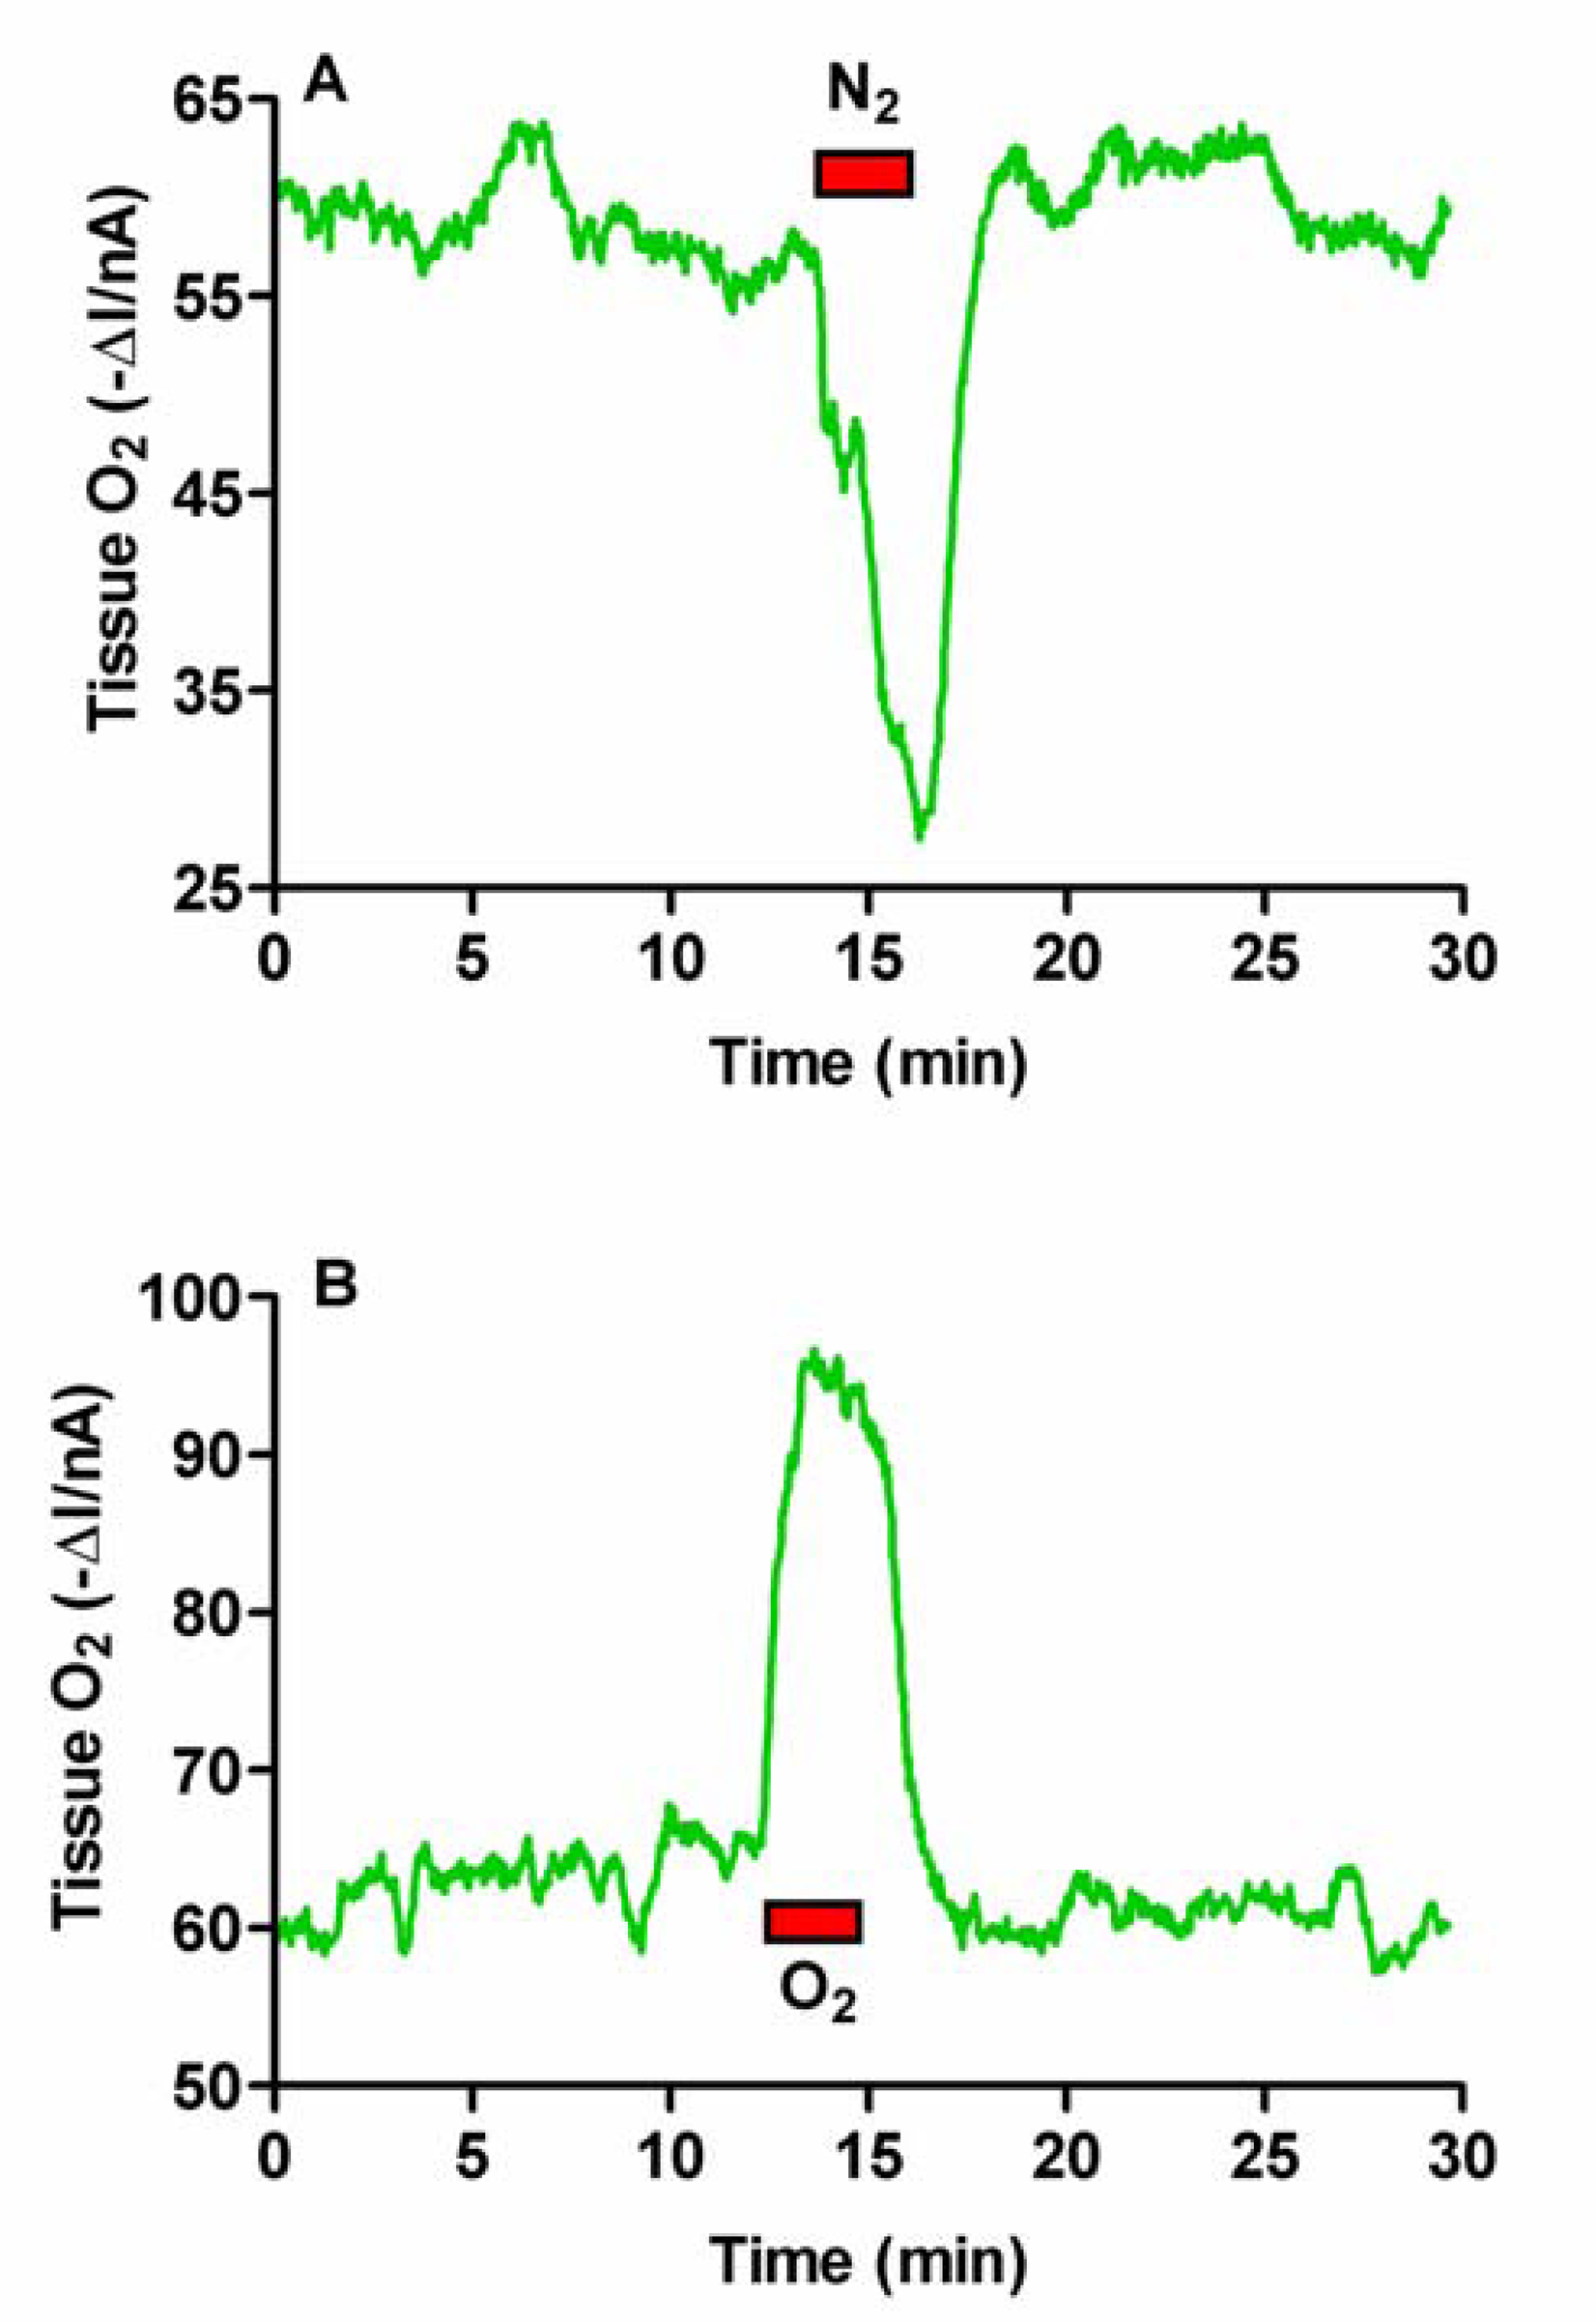
We have previously used mild hypoxia and hyperoxia to study brain extracellular glucose metabolism in vivo [35]. Both these conditions are ideally suited to investigating and verifying the response of CPEs to changes in brain tissue O2 in vivo. A 3-min period of hypoxia caused a decrease in the O2 current (ΔI) of 27.6 ± 2.8 nA, while a 3-min period of hyperoxia caused an increase in the O2 current (ΔI) of 27.2 ± 4.2 nA, corresponding to mean percentage changes of 57 ± 5% and 43 ± 6% respectively (n = 4, see Figure 1A and 1B). Changes in both cases were immediate and on cessation of inhalation the signals quickly returned to baseline levels indicating a rapid return to normoxic conditions. These results confirmed that CPEs implanted in freely-moving animals respond rapidly to changes in cerebral tissue O2 concentrations.
Neuronal Activation
Two forms of physiologically stimulated neuronal activation were used; these were tail pinch and induced grooming. In the first, a paper clip was attached ca. 3 cm from the tip of the rat's tail for 5 min; this produces a well characterised behaviour pattern which consists of gnawing, licking, eating and a general increase in the level of motor activity [36]. In the second, water was dropped from a plastic dropper onto the rat's head until the animal engaged in a period (usually between 5 to 10 min) of active grooming.
The application of a 5 min tail pinch resulted in an immediate and rapid increase in the O2 current (ΔI) recorded at the CPEs by 10.8 ± 1.9 nA from a mean baseline of -200 ± 24 nA (p < 0.001, eight tail pinches in two rats). On removal of the stimulus the current immediately began to fall and returned to baseline within ca. 10 min. The rCBF, calculated from the H2 clearance at the Pt/Ir electrodes, also showed an immediate increase from a basal value of 89 ± 8 mL (100 g)-1 min-1 to a maximum of 158 ± 13 mL (100 g)-1 min-1 (p < 0.001), and returned to prestimulus levels ca. 16 min after the end of the stimulus. These basal and stimulated flow values are in good agreement with previous estimations made in awake animals: basal, 93 mL (100 g)-1 min-1 [37] and 105 mL (100 g)-1 min-1 [38]; stimulated, 160 mL (100 g)-1 min-1 [37]. A typical example of the effects of a 5 min tail pinch on both O2 and blood flow is shown in Figure 2.
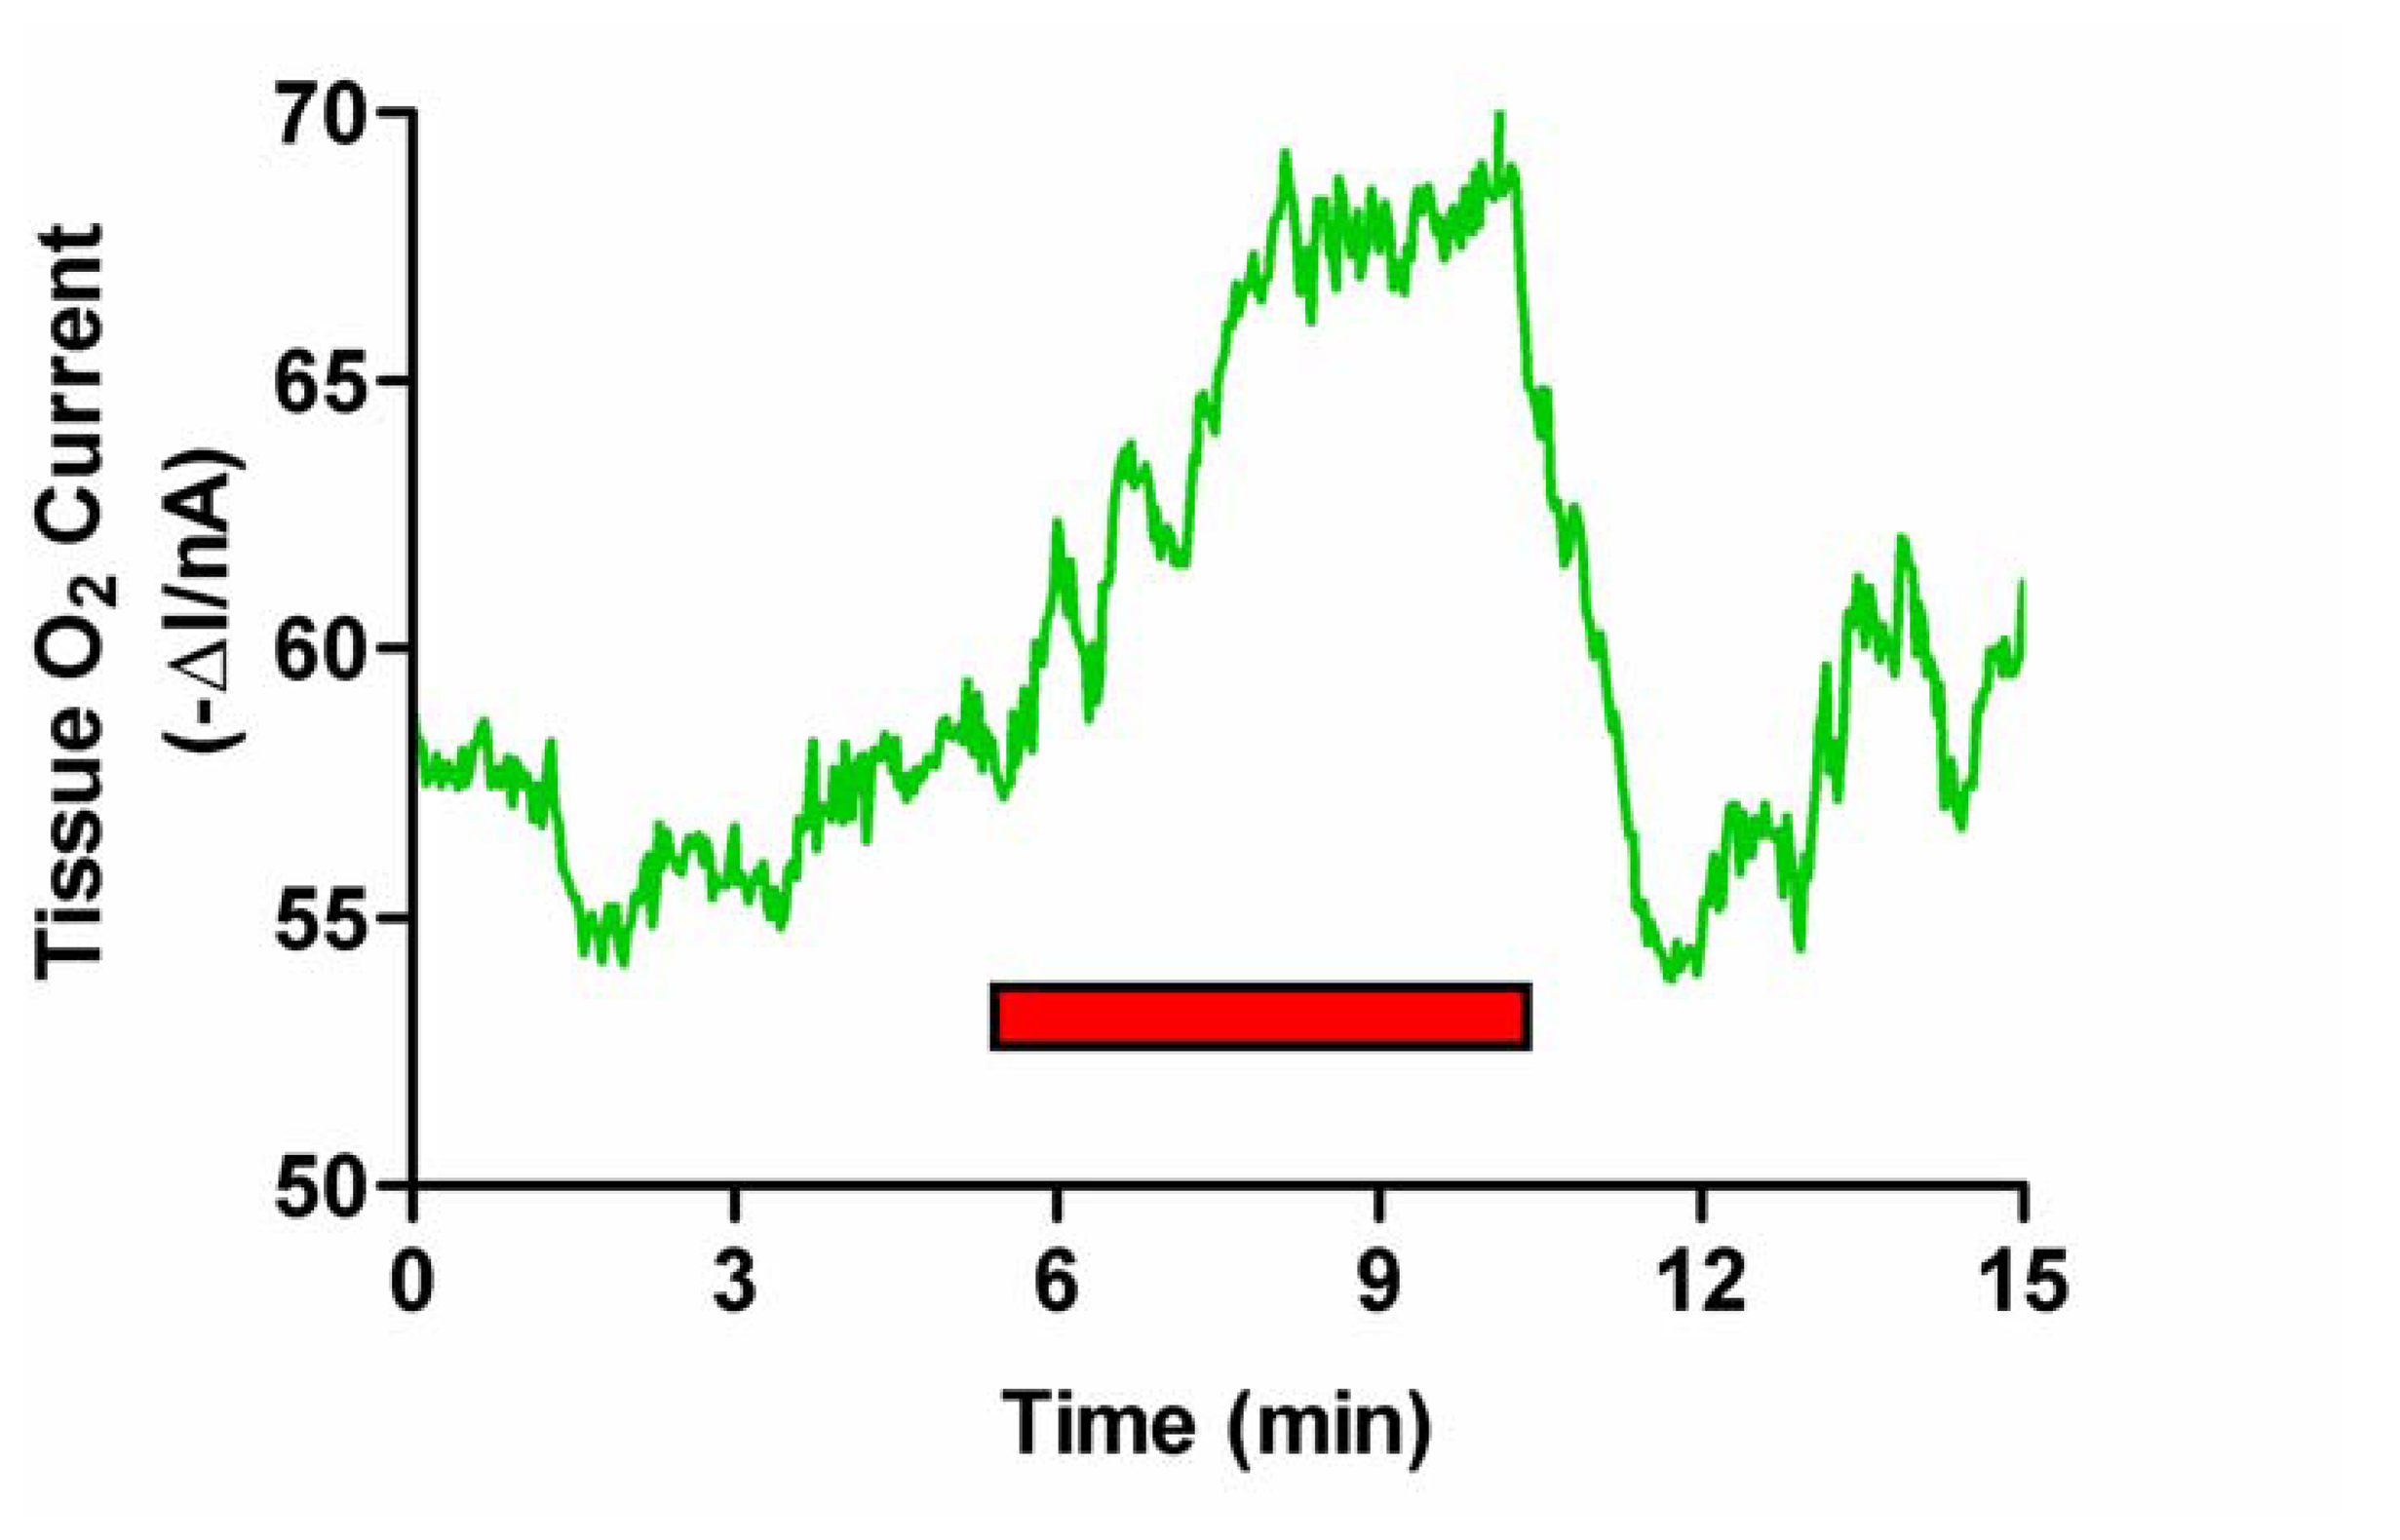
As observed with tail pinch, stimulated grooming (see Figure 3) resulted in an immediate increase in striatal O2 levels by 6.2 ± 1.1 nA from a mean baseline of -160 ± 10 nA (p < 0.001, eight measurements in two rats). The signal rapidly returned to baseline (typically within 5 min) when the animal stopped grooming. Values for rCBF rose from a mean basal level of 81 ± 7 mL (100 g)-1 min-1 to a maximum of 112 ± 10 mL (100 g)-1 min-1 (p < 0.001). On cessation of activity values also returned to basal levels (data not shown) [25].
The mean percentage increase in rCBF in response to tail pinch was 83 ± 13%, similar to the value of 98 ± 16% previously reported for tail pinch by Fellows and Boutelle [37]. The maximum percentage increase during induced grooming was 37 ± 4%. Whereas absolute rCBF can be calculated from the H2 clearance values, the DPA reduction current at the CPE includes a large background signal typical of implanted CPEs. This is due to increased surface wetability resulting from removal of the insulating silicone oil by lipids, which constitute approximately 40% of the dry mass of brain tissue [19,39]. However, using in vitro calibrations (see Voltammetric Techniques) the increases in O2 for tail pinch and grooming were converted to concentrations: 44 ± 8 μmol/L (tail pinch) and 25 ± 4 μmol/L (grooming). The O2 concentration in the extracellular fluid (ECF) is a dynamic balance between supply of O2 via blood flow in capillaries and O2 consumption associated with metabolism in cells. The range measured with implanted microelectrodes is from 5 to 50 μmol/L [18,40]. Assuming a maximum ECF concentration of 50 μmol/L the above concentrations represent mean percentage increases of 88 ± 15% and 50 ± 9% for tail pinch and grooming respectively. Although O2 utilization increases during stimulated neuronal activity, the present results confirm previous findings that the rise in rCBF exceeds the increase in O2 utilization resulting in a net increase in O2 [22,41,42]. For this reason O2 currents provide an index of increases in rCBF only when such increases exceed O2 utilization [25].
Saline Injection and Chloral Hydrate Anaesthesia
Chloral hydrate is a commonly used non-volatile anaesthetic agent for animal surgery. It causes general CNS depression by rapidly metabolizing into trichloroethanol and trichloroacetic acid [43]. Trichloroethanol is suspected to be the active substance for inducing anaesthesia [44] because, similar to barbiturates, it has the ability to prolong chloride influx induced by exogenous GABA [45].
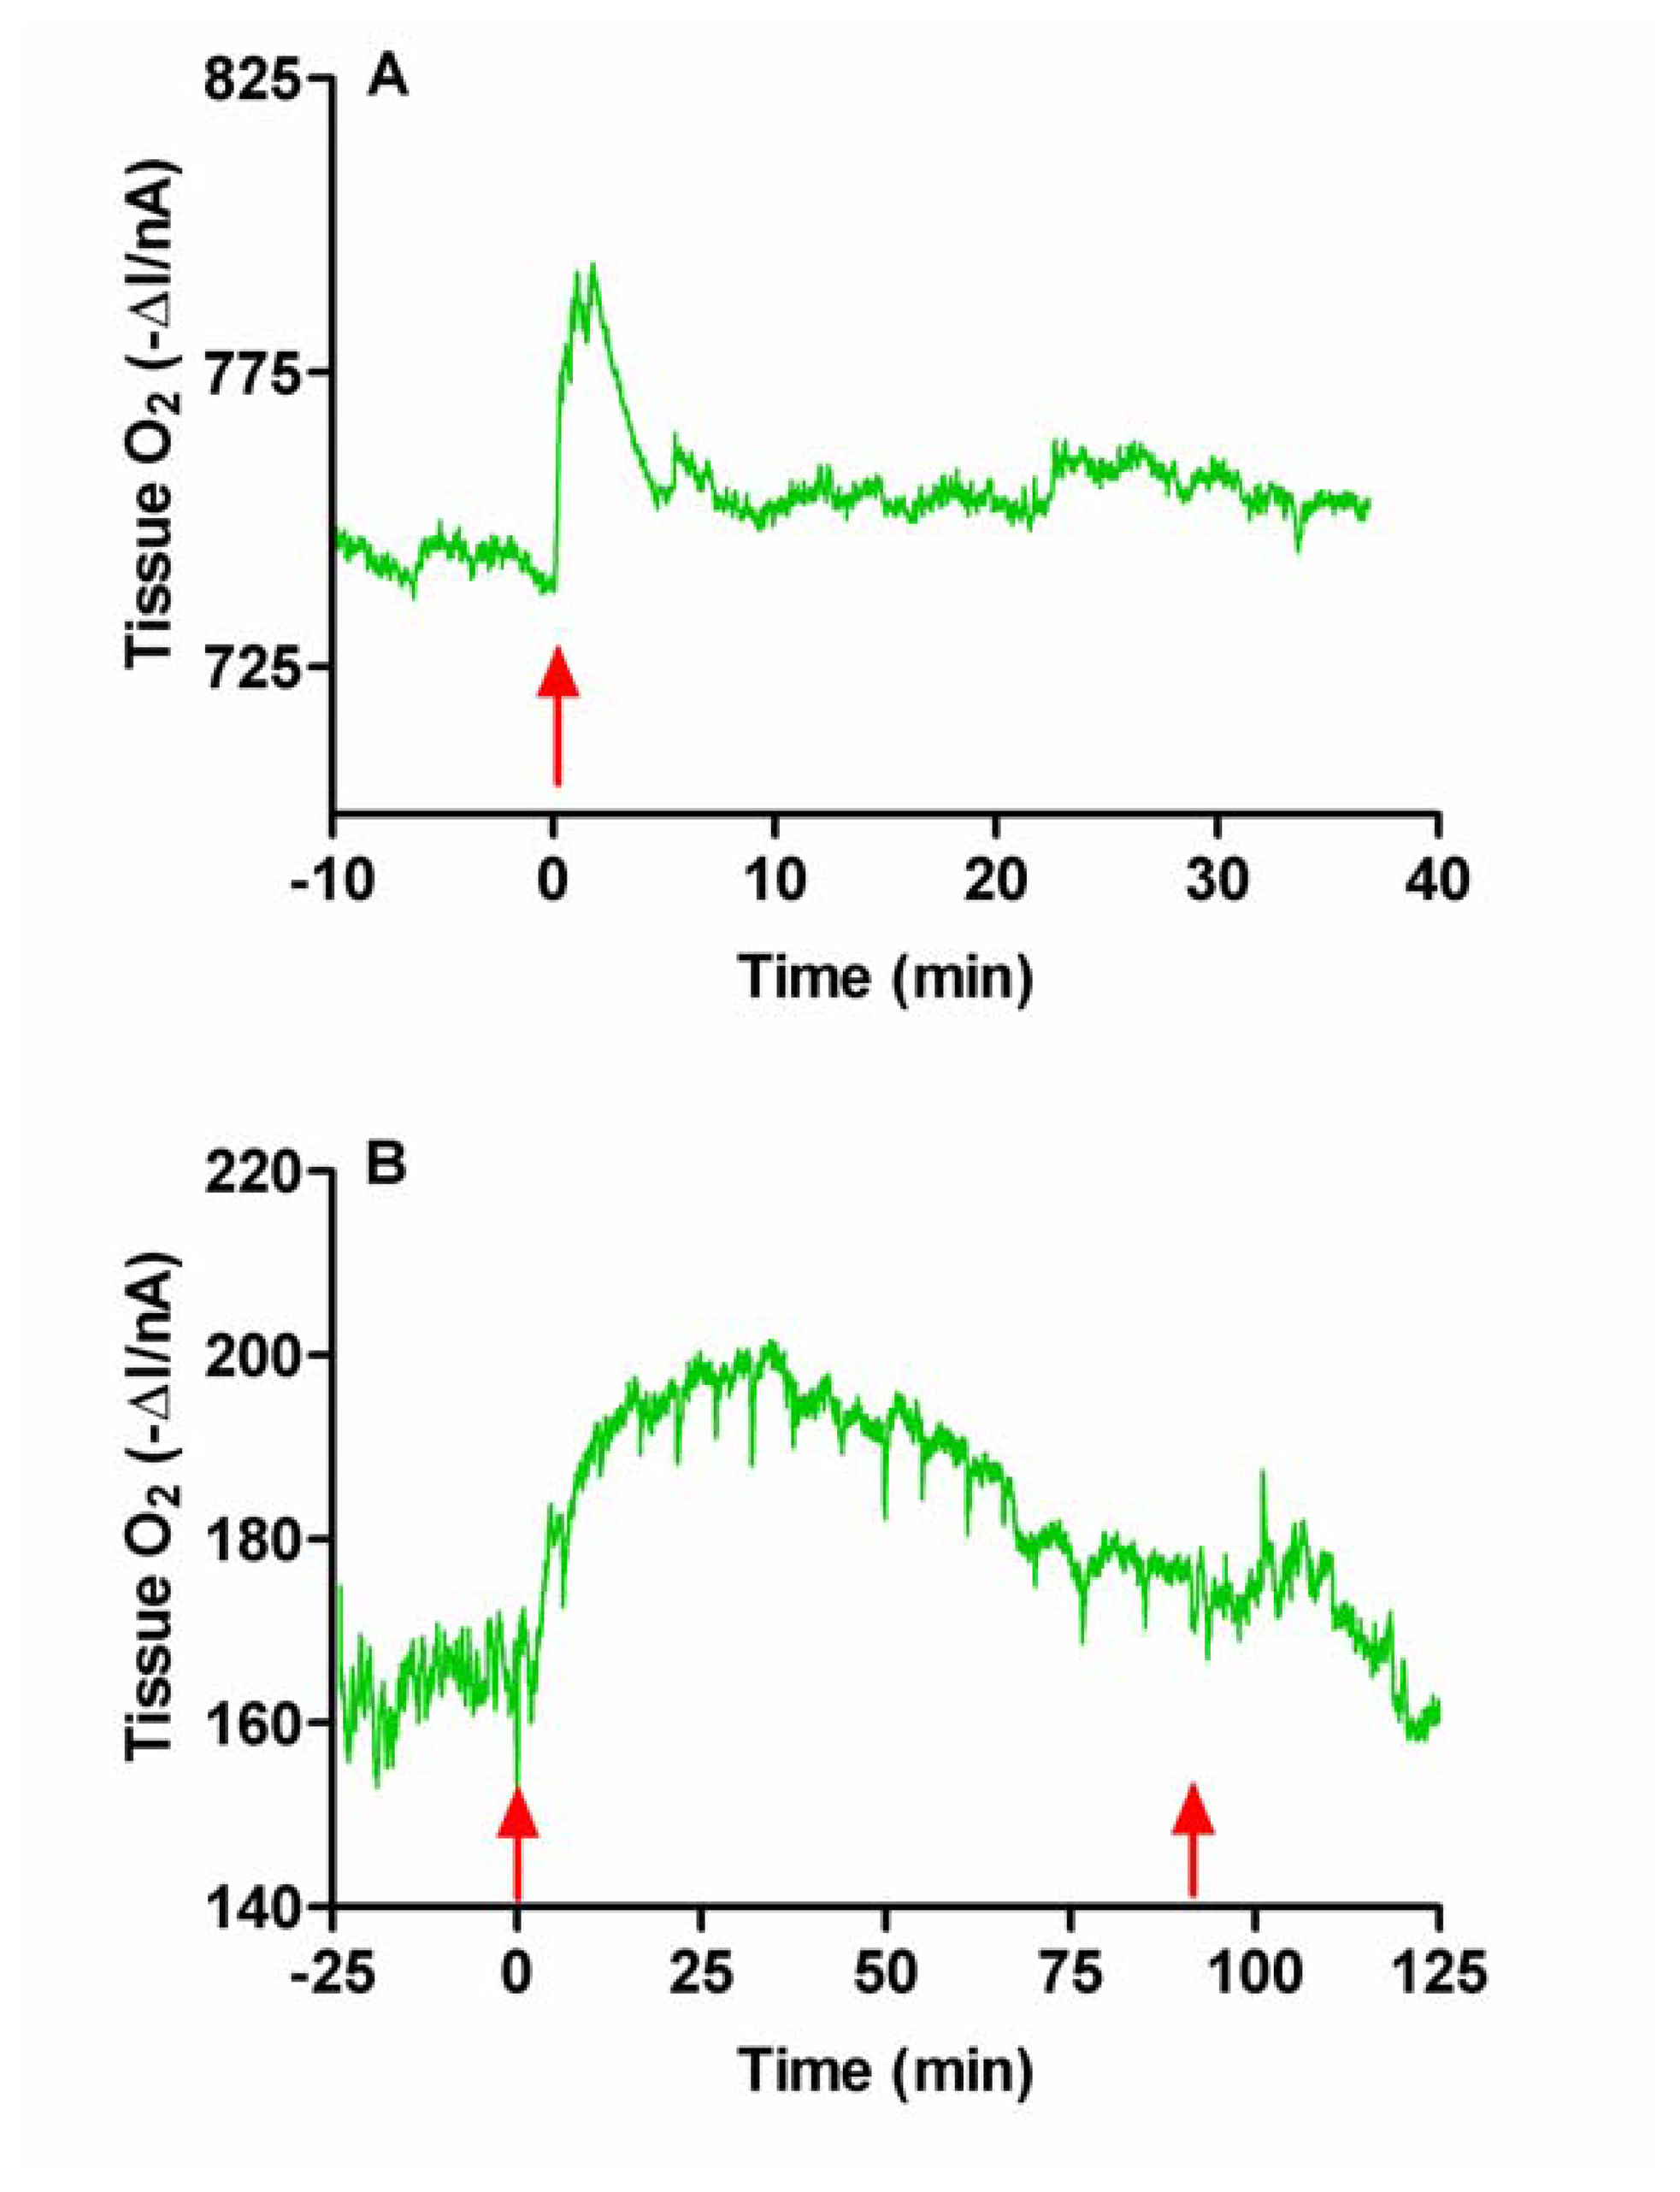
Since the anesthetic was administered by i.p. injection we first examined the effect of i.p. injection of normal saline (NaCl 0.9%). A typical example of changes in tissue O2 is shown in Figure 4A. There was an immediate increase in O2 following injection. The O2 signal (ΔI) increased maximally by 13.5 ± 3.7 nA at 2.5 ± 0.4 min and had returned to baseline by 4.1 ± 3.7 min (n = 4). This increase in current corresponds to an increase in concentration of 50 ± 15 μM based on calculations from in vitro calibration curves. Similar initial and brief injection effects have also been observed during the injection of anaesthetic agents, with a comparable return to baseline levels occurring before the effect of the anaesthetic takes place and the animal becomes anaesthetized [46]. The stress of the i.p. injection stimulates neuronal activation [47], increasing rCBF and thus O2, with the supply of the latter exceeding utilization.
The i.p injection of chloral hydrate produced the same initial response as the i.p. saline injection; a brief increase in O2. This was followed by slower more long-lasting changes which accompanied the behavioral changes associated with anaesthesia (see Figure 4B). The current (ΔI) increased to a maximum of 18.7 ± 3.1 nA (p < 0.03, n = 10) at 11.6 ± 1.9 min. This corresponds to an increase in concentration of 69 ± 9 μM. The duration of anesthesia, as measured by reflex responses (palpebral, corneal and withdrawal reflexes) and spontaneous movements of the rats, was 92 ± 6 min (n = 10).
Several studies have previously been carried out comparing experiments performed in conscious and anaesthetized rats indicating significant differences resulting from the effects of the different anaesthetics investigated. These have focused on dopamine, DOPAC, 5-HT and HVA and have primarily involved the use of microdialysis techniques [44,48-50], although some voltammetric studies of dopamine have been made with carbon paste [51] and carbon fiber electrodes [52]. Recently, several groups have used in vivo voltammetry with ‘first generation’ amperometric enzyme-based biosensors to monitor brain extracellular levels of several non-electroactive analytes under anaesthesia in acute experiments [53-66]. A problem which is often overlooked is the effect of anaesthesia on the levels of enzymatic mediators, which are intrinsic to the design and operation of these biosensors; oxidoreductase enzymes use molecular O2 as a mediator to produce the signal generating H2O2:
where FAD and FADH2 are the oxidized and reduced states of the redox active prosthetic group, flavin adenine dinucleotide. It is clear from this reaction scheme that changing O2 levels can affect accurate substrate measurement. Thus, in developing such devices it is important to consider mediator interference as well as the direct heterogeneous interference from endogenous electroactive species such as ascorbic acid, which has been the traditional focus of interference studies. The findings communicated here suggest that caution must be exercised in extrapolating results from acute experiments to the conscious state. This is especially true for estimations of basal concentrations, as extracellular levels of enzymatic substrates [26] and mediators are clearly altered in a complex manner by anaesthesia.
The Effect of Acetazolamide
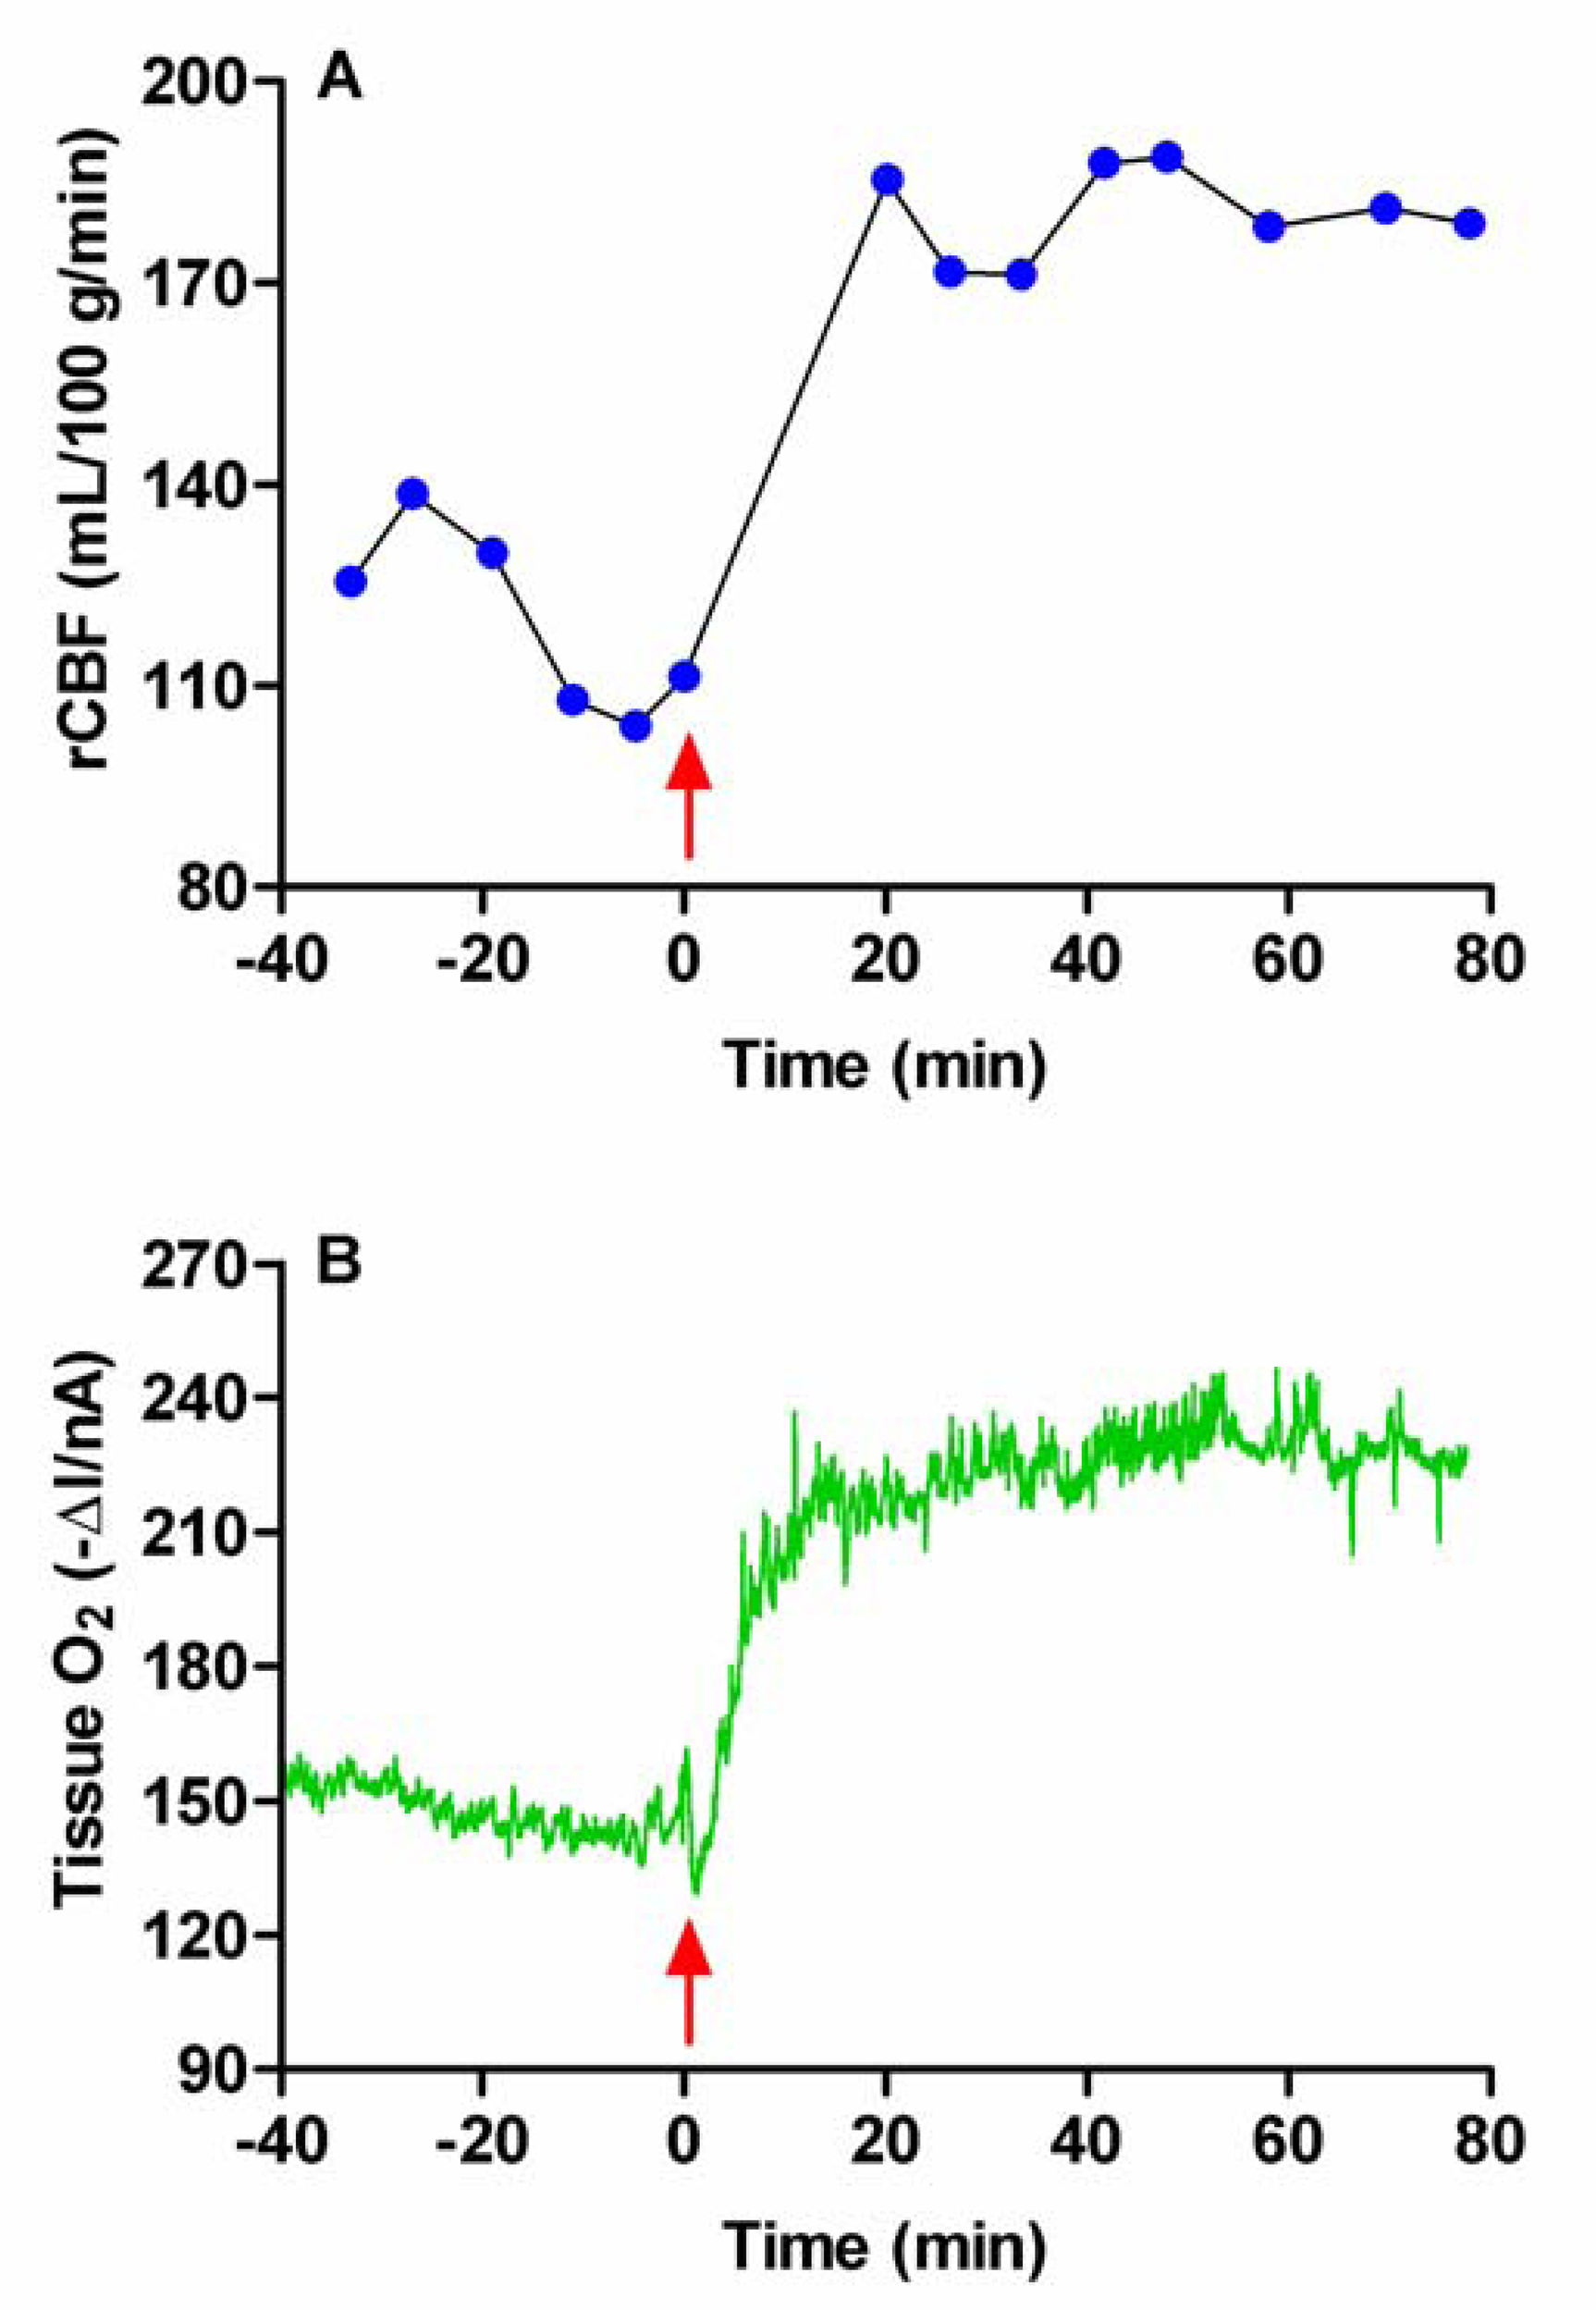
The carbonic anhydrase inhibitor acetazolamide (Diamox) administered systemically has been shown to increase brain pO2 in the ECF [2]. It is an amide derivative belonging to the sulfonamide family and and by inhibiting carbonic anhydrase reduces HCO3-. The resulting increase in PCO2 is accompanied by a pH reduction which causes dilation of cerebral blood vessels. Figure 5 shows the effect of this drug (50 mg/kg, i.p.) on the O2 signal and rCBF recorded simultaneously in rat striatum. As expected, acetazolamide increased O2 levels in the ECF; the O2 current (ΔI) recorded at the CPEs increased by 43 ± 10 nA. Calibration of the CPEs recovered after the experiments allowed us to estimate the increase as 40 ± 12 μM (n = 5, p < 0.03) 10 min after the injection, which is similar to the increase observed following mild stress [19]. Values for rCBF rose from a mean basal level of 118 ± 4 mL (100 g)-1 min-1 to a maximum of 182 ± 2 mL (100 g)-1 min-1 (p < 0.001). These results confirm that acetazolamide increases brain tissue O2 levels through an increase in rCBF. This increase would appear to be sustained for a prolonged period after administration (see Figure 5). Such characteristics make this drug ideally suited for testing the in vivo O2 sensitivity of ‘first generation’ amperometric enzyme-based biosensors [67].
Conclusions
Mild hypoxia and hyperoxia produced rapid changes (decrease and increase respectively) in the in vivo O2 signal confirming that CPEs implanted in freely-moving animals respond rapidly to changes in cerebral tissue O2 concentrations. Neuronal activation (tail pinch and stimulated grooming) produced similar increases in both O2 and rCBF indicating that CPE O2 currents provide an index of increases in rCBF when such increases exceed O2 utilization. Saline injection produced a transient increase in the O2 signal while chloral hydrate produced slower more long-lasting changes that accompanied the behavioral changes associated with anesthesia. Acetazolamide increased O2 levels through an increase in rCBF. While the latter confirms that acetazolamide is ideally suited for testing the in vivo O2 sensitivity of ‘first generation’ amperometric enzyme-based biosensors, the former suggests that caution must be exercised in extrapolating results from acute experiments to the conscious state.
Acknowledgments
We gratefully acknowledge financial support from the Health Research Board (HRB) Ireland (EQN12/2000 & RP/14/2002), Science Foundation Ireland (Investigator Programme Grant 03/IN3/B376), Enterprise Ireland (SC/2003/331E), the RSC & EPSRC UK (03/F/018), and NUI, Maynooth (New Researcher Award 2000 & Research Enhancement Fund 2003).
References
- Clark, L.C., Jr.; Misrahy, G.; Fox, R.P. Chronically implanted polarographic electrodes. J. Appl. Physiol. 1958, 13, 85–91. [Google Scholar]
- Clark, L.C., Jr.; Lyons, C. Studies of a glassy carbon electrode for brain polarography with observations on the effect of carbonic anhydrase inhibition. Ala. J. Med. Sci. 1965, 2, 353–359. [Google Scholar]
- Clark, L.C., Jr.; Clark, E.W. Epicardial oxygen measured with a pyrolytic graphite electrode. Ala. J. Med. Sci. 1964, 1, 142–148. [Google Scholar]
- Lowry, J.P.; Miele, M.; O'Neill, R.D.; Boutelle, M.G.; Fillenz, M. An amperometric glucose-oxidase/poly(o-phenylenediamine) biosensor for monitoring brain extracellular glucose: in vivo characterisation in the striatum of freely-moving rats. J. Neurosci. Methods 1998, 79, 65–74. [Google Scholar]
- Luebbers, D.W. Oxygen electrodes and optodes and their application in vivo. Adv. Exp. Med. Biol. 1996, 388, 13–34. [Google Scholar]
- Dittmar, A.; Mangin, S.; Ruban, C.; Newman, W.H.; Bowman, H.F.; Dupuis, V.; Delhomme, G.; Shram, N.F.; Cespuglio, R.; Jaffrezic-Renault, N.; Roussel, P.; Barbier, D.; Martelet, C. In vivo and in vitro evaluation of specially designed old and carbon fiber oxygen microelectrodes for living tissues. Sensor. Actuator. B - Chem. 1997, 44, 316–320. [Google Scholar]
- Jedlinska, B.; Mellstroem, A.; Hartmann, M.; Joensson, K. Comparison of tissue oxygen-tension measurements by different devices. An experimental study in pigs. Scand. J. Clin. Lab. Invest. 1998, 58, 63–71. [Google Scholar]
- McCreery, D.B.; Agnew, W.F.; Bullara, L.A.; Yuen, T.G. Partial pressure of oxygen in brain and peripheral nerve during damaging electrical stimulation. J. Biomed. Eng. 1990, 12, 309–315. [Google Scholar]
- Kennedy, R.T.; Jones, S.R.; Wightman, R.M. Simultaneous measurement of oxygen and dopamine: Coupling of oxygen consumption and neurotransmission. Neuroscience 1992, 47, 603–612. [Google Scholar]
- Nair, P.K.; Buerk, D.G.; Halsey, J.H., Jr. Comparison of oxygen metabolism and tissue pO2 in cortex and hippocampus. Stroke 1987, 18, 616–622. [Google Scholar]
- Baumgartl, H.; Heinrich, U.; Lubbers, D.W. Oxygen supply of the blood-free perfused guinea-pig brain in normo- and hypothermia measured by the local distribution of oxygen pressure. Pflugers Arch. 1989, 414, 228–234. [Google Scholar]
- Murr, R.; Berger, S.; Schuerer, L.; Peter, K.; Baethmann, A. A novel, remote-controlled suspension device for brain tissue PO2 measurements with multiwire surface electrodes. Pflugers Arch. 1994, 426, 348–350. [Google Scholar]
- Luebbers, D.W.; Baumgaertl, H. Heterogeneities and profiles of oxygen pressure in brain and kidney as examples of the pO2 distribution in the living tissue. Kidney Int. 1997, 51, 372–380. [Google Scholar]
- Zauner, A.; Bullock, R.; Di, X.; Young, H.F. Brain oxygen, CO2, pH, and temperature monitoring: Evaluation in the feline brain. Neurosurgery 1995, 37, 1168–1176. [Google Scholar]
- Kayama, T.; Yoshimoto, T.; Fujimoto, S.; Sakurai, Y. Intratumoral oxygen pressure in malignant brain tumor. J. Neurosurg. 1991, 74, 66–69. [Google Scholar]
- Hitchman, M.L. Measurement of Dissolved Oxygen; John Wiley: New York, 1978. [Google Scholar]
- Paliteiro, C.; Hamnett, A.; Goodenough, J.B. The electroreduction of oxygen at pyrolytic graphite. J. Electroanal. Chem. 1987, 233, 147–159. [Google Scholar]
- Zimmerman, J.B.; Wightman, R.M. Simultaneous electrochemical measurements of oxygen and dopamine in vivo. Anal. Chem. 1991, 63, 24–28. [Google Scholar]
- Lowry, J.P.; Boutelle, M.G.; O'Neill, R.D.; Fillenz, M. Characterization of carbon paste electrodes in vitro for simultaneous amperometric measurement of changes in oxygen and ascorbic acid concentrations in vivo. Analyst 1996, 121, 761–766. [Google Scholar]
- Venton, B.J.; Michael, D.J.; Wightman, R.M. Correlation of local changes in extracellular oxygen and pH that accompany dopaminergic terminal activity in the rat caudate-putamen. J. Neurochem. 2003, 84, 373–381. [Google Scholar]
- O'Neill, R.D.; Fillenz, M. Detection of homovanillic acid in vivo using microcomputer-controlled voltammetry: simultaneous monitoring of rat motor activity and striatal dopamine release. Neuroscience 1985, 14, 753–763. [Google Scholar]
- Zimmerman, J.B.; Kennedy, R.T.; Wightman, R.M. Evoked neuronal activity accompanied by transmitter release increases oxygen concentration in rat striatum in vivo but not in vitro. J. Cereb. Blood Flow Metab. 1992, 12, 629–637. [Google Scholar]
- Silver, I.A. Some observations on the cerebral cortex with an ultra-micro, membrane covered, oxygen electrode. Med. Electron. Biol. Engng 1965, 3, 377–387. [Google Scholar]
- O'Neill, R.D.; Grunewald, R.A.; Fillenz, M.; Albery, W.J. Linear sweep voltammetry with carbon paste electrodes in the rat striatum. Neuroscience 1982, 7, 1945–1954. [Google Scholar]
- Lowry, J.P.; Boutelle, M.G.; Fillenz, M. Measurement of brain tissue oxygen at a carbon paste electrode can serve as an index of increases in regional cerebral blood flow. J. Neurosci. Methods 1997, 71, 177–182. [Google Scholar]
- Lowry, J.P.; Fillenz, M. Real-time monitoring of brain energy metabolism in vivo using microelectrochemical sensors: The effects of anesthesia. Bioelectrochemistry 2001, 54, 39–47. [Google Scholar]
- O'Neill, R.D. Sensor-tissue interactions in neurochemical analysis with carbon paste electrodes in vivo. Analyst 1993, 118, 433–438. [Google Scholar]
- Kane, D.A.; O'Neill, R.D. Major differences in the behaviour of carbon paste and carbon fibre electrodes in a protein-lipid matrix: implications for voltammetry in vivo. Analyst 1998, 123, 2899–2903. [Google Scholar]
- Bourdillon, C.; Thomas, V.; Thomas, D. Electrochemical study of D-glucose oxidase autoinactivation. Enzyme Microb. Technol. 1982, 4, 175–180. [Google Scholar]
- Zhang, Y.N.; Wilson, G.S. In vitro and in vivo evaluation of oxygen effects on a glucose oxidase based implantable glucose sensor. Anal. Chim. Acta 1993, 281, 513–520. [Google Scholar]
- Wolfensohn, S.; Lloyd, M. Handbook of Laboratory Animal Management and Welfare; Oxford University Press: Oxford, 1994. [Google Scholar]
- Lowry, J.P.; Fillenz, M. Evidence for uncoupling of oxygen and glucose utilization during neuronal activation in rat striatum. J. Physiol. (London) 1997, 498, 497–501. [Google Scholar]
- Fray, A.E.; Forsyth, R.J.; Boutelle, M.G.; Fillenz, M. The mechanisms controlling physiologically stimulated changes in rat brain glucose and lactate: A microdialysis study. J. Physiol. (Lond) 1996, 496, 49–57. [Google Scholar]
- Morton, D.B.; Griffiths, P.H.M. Guidelines on the recognition of pain and discomfort in experimental animals and an hypothesis for assessment. Vet. Rec. 1985, 116, 431–436. [Google Scholar]
- Fillenz, M.; Lowry, J.P. Studies of the source of glucose in the extracellular compartment of the rat brain. Dev. Neurosci. 1998, 20, 365–368. [Google Scholar]
- Antelman, S.M.; Szechtman, H.; Chin, P.; Fisher, A.E. Tail pinch-induced eating, gnawing and licking behavior in rats: dependence on the nigrostriatal dopamine system. Brain Res. 1975, 99, 319–337. [Google Scholar]
- Fellows, L.K.; Boutelle, M.G. Rapid changes in extracellular glucose levels and blood flow in the striatum of the freely moving rat. Brain Res. 1993, 604, 225–231. [Google Scholar]
- Ohata, M.; Fredericks, W.R.; Sundaram, U.; Rapoport, S.I. Effects of immobilization stress on regional cerebral blood flow in the conscious rat. J. Cereb. Blood Flow Metab. 1981, 1, 187–194. [Google Scholar]
- Ormonde, D.E.; O'Neill, R.D. The oxidation of ascorbic acid at carbon paste electrodes. Modified response following contact with surfactant, lipid and brain tissue. J. Electroanal. Chem. 1990, 279, 109–121. [Google Scholar]
- Feng, Z.C.; Roberts, E.L.; Sick, T.J.; Rosenthal, M. Depth profile of local oxygen tension and blood flow in rat cerebral cortex, white matter and hippocampus. Brain Res. 1988, 445, 280–288. [Google Scholar]
- Leniger-Follert, E.; Lübbers, D.W. Behavior of microflow and local Po2 of the brain cortex during and after electrical stimulation. Pflügers Arch. 1976, 366, 39–44. [Google Scholar]
- Fox, P.T.; Raichle, M.E.; Mintun, M.A.; Dence, C. Nonoxidative glucose consumption during focal physiologic neural activity. Science 1988, 241, 462–464. [Google Scholar]
- Kawamoto, T.; Hobara, T.; Kobayashi, H.; Iwamoto, S.; Saki, T.; Takano, T.; Miyazaki, Y. The metabolite ratio as a function of chloral hydrate dose and intracellular redox state in the perfused rat liver. Pharmacol. Toxicol. 1987, 60, 325–329. [Google Scholar]
- Tao, R.; Auerbach, S.B. Anesthetics block morphine-induced increases in serotonin release in rat CNS. Synapse 1994, 18, 307–314. [Google Scholar]
- Lovinger, D.M.; Zimmerman, S.A.; Levitin, M.; Jones, M.V.; Harrison, N.L. Trichloroethanol potentiates synaptic transmission mediated by γ-aminobutyric acidA receptors in hippocampal neurons. J. Pharmacol. Exp. Ther 1993, 264, 1097–1103. [Google Scholar]
- Fillenz, M.; Lowry, J.P. The relation between local cerebral blood flow and extracellular glucose concentration in rat striatum. Exp. Physiol. 1998, 83, 233–238. [Google Scholar]
- Vahabzadeh, A.; Fillenz, M. Comparison of stress-induced changes in noradrenergic and serotonergic neurons in the rat hippocampus using microdialysis. Eur. J. Neurosci. 1994, 6, 1205–1212. [Google Scholar]
- Chen, H.T.; Kandasamy, S.B. Effect of chloral hydrate on in vivo KCl-induced striatal dopamine release in the rat. Neurochem. Res. 1996, 21, 695–700. [Google Scholar]
- Hamilton, M.E.; Mele, A.; Pert, A. Striatal extracellular dopamine in conscious vs. anesthetized rats: Effects of chloral hydrate anesthetic on responses to drugs of different classes. Brain Res. 1992, 597, 1–7. [Google Scholar]
- Shiraishi, M.; Kamiyama, Y.; Huettemeier, P.C.; Benveniste, H. Extracellular glutamate and dopamine measured by microdialysis in the rat striatum during blockade of synaptic transmission in anesthetized and awake rats. Brain Res. 1997, 759, 221–227. [Google Scholar]
- Clemens, J.A.; Phebus, L.A. Changes in brain chemistry produced by dopaminergic agents: in vivo electrochemical monitoring reveals opposite changes in anaesthetized vs unanaesthetized rats. Brain Res. 1983, 267, 183–186. [Google Scholar]
- Petrinec, J.; Guadalupe, T.; Fumero, B.; Viejo, E.; Gonzalez-Mora, J. L.; Mas, M. Effects of different anaesthetics on striatal dopaminergic activity as assessed by in vivo voltammetry. In Monitoring Molecules in Neuroscience; Gonzalez-Mora, J. L., Borges, R., Mas, M., Eds.; University of La Laguna: Tenerife, 1996; pp. 293–294. [Google Scholar]
- Silver, I.A.; Erecinska, M. Extracellular glucose concentration in mammalian brain: Continuous monitoring of changes during increased neuronal activity and upon limitation in oxygen supply in normo-, hypo-, and hyperglycemic animals. J. Neurosci. 1994, 14, 5068–5076. [Google Scholar]
- Netchiporouk, L.I.; Shram, N.F.; Jaffrezic-Renault, N.; Martelet, C.; Cespuglio, R. In vivo brain glucose measurements: differential normal pulse voltammetry with enzyme-modified carbon fiber microelectrodes. Anal. Chem. 1996, 68, 4358–4364. [Google Scholar]
- Shram, N.F.; Netchiporouk, L.I.; Martelet, C.; Jaffrezic-Renault, N.; Cespuglio, R. Brain glucose: Voltammetric determination in normal and hyperglycaemic rats using a glucose microsensor. NeuroReport 1997, 8, 1109–1112. [Google Scholar]
- Hu, Y.B.; Wilson, G.S. Rapid changes in local extracellular rat brain glucose observed with an in vivo glucose sensor. J. Neurochem. 1997, 68, 1745–1752. [Google Scholar]
- Shram, N.F.; Netchiporouk, L.I.; Martelet, C.; Jaffrezic-Renault, N.; Bonnet, C.; Cespuglio, R. In vivo voltammetric detection of rat brain lactate with carbon fiber microelectrodes coated with lactate oxidase. Anal. Chem. 1998, 70, 2618–2622. [Google Scholar]
- Ikegami, Y.; Maeda, M.; Yokota, A.; Hayashida, Y. Cerebral extracellular lactate concentration and blood flow during chemical stimulation of the nucleus tractus solitarii in anesthetized rats. Brain Res. 1997, 758, 33–38. [Google Scholar]
- Garguilo, M.G.; Michael, A.C. Amperometric microsensors for monitoring choline in the extracellular fluid of brain. J. Neurosci. Methods 1996, 70, 73–82. [Google Scholar]
- Garguilo, M.G.; Michael, A.C. An enzyme-modified microelectrode that detects choline injected locally into brain tissue. J. Am. Chem. Soc. 1993, 115, 12218–12219. [Google Scholar]
- Garguilo, M.G.; Michael, A.C. Optimization of amperometric microsensors for monitoring choline in the extracellular fluid of brain tissue. Anal. Chim. Acta 1995, 307, 291–299. [Google Scholar]
- Garguilo, M.G.; Michael, A.C. Quantitation of choline in the extracellular fluid of brain tissue with amperometric microsensors. Anal. Chem. 1994, 66, 2621–2629. [Google Scholar]
- Hu, Y.; Mitchell, K.M.; Albahadily, F.N.; Michaelis, E.K.; Wilson, G.S. Direct measurement of glutamate release in the brain using a dual enzyme-based electrochemical sensor. Brain Res. 1994, 659, 117–125. [Google Scholar]
- Walker, M.C.; Galley, P.T.; Errington, M.L.; Shorvon, S.D.; Jefferys, J.G.R. Ascorbate and glutamate release in the rat hippocampus after perforant path stimulation: A “dialysis electrode” study. J. Neurochem. 1995, 65, 725–731. [Google Scholar]
- Asai, S.; Iribe, Y.; Kohno, T.; Ishikawa, K. Real time monitoring of biphasic glutamate release using dialysis electrode in rat acute brain ischemia. NeuroReport 1996, 7, 1092–1096. [Google Scholar]
- Kulagina, N.V.; Shankar, L.; Michael, A.C. Monitoring glutamate and ascorbate in the extracellular space of brain tissue with electrochemical microsensors. Anal. Chem 2000, 71, 5093–5100. [Google Scholar]
- Dixon, B.M.; Lowry, J.P.; O'Neill, R.D. Oxygen dependence of an enzyme/polymer biosensor for monitoring brain glucose in vivo. Journal of Neuroscience Methods 2002, 119, 135–142. [Google Scholar]
Figure 1.
Typical raw data examples of the effects of mild hypoxia (A) and hyperoxia (B) on brain tissue O2 levels monitored using a carbon paste electrode implanted in the striatum of a freely-moving rat.
Figure 1.
Typical raw data examples of the effects of mild hypoxia (A) and hyperoxia (B) on brain tissue O2 levels monitored using a carbon paste electrode implanted in the striatum of a freely-moving rat.

Figure 2.
Typical examples of raw data obtained for the measurement of tissue O2 and blood flow (rCBF), monitored simultaneously with bilaterally implanted carbon paste (O2) and Pt/Ir (H2 clearance) electrodes in the striatum of a freely-moving rat, in response to behavioral stimulation (5-min tail pinch).
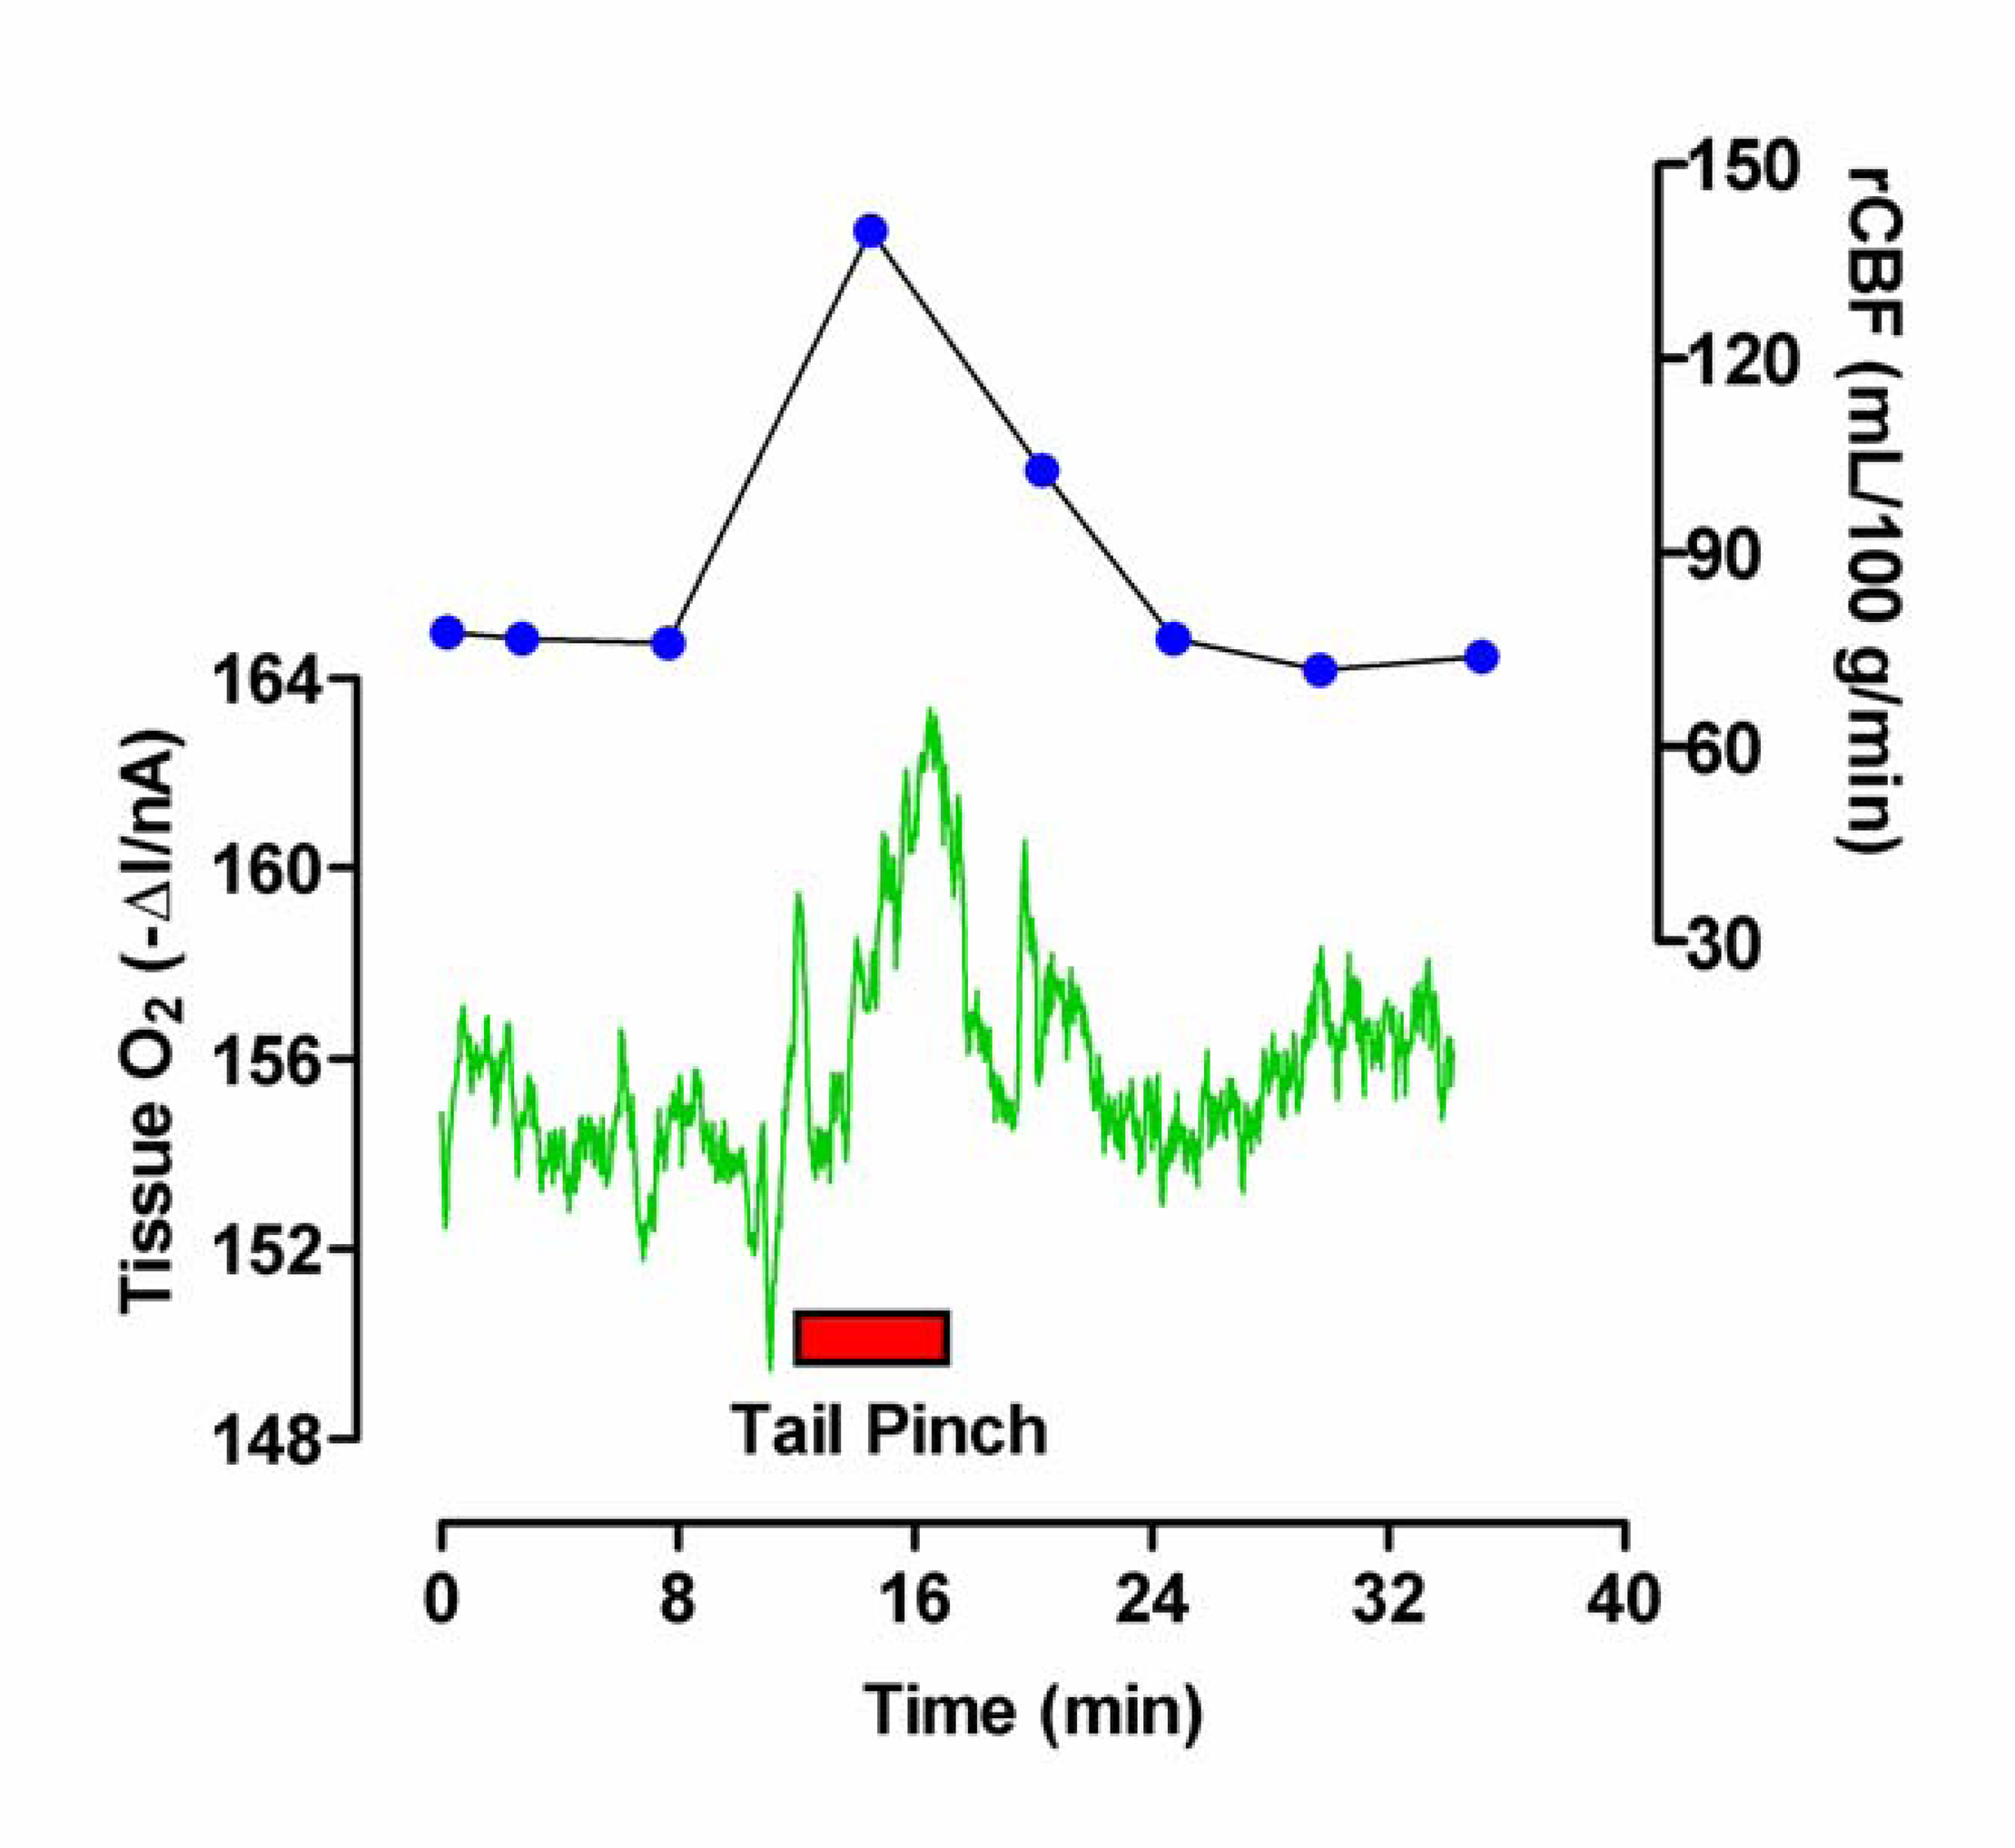
Figure 3.
Typical example of the effect of induced grooming (red bar) on striatal O2 levels monitored with an implanted carbon paste electrode and differential pulse amperometry.
Figure 3.
Typical example of the effect of induced grooming (red bar) on striatal O2 levels monitored with an implanted carbon paste electrode and differential pulse amperometry.

Figure 4.
Typical examples of the effects of intraperitoneal injection of normal saline (A, 0.5 mL, NaCl 0.9%) and chloral hydrate (B, 350 mg/kg) on tissue O2 monitored in rat striatum with carbon paste electrodes. Arrows indicate the points of injection (A & B), and recovery (B) from the anaesthetic.

Figure 5.
The effects of systemic administration of the carbonic anhydrase inhibitor acetazolamide (Diamox, 50 mg/kg, i.p.) on the tissue O2 and blood flow (rCBF) levels monitored simultaneously with bilaterally implanted carbon paste (O2) and Pt/Ir (H2 clearance) electrodes in the striatum of a freely-moving rat.

© 2005 by MDPI ( http://www.mdpi.org). Reproduction is permitted for noncommercial purposes.
Share and Cite
MDPI and ACS Style
Bolger, F.B.; Lowry, J.P. Brain Tissue Oxygen: In Vivo Monitoring with Carbon Paste Electrodes. Sensors 2005, 5, 473-487. https://doi.org/10.3390/s5110473
AMA Style
Bolger FB, Lowry JP. Brain Tissue Oxygen: In Vivo Monitoring with Carbon Paste Electrodes. Sensors. 2005; 5(11):473-487. https://doi.org/10.3390/s5110473
Chicago/Turabian StyleBolger, Fiachra B., and John P. Lowry. 2005. "Brain Tissue Oxygen: In Vivo Monitoring with Carbon Paste Electrodes" Sensors 5, no. 11: 473-487. https://doi.org/10.3390/s5110473