Article

Voltammetric Detection of Antioxidative Properties of Flavonoids Using Electrically Heated DNA Modified Carbon Paste Electrode

1
Department of Chemistry, Rostock University, 18051 Rostock, Germany
2
Department of Analytical Chemistry, Slovak University of Technology, 81237 Bratislava, Slovak Republic
*
Author to whom correspondence should be addressed.
Sensors 2003, 3(1), 1-10; https://doi.org/10.3390/s30100001
Submission received: 7 November 2002 / Accepted: 15 November 2002 / Published: 24 January 2003

Abstract

:
A simple electrochemical sensor consisting of electrically heated carbon paste electrode with the surface modified by dsDNA is used to characterize voltammetric behaviour and antioxidative activity of four selected flavonoids. Quercetin, rutin, catechin and epigallocatechin gallate accumulate within the DNA layer. A positive effect of the electrode temperature within the range of 20 to 38 °C on the detection of a deep DNA degradation by a copper(II)/H2O2/ascorbic acid cleavage mixture as well as an antioxidative effect of flavonoids was evaluated.

Introduction

Oxidative stress is an important factor in several body pathologies such as DNA alteration, aging, cancer diseases, etc. Damage to DNA like specific oxidation of purin or pyrimidine bases and DNA strand breaks can arise by free radicals of oxygen, nitrogen and sulphur and other oxidation agents (cytostatics, anticancerogenic antibiotics and chemical nucleases), ionization radiation and fotooxidation of transition metal ions activated by peroxides. On the other hand, there are antioxidants which at low concentration can protect biological compounds against an oxidation by the chelation of metal ions, inhibition of enzymes, elimination of hydrogen peroxide, scavenging, trapping and guenching of radicals [1].
In the last years, conventional electrochemical sensors modified by DNA have been utilized as simple devices for the sensitive determination of electroactive and non-electroactive compounds interacting with DNA [2-5] as well as detection of specific sequence of DNA [6, 7]. DNA biosensors are also a sensitive tool for monitoring of the DNA integrity. The strategy is based on the employment of DNA itself as the sensor biocomponent for the detection of species leading to damage or protection of DNA. Mercury as well as solid electrodes were used as electrochemical transducers of a signal [8-11]. Electrically heated electrodes represent a way of enhancement of the sensitivity of electrochemical analysis [12, 13]. Recently we have shown that heating the electrode surface increases the sensitivity of immobilized DNA to the oxidation attack [14].
Flavonoids are important non- or even antinutrition components of our diet and can be found free or as glycosides in fruit and vegetable [15]. More than 8000 of these polyphenolic compounds are characterized by the presence of three rings in the molecule: two aromatic and one heterocyclic [16]. They can potentially bind to double stranded DNA (dsDNA). Depending on reaction conditions antioxidative as well as prooxidative activities of flavonoids have been found in various systems [17-20].
In this paper a voltammetric investigation of selected flavonoids (quercetin, rutin, epigallocatechin gallate and catechin, Scheme 1) and their antioxidative properties using an electrically heated carbon paste electrode with the surface confined DNA (denoted as DNA/CPE) is presented. The known system of a copper(II) complex with 1,10-phenanthroline, [Cu(phen)2]2+, in the presence of hydrogen peroxide and ascorbic acid was used as the cleavage mixture producing reactive oxygen species (ROS). A portion of original (nondegraded) dsDNA on the sensor surface was quantified using the [Co(phen)3]3+ complex as DNA redox indicator. The evaluation of temperature effect on the flavonoid anodic signal and DNA degradation and protection by flavonoids was the aim of the study.

Experimental

Apparatus and Reagents

Differential pulse voltammetric measurements were performed with an Autolab PGSTAT10 electrochemical analyzer (Eco Chemie) controlled by GPES software in a Teflon electrolytic cell (1 ml solution) equipped with a CPE, a Ag/AgCl/3 mol/l NaCl reference electrode and a platinum wire auxiliary electrode. The working electrode was heated by a laboratory-made sine-wave power generator connected to the assembly via a high-frequency transformer as described previously [21].
Calf thymus dsDNA was obtained from Merck (1.24013.0100) and used as received. Its stock solution (2 mg/ml) was prepared in 10 mmol/1 Tris-HCl buffer of pH 8.0 with 1 mmol/l EDTA solution and stored at -4 °C. The complex compounds were synthesized in our laboratory according to Ref. [22] and checked by chemical analysis. Quercetin (3,3',4',5,7-pentahydroxyflavone), rutin (quercetin-3-O-rutinose) and epigallocatechin gallate ([2R,3R]-2-[3,4,5-trihydroxyphenyl]-3,4-dihydro-l-[2H]-benzopyran-3,5,7-triol-3-[3,4,5-trihydroxybenzoate]) were obtained from Sigma and catechin ([2S,3R]-2-[3,4-dihydroxyphenyl]-3,4-dihydro-l-[2H]-benzopyran-3,5,7-triol) was from Fluka. The l× 10-2 mol/l stock solutions of flavonoids were prepared in 100 % of DMSO. Ascorbic acid solution of the concentration 1 mol/l was prepared always freshly before measurement. All chemicals were of analytical reagent grade purity and they were used as received. Deionized, double distilled water was used throughout.

Construction of CPE

The carbon paste was prepared as described previously [14]. Briefly, the spectral graphite powder (grade 38, Fisher Scientific, code number G/0900/60) was mixed with mineral oil (Sigma) in the mass ratio of 70:30. To construct the CPE, three electrical contacts were glued into a Teflon body with a square opening (length 5 mm, width 1 mm) which was filed with the carbon paste. The electrode surface was renewed and polished carefully with weighing paper prior to each series of measurements. Temperature calibration was performed before starting experiments using a potential measurement with the equimolar reversible redox couple (5× 10⁻³ mol/l ferricyanide/ferrocyanide solution) with a known temperature coefficient of the standard potential -1.6 mV/K by open circuit potentiometry [23, 24].

Preparation of the DNA Biosensor

DNA modified carbon paste electrode was prepared in two steps [25]. First the CPE was potentiostatically activated at +1.7 V for 60 s in stirred 0.2 mol/l acetate buffer solution (pH 5.0) containing 50 ug/ml dsDNA. Then dsDNA was adsorbed on the CPE at +0.5 V for 120 s from the same solution under stirring.

Procedures at The Evaluation of Antioxidative Properties

The DNA indicator was accumulated from 5×10⁻⁷ mol/l [Co(phen)3]3+ in 5 mmol/l phosphate buffer pH 7.0 on the DNA/CPE for 120 s at open circuit under stirring. The DP voltammogram was recorded immediately in the same solution in potential range from -0.2 do +0.6 V at the pulse amplitude 100 mV and scan rate of 25 mV/s. The marker DPV peak current was evaluated and corrected by a subtraction of the mean marker signal at the bare CPE under same conditions to obtain the I0 value. Then the sensor was regenerated by removing [Co(phen)3]3+ in 100 mmol/1 phosphate buffer under stirring for 120 s. A negligible indicator peak current was checked by the DPV record in blank. The I0 current was obtained in triplicate.
Regenerated DNA/CPE was incubated without or with heating in a cleavage mixture composed of 5× 10⁻⁷ mol/l [Cu(phen)2](NO3)2, 1× 10⁻³ mol/l ascorbic acid, 1× 10⁻² mol/l hydrogen peroxide and a given concentration of flavonoid in 5 mmol/l phosphate buffer with 1 % DMSO for 5 or 10 min. Then the sensor was washed in blank 50 mmol/l phosphate buffer for 5 min, rinsed with water and the [Co(phen)3]3+ indicator was accumulated as described above. After subtraction of the mean indicator signal at the bare CPE under same conditions, the current I was obtained in triplicate using the sensor incubation/washing - indicator accumulation/DPV - sensor regeneration scheme. Finally, the mean values of I0 and I and consecutively the relative signal I/I0 were calculated.

Results and Discussion

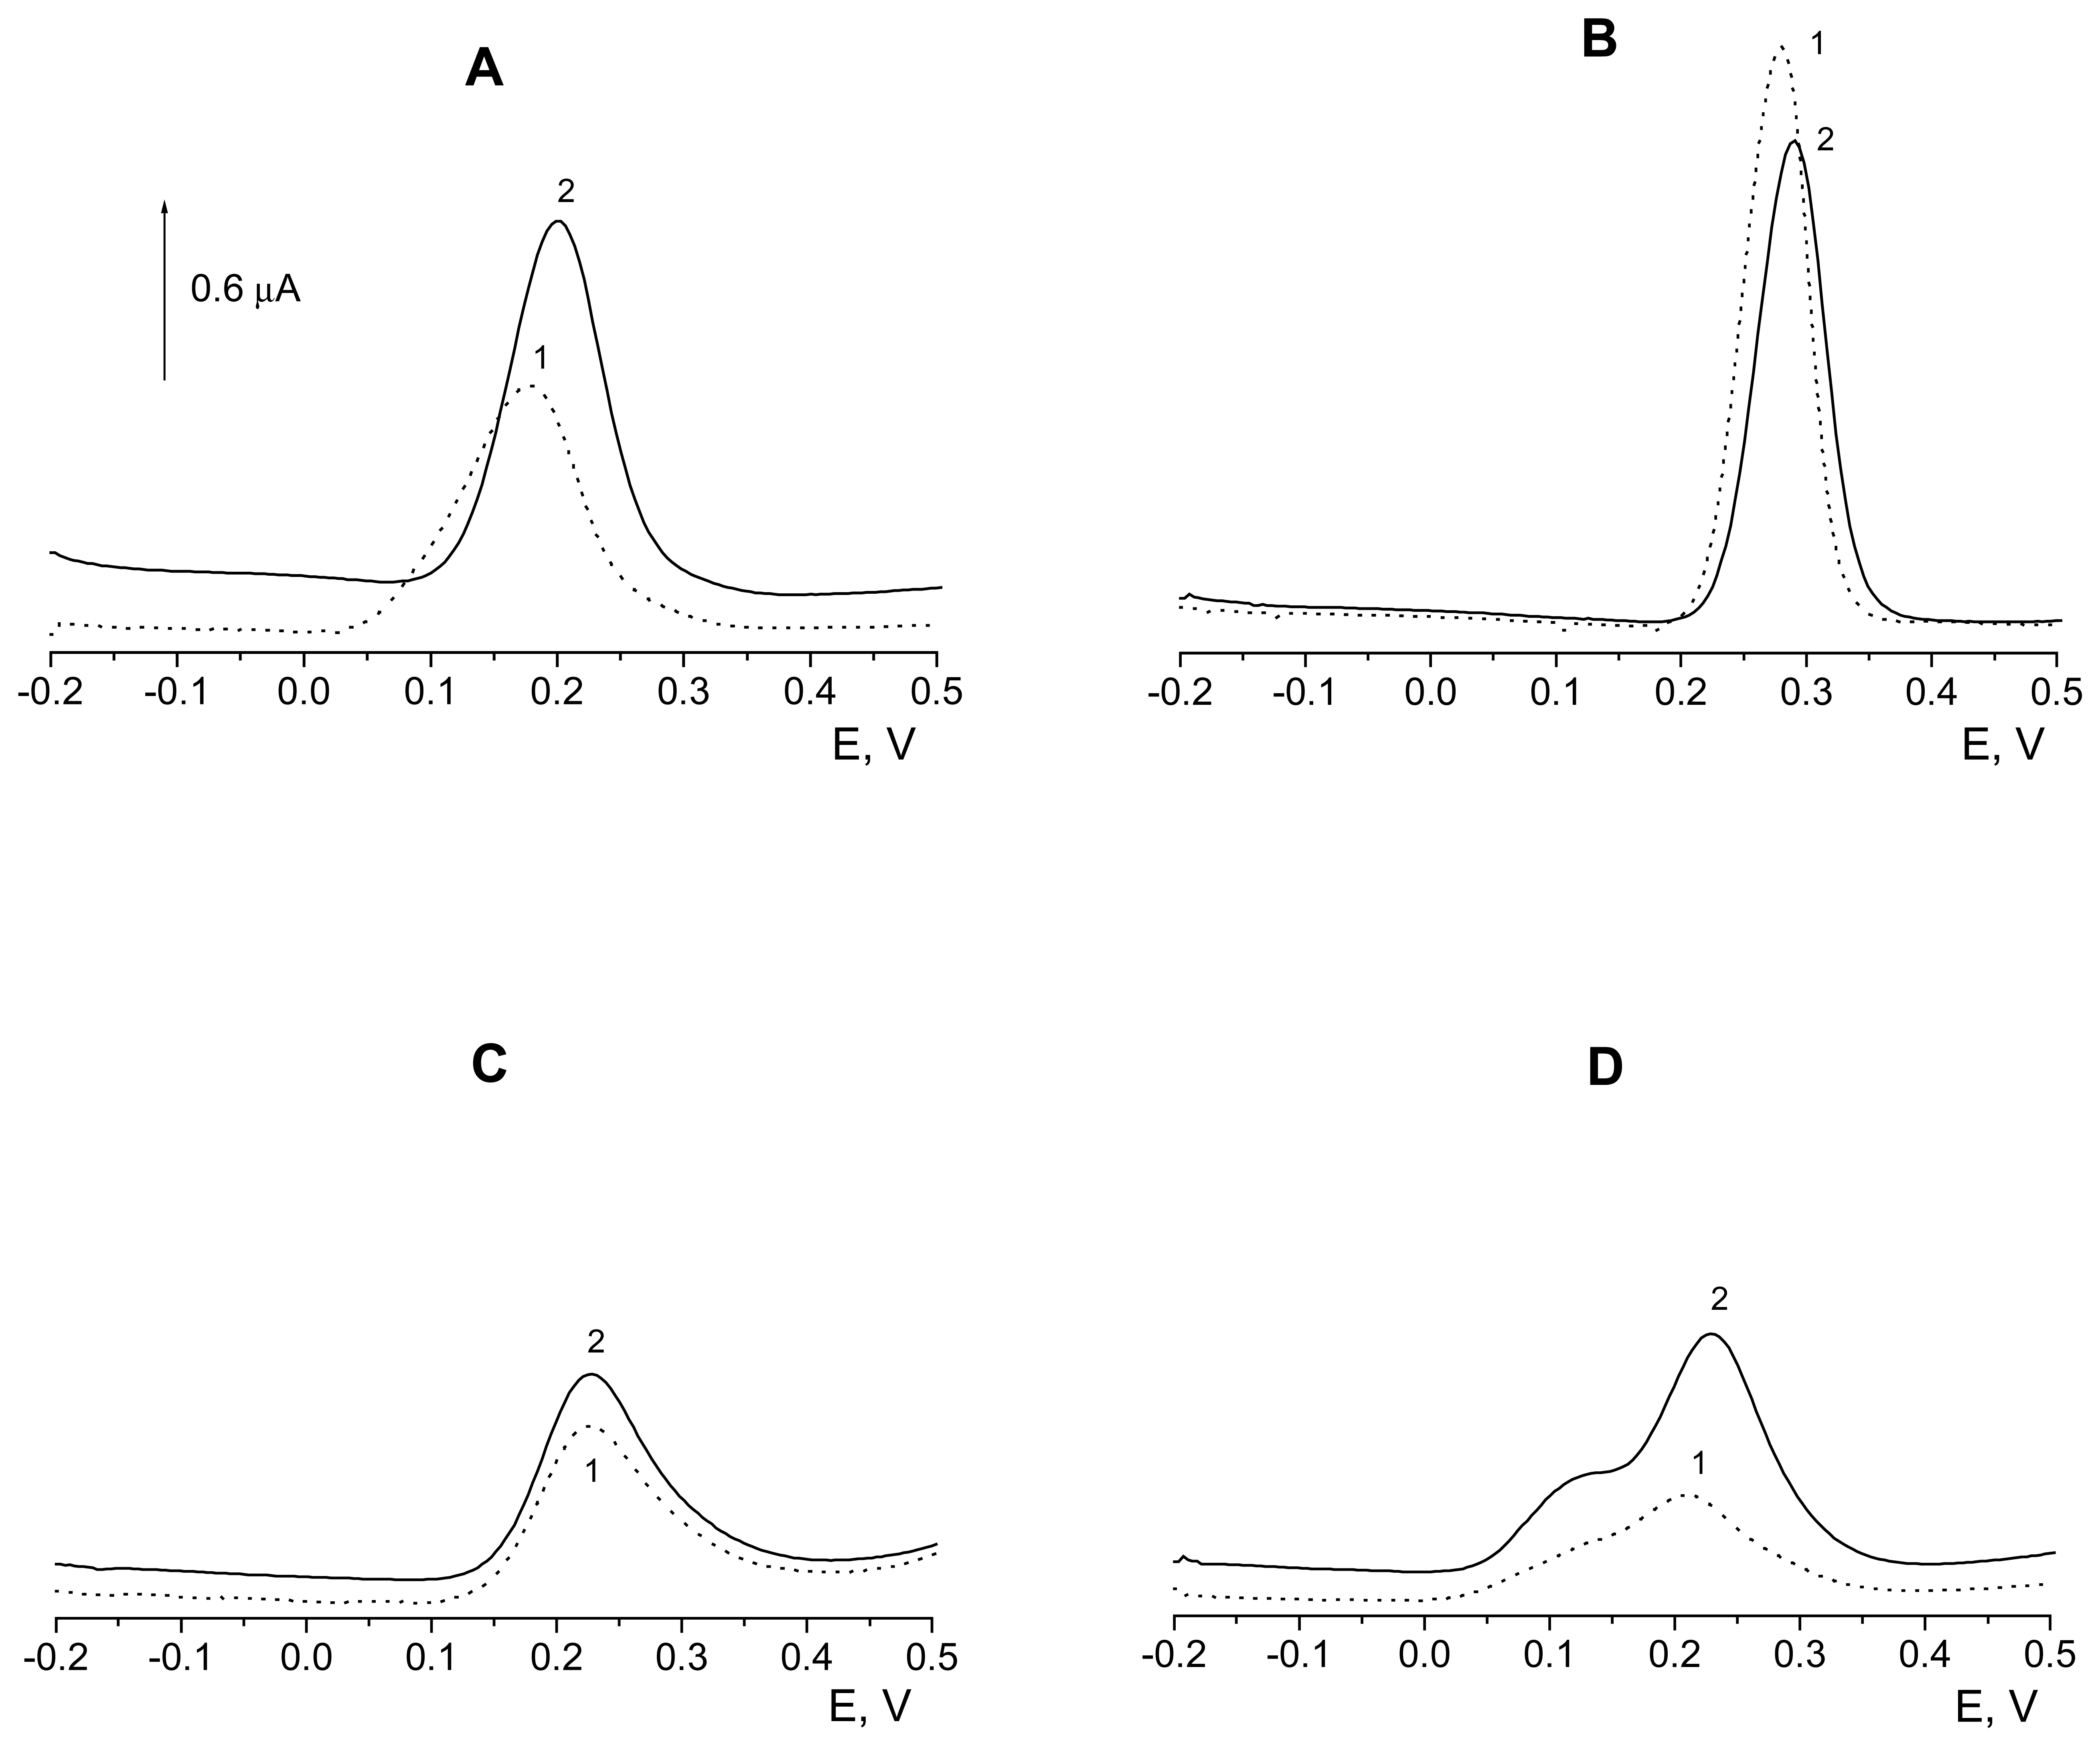
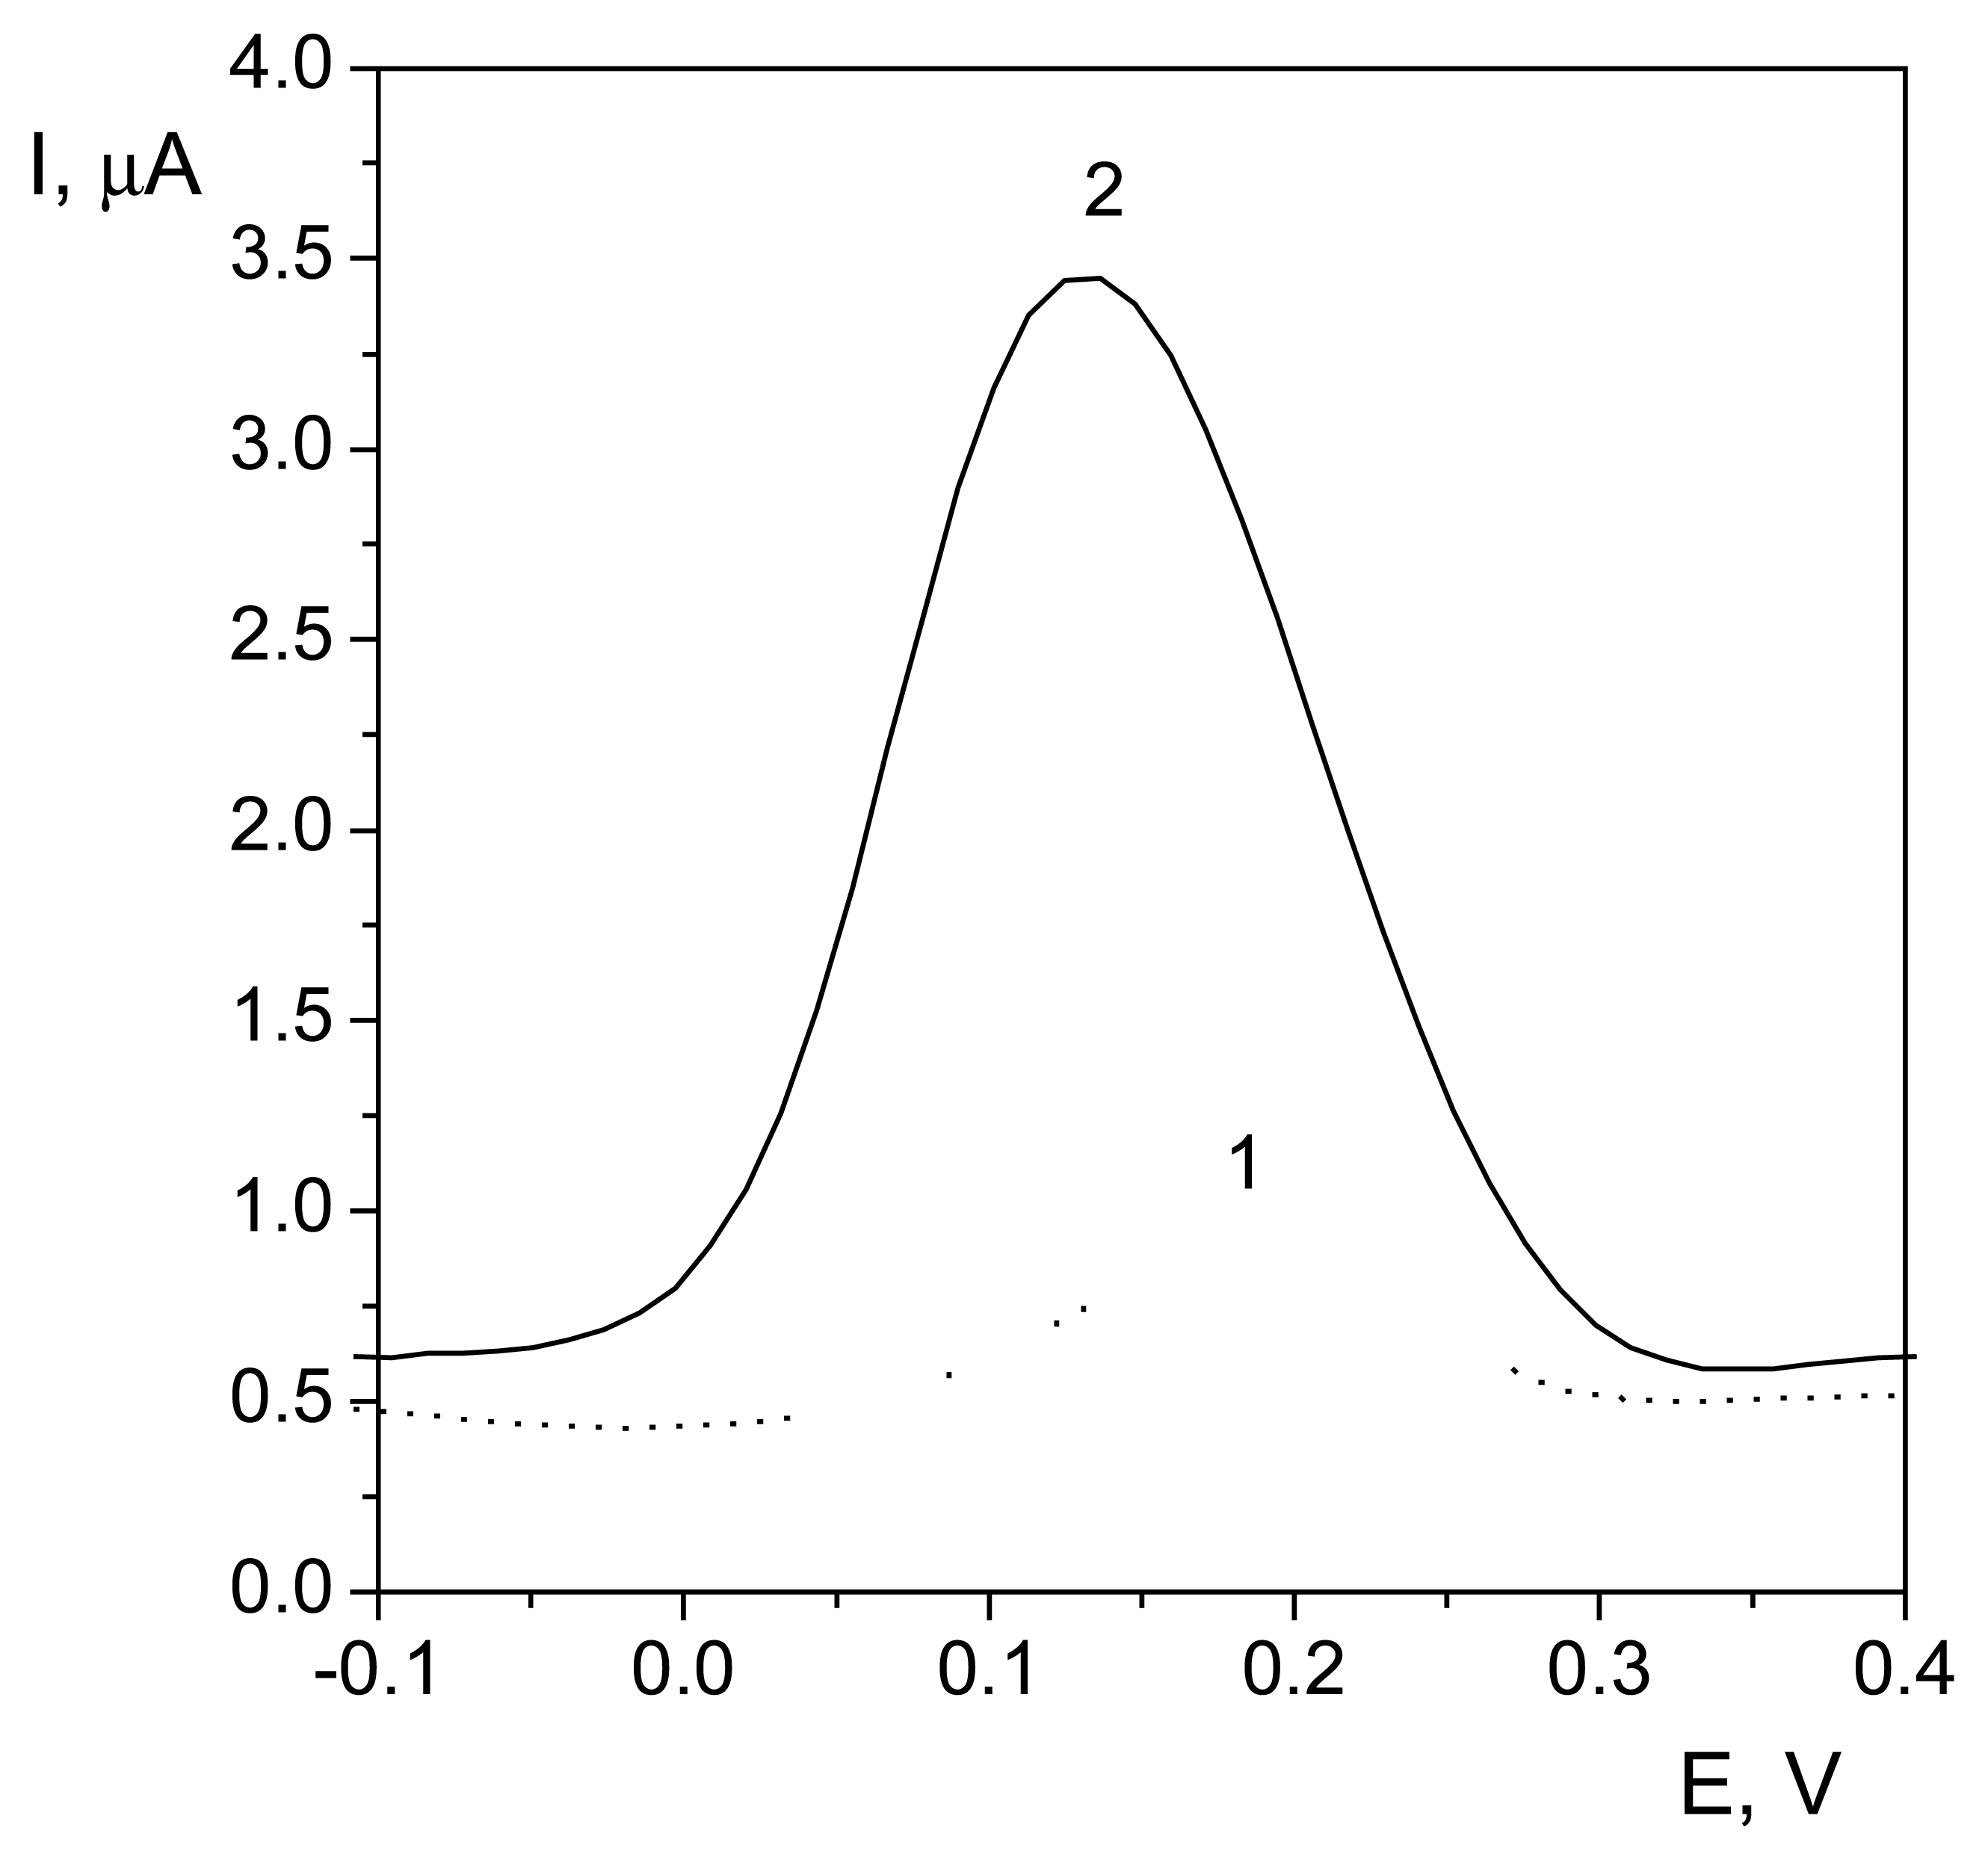
Voltammetric properties of the flavonoids at DNA/CPE

The voltammetric behaviour of four selected flavonoids (quercetin, rutin, catechin, epigallocatechin gallate) was investigated at the bare and DNA modified CPEs. All the compounds undergo an electrochemical oxidation in the potential range from +0.177 to +0.291 Vvs Ag/AgCl (Fig. 1). Basic voltammetric characteristics of the flavonoids, obtained from the DP voltammograms registered immediately after 120 s sensor treatment in the flavonoid solution in 5 mmol/l phosphate buffer, after the medium exchange for the same blank electrolyte as well as after conditioning the sensor in stirred 50 mmol/1 phosphate buffer for 5 and 10 min., are presented in Table 1. According to the peak potential values, the oxidizability of tested compounds decreases in order: quercetin> epigallocatechin gallate ≅ catechin > rutin.
The modification of the CPE electrode with DNA causes a positive Ep shift indicated a more difficult oxidation of flavonoids. The DPV peak currents of quercetin, catechin and epigallocatechin gallate increase at the nonheated DNA/CPE by cca 50 %, 20 % and 130 %, resp. A decrease of the peak current of rutin by 20 % could be explained by steric problems of its large molecule. At heating the sensor to 38 °C, the DPV peaks increase at both unmodified and DNA modified electrodes by 10 to 65 % with exception of quercetin at the bare CPE.
The medium exchange for blank 5 mmol/1 phosphate buffer leads to no or only small shift in Ep of flavonoids at both CPE and DNA/CPE. Peak current changes at the medium exchange indicate a desorption of the flavonoids bound to the unmodified as well as DNA modified CPEs during the treatment the sensors in their solution. The rate of this desorption is different for individual flavonoids. According to the Ip values, aproximatelly 30 % of quercetin, 80 % of rutin, 55 to 65 % catechin and 18 % epigallocatechin gallate remain attached to the electrode after the medium exchange for 5 mmol/l buffer. In 50 mmol/l buffer, the DPV signals of flavonoids slowly disapear. Therefore, the DNA/CPE sensor was washed in experiments with an incubation in the cleavage mixture containing flavonoids (see below).

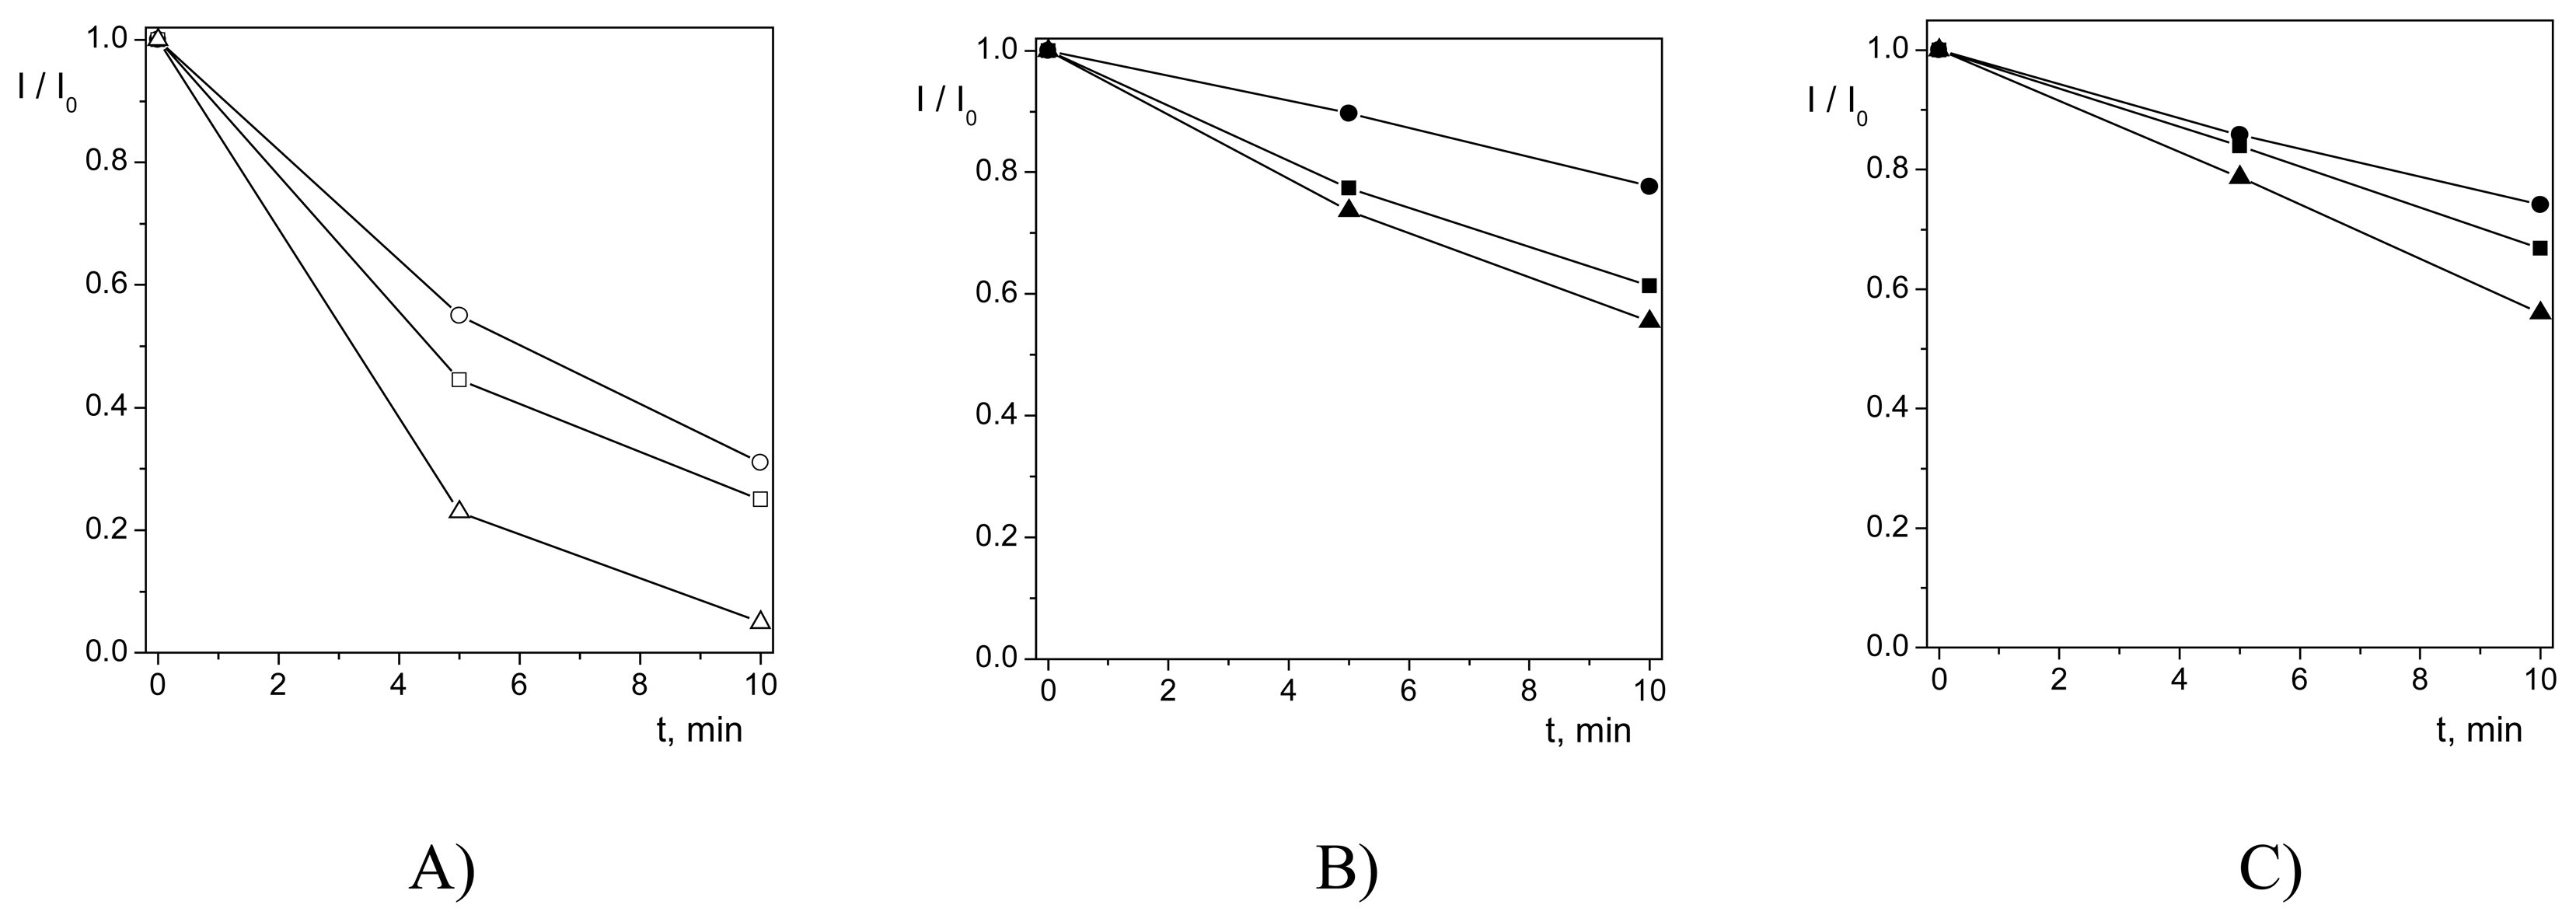
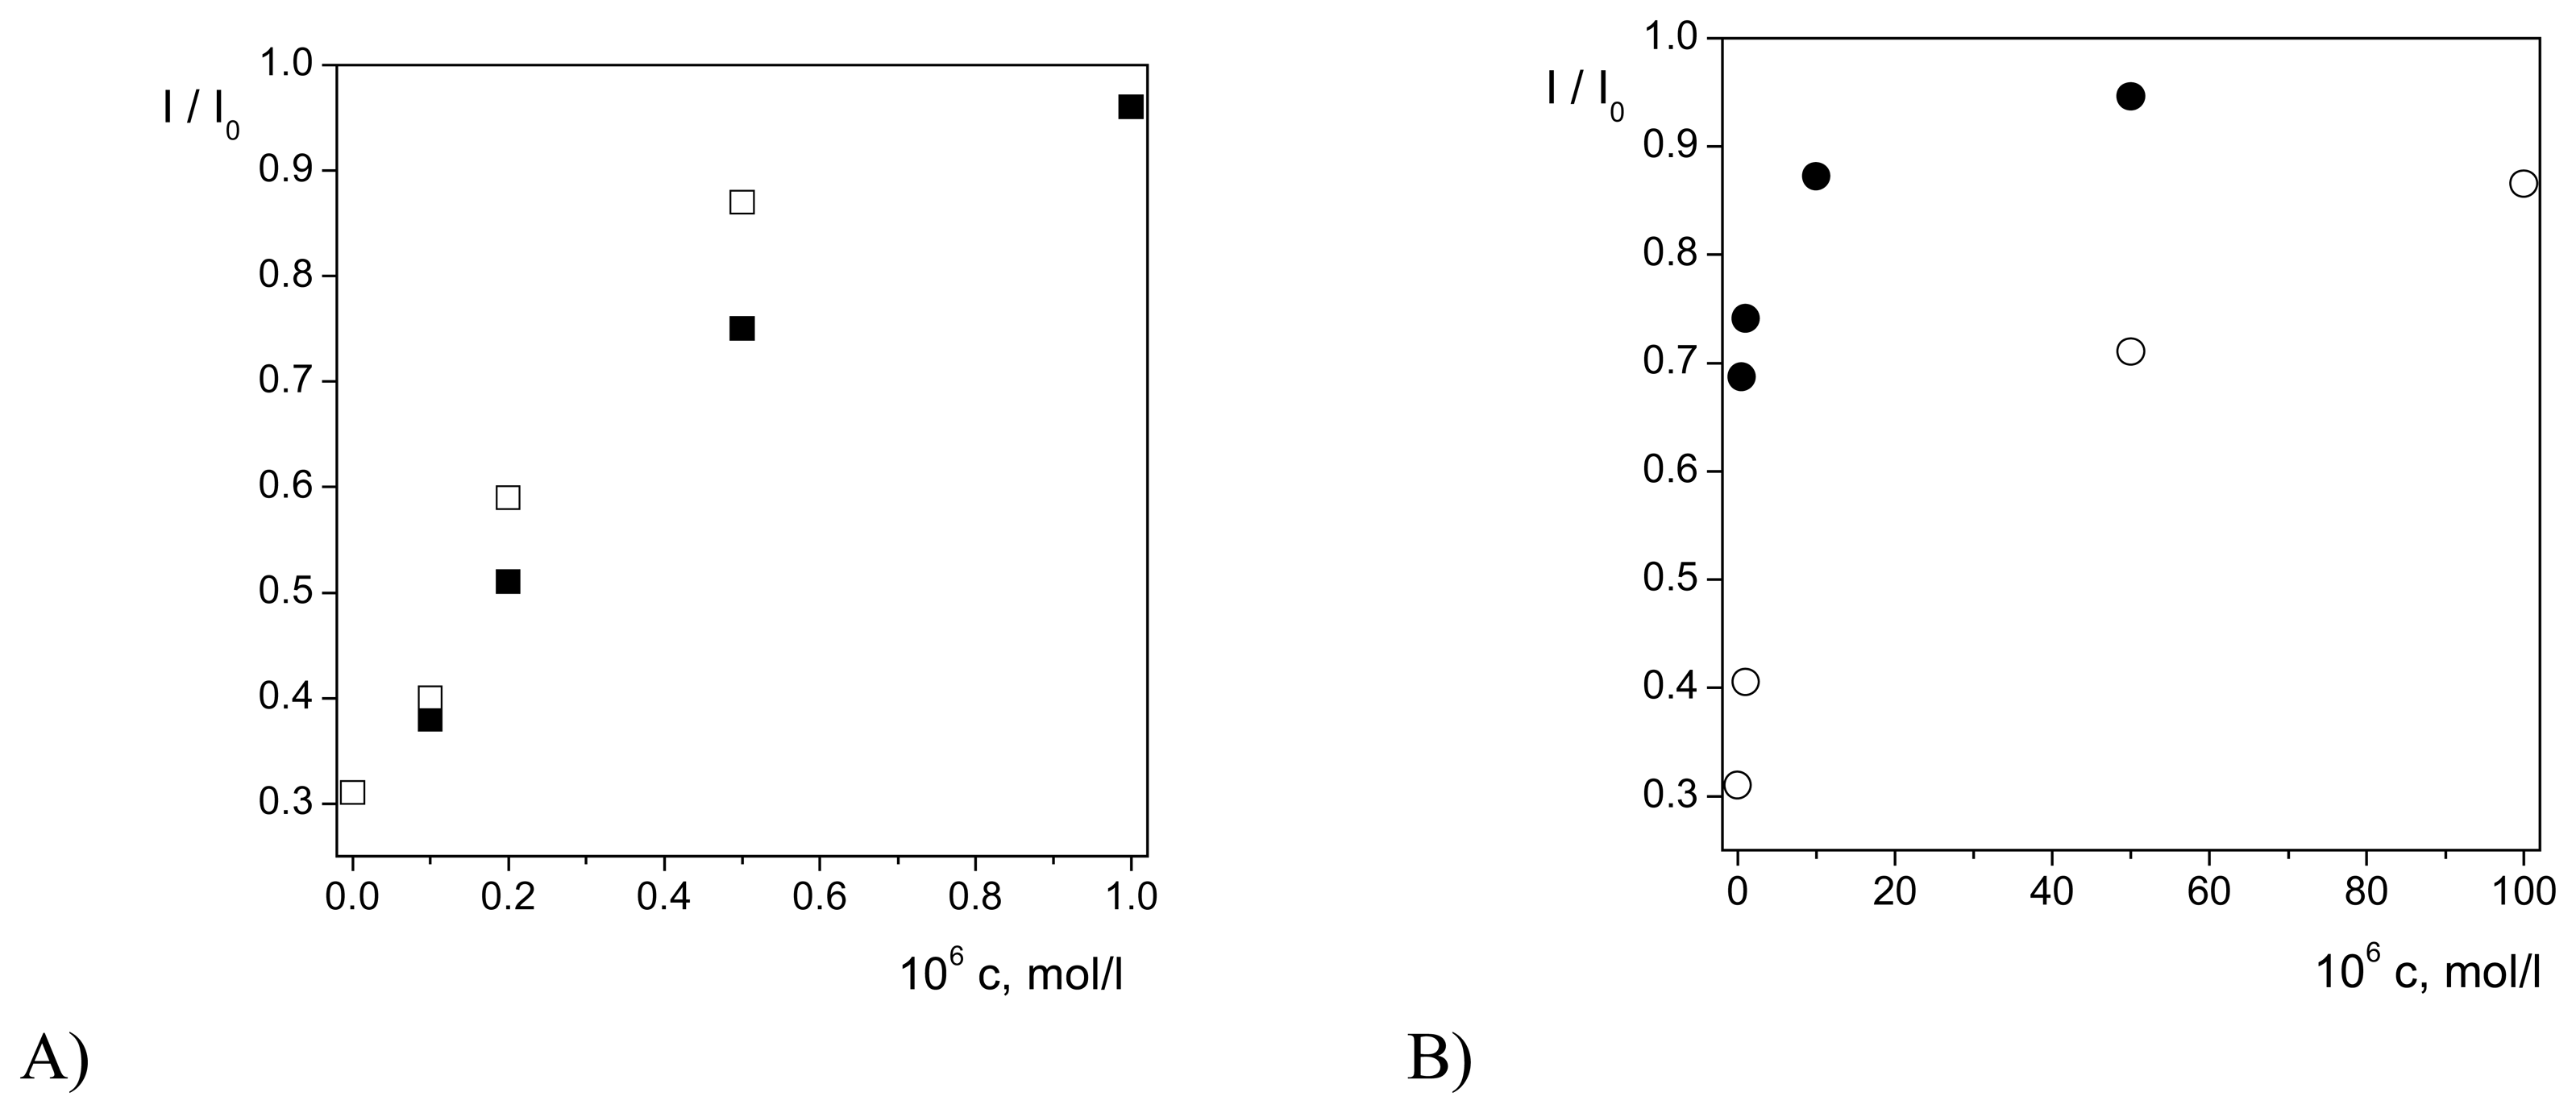
Antioxidative Effects of Flavonoids

Damage to DNA was evaluated by means of the relative signal I/I0 of the DNA indicator [Co(phen)3]3+, where I and I0 are its DPV peak current obtained in experiments with and without cleavage agent as it was described previously [11]. The indicator was accumulated at the sensor and its voltammograms were recorded always at room temperature only. Typical DPV curves of the [Co(phen)3]3+ at the bare and DNA modified CPEs used are shown in Fig. 2. Repeatability of measurement was characterized by the following values of relative standard deviation of 6.3 % for CPE and 3,5 % DNA/CPE (n = 10). An effective preconcentration of the indicator within DNA can be seen from the peak current values. A negative Ep shift at the DNA/CPE comparing to the CPE confirms predominantly electrostatic interaction with DNA in 5 mmol/l buffer solution [9, 26]. Hence, [Co(phen)3]3+ can indicate nondegraded dsDNA on the sensor surface even when some rests of the intercalated flavonoids would be present in DNA.
A mixture of 5× 10⁻⁷ mol/l Cu(II) complex with 1,10-phenathroline, 10 mmol/l hydrogen peroxide and 1 mmol/l ascorbic acid was used as the DNA cleavage system. Concentrations of all components were optimized to obtain a detectable degree of the DNA degradation within 5 and 10 min. In the absence of some of the constituents of the cleavage mixture, no indicator signal change was observed. Fig. 3a represents a portion of nondegraded DNA after incubation of the nonheated or electrically heated sensor in the cleavage mixture without flavonoid. It is seen that enhanced temperature promotes the process of DNA damage similarly as it was found in [14]. This effect was explained by an enhancement of the DNA degradation reaction rate rather than a change in association of DNA with the copper(II) based chemical nuclease [14].
Antioxidative properties of flavonoids as the components of a cleavage mixture have been examined using the same procedure. A protecting effect of individual phytochemicals towards DNA can be deduced from significantly higher [Co(phen)3]3+ signal comparing to the experiments without flavonoids. The antioxidative effect of flavonoids increases dramatically with the temperature of the DNA/CPE sensor. Fig. 3 b,c shows results obtained in the presence of quercetin and epigallocatechin gallate at various sensor temperatures.
A degree of the DNA protection depends on the concentration of the flavonoid in the cleavage mixture (Fig. 4). According to a signal saturation level, antioxidative capacity of flavonoids under study can be expressed as follows: rutin > quercetin > epigallocatechin gallate ≫ catechin. No prooxidative effects of flavonoids to DNA have been observed at the concentrations used. This is in agreement with a recent investigation of flavonoids effects at the DNA modified screen-printed electrode where a prooxidative behaviour was found only at high concentration of the phytochemicals [27].

Conclusions

Flavonoids under study were found to associate with dsDNA confined to the CPE surface. This interaction is, however, not stimulated by electrode heating and flavonoids can be remote from the DNA layer in blank buffer solution. A concentration dependent antioxidative effect of flavonoids in the DNA cleavage mixture was detected using the DNA/CPE sensor. Heating the carbon paste electrode with immobilized DNA during its incubation in the cleavage mixture enhances significantly the sensitivity of the detection of both damage to DNA and protection of DNA by flavonoid antioxidants. The approach described here can be used advantageously for the simple and fast determination of prooxidative as well as antioxidative effects of various complex agents and individual chemicals of environmental, food and medical interest.

Acknowledgments

This work was supported by the Grant Agency VEGA of the Slovak Republic (Grant No. 1/9253/02) and the “Deutsche Forschungsgemeinschaft (DFG)” (GRK 45/3).

References

  1. Haliwell, B. Food Sci. Agric. Chem. 1999, 1, 67.
  2. Labuda, J.; Bučková, M.; Jantová, S.; Štepánek, I.; Surugiu, I.; Danielsson, B.; Mascini, M. J. Anal. Chem. 2000, 367, 364.
  3. Mascini, M.; Palchetti, I.; Marrazza, G. Fres. J. Anal. Chem. 2001, 369, 15.
  4. Erdem, A.; Ozsoz, M. Electroanalysis 2002, 14, 965.
  5. Oliveira-Brett, A. M.; Vivan, M.; Fernandes, I. R.; Piedade, J. A. P. Talanta 2002, 56, 959.
  6. Wang, J.; Kawde, A. N. Anal. Chim. Acta 2001, 431, 219.
  7. Palecek, E.; Fojta, M. Anal. Chem. 2001, 73, 74A.
  8. Kubičárová, T.; Fojta, M.; Vidic, J.; Havran, L.; Paleček, E. Electroanalysis 2000, 12, 1422.
  9. Labuda, J.; Bučková, M.; Vaníčková, M.; Matusch, J.; Wenrich, R. Electroanalysis 1999, 11, 101.
  10. Bučková, M.; Labuda, J.; Šandula, J.; Križková, L.; Štěpánek, I.; Ďuračková, Z. Talanta 2001, 56, 939.
  11. Labuda, J.; Buckova, M.; Heilerova, L.; Caniova-Ziakova, A.; Brandsteterova, E.; Mattusch, J.; Wennrich, R. Sensors 2002, 2, 1.
  12. Gründler, P.; Kirbs., A. Electroanalysis 1999, 11, 223.
  13. Gründler, P. Fresenius J. Anal. Chem. 2000, 367, 324.
  14. Korbut, O.; Bučková, M.; Tarapčik, P.; Labuda, J.; Griindler, P. J. Electroanal. Chem. 2001, 506, 143.
  15. Puppo, A. Phytochemistry 1992, 31, 85.
  16. Ferguson, L. R. Mut. Res. 2001, 475, 89.
  17. Ohsima, H.; Yoshie, Y.; Auriol, S.; Gilibert, I. Free Rad Bio Med 1998, 25, 1057.
  18. Yamashita, N.; Tanemura, H.; Kawanishi, S. Mutat Res 1999, 425, 107.
  19. Johnson, M. K.; Loo, G. Mutat. Res. 2000, 459, 211.
  20. Anderson, R. F.; Fisher, L. J.; Hara, Y.; Harris, T.; Mak, W. B.; Melton, L. D.; Packer, J. E. Carcinogenesis 2001, 22, 1189.
  21. Griindler, P. Fres. J. Anal. Chem. 1998, 362, 180.
  22. Dollimore, L. S.; Gillerd, R. D. J. Chem. Soc. 1973, 933.
  23. Oliver, A. Electrochim. Acta 1992, 37, 1945.
  24. Zerihun, T.; Gruendler, P. J. Electroanal. Chem. 1996, 404, 243.
  25. Wang, J.; Rivas, G.; Luo, D.; Cai, X.; Valera, F. S.; Dontha, N. Anal. Chem. 1996, 68, 4365.
  26. Pang, D.-W.; Abruna, H.D. Anal. Chem. 1998, 70, 3162.
  27. Labuda, J.; Bučková, M.; Heilerová, L.; Šilhár, S.; Štepánek, I. Anal. Bioanal. Chem. submitted.
  • Sample Availability: Available from the authors.
Figure 1. DP voltammograms of the flavonoids measured at CPE (1) and DNA/CPE (2) after 5 min accumulation at open circuit in solution of 5× 10⁻⁷ mol/l quercetin (A), 5× 10⁻⁷ mol/l rutin (B), 5× 10⁻⁵ mol/l catechin (C) and 5× 10⁻⁶ mol/l epigallocatechin gallate (D). Conditions: 5 mmol/l phosphate buffer solution pH 7.0 with 1 % DMSO, pulse amplitude 100 mV, scan rate 25 mV/s, room temperature of 22 °C.
Sensors 03 00001f1
Figure 2. DP voltammograms of 5× 10⁻⁷ mol/l [Co(phen)3]3+ measured at CPE (1) and DNA/CPE (2) after 120 s accumulation of the indicator at open circuit and room temperature. Other conditions as in Figure 1.
Sensors 03 00001f2
Figure 3. Dependence of the relative Co(phen)3]3+ signal on the DNA/CPE incubation in the cleavage mixture of 5× 10⁻⁷ mol/l [Cu(phen)2]2+,1×10-3 mol/l ascorbic acid and 1× 10⁻² mol/l H2O2 without flavonoid (A), with 5× 10⁻⁷ mol/l quercetin (B) and 1× 10⁻⁶ mol/l epigallocatechin gallate (C). DNA/CPE heated to 20 °C (○,●), 27 °C (□,▪) and 38 °C (△,▴). Other conditions as in Figure 2.
Sensors 03 00001f3
Figure 4. Dependence of the relative [Co(phen)3]3+ signal on the concentration of flavonoid. DNA/CPE incubated for 10 min at room temperature in a cleavage mixture of 5× 10⁻⁷ mol/l [Cu(phen)2]2+, 1× 10⁻³ mol/l ascorbic acid and 1× 10⁻² mol/l H2O2 and (A) quercetin (▪) or rutin (□), (B) epigallocatechin gallate (●) or catechin (○).Other conditions as in Figure 2.
Sensors 03 00001f4
Scheme 1. Structure of flavonoids under study.
Sensors 03 00001f5
Table 1. Basic DPV characteristics of flavonoids measured at unheated and heated (38 °C) CPE and DNA/CPE (A) after 120 s electrode treatment in solution of flavonoid in 5 mmol/l phosphate buffer pH 7.0 with 1 % DMSO, (B) medium exchange for the same blank electrolyte, (C) conditioning the electrode in blank 50 mmol/1 phosphate buffer for 5 min and (D) conditioning the electrode in blank 50 mmol/1 phosphate buffer for another 5 min. Conditions: pulse amplitude of 100 mV, pulse duration of 40 ms, scan rate of 25 mV/s.
FlavonoidUnheated electrodeHeated electrode (t = 38 °C)
CPEDNA/CPECPEDNA/CPE
Ip, μAEp,mVIp, μAEp,mVIp, μaEp,mVIp, μAEp,mV
5× l0-7 mol/l QuercetinA0.8250.1771.2330.1990.7630.1771.4880.196
B0.2590.1770.5930.1990.2400.1880.4500.199
C0.0720.1990.1710.2100.0960.2030.1880.214
D0.0360.2030.0810.2140.0680.2030.1210.217
5× 10⁻⁷ mol/l RutinA1.9650.2801.6230.2912.7270.2692.1530.280
B1.8970.2761.5340.2912.4150.2761.7680.287
C0.9360.2830.8400.2941.6970.2831.1600.294
D0.5390.2830.6390.2941.1470,2870.8790.298
5× 10⁻⁶ mol/l Epigallocatechin gallateA0.3410.2100.7940.2280.3810.1960.8920.214
B0.0770.2250.1450.2390.1090.2210.1850.232
C0.0330.2430.0350.2540.0260.2430.0440.250
D0.0220.2450.0200.2560.0120.2440.0210.252
5×10⁻⁵ mol/l CatechinA0.5580.2250.6700.2280.8910.2141.1120.214
B0.3430.2250.4290.2250.4540.2170.6040.217
C0.2480.2250.3130.2280.3120.2280.4100.232
D0.2080.2280.2750.2280.2690.2280.3640.232

