A Ceramic Thick Film Humidity Sensor Based on MnZn Ferrite

Microelectronics and Semiconductor Research Group, ECE Department, National Technological Park, University of Limerick, Limerick, Ireland
*
Author to whom correspondence should be addressed.
Sensors 2002, 2(2), 50-61; https://doi.org/10.3390/s20200050
Submission received: 6 February 2002
/
Accepted: 8 February 2002
/
Published: 22 February 2002
Abstract
:A ceramic thick film humidity sensor, produced from MnZn ferrite, is presented. The proposed sensing mechanism is a combination of proton hopping, hydronium diffusion, and vacancy donor traps releasing electrons into the conduction band. The sensor structure comprises a two-layer device; the first layer is an interdigitated conductor and the second layer is a 30μm thick sensing layer. The effects of sintering the sensing pastes in air and vacuum have been reported. The air-fired sample exhibits the highest humidity sensitivity (1.54%/RH%) and the lowest temperature sensitivity (0.37%/°C). The vacuum-fired sample has the lowest humidity sensitivity (0.043%/RH) and the highest temperature sensitivity (0.77%/°C). The sensitivity results indicate that the air-fired sample has the best potential for use in humidity sensing applications.
Introduction
Humidity is a constant environmental factor affecting many industries and technologies [1]. Therefore, it is important to be able to accurately monitor the correct levels of humidity in the atmosphere. There are three groups of materials used as humidity sensors: electrolytes, organic polymers and ceramics [1]. In general, commercially developed humidity sensors are mainly made of polymer films and ceramics [2]. Ceramics have the advantage of better mechanical, thermal and chemical stability. The ceramic materials previously studied include TiO2 [3], MgAl2O4 [4], ZnCr2O4 [5], α-hematite [6] and Sr(Sn, Ti)O3 [7]. This paper concentrates on the development of a ceramic thick film sensor, based on MnZn ferrite, using thick film technology. Thick film technology has always been desirable for the production of humidity and gas sensors as it offers the possibility of reproducible sensor manufacture, which is essential for a defined microstructure [1]. All of these parameters are important in the production of a good, reliable humidity sensor [8].
Results and Discussion
Sintering Conditions
The effects of sintering the MnZn ferrite pastes in air and vacuum have both been investigated. The sintering in air was conducted using a 6-zone belt furnace, according to the four different settings described in table 1. The belt speed was set at one inch/minute to allow the pastes to adjust to the changing temperature. Firing in vacuum was conducted using a vacuum tube furnace. The settings are shown in table 2. Initially, the pastes were heated in air at a ramp rate of 5°C/minute. There was a dwell time of 15 minutes while the vacuum was being created. The pastes were then sintered in vacuum at the same ramp rate.

| Zone1/°C | Zone2/°C | Zone3/°C | Zone4/°C | Zone5/°C | Zone6/°C | |
|---|---|---|---|---|---|---|
| 1 st | 200 | 250 | 400 | 400 | 350 | 300 |
| 2 nd | 250 | 350 | 600 | 600 | 550 | 500 |
| 3 rd | 400 | 550 | 700 | 700 | 600 | 500 |
| 4 th | 400 | 600 | 800 | 800 | 600 | 650 |
| Air/°C | Air/°C | Vacuum/°C | Vacuum/°C | Vacuum/°C | |
|---|---|---|---|---|---|
| 1 st | 25 | 600 | 1250 | 1250 | 25 |
| 2 nd | 25 | 500 | 1100 | 1100 | 25 |
| 3 rd | 25 | 400 | 900 | 900 | 25 |
| 4 th | 25 | 300 | 600 | 600 | 25 |
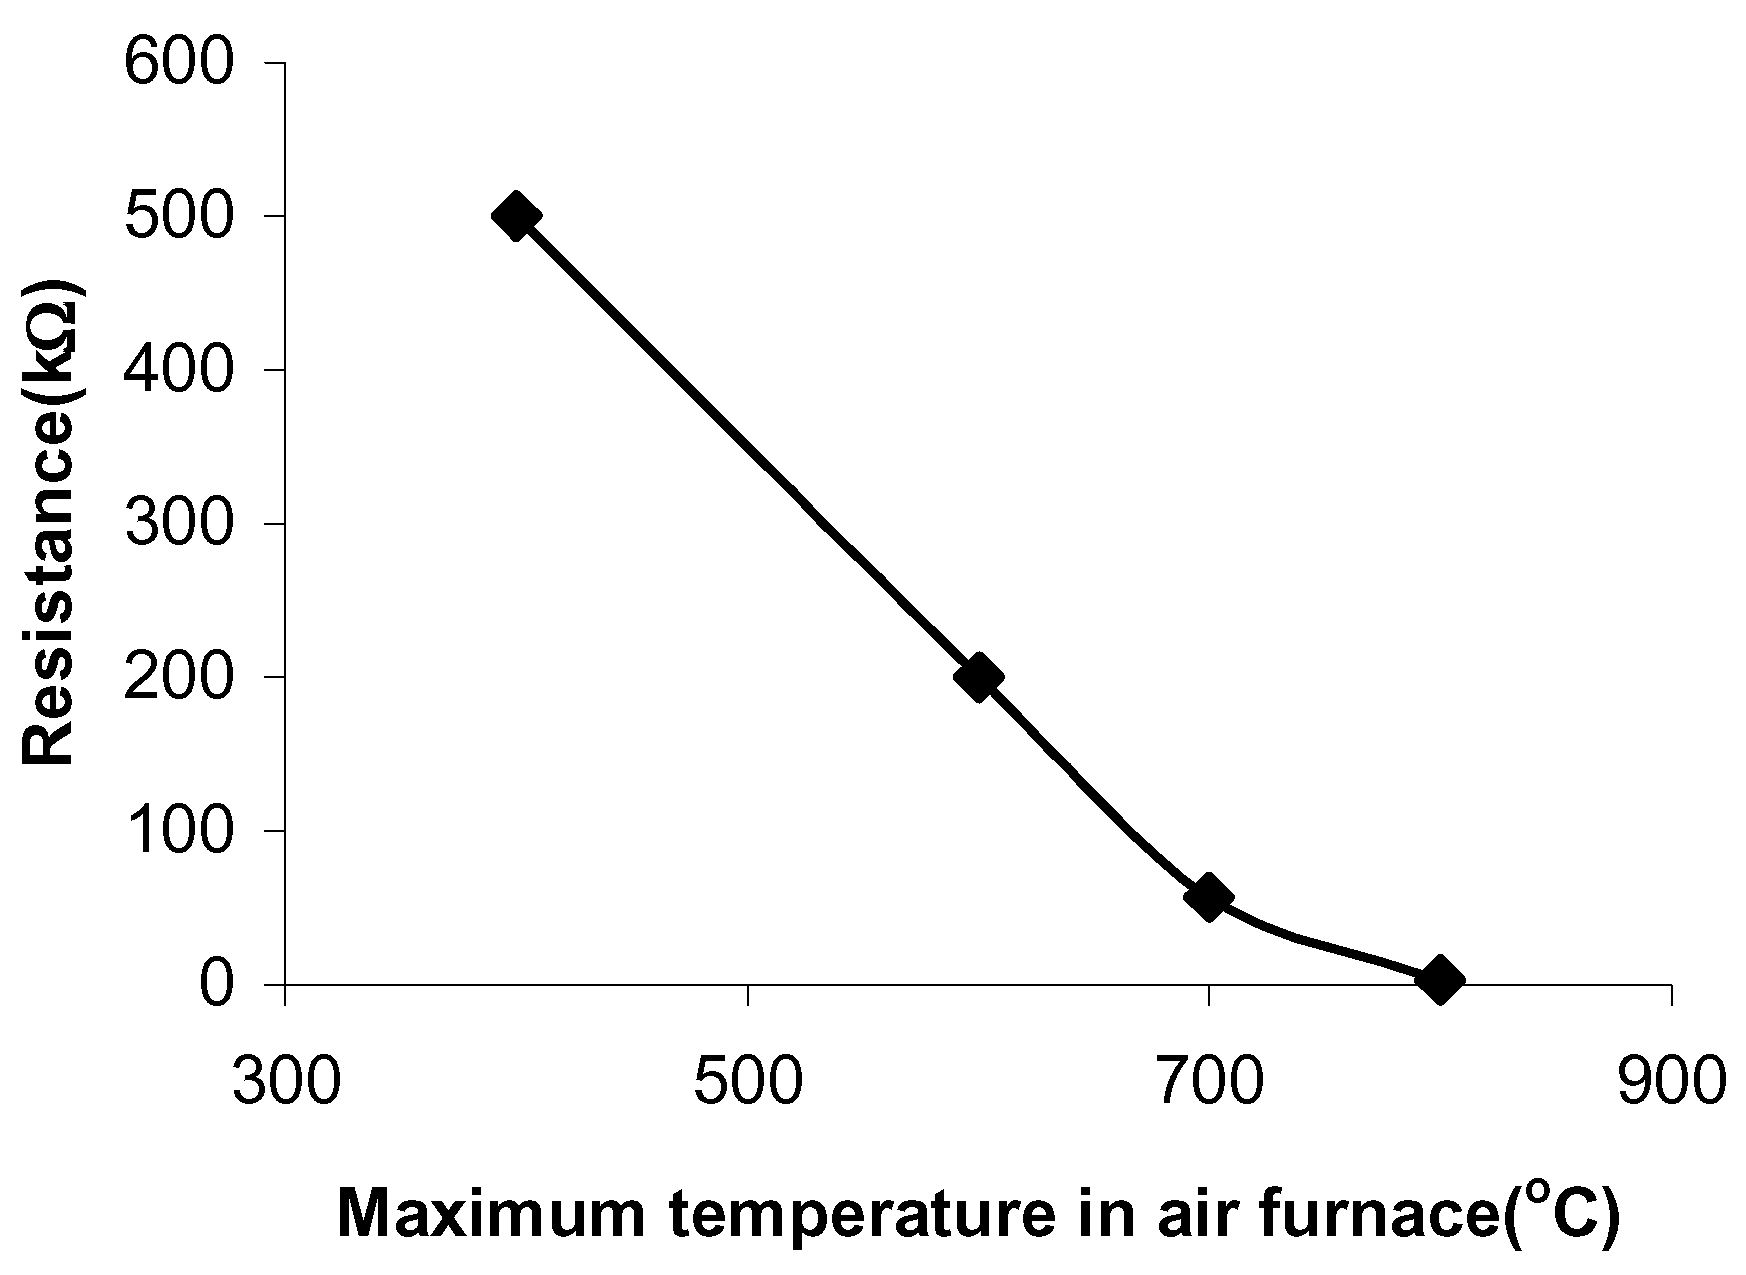
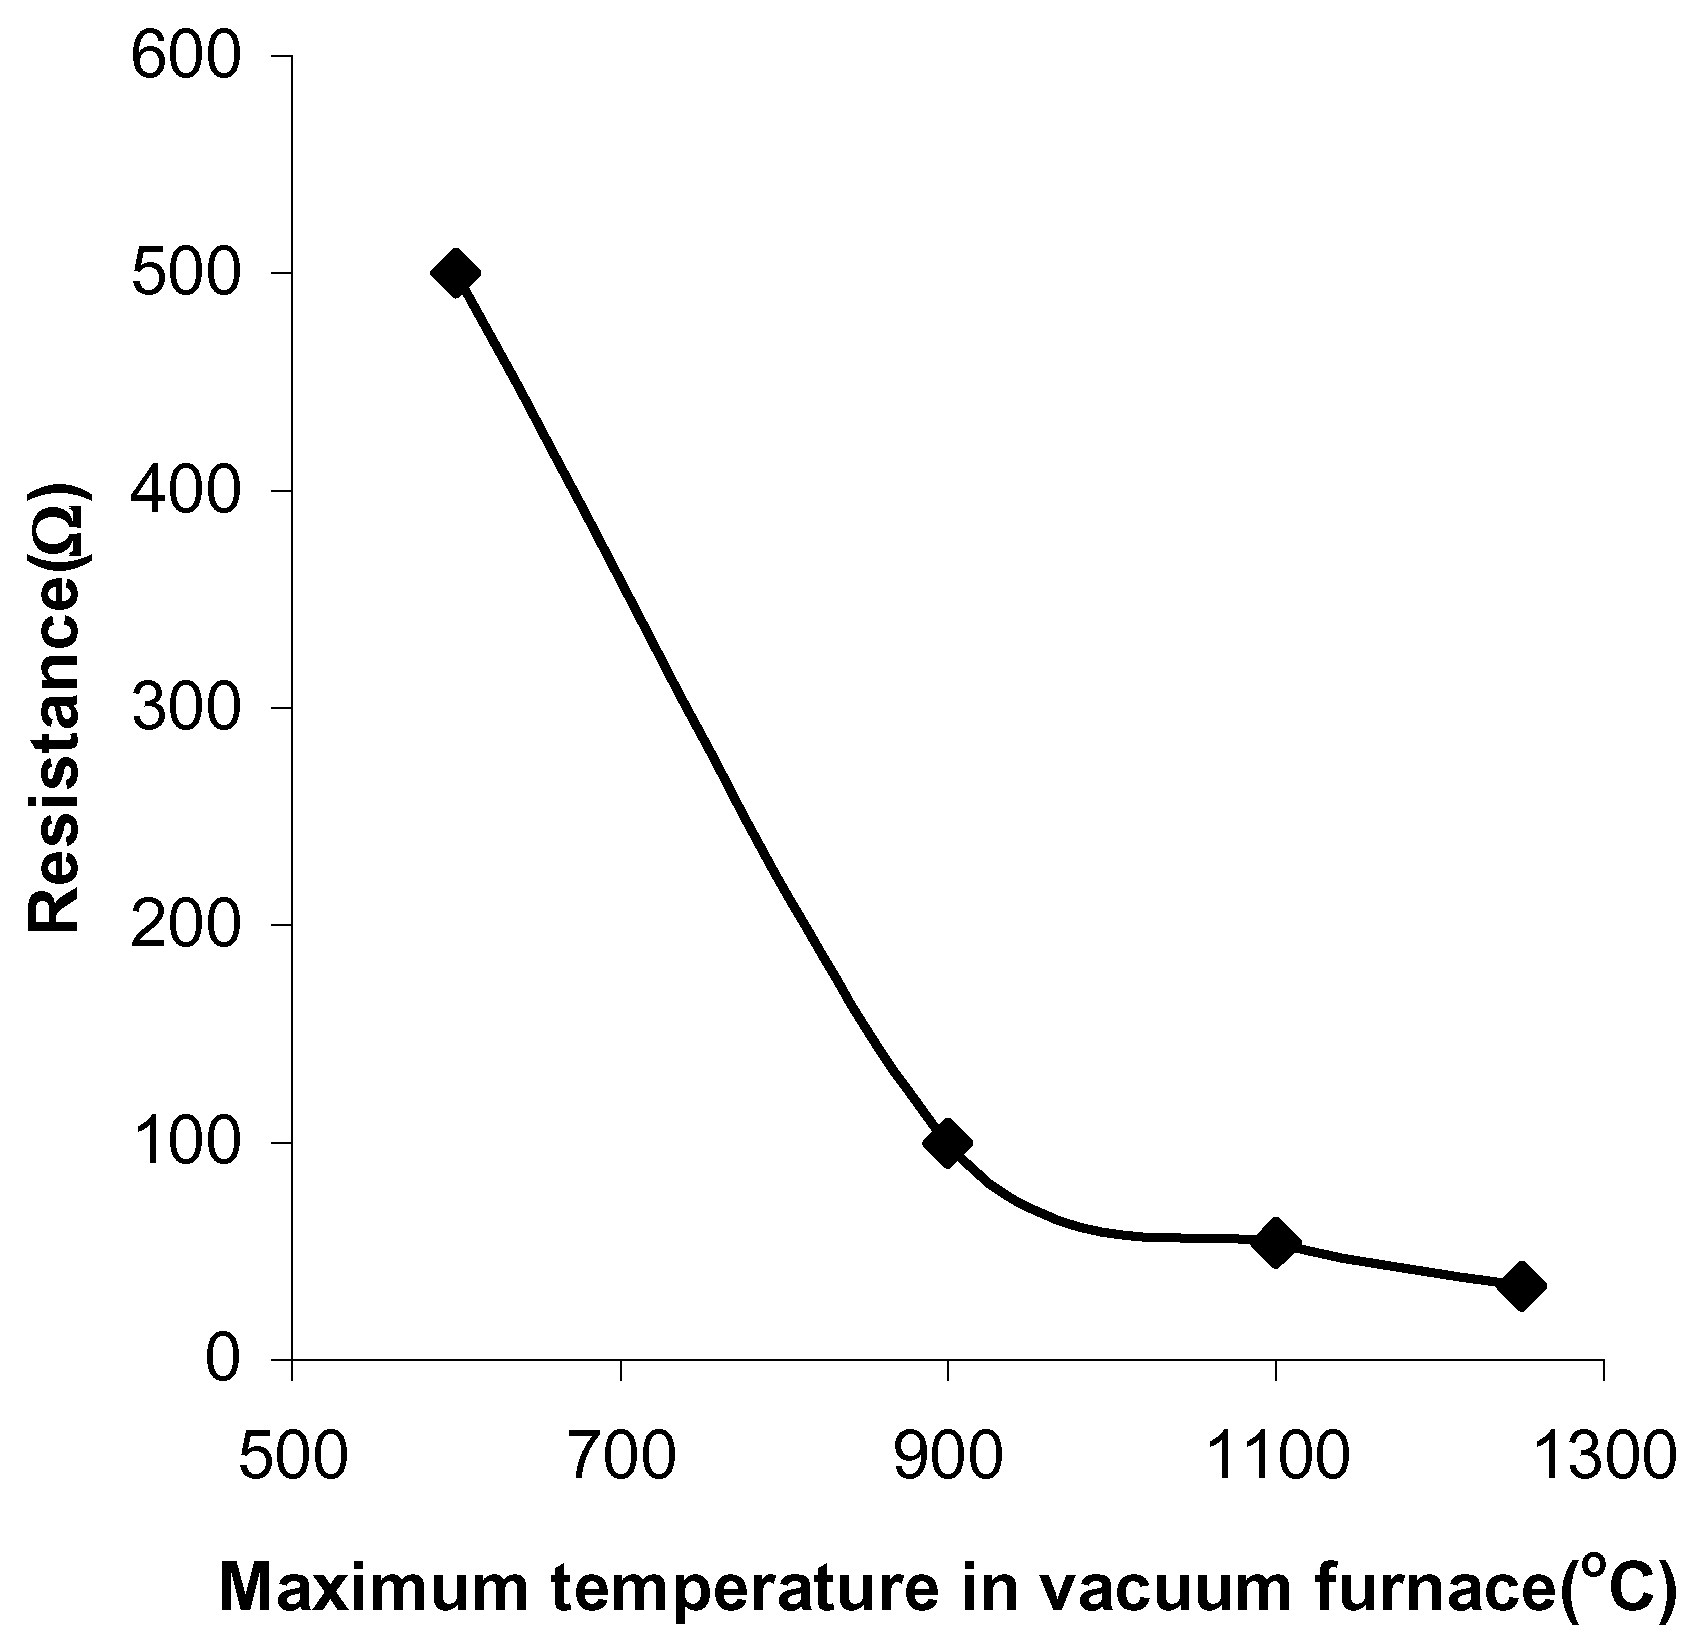
The pastes sintered in air have a resistance of 500kΩ, when fired at 400°C and a resistance of 3kΩ, when fired at 800°C (Figure 1). The pastes sintered in vacuum have a resistance of 500Ω at a firing temperature of 600°C and a resistance of 34Ω at a firing temperature of 1250°C (Figure 2).
The pastes sintered in vacuum have shown a higher conductivity than those sintered in air. In general, firing in a reducing atmosphere increases the conductivity of most oxides due either to the production of oxygen vacancy donor states, which increases the density of states in the conduction band, or to the removal of surface oxygen traps, leading to a decrease in the number of conduction electrons being trapped. A low resistance device is commonly required for electronic circuit compatibility.
Figure 1.
The paste resistances at different sintering temperatures in air.

Figure 2.
The paste resistances at different sintering temperatures in vacuum.

Temperature Sensitivity
The response of the sensor samples to increasing temperatures has been investigated. Temperature is an important interfering variable to document when measuring humidity. Humidity sensitive films are notorious for being temperature sensitive and usually require some form of temperature compensation. In general, ceramic thick films display higher thermal stability than polymer films, hence the trend towards using ceramic humidity sensors [1]. The relative resistance of the samples decreased linearly with increasing temperatures over the range, 50-95°C.
This is in accordance with the relationship,
where R is the resistance, R0 is the initial resistance, Ea is the activation energy and k is Boltzmann’s constant.
The temperature response can be given in terms of the relative variation, ΔR, of the sensor resistance to a given temperature,
where R0 is the initial resistance of the sensor and Rt is the resistance at different temperatures. The calibration curves for the samples were obtained by plotting ΔR against the temperatures. Figure 3 shows the changes in ΔR against temperature. The sensitivity of the samples to the temperatures was determined from the slope of ΔR.
Figure 3.
Variation in relative resistance ΔR of the samples as a function of the increasing temperature values.
Figure 3.
Variation in relative resistance ΔR of the samples as a function of the increasing temperature values.

The results have shown that sample 1 has the highest sensitivity to temperature, 0.77%/°C and sample 2 has a lower sensitivity of 0.37%/°C.
Humidity Sensitivity
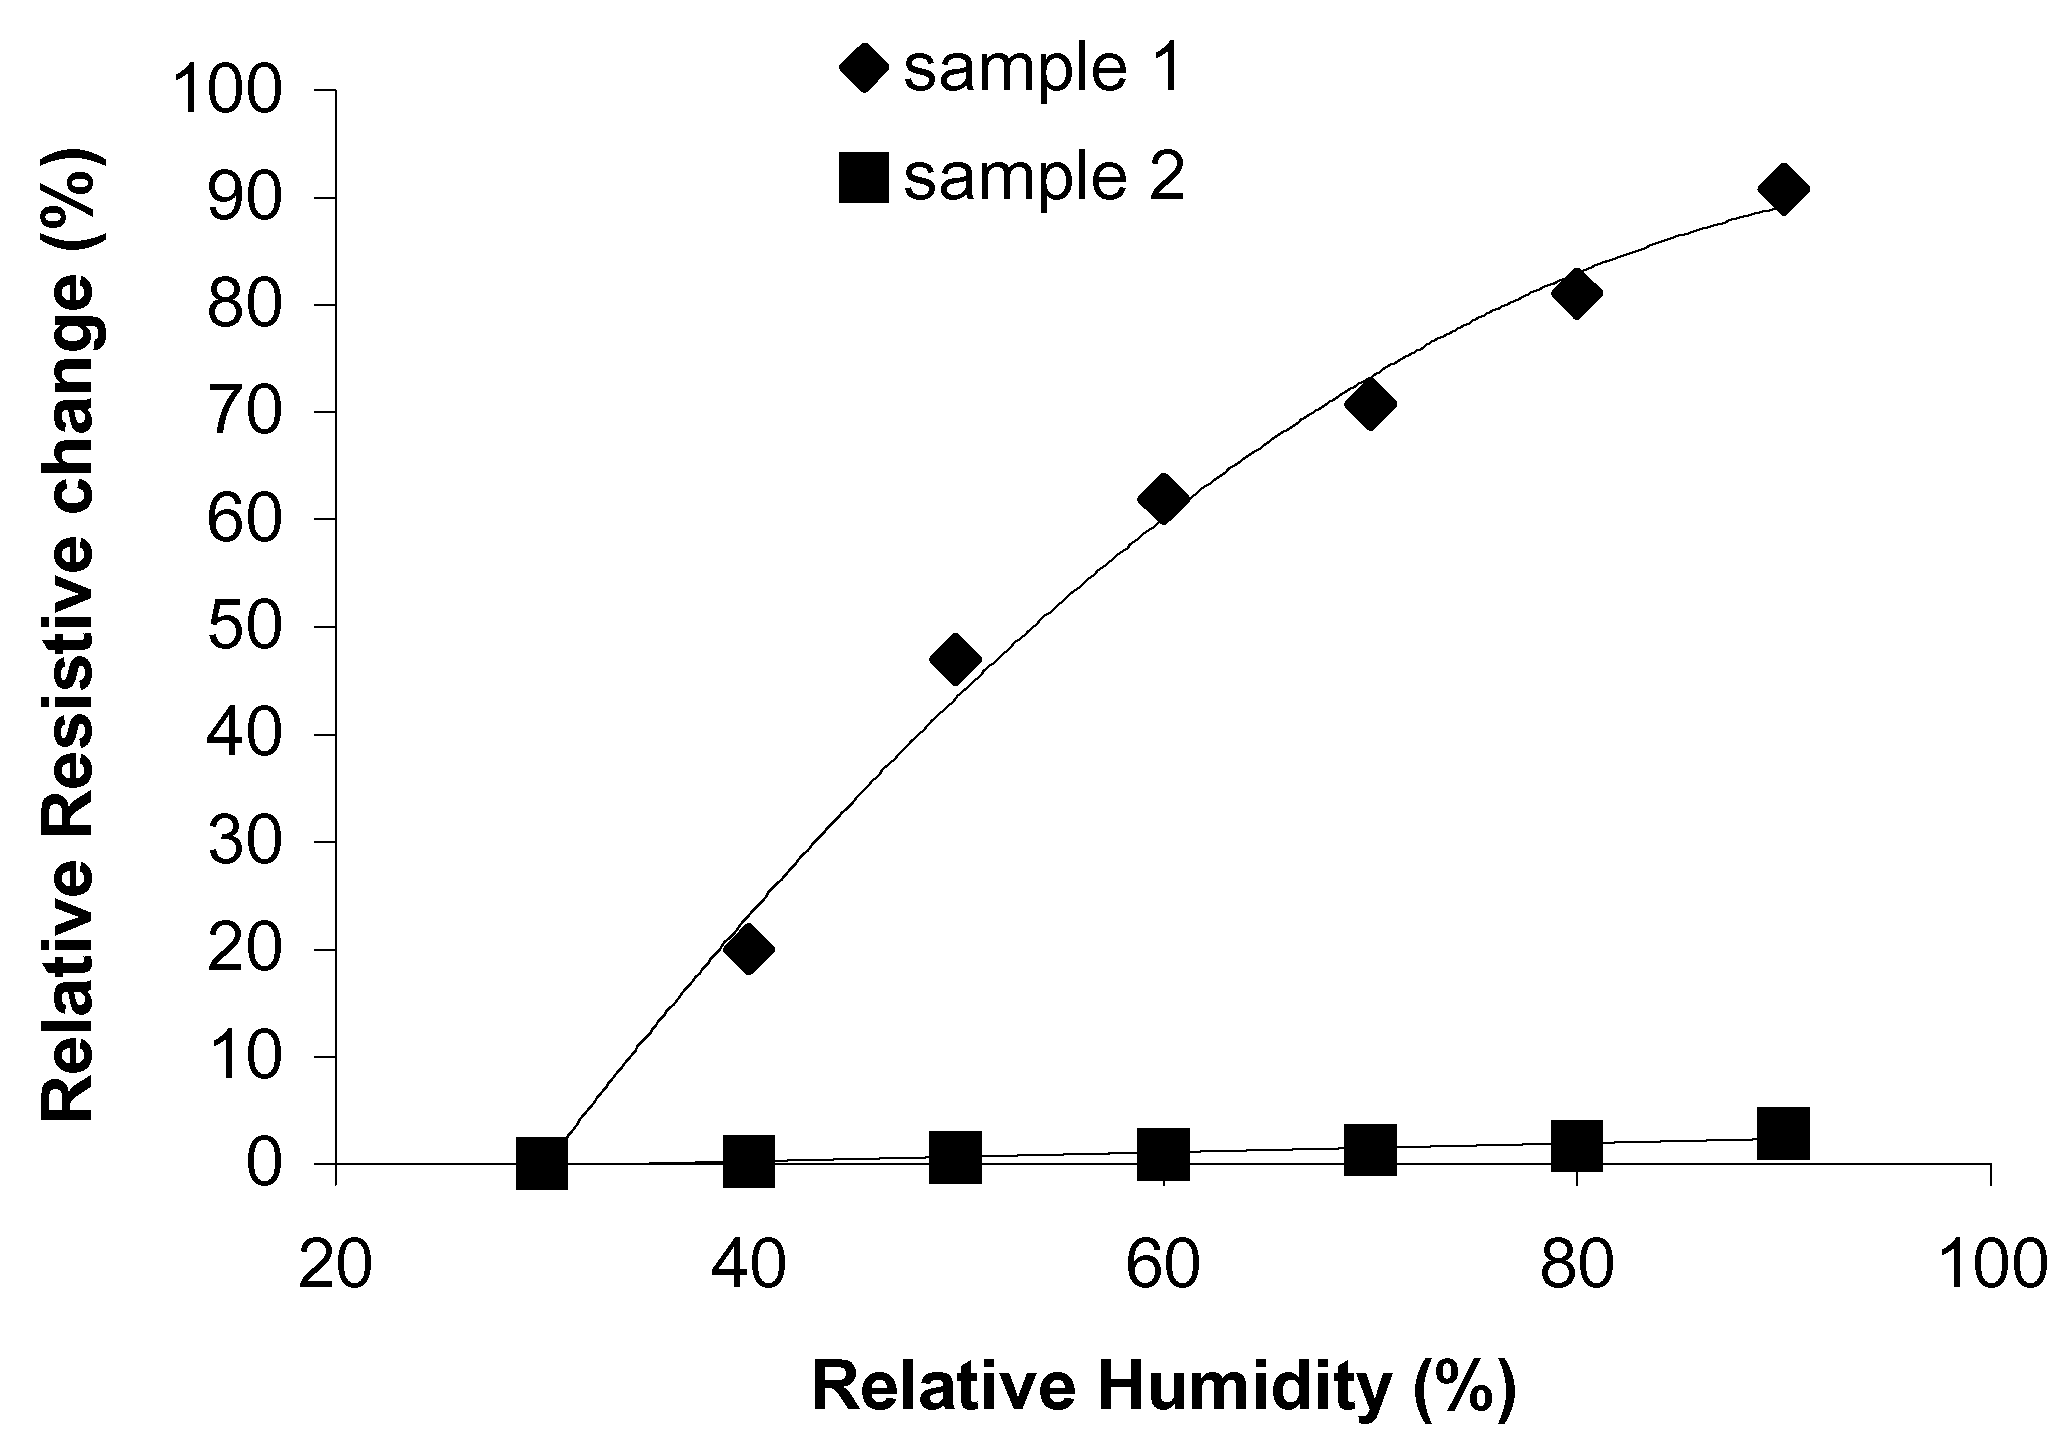
The humidity testing of the sensors was conducted using a dynamic humidity chamber. The humidity was increased from 30%RH to 95%RH in steps of 10%RH, at two different operating temperatures (30°C and 60°C). Since it takes around 20-30 minutes for the chamber to reach equilibrium, the readings are taken 30 minutes after a humidity setting has been changed. The humidity sensitivity is calculated in a similar manner to the temperature sensitivity. The changes in ΔR against the increasing relative humidity values are shown in Figure 4 and Figure 5. Overall, the sensitivity to humidity is greater at the lower operating temperature of 30°C, which could indicate that a room temperature operating temperature is sufficient.
Figure 4.
Variation in relative resistance ΔR of the samples as a function of the increasing relative humidity values, at 30°C.
Figure 4.
Variation in relative resistance ΔR of the samples as a function of the increasing relative humidity values, at 30°C.

Figure 5.
Variation in relative resistance ΔR of the samples as a function of the increasing relative humidity values, at 60°C
Figure 5.
Variation in relative resistance ΔR of the samples as a function of the increasing relative humidity values, at 60°C

The humidity results have indicated that sample 1 exhibits the highest humidity sensitivity, 1.7%/%RH and sample 2 has a much lower sensitivity, 0.036%/%RH. A reduction in humidity sensitivity normally occurs when a sample is fired in vacuum. This is because a parallel, non-humidity sensitive, conduction path has been added. For all the sensor samples a decrease in resistance is observed with increasing humidity levels.
At low relative humidity, water adsorption on the sample surface is likely the dominant factor for electronic conduction [9]. Adsorbed water increases the surface electrical conductivity of the ceramic due to the increased charge carrier, protons, in the ceramic/water system [8]. The conductivity is further increases by the presence of pores on the sample surface. In the first stage of water adsorption, a few water vapour molecules chemisorb on the grain surfaces by a dissociative mechanism to form two surface hydroxyls per water molecule. In this chemisorbed layer charge transport occurs by the hopping mechanism [8]. With increasing humidity levels, water is physisorbed on top of the chemisorbed layer. Conduction probably occurs by the Grotthus transport mechanism [10]. At these high humidity levels the layers of physisorbed water molecules tend to condense in capillary pores, with a radius below rk, the Kelvin radius, given by,
where P is the water-vapour pressure, Ps is the water vapour pressure at saturation, and γ, ρ and M are the surface tension, density and molecular weight of water, respectively. An electrolytic conduction in condensed water will take place in addition to the protonic transport in the physisorbed layers [11]. This succession of mechanisms leads to a rapid increase in conduction (decrease in resistance) with increasing humidity content.
The changes in the electronic conductance of the semiconductor in the presence of adsorbed water must also be considered. Water cannot directly inject a carrier into either the conduction or valence band of a metal oxide semiconductor [10]. A number of mechanisms have been suggested to account for the apparent electron donation from water molecules to oxides, including, non-dissociative adsorption with on electron donation, dissociative adsorption with one electron donation, and dissociative adsorption with two electron donation [12]. It has also been suggested that an indirect effect may occur involving the chemisorbed oxygen that has trapped a conduction band electron [13]. Adsorption of water displaces the oxygen, causing it to release the electron back into the conduction band, hence increasing the conductivity of the n-type semiconductor.
Drift
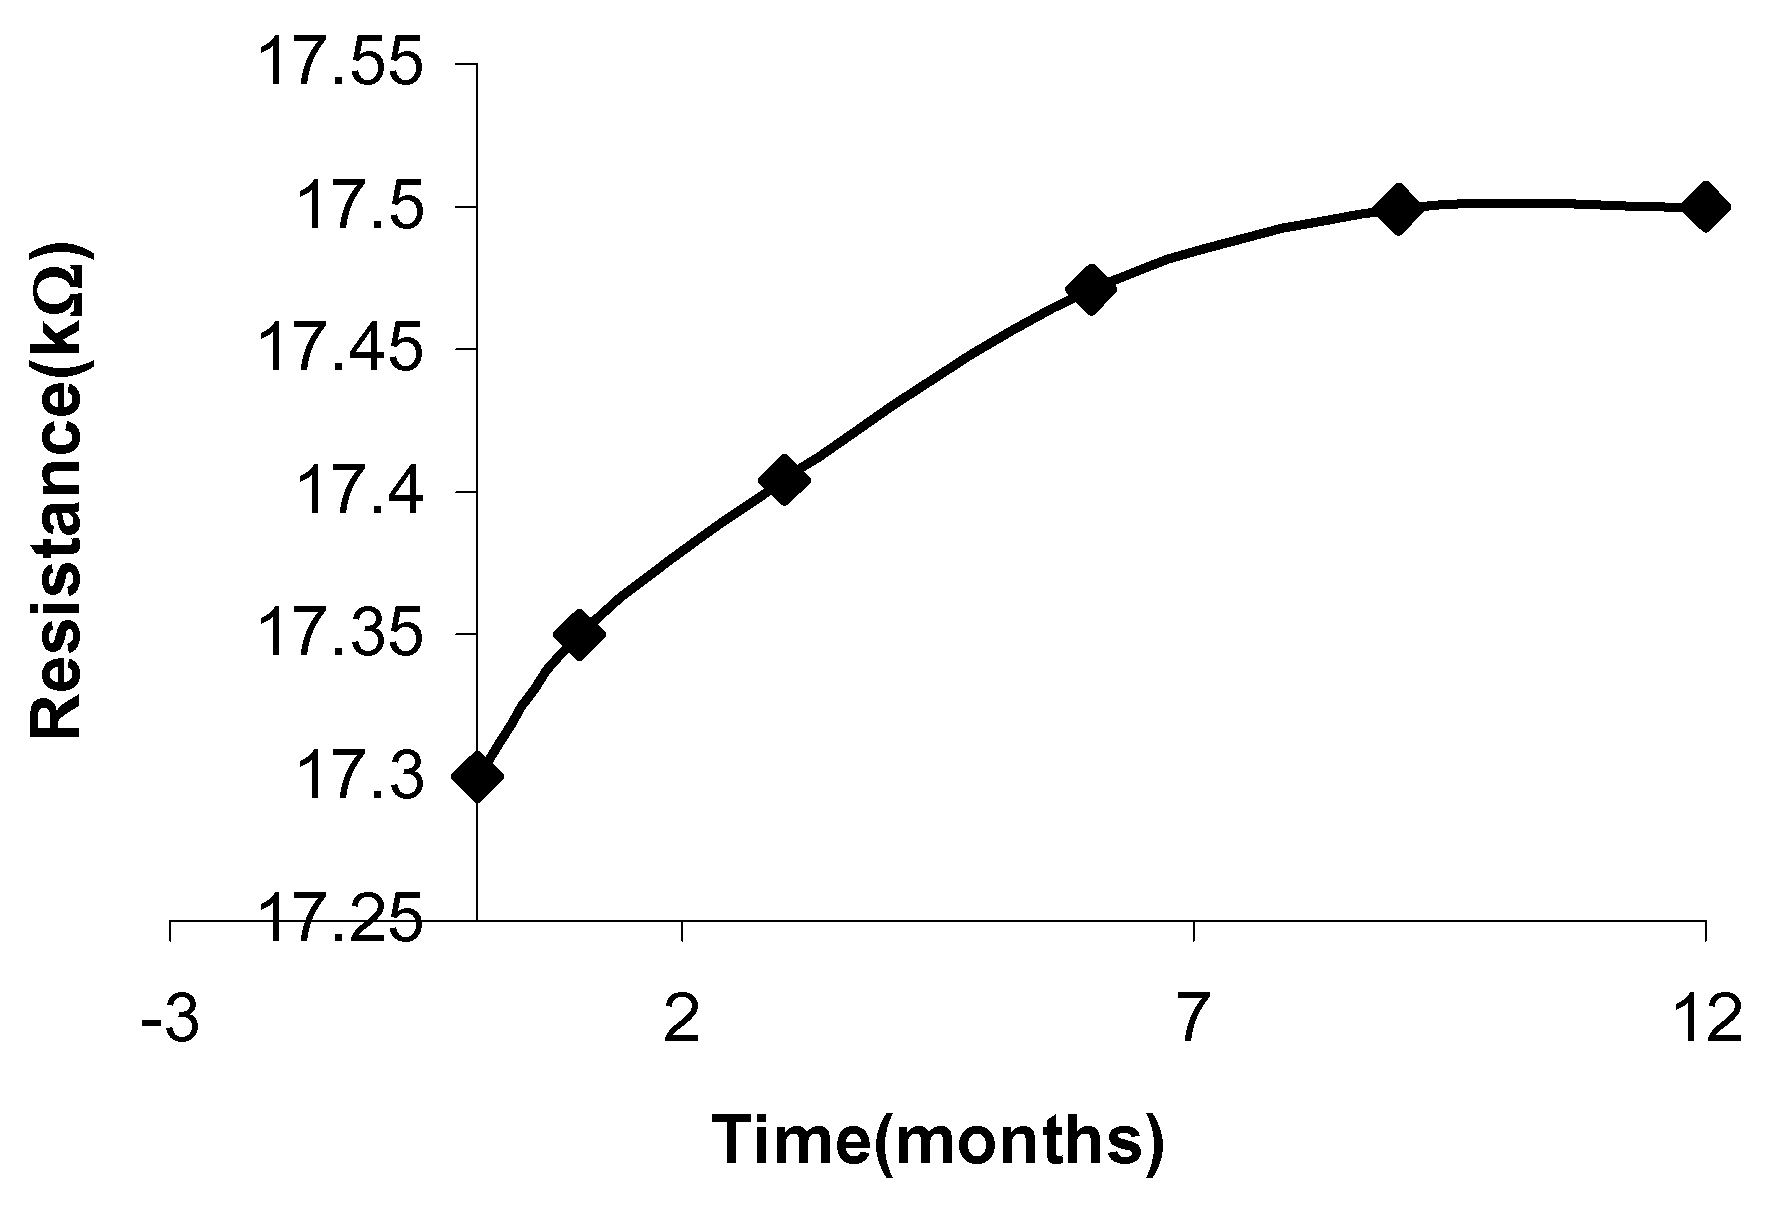
Humidity sensors tend to drift significantly when used over a long period of time, leading to an unstable device. A progressive drift in ceramic humidity sensors occurs due to the gradual formation of stable chemisorbed hydroxyl ions on the surface [14]. In order to determine the drift of the samples, they have been exposed to 50%RH and 80%RH at 60°C for 1 year (Figure 6 and Figure 7).
Figure 6.
Drift of Sample 1.

Figure 7.
Drift of Sample 2.
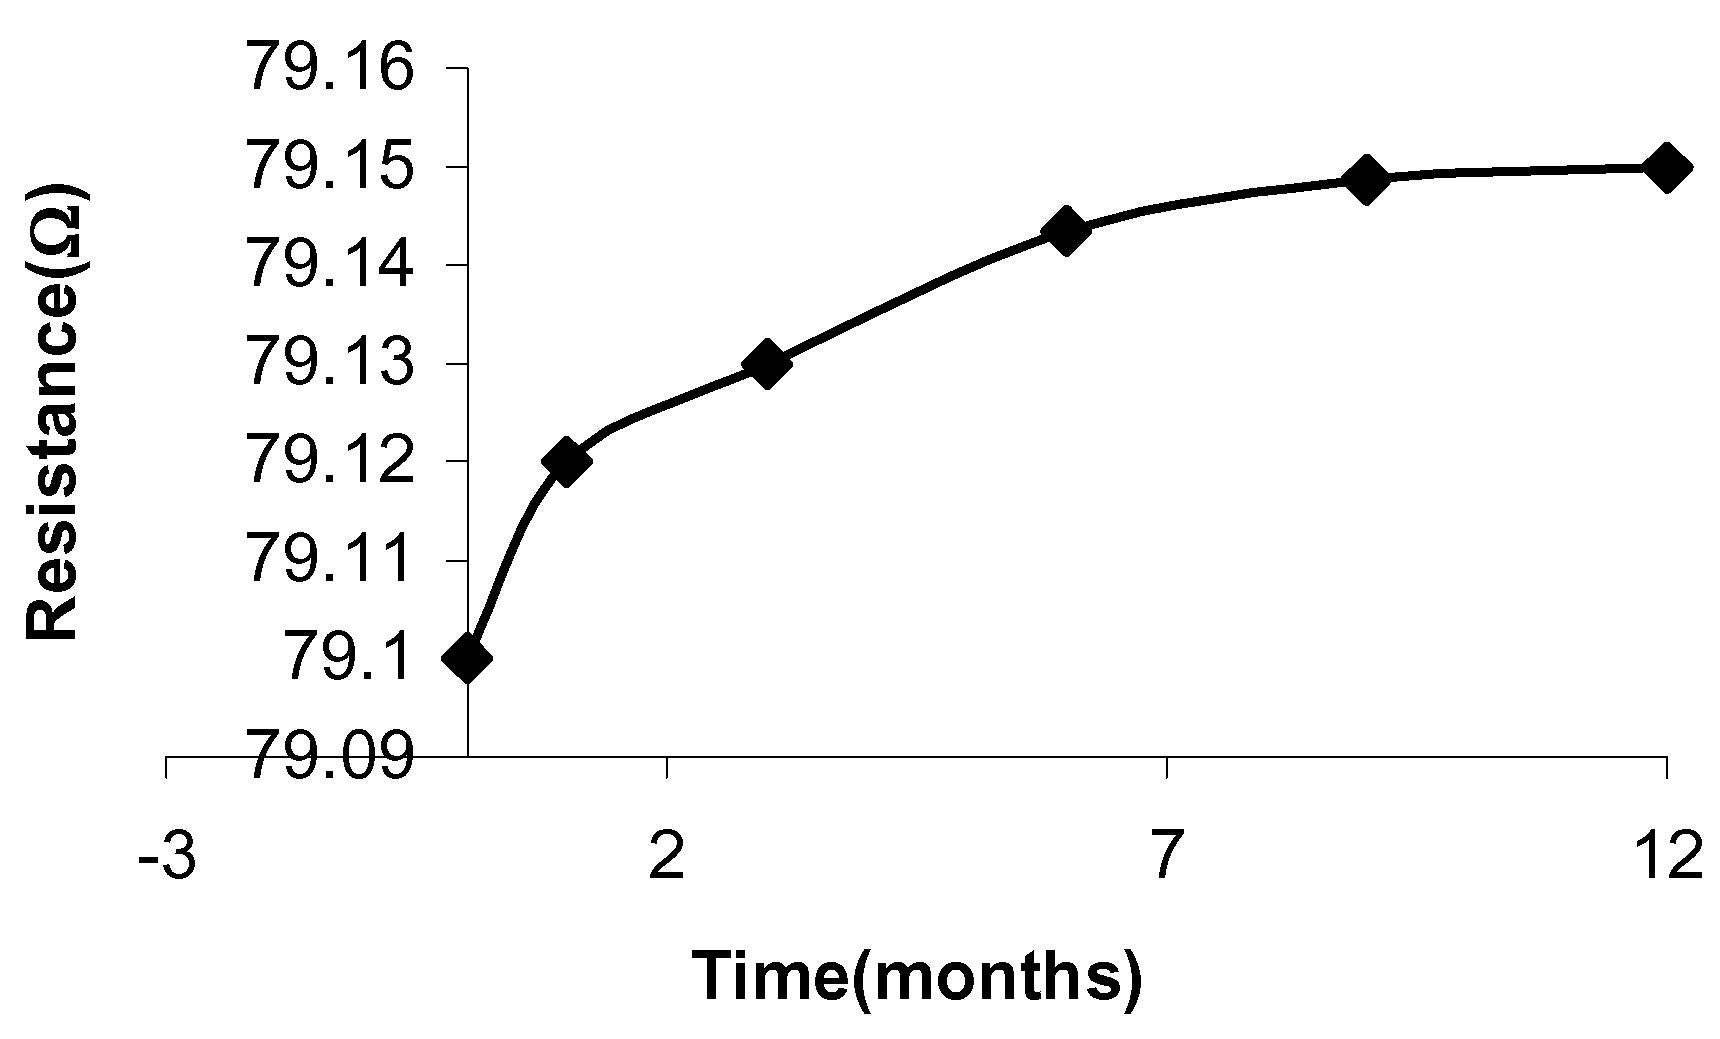
Sample 1 exhibits the highest stability; a drift of 1.87RH% has been recorded. Sample 2 has a relatively lower stability; a drift of 2.5RH% has been recorded. Drifts of 1%RH/yr to 3%RH are typical in commercial humidity sensors [15].
Hysteresis
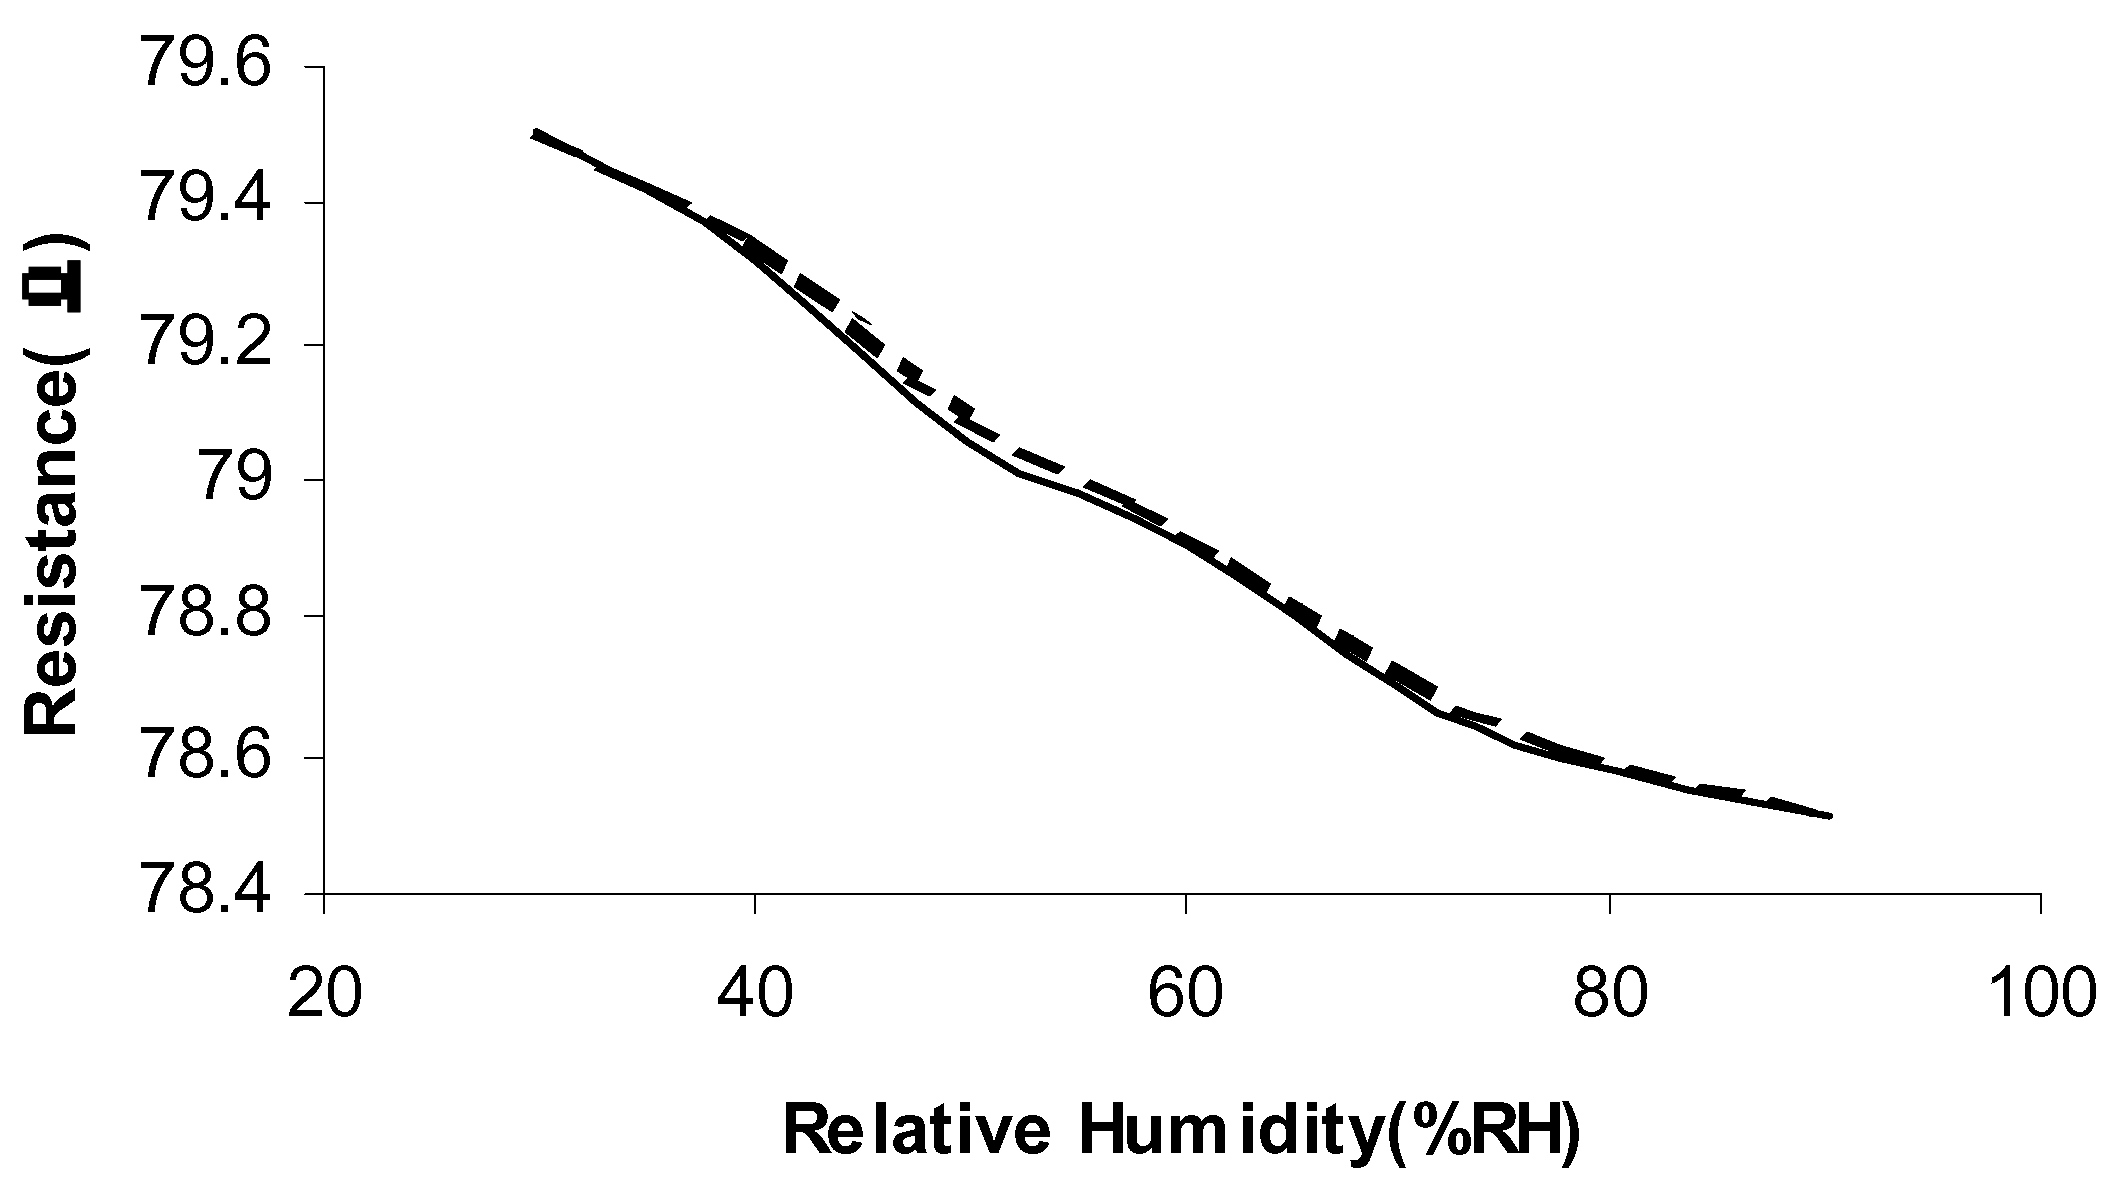
Further tests have been conducted to determine the hysteresis of the MnZn ferrite samples (Figure 8 and Figure 9). The humidity chamber was increased from 30-90%RH and then cycled down to 30%RH (indicated in the plots by the dashed line).
Figure 8.
Hysteresis of Sample 1.
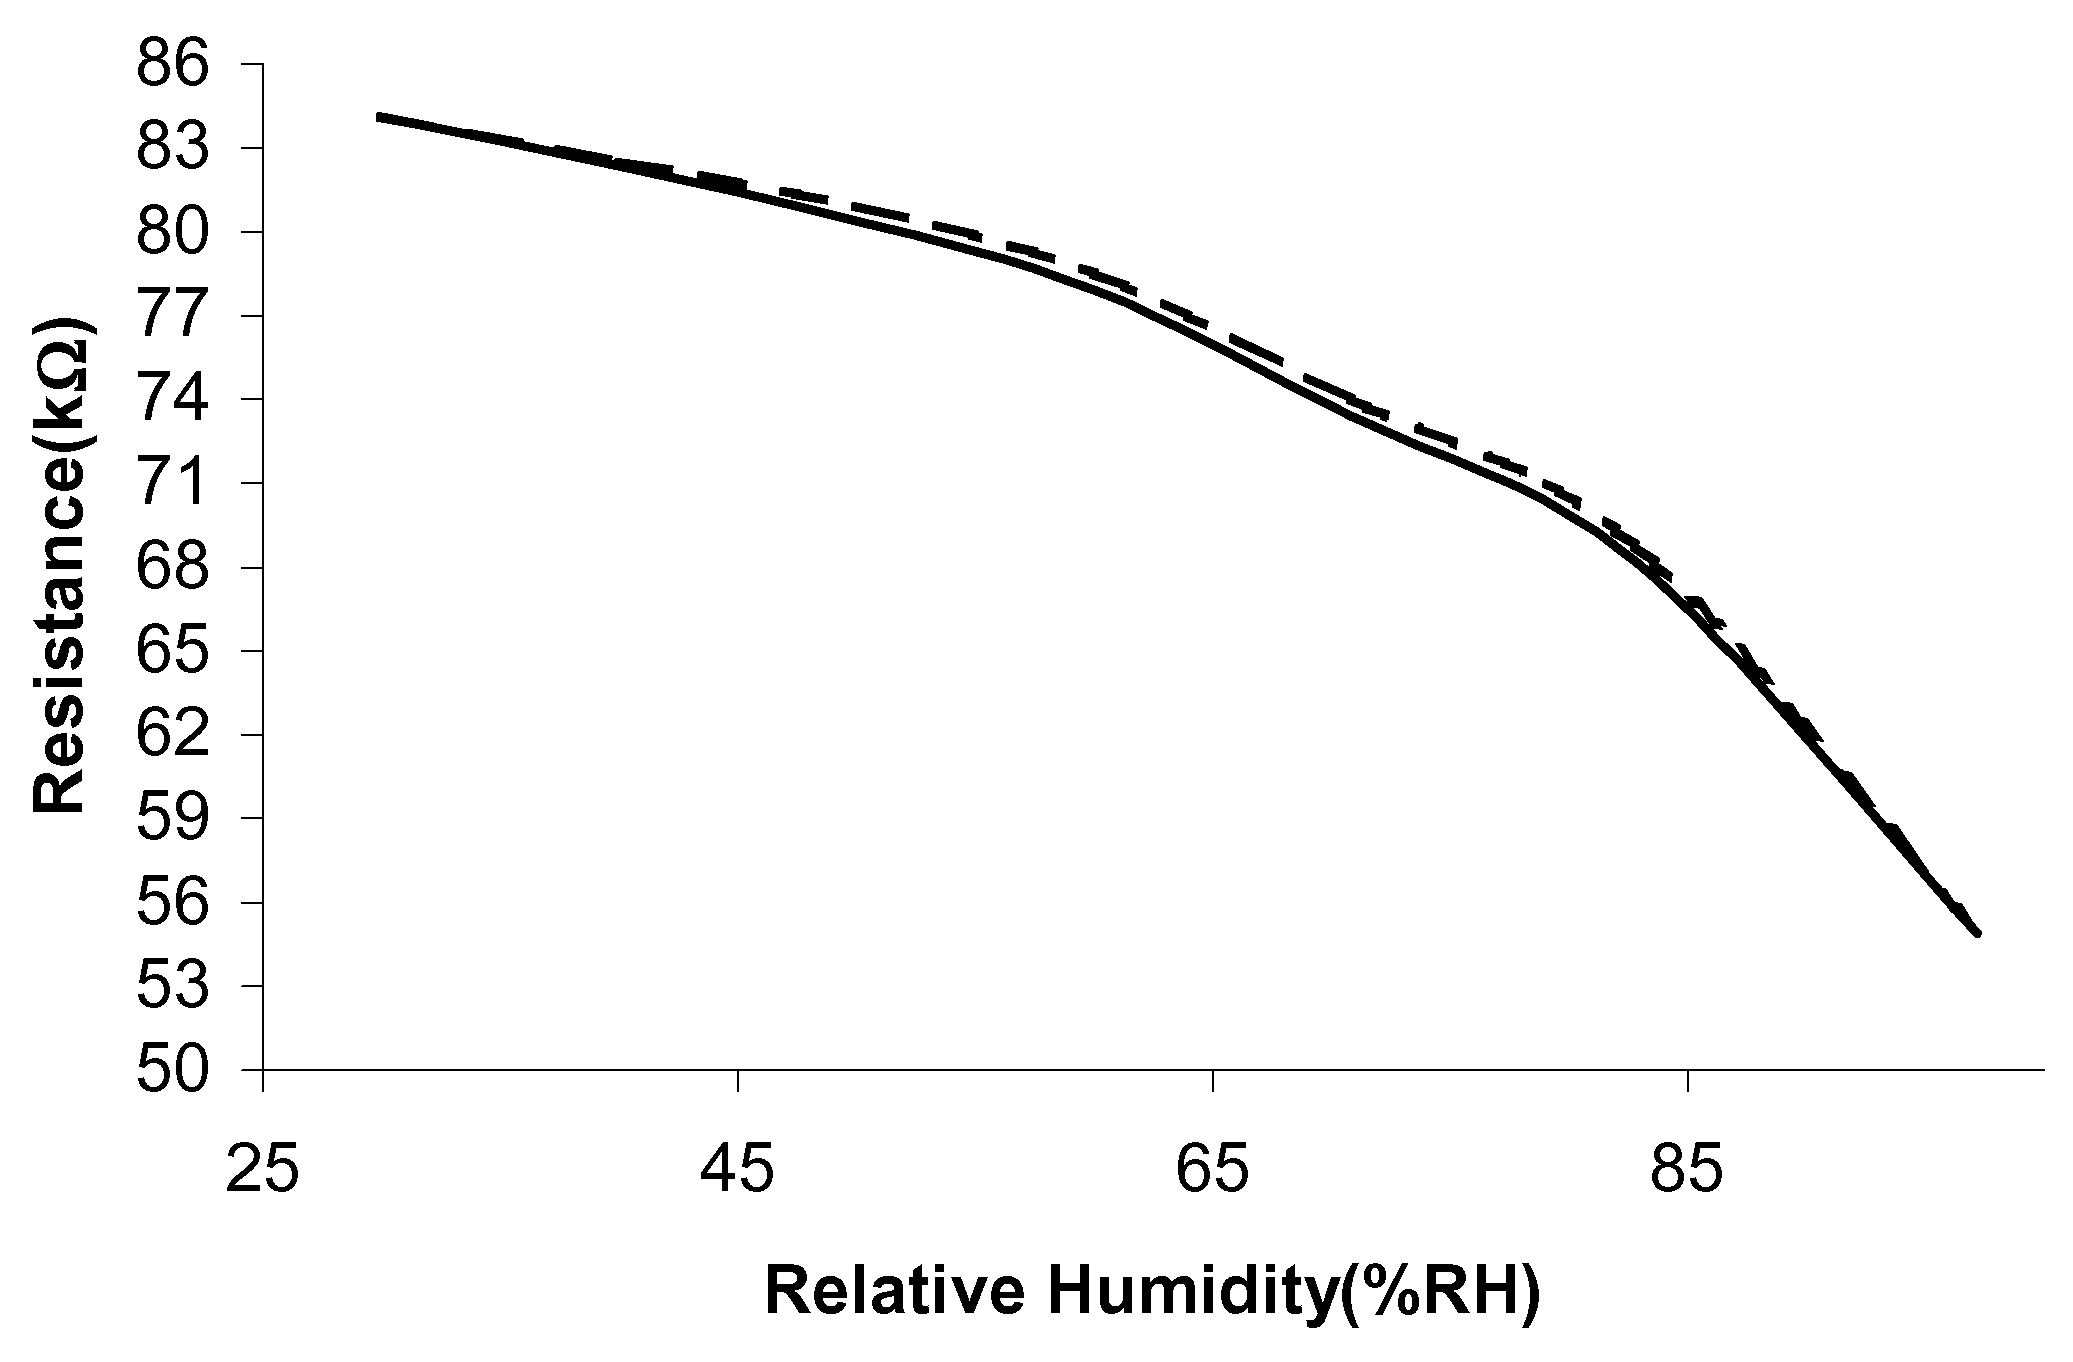
It has been determined that all samples have an acceptable hysteresis value; sample 1 has a hysteresis of 2.17%RH and sample 2 has a hysteresis of 0.97%RH. The data sheets of some commercial humidity sensors have indicated hysteresis values of ranging from 1.2RH% [16] to 2RH%-5RH% [15].
Figure 9.
Hysteresis of Sample 2.

Time Response
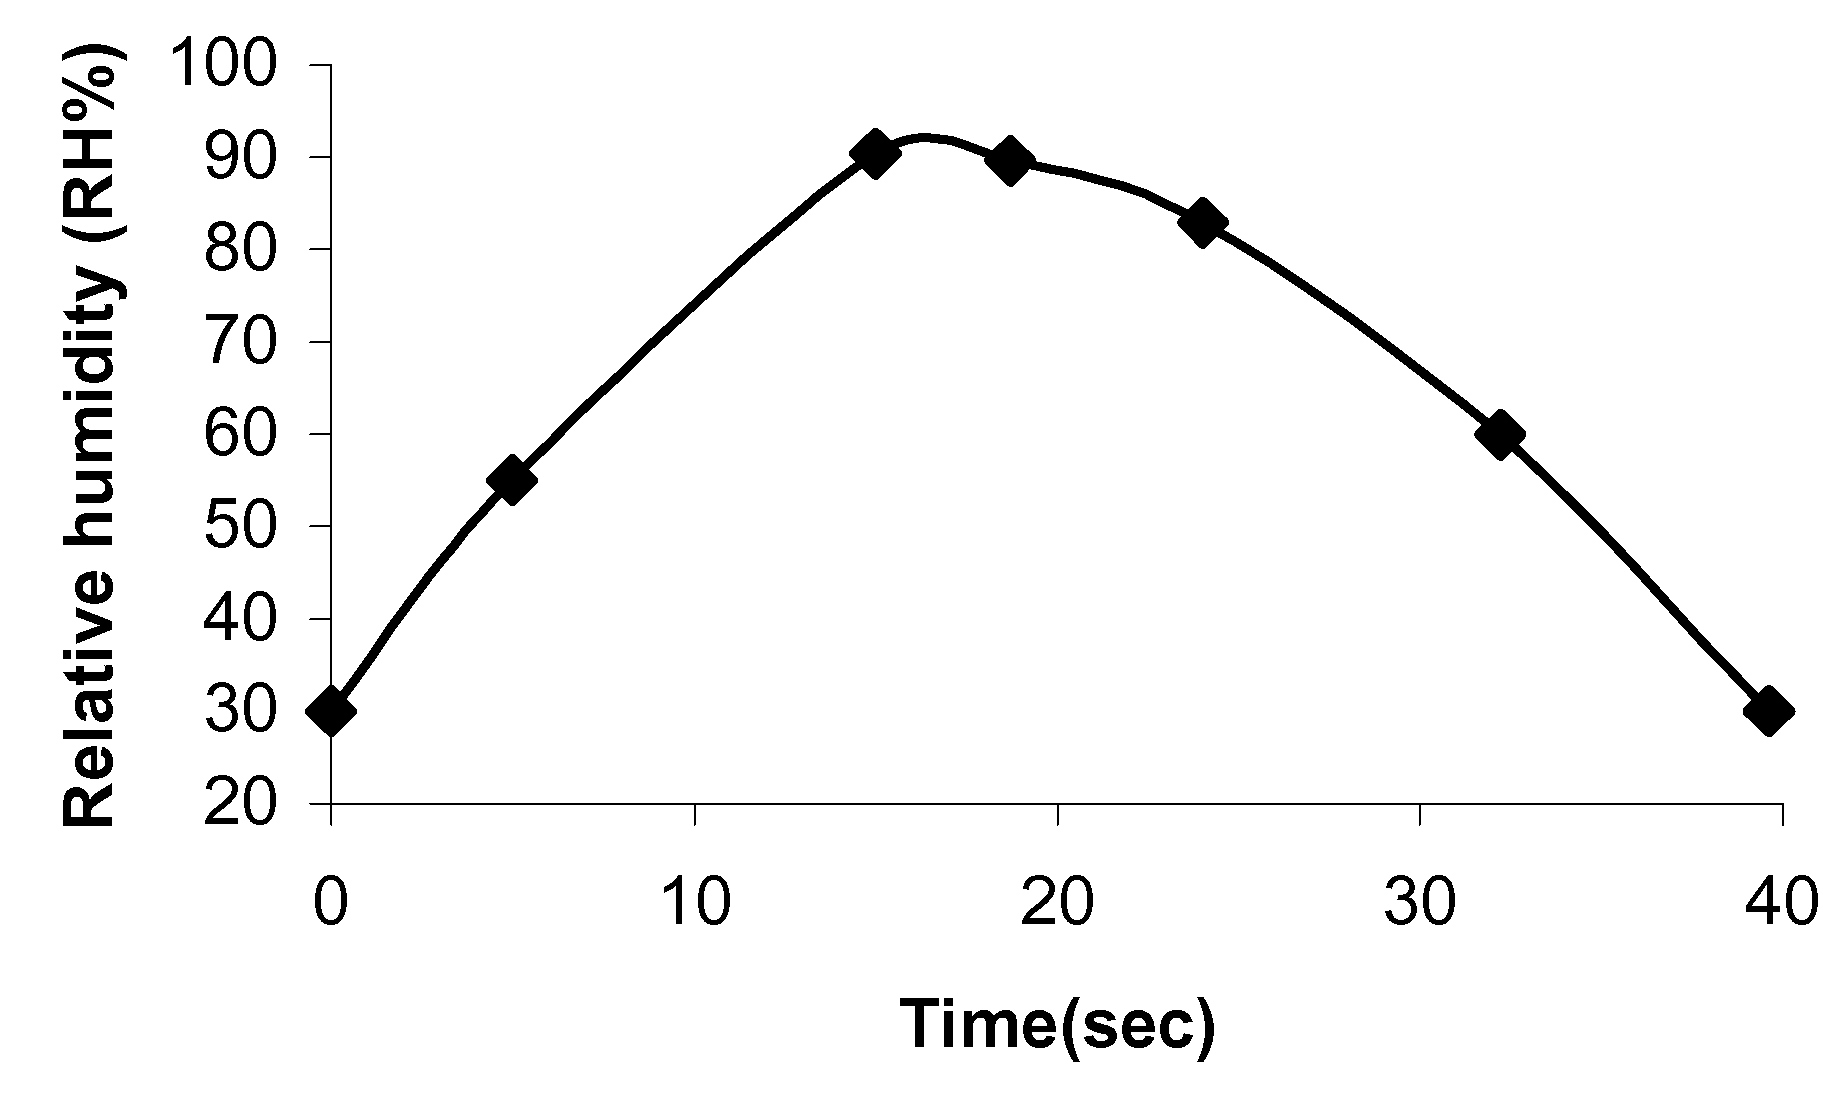
The time response of a sensor can vary from seconds to hours and it is of great interest to determine it. Commercial sensors appear to have a wide range of time responses from seconds e.g. 15 seconds [15], 30 seconds [17] up to minutes, e.g. 60 minutes [18]. The time response of the samples to RH% was determined by inserting the samples into the humidity chamber at the different settings and the time for the sensor samples to sense the correct RH% timed. Initially, the appropriate time was allowed for the chamber to reach equilibrium. The response and recovery times of the MnZn ferrite samples are indicated in Figure 10 and Figure 11.
Figure 10.
Time response of sample 1.
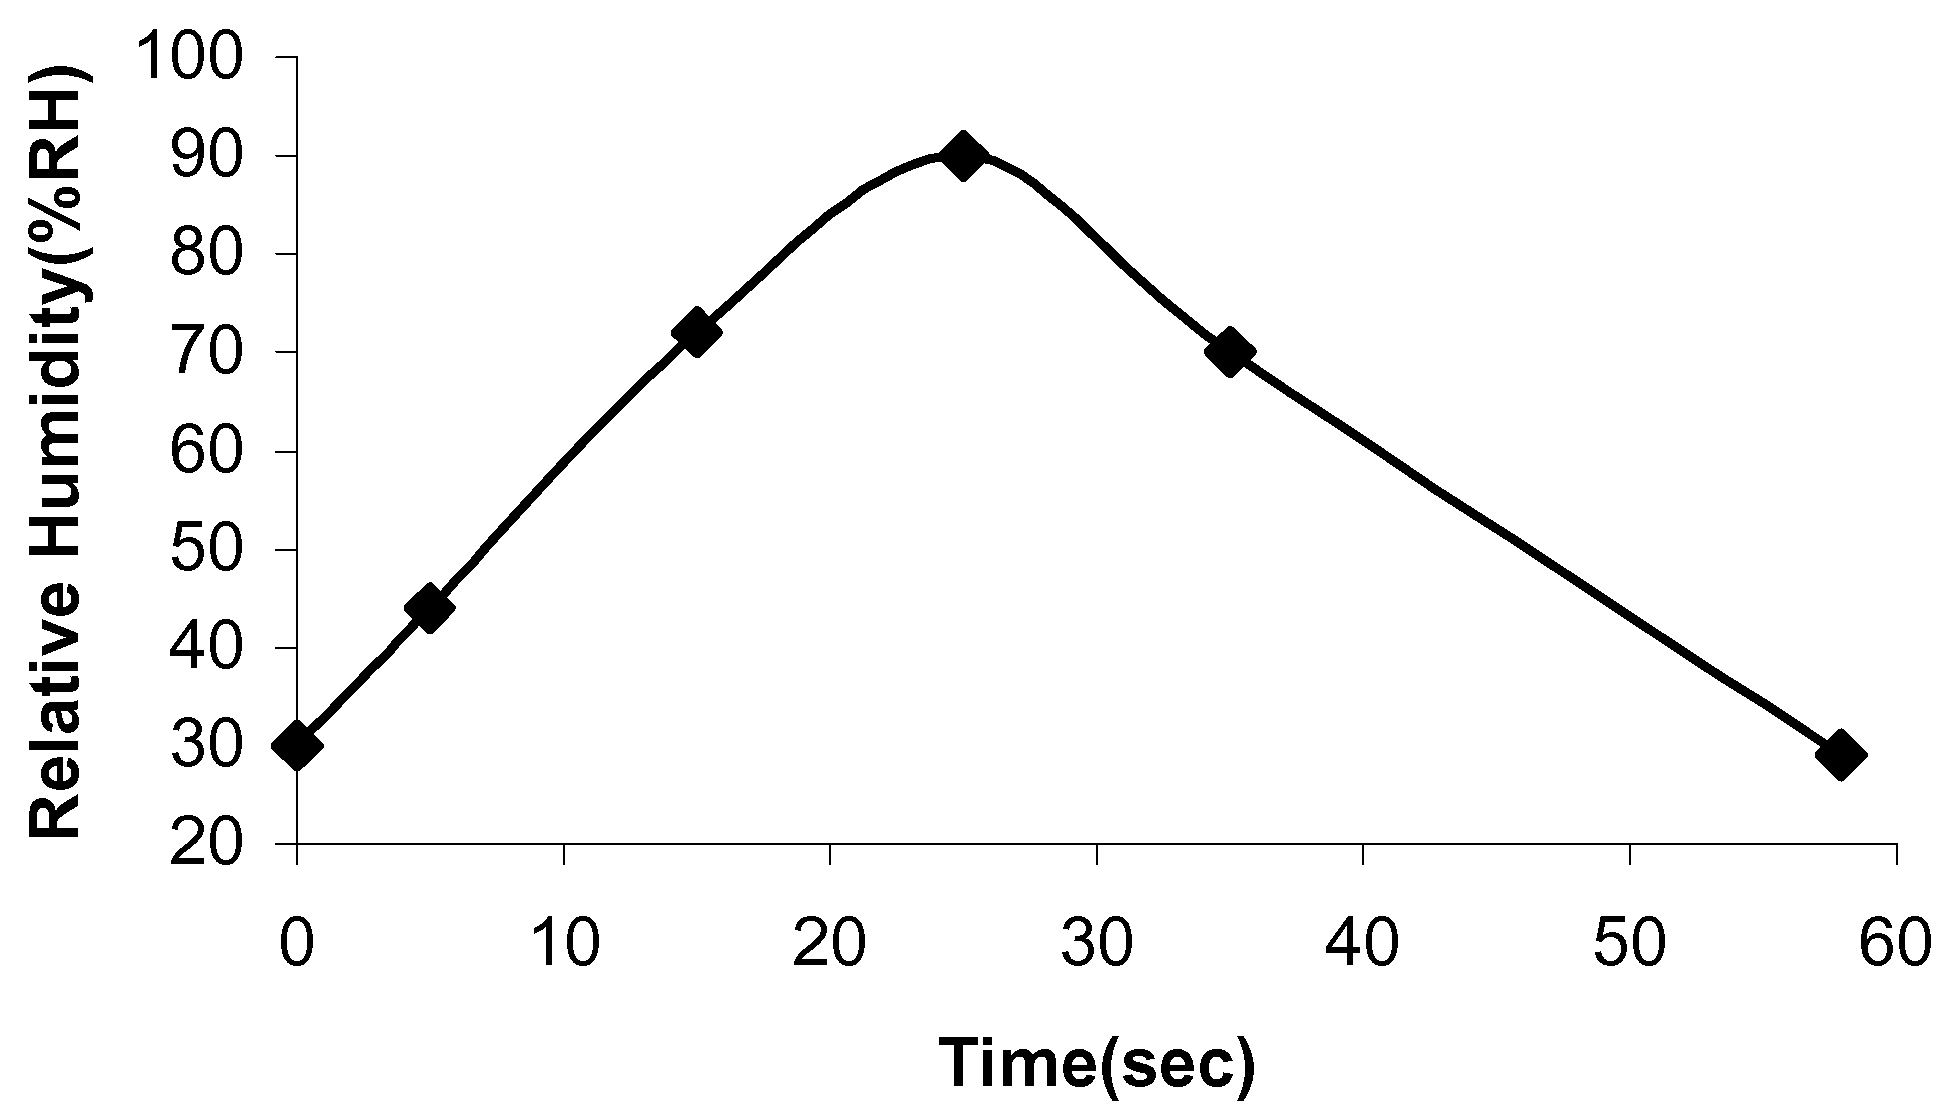
The time response of sample 1 is 25 seconds and the recovery time is 33 seconds. The time response for sample 2 is 17 seconds and the recovery time is 25 seconds. Adsorption and desorption of the water molecules take place at different energy levels. Adsorption is an exothermic process, whereas desorption needs external energy for water molecules to depart from the sample surface [19]. This explains why the recovery time is longer than the response time.
Figure 11.
Time response of sample 2.

Conclusion
This paper documents the development and manufacture of a ceramic thick film humidity sensor, based on MnZn ferrite. The sensor has been fabricated using the screen-printing technology. The ceramic pastes have been sintered at different temperatures in both air and vacuum ovens, respectively. The sample sintered in air shows the highest sensitivity to humidity. The results of the performance characteristics indicate good stability, low hysteresis and fast response time.
Experimental
Powder Preparation
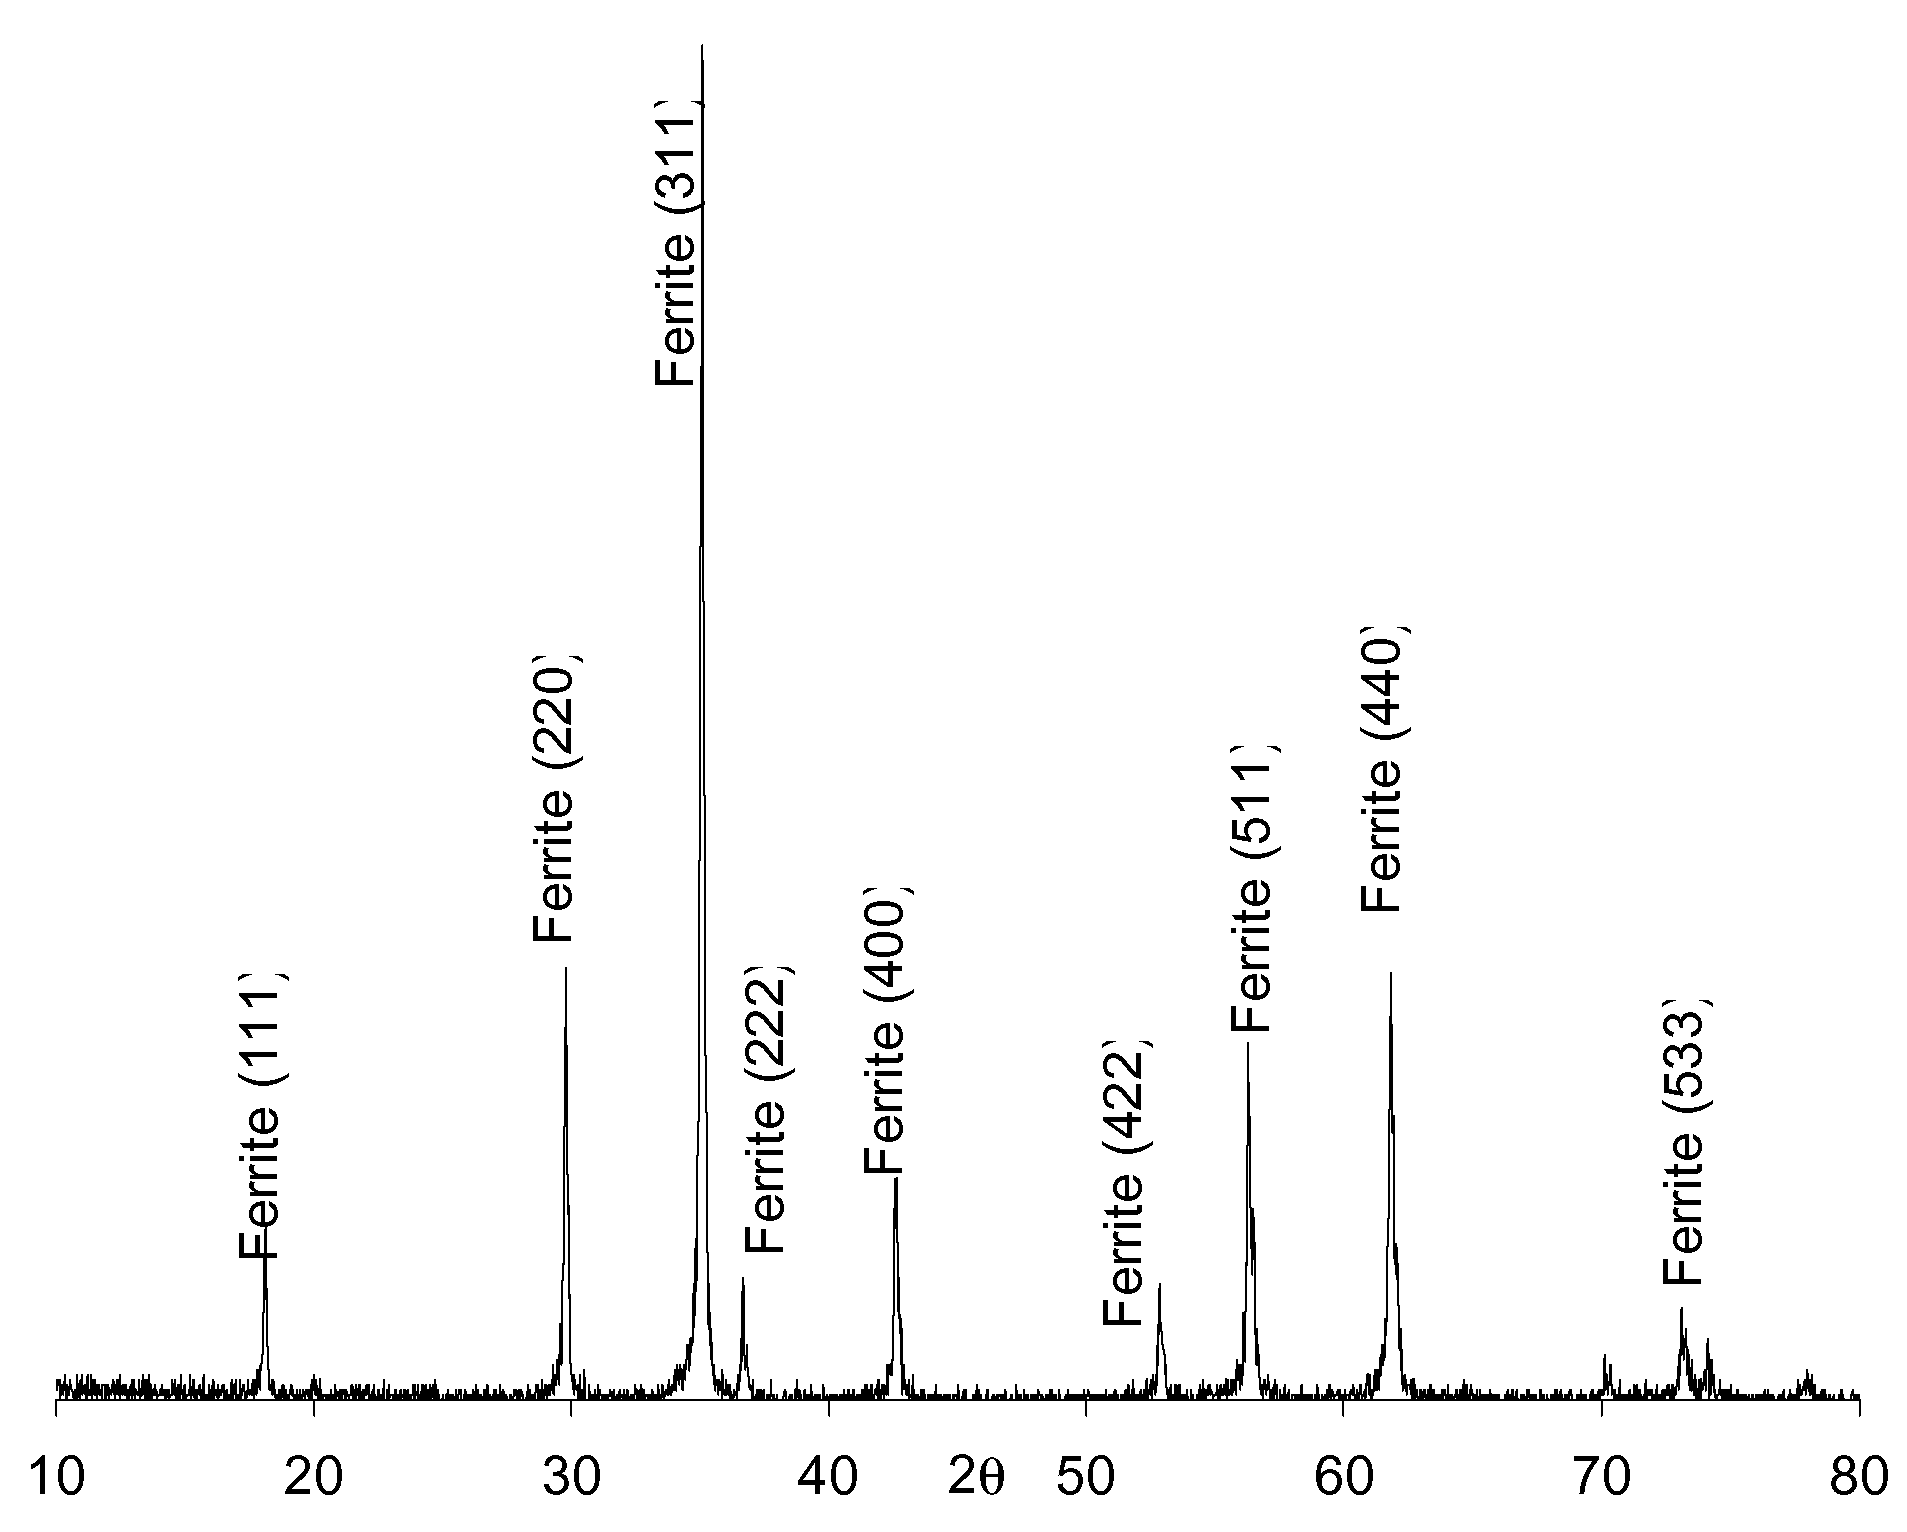
The starting materials for the MnZn ferrite sensing layer are: Fe2O3 (52.5wt.%), ZnO (25.5wt.%) and MnO (22wt.%). The weighed fractions of the starting materials were mixed and wet-ball milled in alcohol for 24 hours, then dried. The resulting power mixture was heated at 5°C/minute to a temperature of 600°C in air, then heating continued in vacuum, at a pressure of 4×10⁻⁴ mbars to 1250°C at 5°C/minute. The powder was held for 2 hours at 1250°C, followed by cooling at 3°C/minute. After this procedure, a solid amount of the functional material was obtained. This solid lump was broken up and ground down to a powder using mortar and pestle. Large particles were eliminated through sieving. The powders were then wet-ball milled for 24 hours, as before, resulting in a fine homogenous consistency. The resulting MnZn ferrite was examined by powder X-ray diffraction analysis from 10° to 80° 2θ. The XRD pattern clearly identifies a single phase of MnZn ferrite. The pattern (Figure 12) compares very well with the XRD patterns reported in the literature for MnZn ferrite [20]. This final compound is a spinel-type oxide [21] and has a measured n-type semiconductivity. N-type materials are more suited as humidity sensors than p-type since the conductivity increases with increasing relative humidity (RH%) while that of the p-type decreases. In addition, the adsorption of electron donor molecules (water) results in a larger conductivity change for the n-type semiconducting oxides [22].
Figure 12.
X-Ray diffraction patterns for MnZn ferrite powders.

Paste Preparation
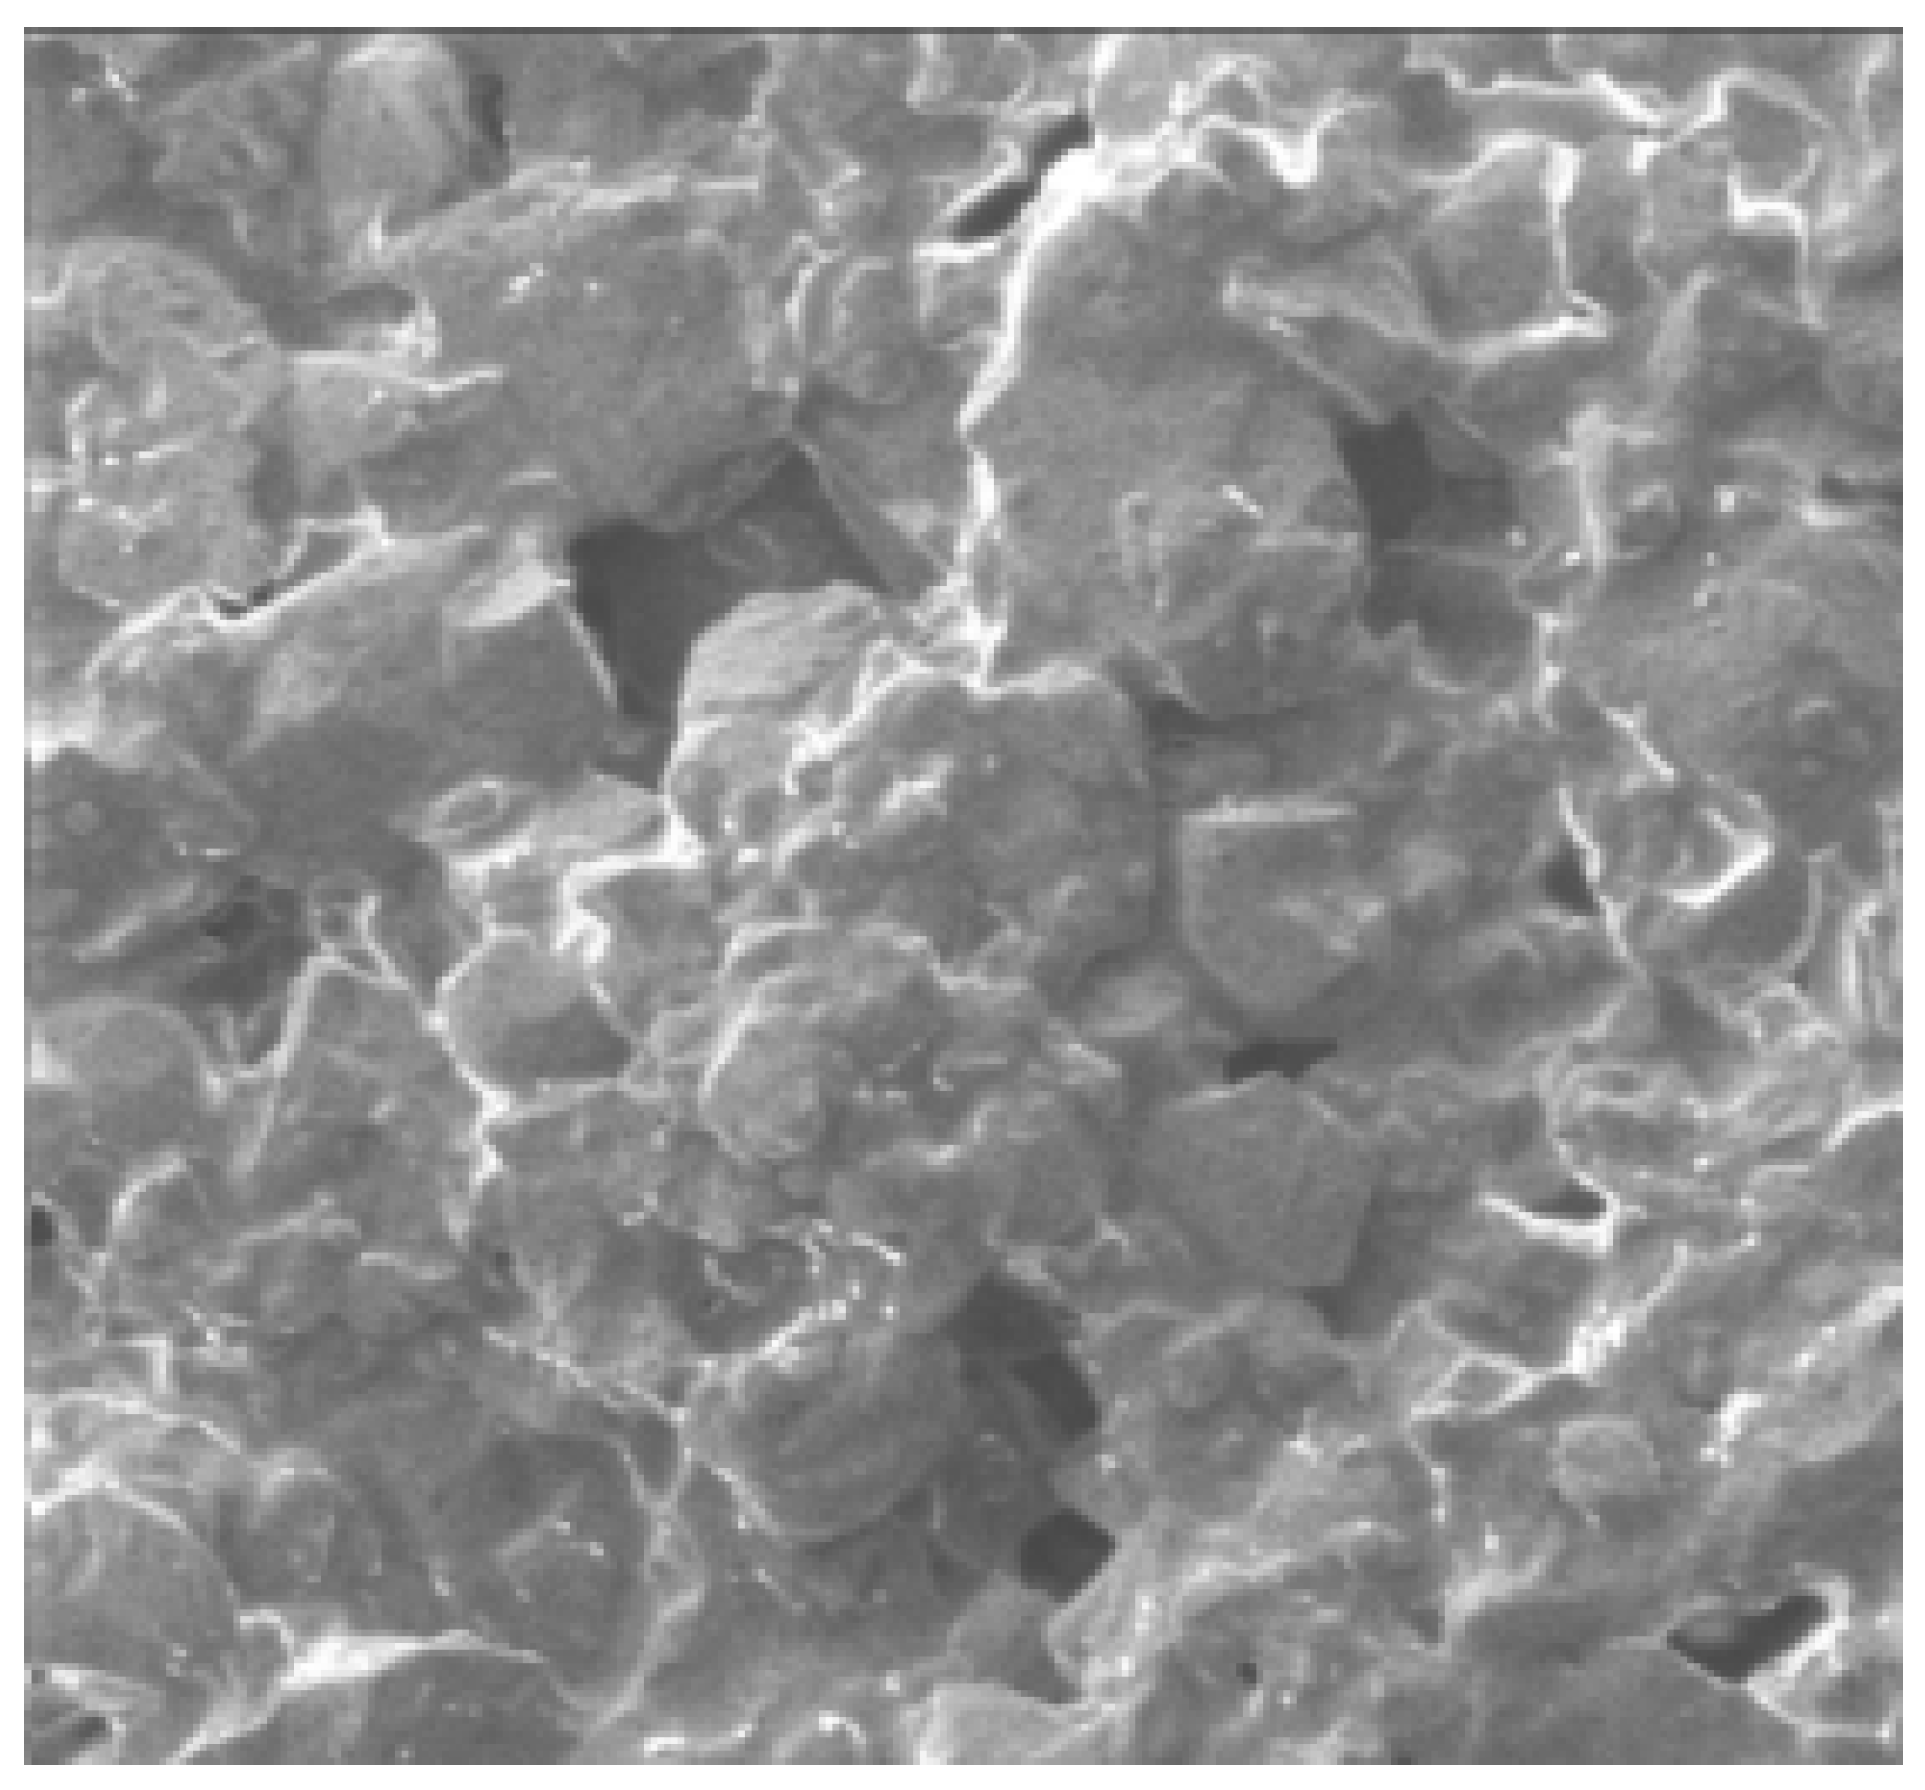
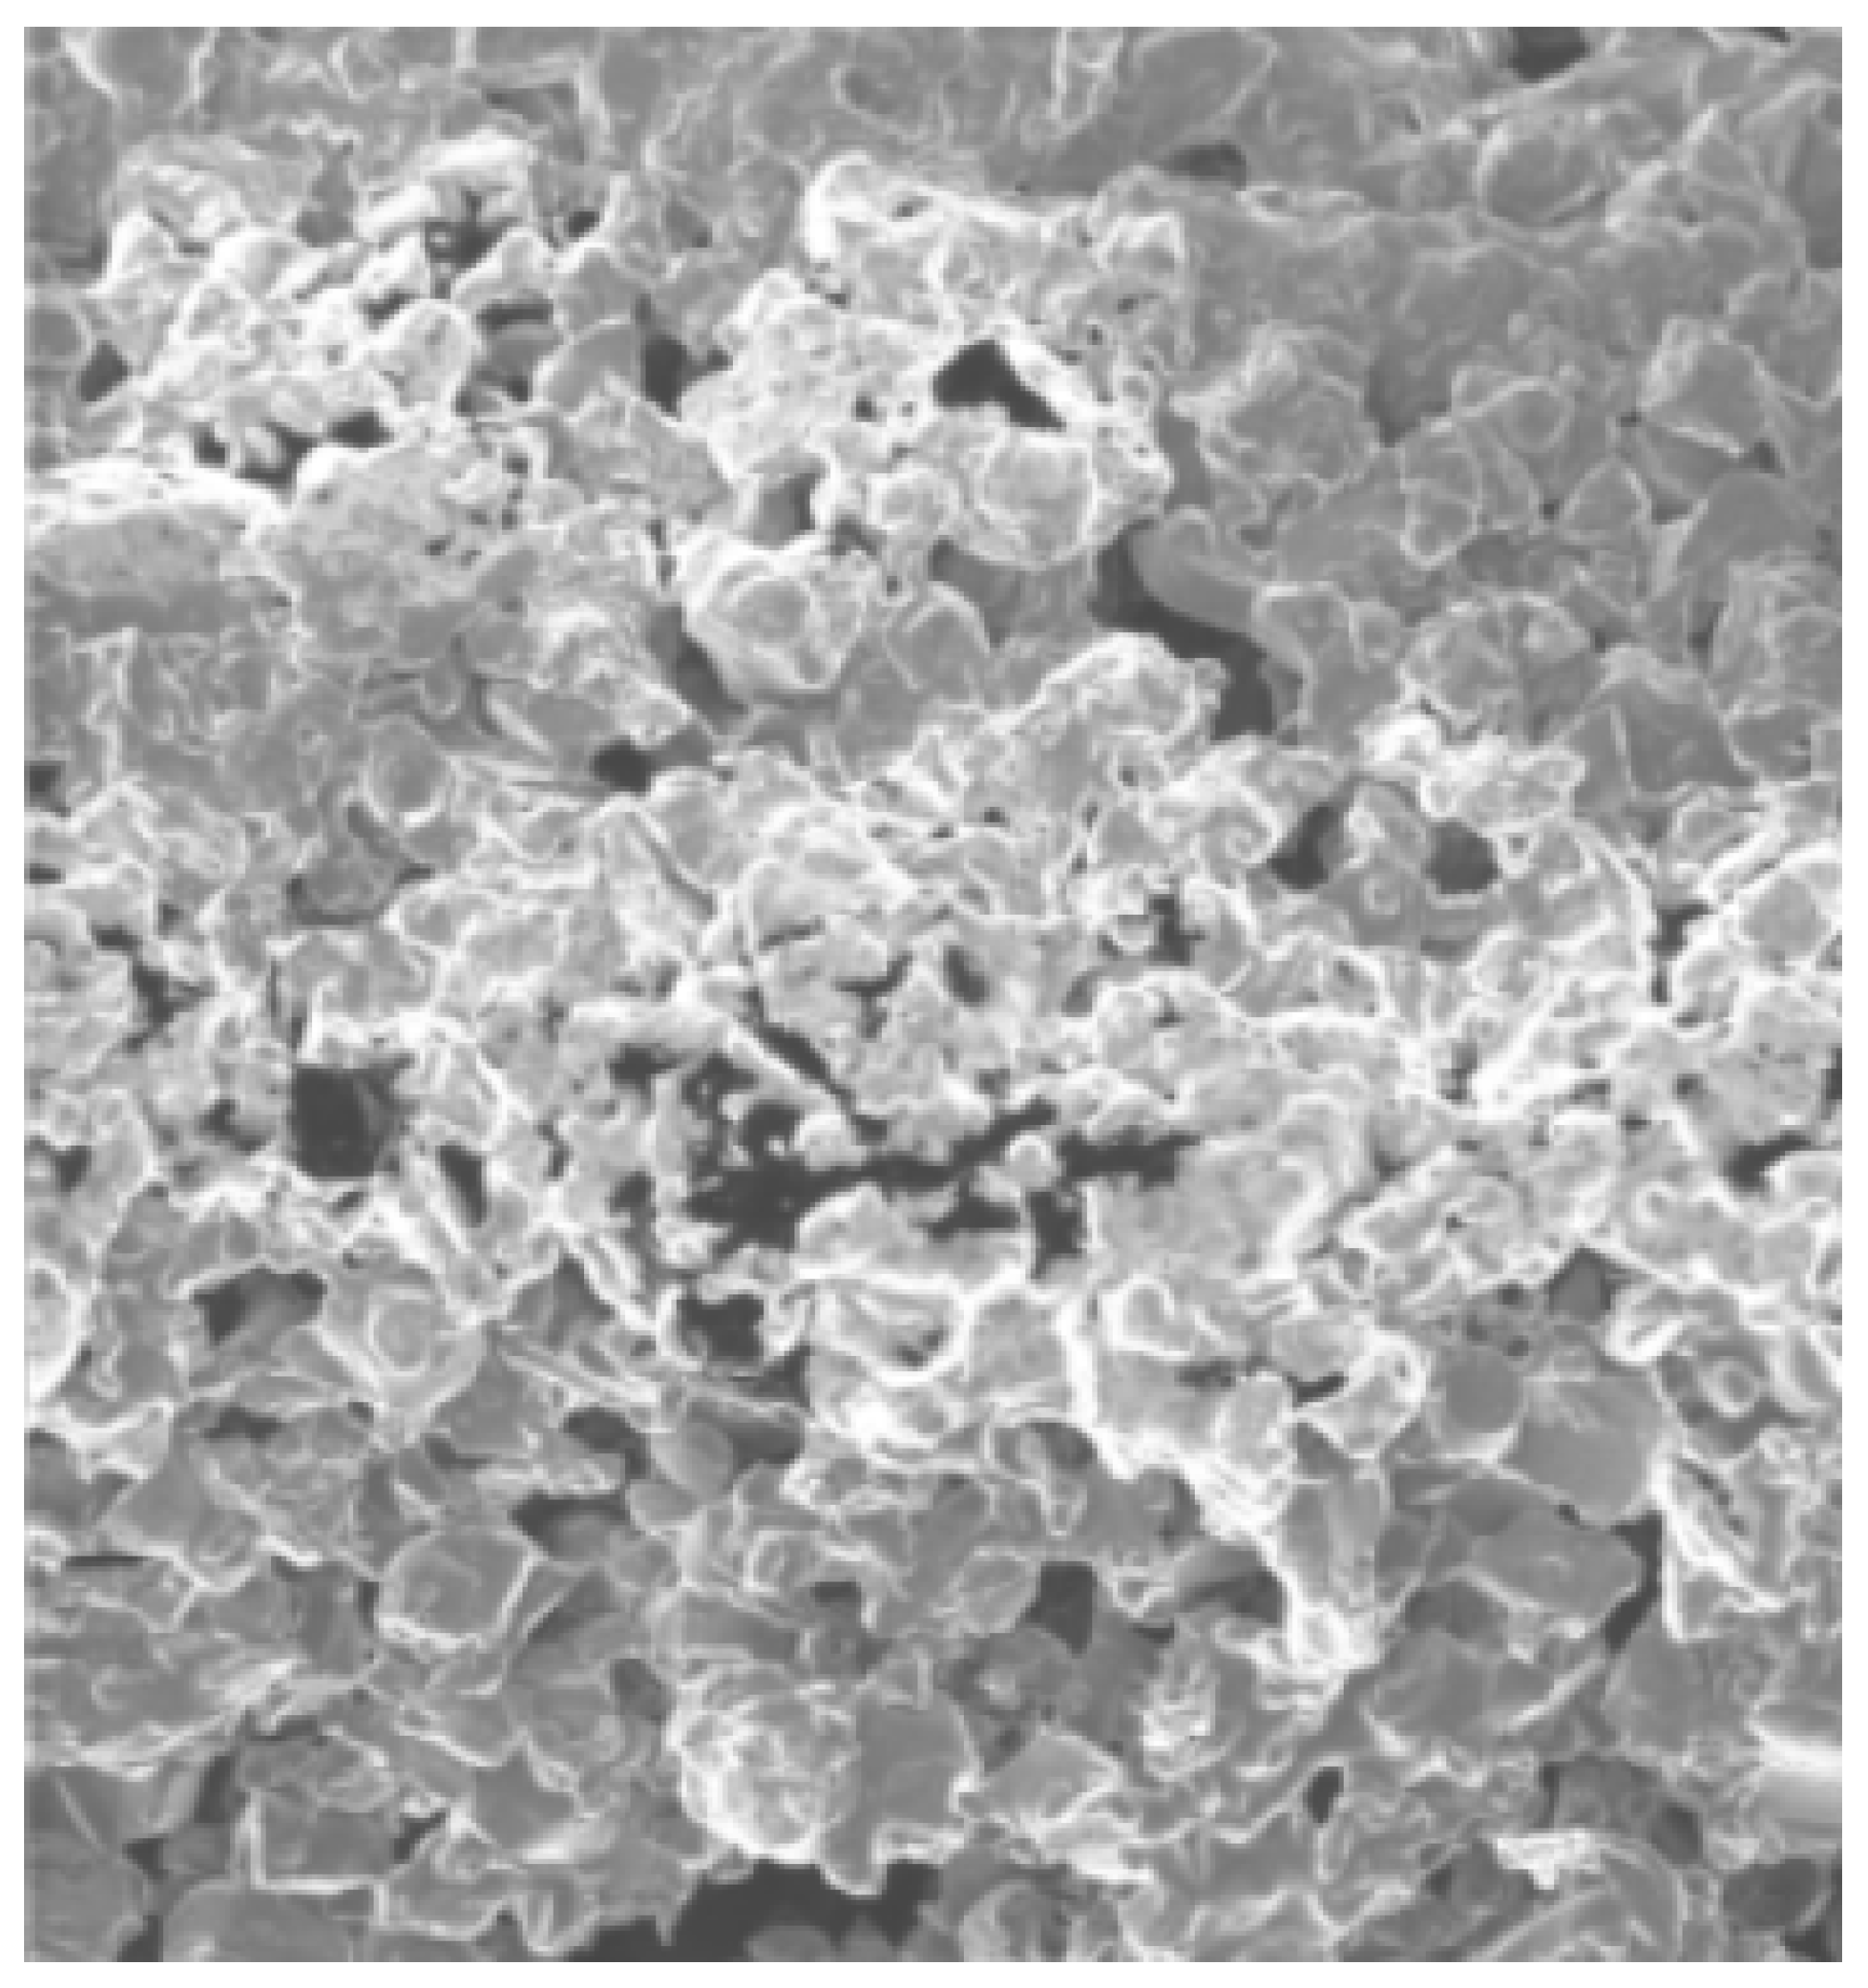
The ceramic paste consists of the MnZn ferrite functional material (54wt.%), a wetting agent (1wt.%), PbO as a permanent binder (12wt.%), ethyl cellulose as a temporary binder (7wt.%) and terpineol as a solvent (26wt.%). The amount of PbO was added to ensure the particles were sufficiently held together but not completely surrounded by the binder. The structure of the pastes was examined using a Focused Ion Beam (FIB) imaging system. FIB images of the surface and cross-sectional view of the MnZn ferrite samples are shown in Figure 13 and Figure 14.
Figure 13.
FIB micrograph of surface view of MnZn ferrite sample.

Figure 14.
FIB micrograph of cross-sectional view of MnZn ferrite sample.

The surface and cross-sectional FIB images show the individual particles of MnZn ferrite joined together by the PbO. The pores on the sample surface and throughout the sample are indicated by the black shading in the micrographs. In the case of a humidity sensor, a higher surface area is desirable because it provides more sites for water adsorption [9]. The sensing mechanism is a combination of the porous characteristics and the semiconductivity of the material.
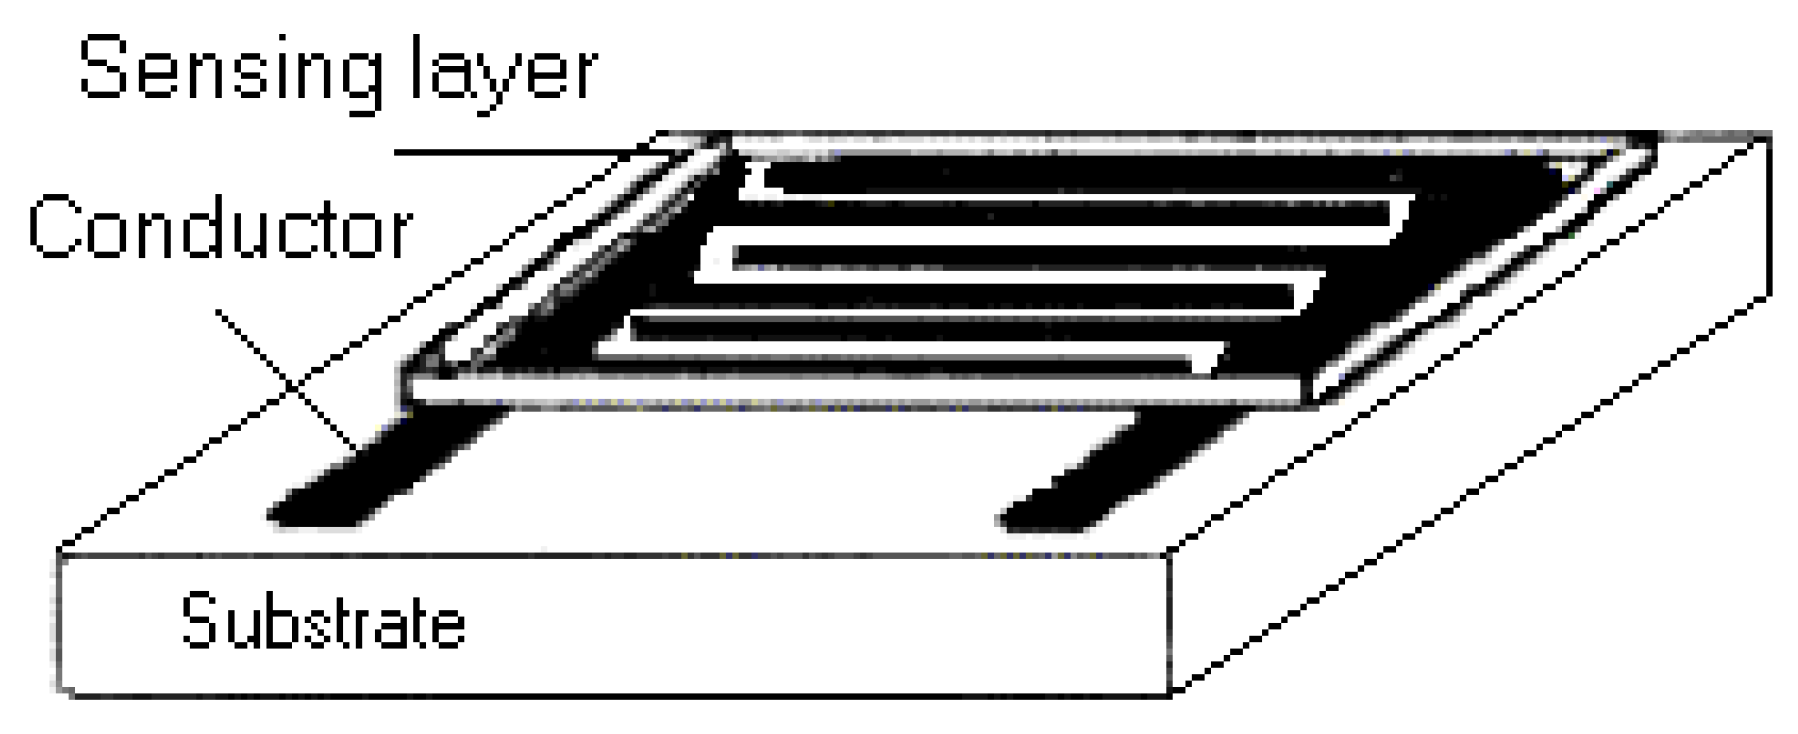
Sensor Structure
The sensor structure is a two-layer device printed on a high density alumina substrate (Figure 15). Firstly, the 15 μm silver conductor was printed and secondly, the 30 μm sensing layer was printed. The conductor is an interdigitated pattern, with 10 interdigits on each contact, giving a total of 20 interdigits. The total area occupied by the interdigits is 4mm × 9mm. Screen-printing technology is used in the manufacture of the sensor. A DEK RS1202 automatic screen printer is used.
Figure 16.
The sensor structure.
References
- Leszek, J.; Golonka; et al. Meas. Sci. Technol. 1997, 8, 92–98.
- Shuk, P.; Greenblatt, M. Solid State Ionics 1998, 113-115, 229–233.
- Montesperilli, G.; Pumo, A.; Traversa, E.; Gusmano, G.; Bearzotti, A.; Montenero, A.; Gnappi, G. Sens. Actuators B 1995, 24-25, 705–709.
- Kim, T.Y.; Lee, D.H.; Shim, Y.C.; Bu, Y.C.; Kim, S.T. Sens. Actuators 1992, 9, 63.
- Bayhan, M.; Hashemi, T.; Brinkman, A.W. J. Mater.Sci. 1997, 32, 6619–6623. [CrossRef]
- Cantalini, C.; Perlino, M. J. Am. Ceram. Soc. 1992, 75, 546. [CrossRef]
- Wu, L.; Wu, C.C.; Wu, M.M. J. Electron. Mater. 1990, 19, 197–200. [CrossRef]
- Shimizu, Y.; Arai, H.; Seiyama, T. Sensors and Actuators 1985, 7, 11.
- Kan-Sen, Chou; Tzy-Kuang, Lee; Liu, Feng-Jiin. Sens. Actuators B 1999, 56, 106–111.
- Sears, W.M. Sens. Actuators B 2000, 67, 161–172. [CrossRef]
- Qu, W.; Wlodarski, W.; Meyer, J.U. Sens. Actuators B 2000, 64, 76–82. [CrossRef]
- Gopel, W.; Hesse, J.; Zemel, J.N. Sensors: A comprehensive survey Vol.3. 1999.
- Morrison, S.R. Sens. Actuators 1982, 2, 329–341. [CrossRef]
- Traversa, E. Sens. Actuators B 1995, 23, 135–156. [CrossRef]
- Thermoset Polymer-based Capacitative Sensors, Application Sheet, www.honeywell.com.
- HIH-3605 humidity sensor data sheet, www.honeywell.com.
- Humidity probes data sheets, www.vernier.com.
- Bacharach Gas Detection Systems, Data Sheet, www.scottinstruments.com.
- Qu, W.; Meyer, J. U. Sens. Actuators B 1997, 40, 175–182. [CrossRef]
- Welch, R.G.; Neamtu, J.; Rogalski, M.S.; Palmer, S.B. Materials Letters 1996, 29, 199–203.
- Krupicka, S.; Novak, P. Ferromagnetic Materials Vol. 3, North Holland Pub. 1982, 220.
- Sample Availability: Available from the authors.
© 2002 by MDPI (http://www.mdpi.net). Reproduction is permitted for noncommercial purposes.
Share and Cite
MDPI and ACS Style
Arshaka, K.; Twomey, K.; Egan, D. A Ceramic Thick Film Humidity Sensor Based on MnZn Ferrite. Sensors 2002, 2, 50-61. https://doi.org/10.3390/s20200050
AMA Style
Arshaka K, Twomey K, Egan D. A Ceramic Thick Film Humidity Sensor Based on MnZn Ferrite. Sensors. 2002; 2(2):50-61. https://doi.org/10.3390/s20200050
Chicago/Turabian StyleArshaka, K., K. Twomey, and D. Egan. 2002. "A Ceramic Thick Film Humidity Sensor Based on MnZn Ferrite" Sensors 2, no. 2: 50-61. https://doi.org/10.3390/s20200050