A Comparison of Reflective Photoplethysmography for Detection of Heart Rate, Blood Oxygen Saturation, and Respiration Rate at Various Anatomical Locations

 ,
,  , ,
, ,
Abstract
:1. Introduction
2. Materials and Methods
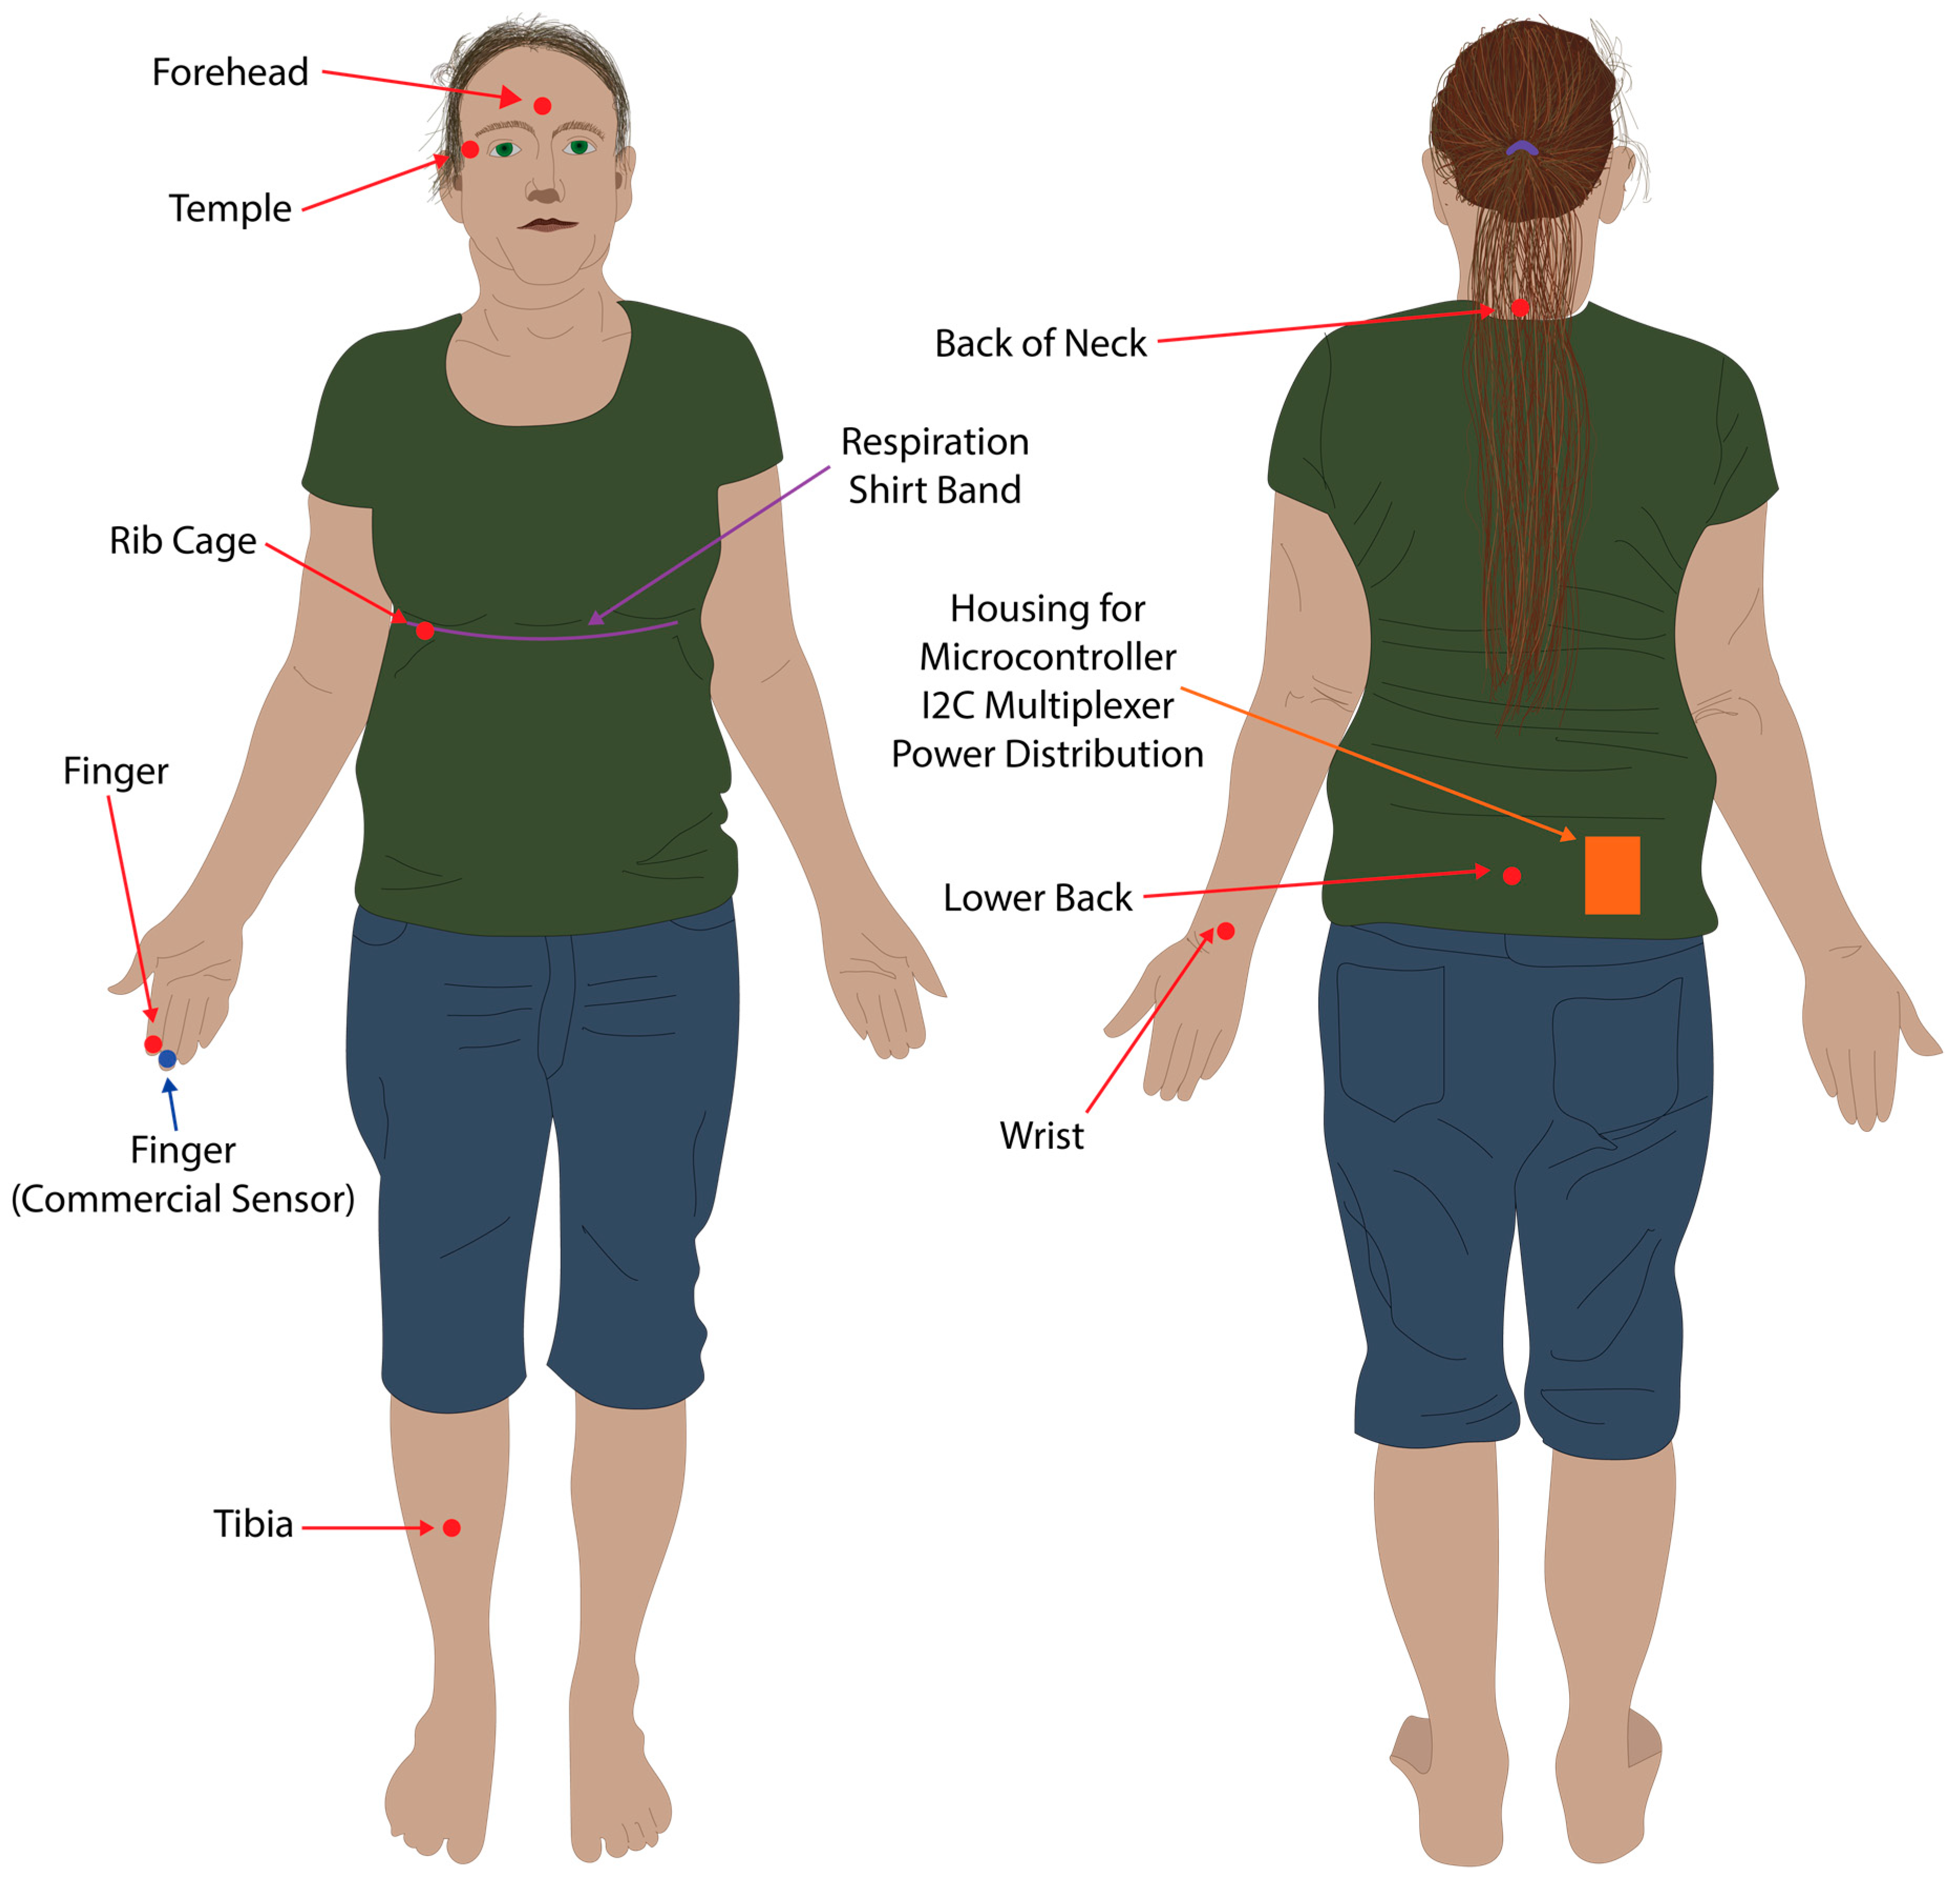
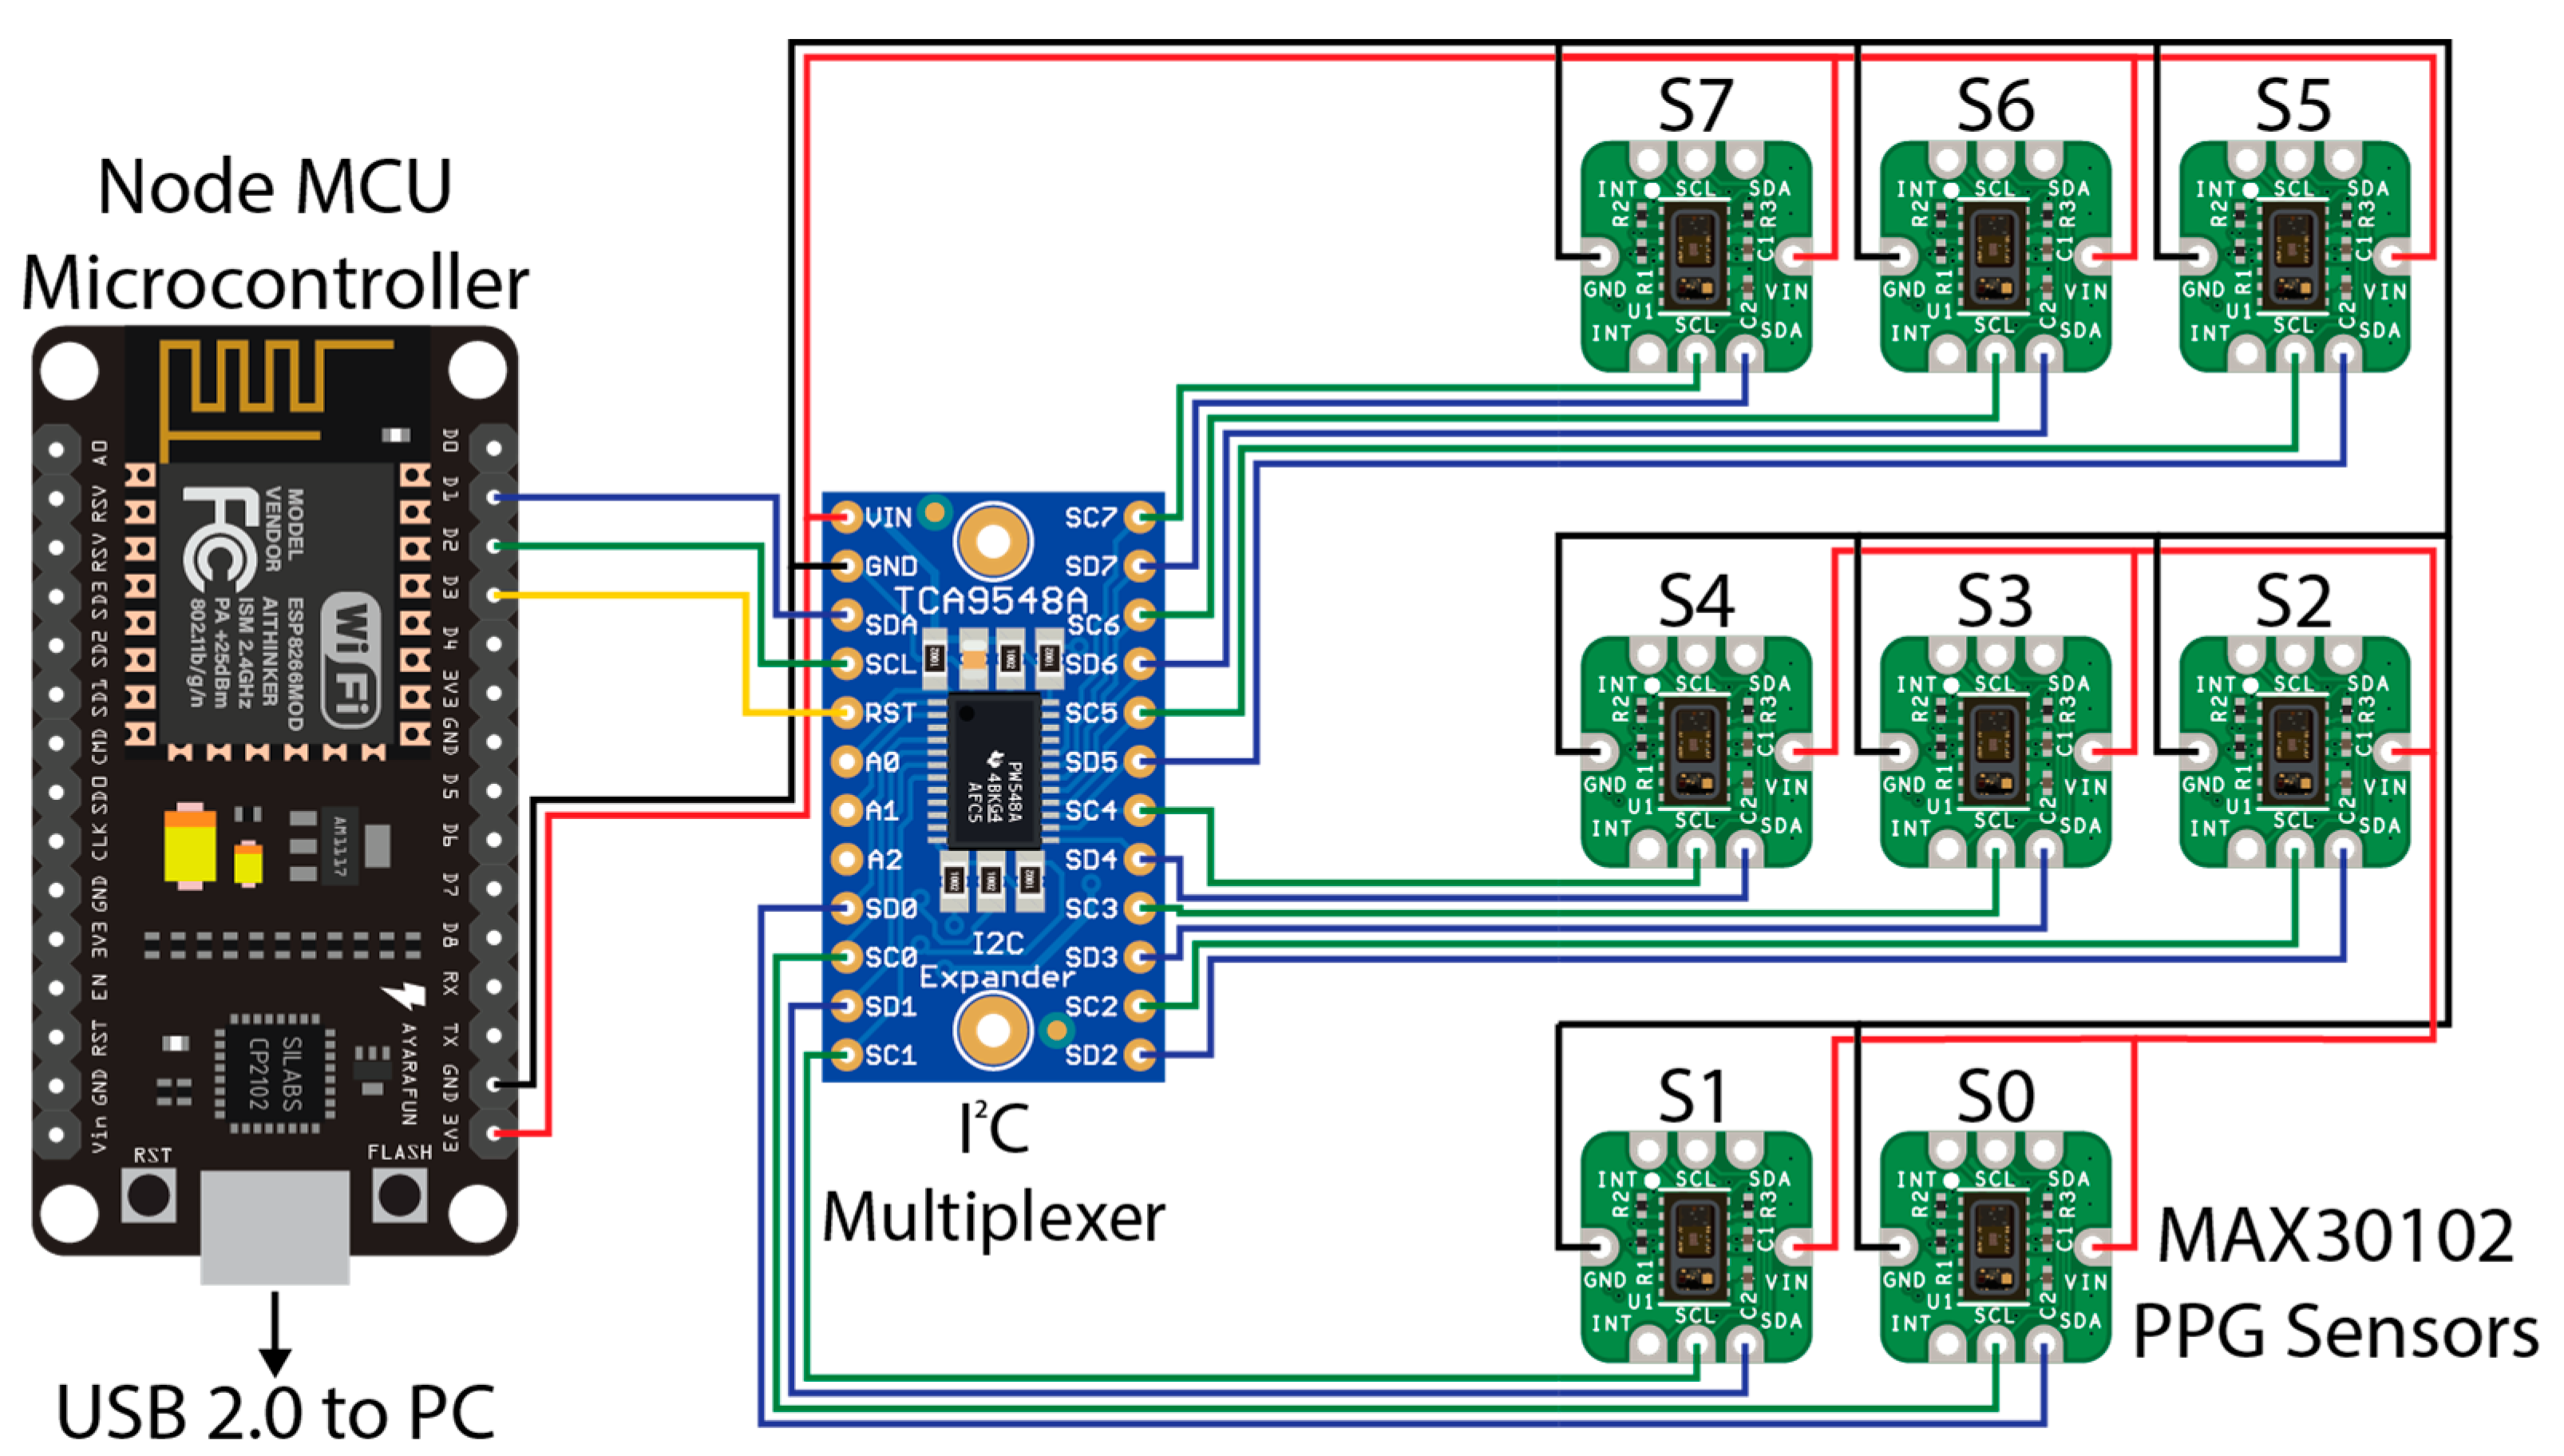
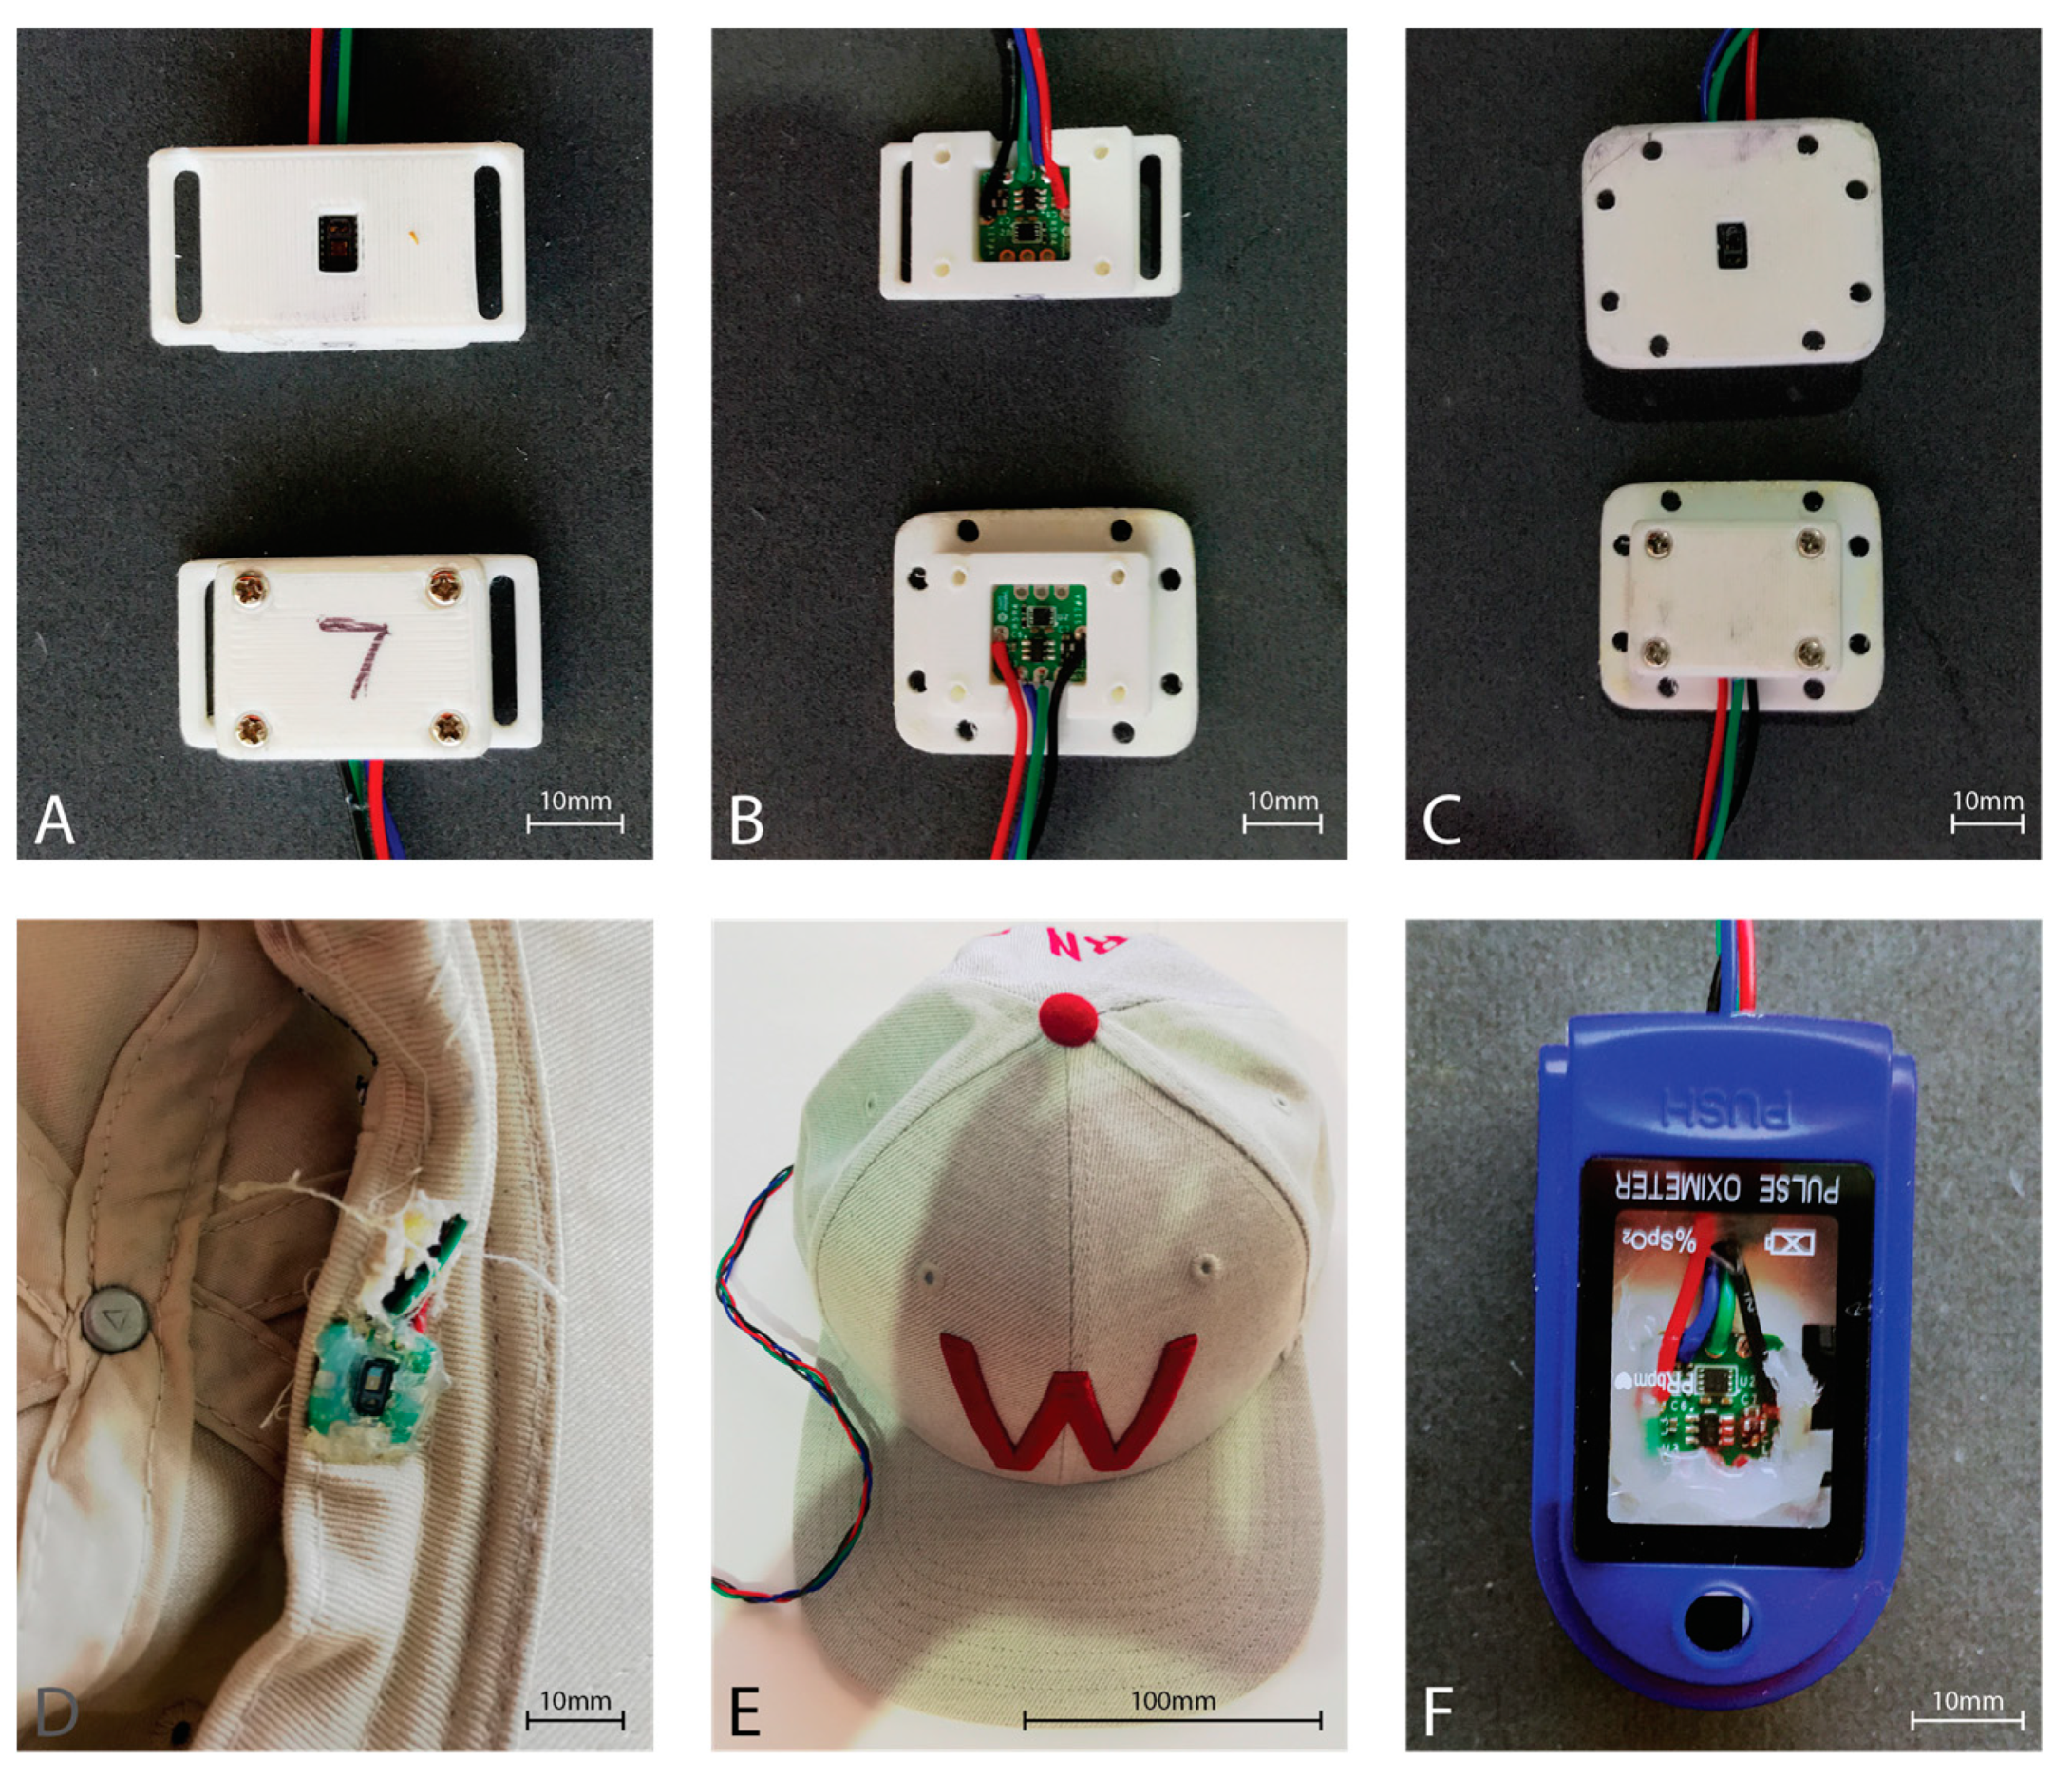
2.1. Sensor Hardware
2.2. Data Collection Method
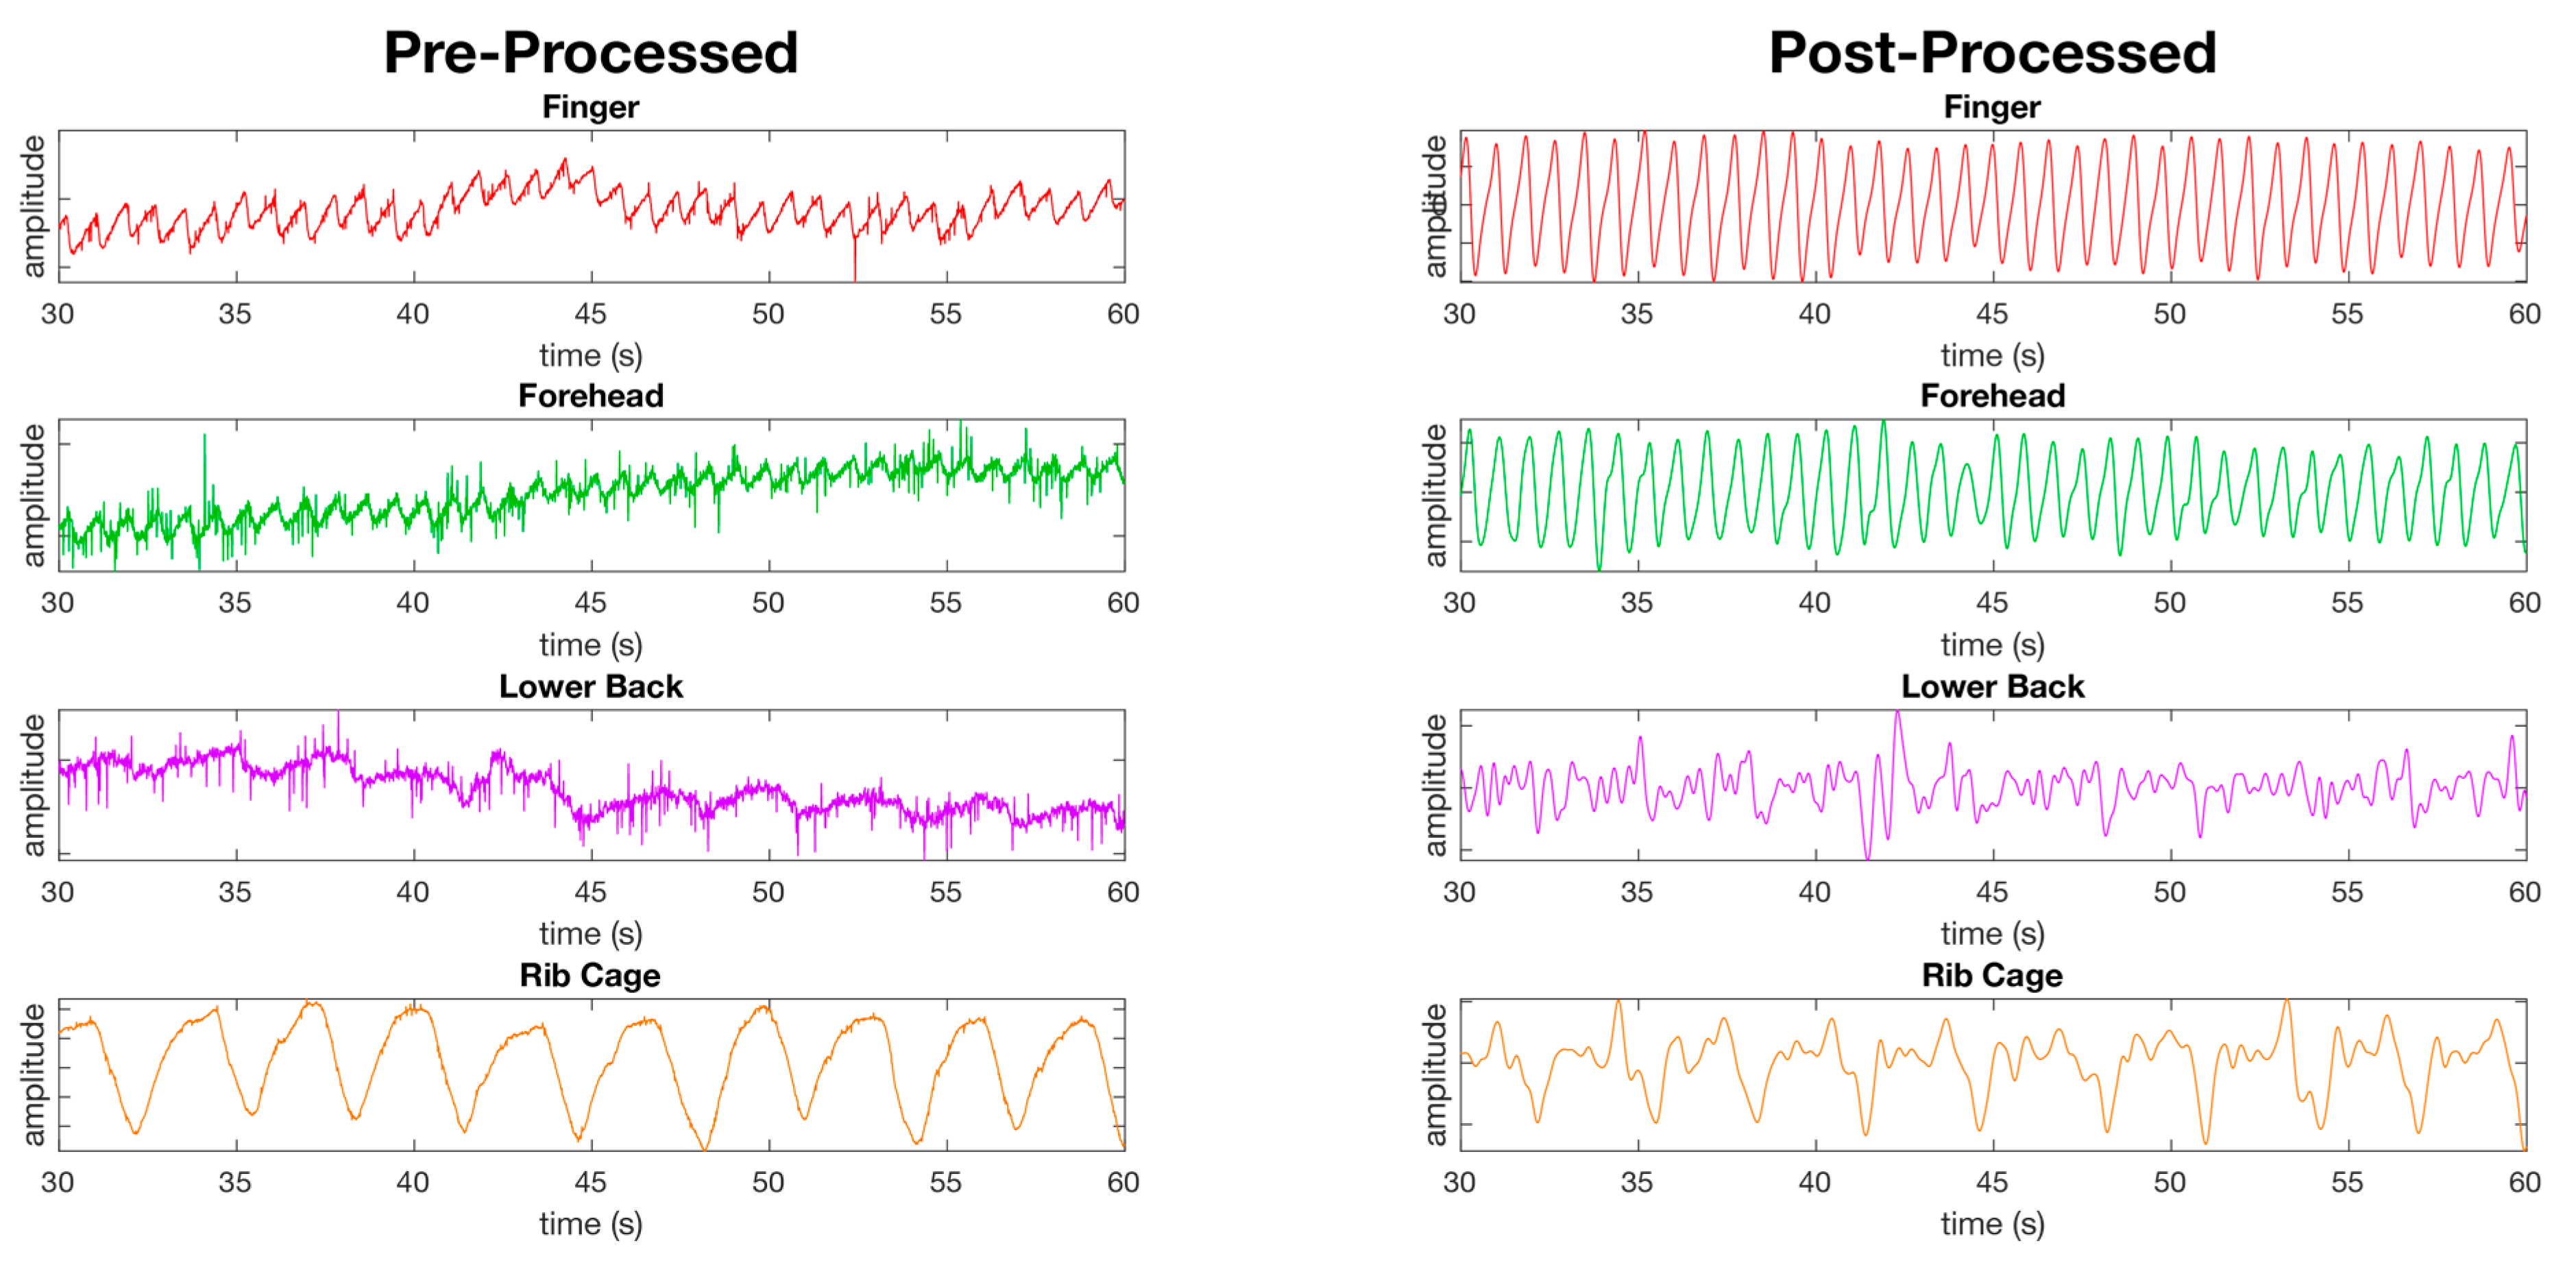
2.3. Data Processing and Analysis
2.4. Ethics Statement
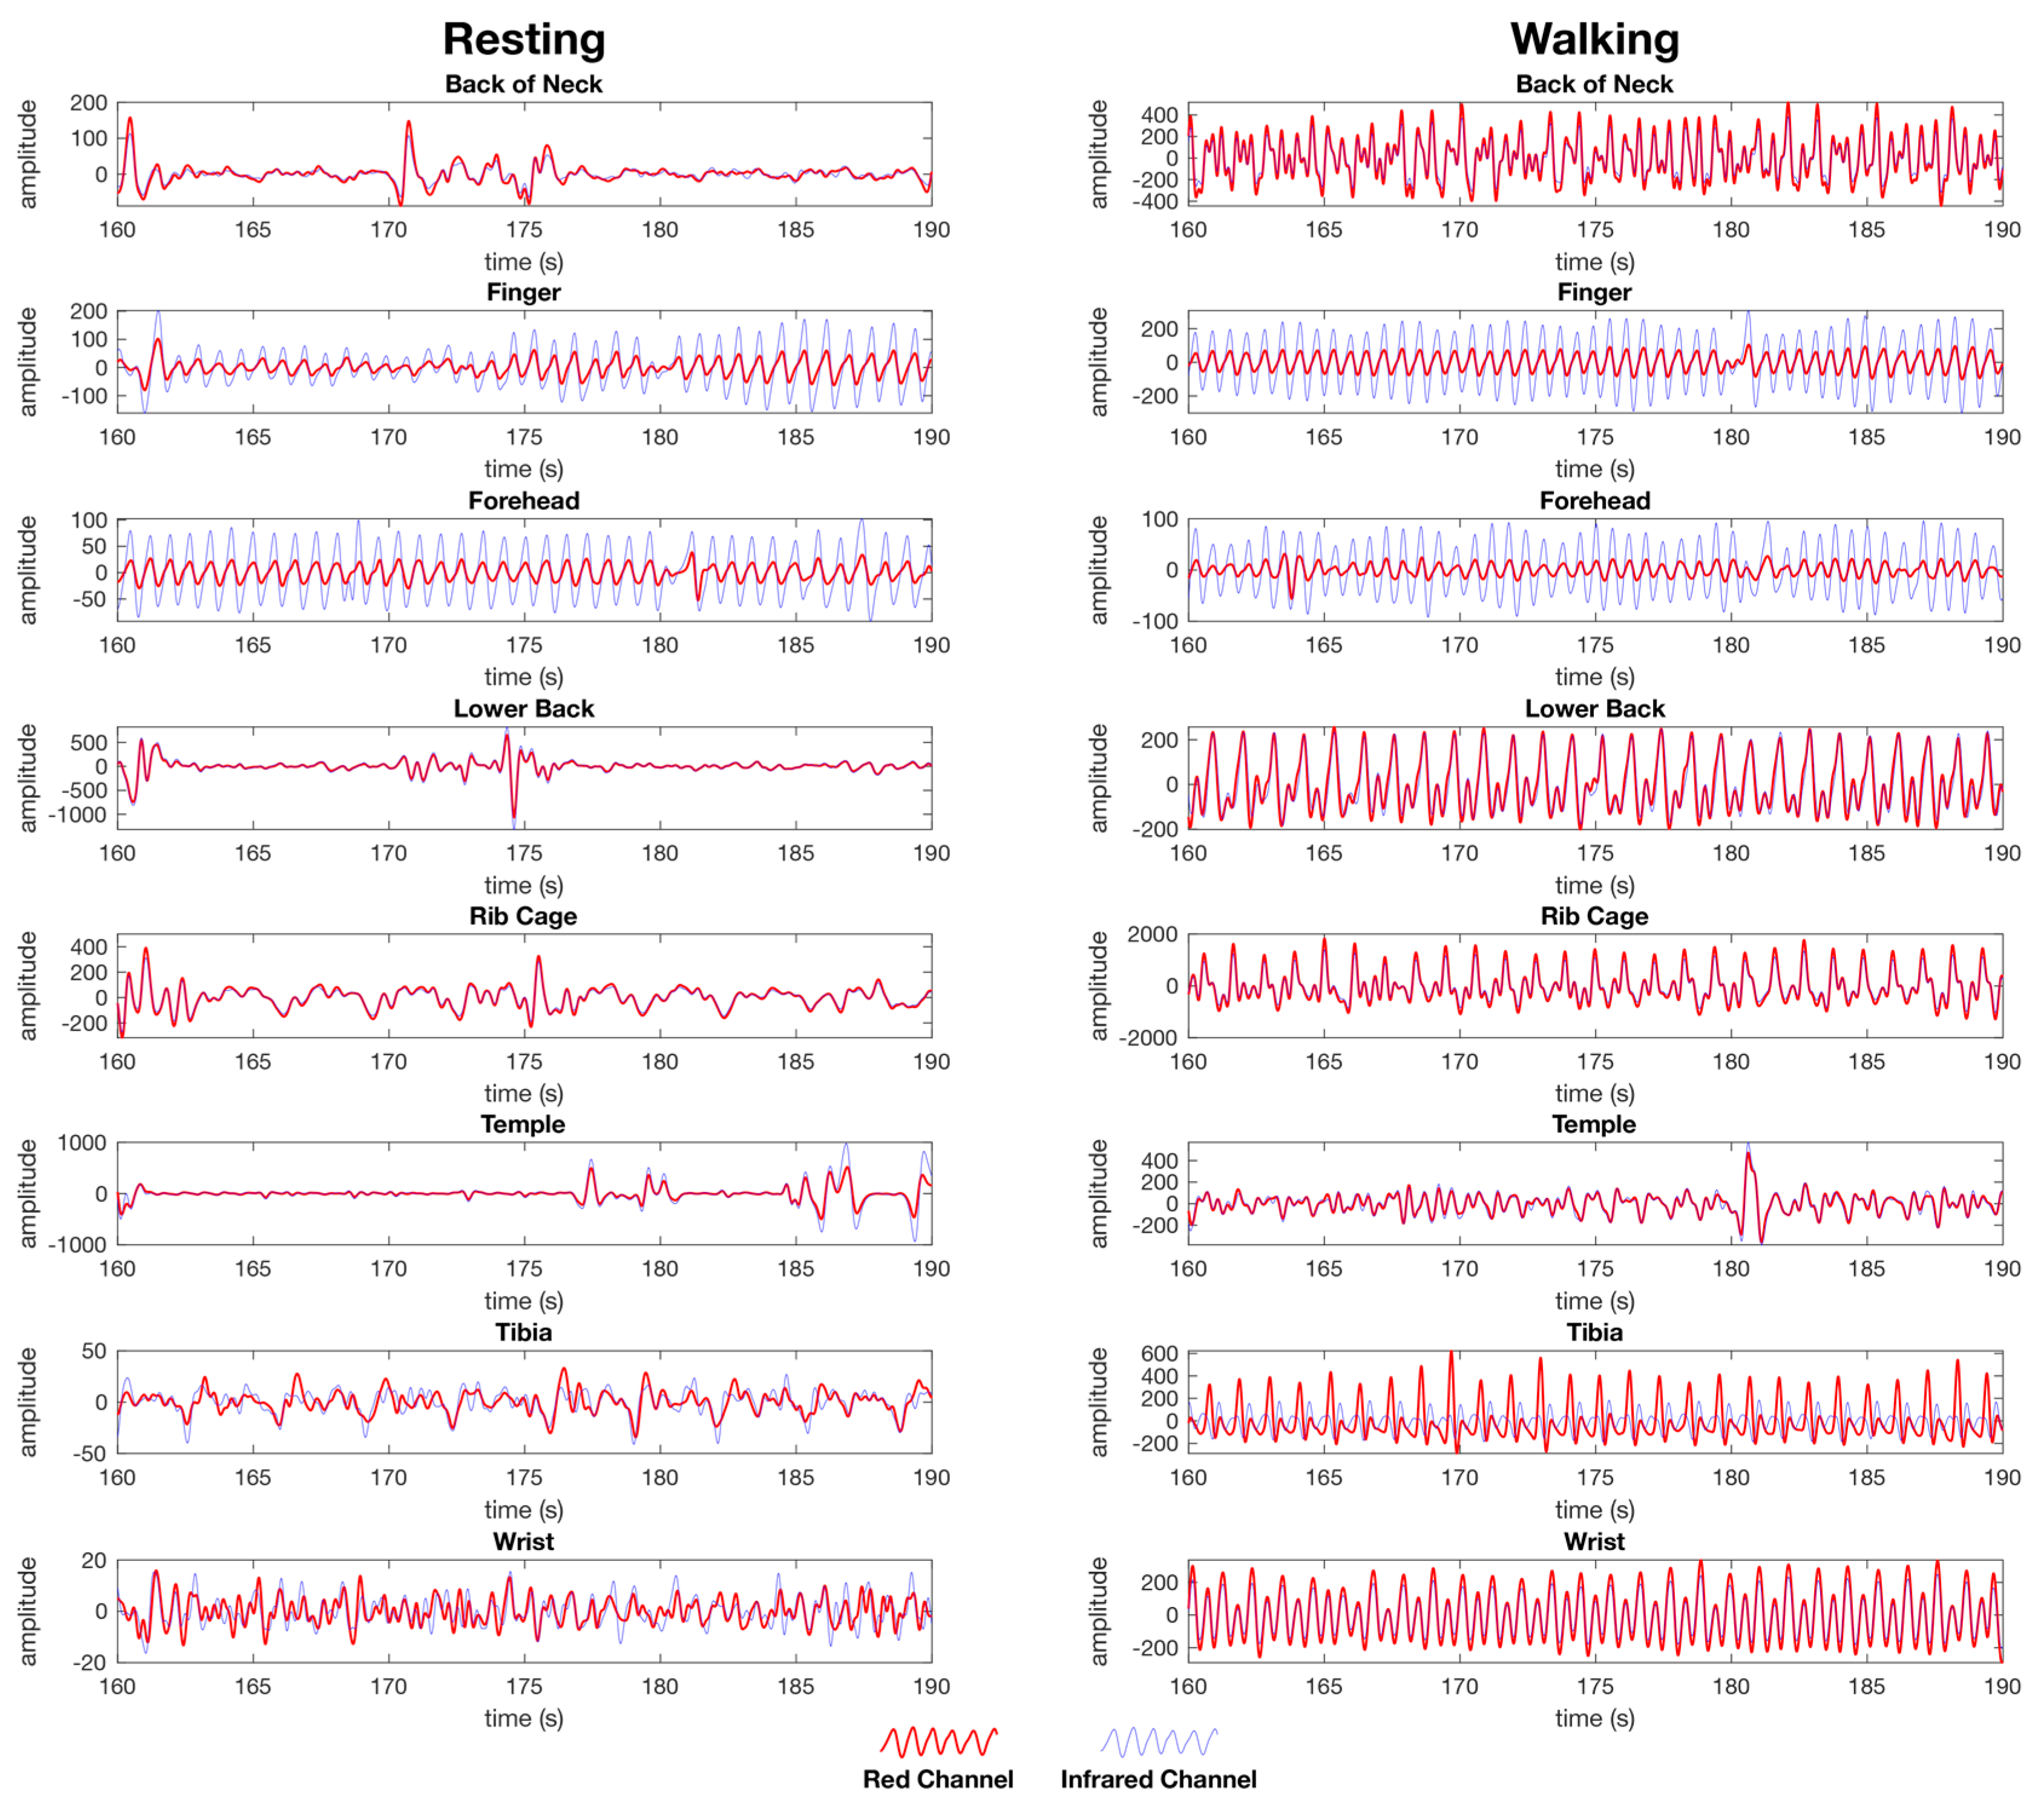
3. Results
3.1. Heart Rate
3.2. SpO2
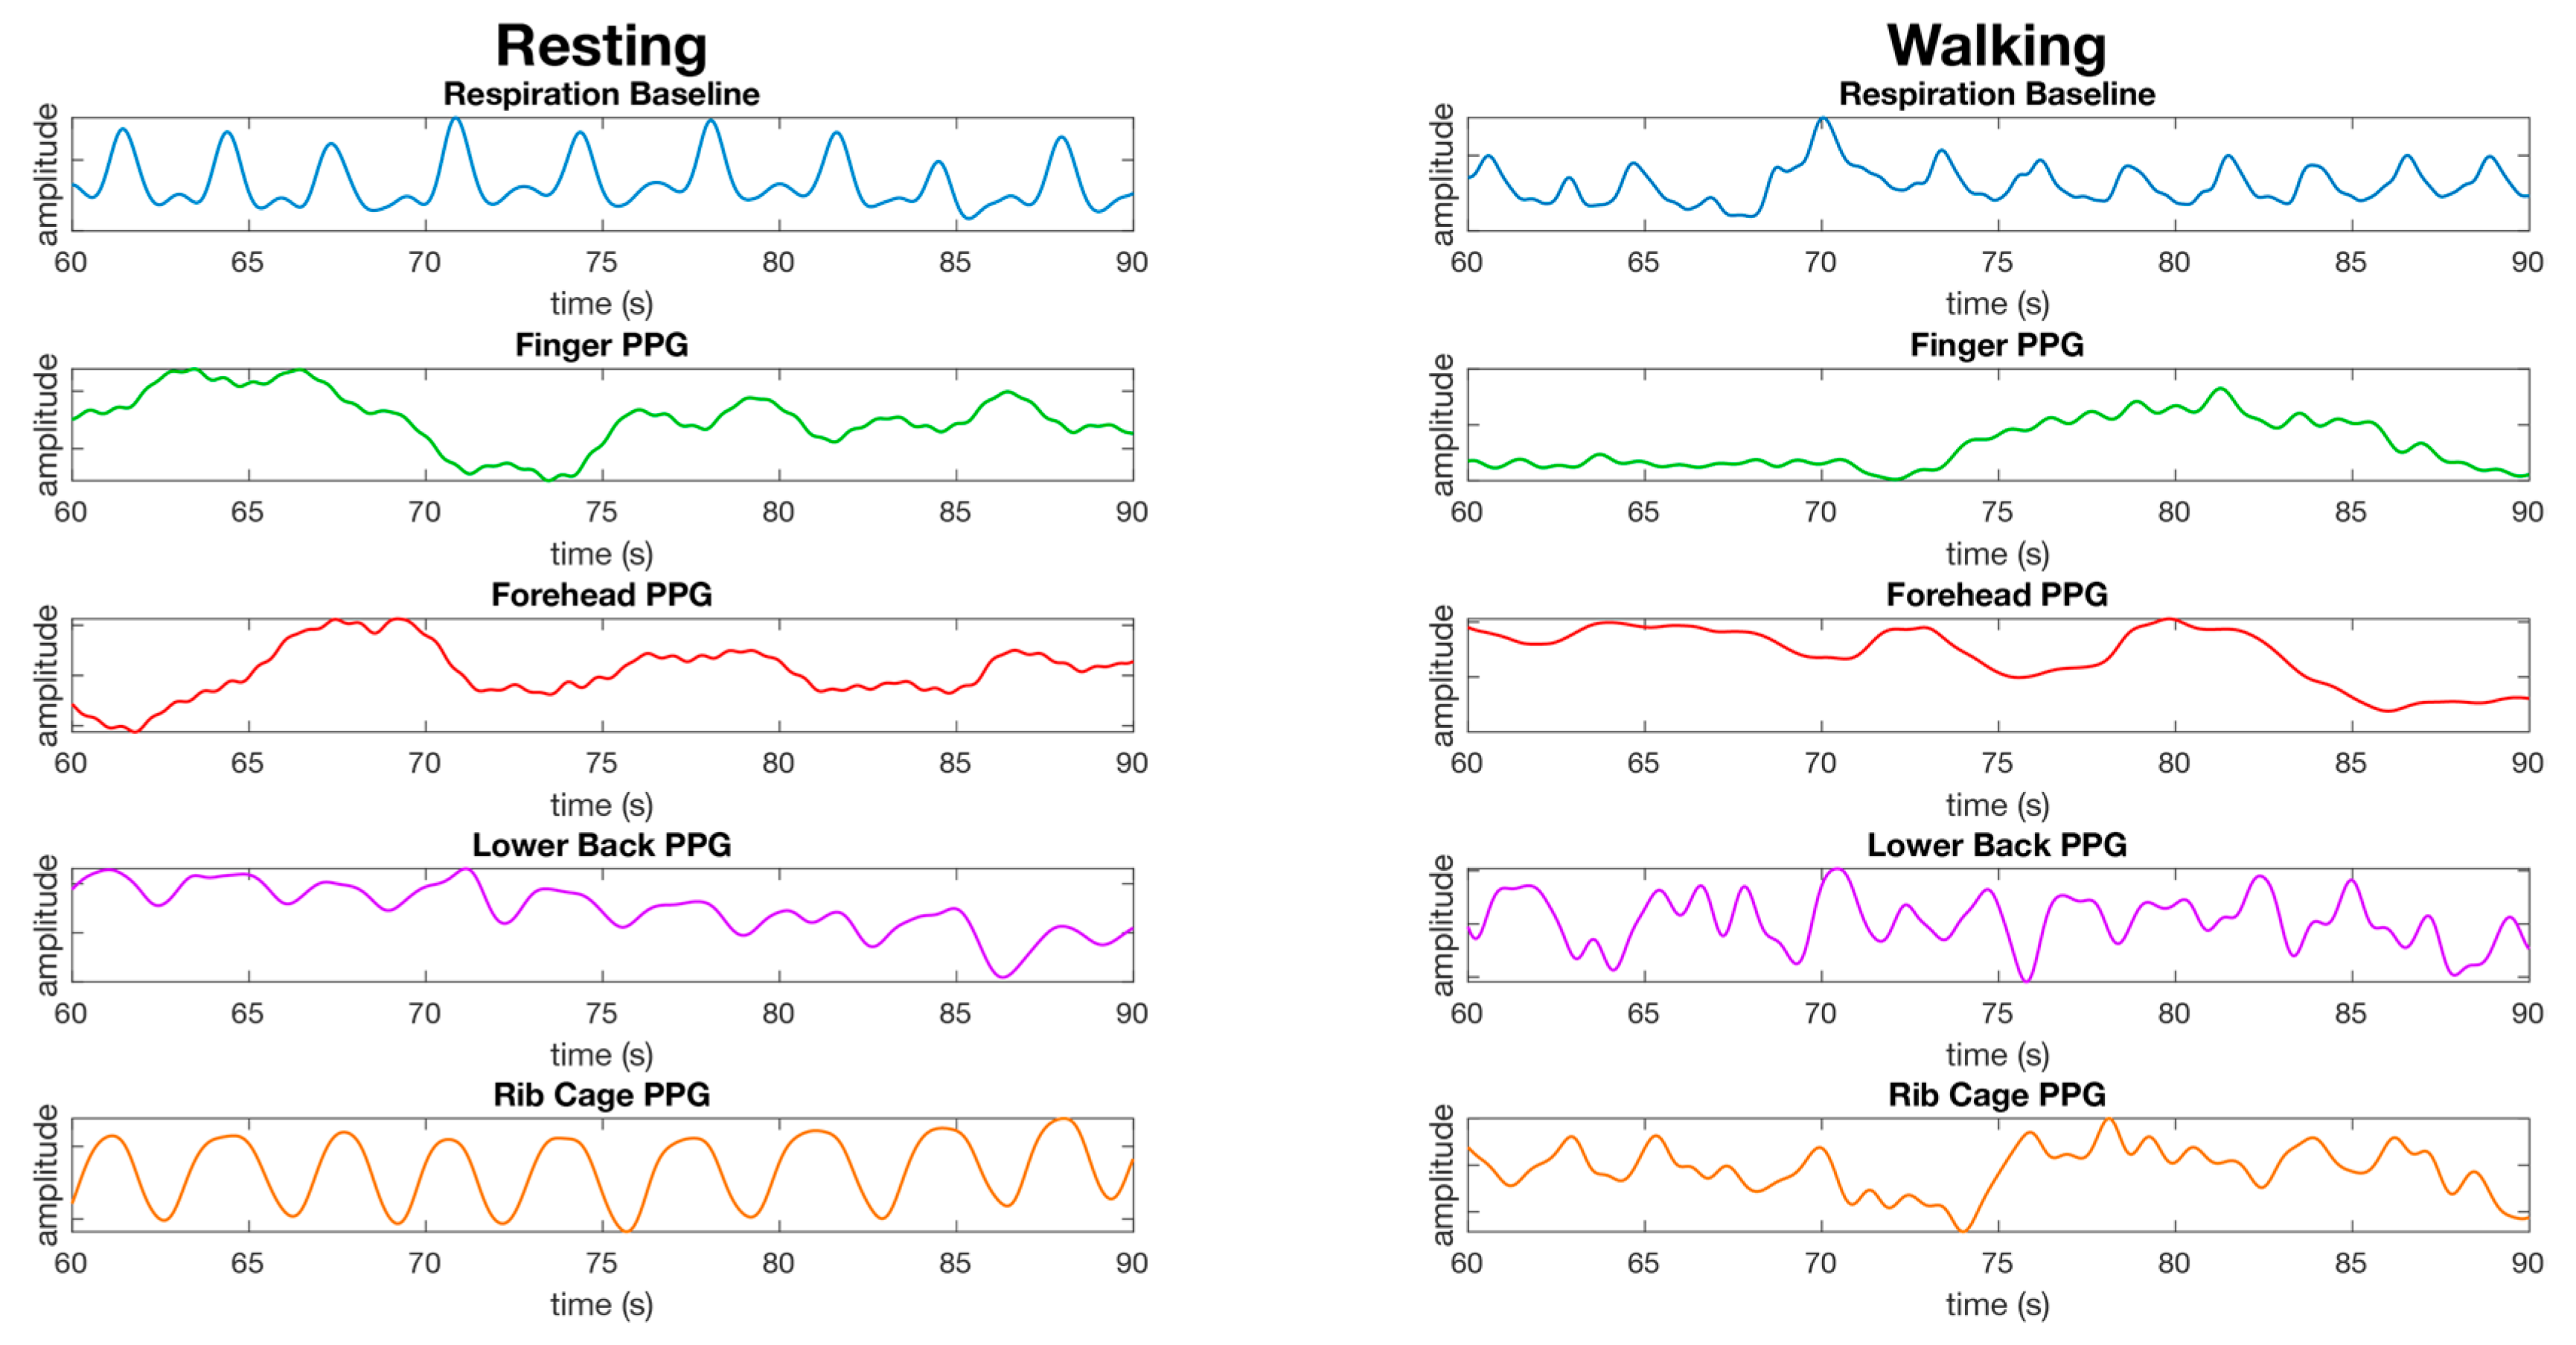
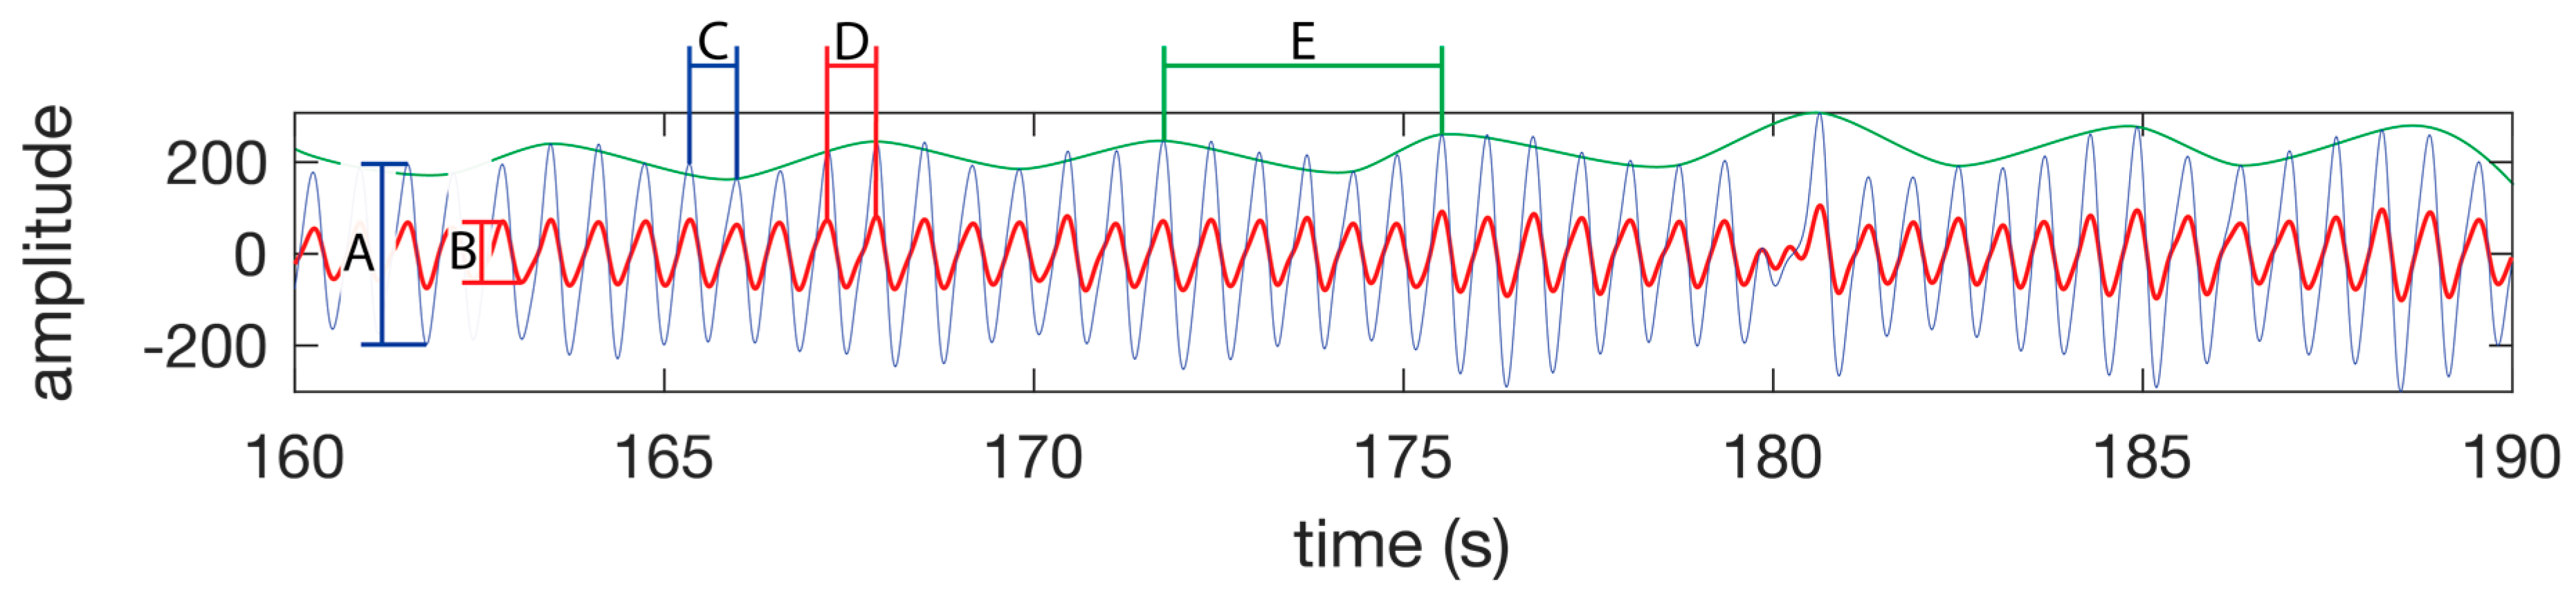
3.3. Respiration
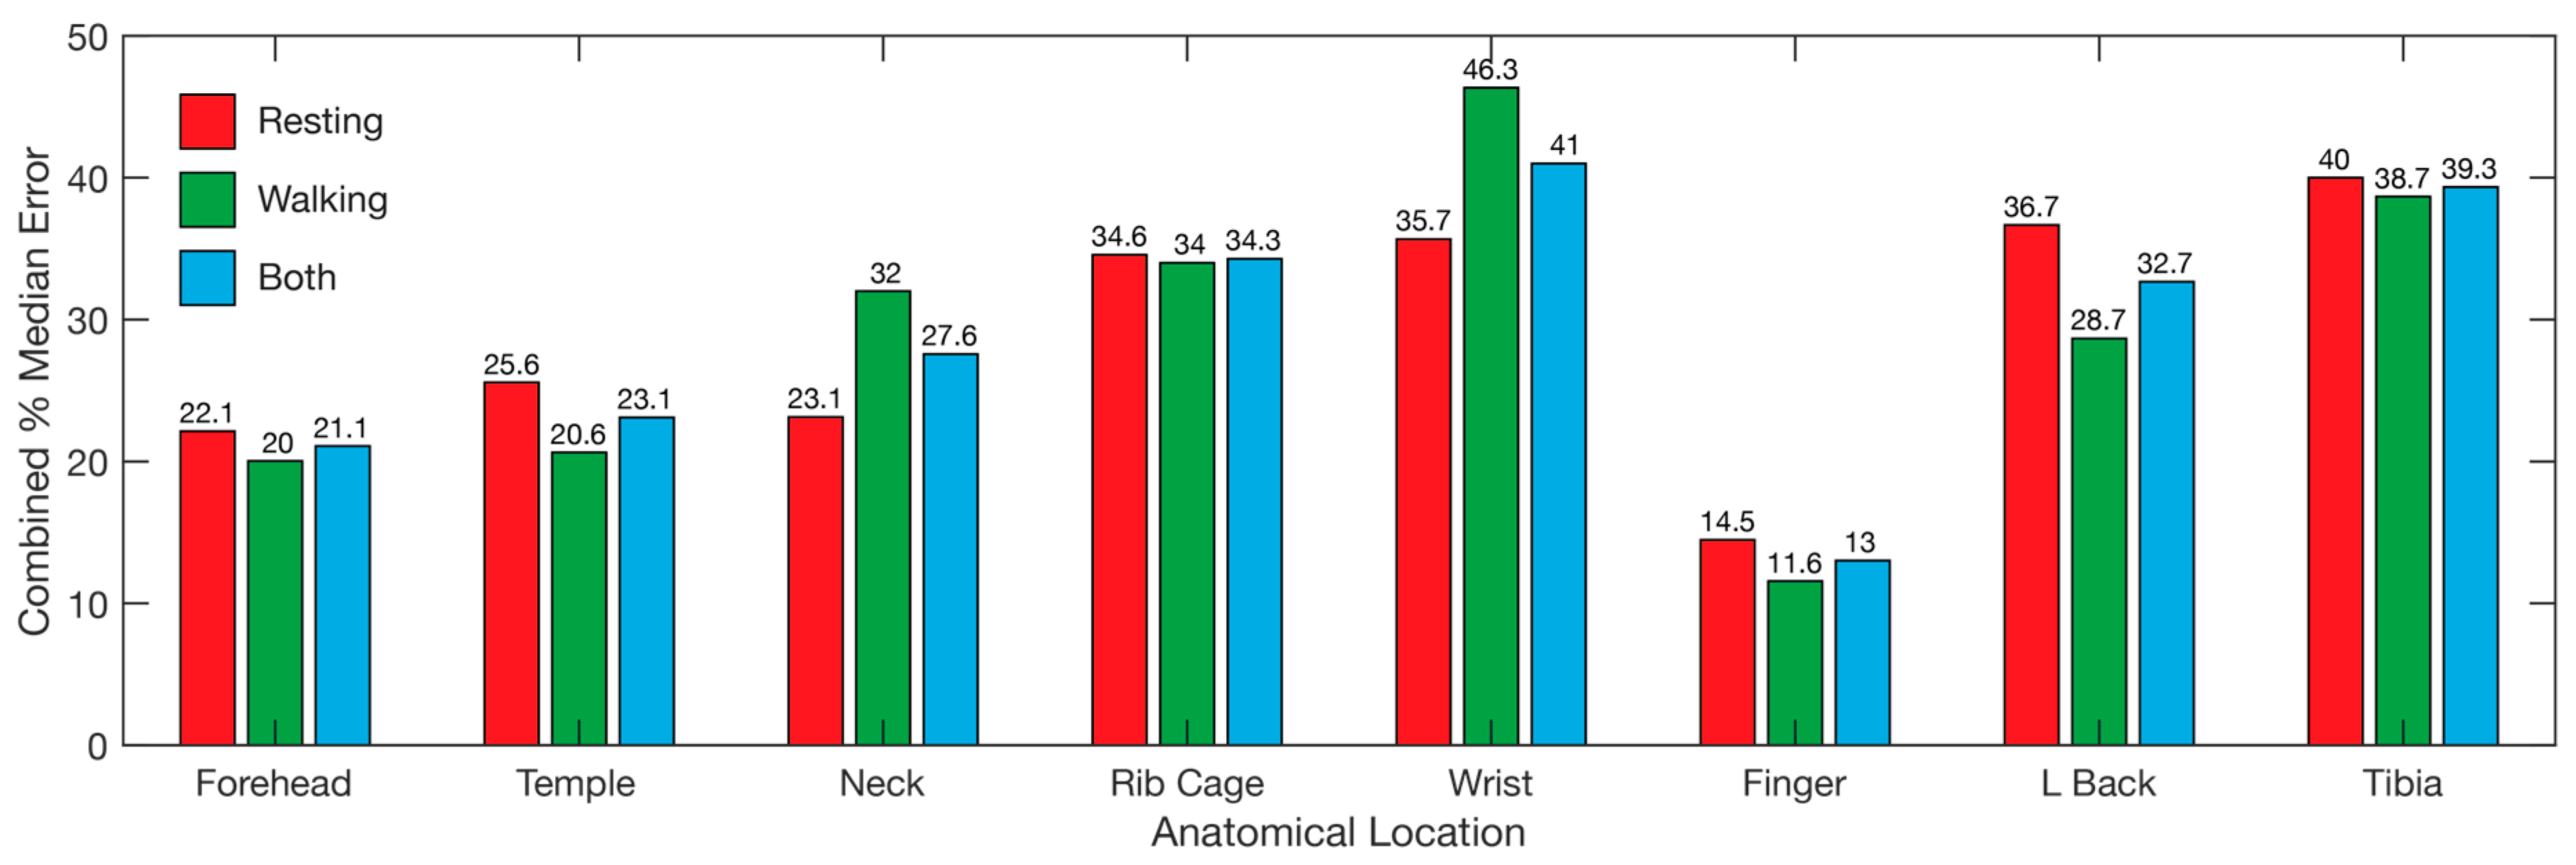
3.4. Overall
4. Discussion
4.1. Single Site Heart Rate, SpO2, and Respiration Rate
4.2. Pulse Oximetry Site Comparison
4.3. Respiration Site Comparison
4.4. Limitations
5. Conclusions
Author Contributions
Funding
Acknowledgments
Conflicts of Interest
References
- Allen, J. Photoplethysmography and its application in clinical physiological measurement. Physiol. Meas. 2007, 28, R1–R39. [Google Scholar] [CrossRef] [PubMed]
- Hertzman, A.B. Comparative Estimation of Blood Supply of Skin Areas from Photoelectrically Recorded Volume Pulse. Proc. Soc. Exp. Biol. Med. 1938, 38, 562–564. [Google Scholar] [CrossRef]
- Hertzman, A.B. The blood supply of various skin areas as estimated by the photoelectric plethysmograph. Am. J. Physiol. 1938, 124, 328–340. [Google Scholar] [CrossRef]
- Seifi, S.; Khatony, A.; Moradi, G.; Abdi, A.; Najafi, F. Accuracy of pulse oximetry in detection of oxygen saturation in patients admitted to the intensive care unit of heart surgery: Comparison of finger, toe, forehead and earlobe probes. BMC Nurs. 2018, 17. [Google Scholar] [CrossRef] [PubMed]
- Cheng, E.Y.; Hopwood, M.B.; Kay, J. Forehead pulse oximetry compared with finger pulse oximetry and arterial blood gas measurement. J. Clin. Monit. Comput. 1988, 4, 223–226. [Google Scholar] [CrossRef]
- Sartor, F.; Papini, G.; Cox, L.G.E.; Cleland, J. Methodological Shortcomings of Wrist-Worn Heart Rate Monitors Validations. J. Med. Internet Res. 2018, 20. [Google Scholar] [CrossRef]
- Barun, V.V.; Ivanov, A.P. Estimation of the spectral absorption of light by components of human skin. Opt. Spectrosc. 2009, 106, 84–91. [Google Scholar] [CrossRef]
- Lynn, L.A.; Curry, J.P. Patterns of unexpected in-hospital deaths: A root cause analysis. Patient Saf. Surg. 2011, 5, 1–24. [Google Scholar] [CrossRef]
- Callahan, J.M. Pulse Oximetry in Emergency Medicine. Emerg. Med. Clin. N. Am. 2008, 26, 869–879. [Google Scholar] [CrossRef] [PubMed]
- Kramer, M.; Lobbestael, A.; Barten, E.; Eian, J.; Rausch, G. Wearable Pulse Oximetry Measurements on the Torso, Arms, and Legs: A Proof of Concept. Mil. Med. 2017, 182, 92–98. [Google Scholar] [CrossRef]
- Grubb, M.R.; Carpenter, J.; Crowe, J.A.; Teoh, J.; Marlow, N.; Ward, C.; Mann, C.; Sharkey, D.; Hayes-Gill, B.R. Forehead reflectance photoplethysmography to monitor heart rate: Preliminary results from neonatal patients. Physiol. Meas. 2014, 35, 881–893. [Google Scholar] [CrossRef]
- Harju, J.; Vehkaoja, A.; Lindroos, V.; Kumpulainen, P.; Liuhanen, S.; Yli-Hankala, A.; Oksala, N. Determination of saturation, heart rate, and respiratory rate at forearm using a Nellcor™ forehead SpO2-saturation sensor. J. Clin. Monit. Comput. 2017, 31, 1019–1026. [Google Scholar] [CrossRef]
- Kiruthiga, A.; Annamol, A.; Balamugesh, T.; Dinesh Prabhu, R.; Christopher, D.J.; Preejith, S.P.; Jayaraj, J.; Mohanasankar, S. Reflectance Pulse Oximetry for Blood Oxygen Saturation Measurement from Diverse Locations-A Preliminary Analysis. In Proceedings of the 2018 IEEE International Symposium on Medical Measurements and Applications (MeMeA), Rome, Italy, 11–13 June 2018; pp. 1–6. [Google Scholar]
- Lee, S.; Shin, H.; Hahm, C. Effective PPG sensor placement for reflected red and green light, and infrared wristband-type photoplethysmography. In Proceedings of the 2016 18th International Conference on Advanced Communication Technology (ICACT), PyeongChang, Korea, 31 January–3 February 2016; pp. 556–558. [Google Scholar]
- Maeda, Y.; Sekine, M.; Tamura, T. Relationship Between Measurement Site and Motion Artifacts in Wearable Reflected Photoplethysmography. J. Med. Syst. 2011, 35, 969–976. [Google Scholar] [CrossRef] [PubMed]
- May, J.M.; Kyriacou, P.A.; Honsel, M.; Petros, A.J. Investigation of photoplethysmographs from the anterior fontanelle of neonates. Physiol. Meas. 2014, 35, 1961–1973. [Google Scholar] [CrossRef] [PubMed] [Green Version]
- Peng, M.; Imtiaz, S.A.; Rodriguez-Villegas, E. Pulse oximetry in the neck—A proof of concept. In Proceedings of the Annual International Conference of the IEEE Engineering in Medicine and Biology Society, Seogwipo, Korea, 11–15 July 2017; pp. 877–880. [Google Scholar]
- Nilsson, L.; Goscinski, T.; Kalman, S.; Lindberg, L.G.; Johansson, A. Combined photoplethysmographic monitoring of respiration rate and pulse: A comparison between different measurement sites in spontaneously breathing subjects. Acta Anaesthesiol. Scand. 2007, 51, 1250–1257. [Google Scholar] [CrossRef]
- Gargiulo, G.D.; Gunawardana, U.; O’Loughlin, A.; Sadozai, M.; Varaki, E.S.; Breen, P.P. A wearable contactless sensor suitable for continuous simultaneous monitoring of respiration and cardiac activity. J. Sens. 2015, 2015. [Google Scholar] [CrossRef]
- Gargiulo, G.D.; O’Loughlin, A.; Breen, P.P. Electro-resistive bands for non-invasive cardiac and respiration monitoring, a feasibility study. Physiol. Meas. 2015, 36, N35–N49. [Google Scholar] [CrossRef]
- MAXREFDES117#: Heart-Rate and Pulse-Oximetry Monitor: Design Resources. Available online: https://www.maximintegrated.com/en/design/reference-design-center/system-board/6300.html/tb_tab2 (accessed on 10 November 2018).
- Chan, E.D.; Chan, M.M.; Chan, M.M. Pulse oximetry: Understanding its basic principles facilitates appreciation of its limitations. Respir. Med. 2013, 107, 789–799. [Google Scholar] [CrossRef] [Green Version]
- Mannheimer, D.P. The Light–Tissue Interaction of Pulse Oximetry. Anesth. Analg. 2007, 105, S10–S17. [Google Scholar] [CrossRef] [Green Version]
- Addison, P.S.; Watson, J.N.; Mestek, M.L.; Ochs, J.P.; Uribe, A.A.; Bergese, S.D. Pulse oximetry-derived respiratory rate in general care floor patients. J. Clin. Monit. Comput. 2015, 29, 113–120. [Google Scholar] [CrossRef]
- van Gastel, M.; Stuijk, S.; de Haan, G. Robust respiration detection from remote photoplethysmography. Biomed. Opt. Express 2016, 7, 4941. [Google Scholar] [CrossRef] [PubMed]
- Vegfors, M.; Ugnell, H.; Hök, B.; Oberg, P.Å.; Lennmarken, C. Experimental evaluation of two new sensors for respiratory rate monitoring. Physiol. Meas. 1993, 14, 171–181. [Google Scholar] [CrossRef]
- Johansson, A.; Öberg, P.Å. Estimation of respiratory volumes from the photoplethysmographic signal. Part I: Experimental results. Med. Biol. Eng. Comput. 1999, 37, 42–47. [Google Scholar] [CrossRef] [PubMed]
- Johansson, A.; Öberg, P.Å. Estimation of respiratory volumes from the photoplethysmographic signal. Part 2: A model study. Med. Biol. Eng. Comput. 1999, 37, 48–53. [Google Scholar] [CrossRef] [PubMed]
- Nilsson, L.; Johansson, A.; Kalman, S. Macrocirculation is not the sole determinant of respiratory induced variations in the reflection mode photoplethysmographic signal. Physiol. Meas. 2003, 24, 925–937. [Google Scholar] [CrossRef] [PubMed]
- Meredith, D.J.; Clifton, D.; Charlton, P.; Brooks, J.; Pugh, C.W.; Tarassenko, L. Photoplethysmographic derivation of respiratory rate: A review of relevant physiology. J. Med. Eng. Technol. 2012, 36, 1–7. [Google Scholar] [CrossRef]
- Karlen, W.; Garde, A.; Myers, D.; Scheffer, C.; Ansermino, J.M.; Dumont, G.A. Estimation of Respiratory Rate from Photoplethysmographic Imaging Videos Compared to Pulse Oximetry. IEEE J. Biomed. Health 2015, 19, 1331–1338. [Google Scholar] [CrossRef] [PubMed]


| Location | Heart Rate | Respiration |
|---|---|---|
| Forearm | Poor | Excellent |
| Finger (Reflective PPG) | Poor | Excellent |
| Finger (Transmissive PPG) | Poor | Excellent |
| Forehead | Moderate | Good |
| Wrist | Moderate | Good |
| Shoulder (560 nm) | Good | Good |
| Shoulder (806 nm) | Good | Good |
| Setting | Value |
|---|---|
| Sampling Average | 1 (no averaging) |
| FIFO Rolls on Full | Enabled |
| FIFO Almost Full Value | 24 |
| Mode Control | SpO2 Mode (Red and IR) |
| SpO2 ADC Range Control | 4096 |
| SpO2 Sample Rate Control | 100 Samples per Second |
| LED Pulse Width Control | 411 µs (18 bits) |
| Location | Resting Median Error % (s.d.) | Walking Median Error % (s.d.) | ||||
|---|---|---|---|---|---|---|
| Red | IR | Red & IR | Red | IR | Red and IR | |
| Forehead | 1.5 (±17) | 0.68 (±1.5) | 1.4 (±8.3) | 4.6 (±7.8) | 4.2 (±7.5) | 4.3 (±7.6) |
| Temple | 58 (±14) | 5.9 (±23) | 36 (±14) | 8.3 (±17) | 9.3 (±17) | 9.2 (±17) |
| Neck | 67 (±25) | 31 (±36) | 51 (±27) | 11 (±28) | 11 (±31) | 13 (±28) |
| Rib Cage | 56 (±18) | 51 (±17) | 52 (±13) | 14 (±24) | 14 (±25) | 13 (±24) |
| Wrist | 76 (±17) | 62 (±32) | 68 (±23) | 10 (±10) | 11 (±10) | 11 (±10) |
| Finger | 1.4 (±18) | 1.2 (±16) | 1.3 (±16) | 6.8 (±11) | 5.9 (±10) | 6.5 (±10) |
| L Back | 75 (±17) | 76 (±15) | 76 (±15) | 19 (±25) | 16 (±25) | 18 (±25) |
| Tibia | 83 (±12) | 81 (±12) | 81 (±11) | 28 (±22) | 34 (±20) | 30 (±19) |
| Location | Resting Median Error % (s.d.) | Walking Median Error (s.d.) |
|---|---|---|
| Forehead | 2.0 (±1.1) | 2.8 (±2.2) |
| Temple | 2.7 (±7.7 × 10⁴) | 6.7 (±5.9 × 10²) |
| Neck | 8.4 (±47) | 41 (±43) |
| Rib Cage | 48 (±91) | 54 (±52) |
| Wrist | 20 (±29) | 97 (±36) |
| Finger | 2.1 (±1.2) | 2.2 (±6.3) |
| L Back | 22 (±2.4 × 10³) | 19 (±1.6 × 10³) |
| Tibia | 27 (±39) | 28 (±2.7 × 10²) |
| Location | Resting Median Error rpm (s.d.) | Walking Median Error rpm (s.d.) | ||
|---|---|---|---|---|
| Red | Infrared | Red | Infrared | |
| Forehead | 6.6 (±16) | 18 (±21) | 16 (±11) | 15 (±11) |
| Temple | 4.5 (±10) | 5.4 (±12) | 7.2 (±11) | 8.5 (±14) |
| Neck | 0.26 (±8.7) | 1.1 (±8.7) | 7.1 (±12) | 8.7 (±12) |
| Rib Cage | 0.13 (±6.6) | 0.19 (±6.8) | 2.9 (±13) | 0.36 (±13) |
| Wrist | 1.1 (±7.7) | 0.2 (±7.7) | 11 (±12) | 8.4 (±13) |
| Finger | 0.55 (±13) | 0.11 (±13) | 6.5 (±9.2) | 3.9 (±10) |
| L Back | 0.73 (±6.7) | 0.73 (±6.5) | 14 (±17) | 13 (±17) |
| Tibia | 0.29 (±8.3) | 0.21 (±8.4) | 26 (±11) | 19 (±12) |
© 2019 by the authors. Licensee MDPI, Basel, Switzerland. This article is an open access article distributed under the terms and conditions of the Creative Commons Attribution (CC BY) license (http://creativecommons.org/licenses/by/4.0/).
Share and Cite
Longmore, S.K.; Lui, G.Y.; Naik, G.; Breen, P.P.; Jalaludin, B.; Gargiulo, G.D. A Comparison of Reflective Photoplethysmography for Detection of Heart Rate, Blood Oxygen Saturation, and Respiration Rate at Various Anatomical Locations. Sensors 2019, 19, 1874. https://doi.org/10.3390/s19081874
Longmore SK, Lui GY, Naik G, Breen PP, Jalaludin B, Gargiulo GD. A Comparison of Reflective Photoplethysmography for Detection of Heart Rate, Blood Oxygen Saturation, and Respiration Rate at Various Anatomical Locations. Sensors. 2019; 19(8):1874. https://doi.org/10.3390/s19081874
Chicago/Turabian StyleLongmore, Sally K., Gough Y. Lui, Ganesh Naik, Paul P. Breen, Bin Jalaludin, and Gaetano D. Gargiulo. 2019. "A Comparison of Reflective Photoplethysmography for Detection of Heart Rate, Blood Oxygen Saturation, and Respiration Rate at Various Anatomical Locations" Sensors 19, no. 8: 1874. https://doi.org/10.3390/s19081874