A Highly Selective and Sensitive Fluorescent Chemosensor for Detecting Al3+ Ion in Aqueous Solution and Plant Systems


1
Department of Chemistry, National Changhua University of Education, Changhua 50058, Taiwan
2
Department of Biology, National Changhua University of Education, Changhua 50058, Taiwan
*
Authors to whom correspondence should be addressed.
Sensors 2019, 19(3), 623; https://doi.org/10.3390/s19030623
Submission received: 27 December 2018
/
Revised: 29 January 2019
/
Accepted: 31 January 2019
/
Published: 1 February 2019
(This article belongs to the Special Issue Synthesis and Characterization of Optical Sensors for Environmental Monitoring)
Abstract
:The solubilized form of aluminum, Al3+, is present under acid soil conditions and toxic to both animals and plants. Detecting and quantifying Al3+ is vital for both chemistry and biology. A new Schiff-based fluorescent turn-on sensor (probe L) for the selective detection of the Al3+ ion was synthesized by coupling 2-hydroxy-1-naphthaldehyde and 2-aminoisoindoline-1,3-dione, and the structure was characterized by nuclear magnetic resonance spectra. The probe L exhibited an excellent selective and sensitive response to the Al3+ ion over other metal ions in DMSO-H2O (1:9 v/v). Fluorescence quantification revealed that probe L was promising for the detection and accumulation of Al3+. Treating rice seedlings with Al3+ at 25–200 μM inhibited their growth. Al3+ treatment produced reactive oxygen species in rice roots. Practical applications of the fluorescent probe for the quantification of Al3+ in water samples and rice seedlings are demonstrated. Detecting the Al3+ ion with the probe L is easy and a potential alternative to existing analytical methods. The method can be used for detecting the Al3+ content of aqueous solution and plant systems. The novel fluorescent probe L has good potential for monitoring Al3+ content in the environment and biological systems.

1. Introduction
Aluminum (Al) is the third most abundant element in the earth’s crust. With acidic rain and industrial pollution, a trivalent cation of Al3+ is solubilized and widely exists in the environment. Approximately 40 to 50% of the world’s arable soils are acidic, and the toxicity of Al is considered an important limiting factor of plant productivity on acidic soils [1,2,3]. Excessive Al content in contaminated soil leads to a decrease in soil microbial content and hampers plant growth [4]. Additionally, Al is widespread in food additives, pharmaceuticals, and storage/cooking utensils. Al3+ ions, the solubilized form of Al, enhance the peroxidation of phospholipids and proteins in cell membranes. Al3+ ions can move in the human body via food and water sources. Heavy metal intake by human populations through the food chain damages the nervous system and can induce Alzheimers and Parkinsons disease and amyotrophic lateral sclerosis [5,6,7,8].
Al in its ionic form, Al3+, is found in most animal and plant tissues and in natural water. Detecting and quantifying Al3+ is crucial for controlling its concentration in the biosphere and its direct impact on human health. Various kinds of sensors have been reported for selective Al3+ detection [9,10,11,12,13,14,15,16,17,18,19,20,21,22,23,24,25,26]. However, these sensors are limited by their complicated synthesis, low water solubility, and lack of sensitivity. For practical applications, a water-soluble sensor for detecting Al3+ is still in great demand. Recently, several fluorescent probes have been synthesized for sensing Al3+ in cells [27,28,29,30]. The use of fluorescent probes for biosensing and bioimaging the ion in animal cells has also been reported. However, these fluorescent probes have not yet been examined for their application in plant systems. The detection of metal ion by fluorescent probes in plant tissues has always been problematic because of interference from the intrinsic fluorescence of the cell wall and secondary metabolites such as tannins, alkaloids, and polyphenols [31,32].
In this study, we designed a fluorescent sensor, probe L (Scheme 1), that showed a selective colorimetric change toward Al3+ among the other tested metal ions. To demonstrate the potential of probe L for biological detection, we first analyzed the effect of Al3+ exposure on root elongation in rice (Oryza sativa L. cv. TN67). The toxicity and accumulation of Al3+ were evaluated in rice seedlings and we used probe L to quantify the Al3+ level in rice seedlings. The toxicity and accumulation of Al3+ inhibited cell elongation and cell division, which led to the stunted growth of roots. Al3+ treatment may decrease the uptake of water and nutrients and negatively affect plant growth.
2. Materials and Methods
2.1. Synthesis of Probe L
The synthesis of probe L was based on the following method (Scheme 1). 2-hydroxy-1-naphthaldehyde (0.278 g, 1.61 mmol) was added to a solution of 2-aminoisoindoline-1,3-dione (0.303 g, 1.87 mmol) in dry ethanol (15 mL) with two drops of acetic acid. The reaction mixture was refluxed overnight and then the solvent was removed under reduced pressure. The resulting solid was washed with cooled EtOH repeatedly to give probe L (0.469 g, 80%) as a yellow solid; melting point: 234.0 °C; 1H NMR (300 MHz, DMSO-d6) 11.95 (s, 1H), 10.07 (s, 1H), 8.62 (d, 1H, J = 4.4 Hz), 8.05 (d, 1H, J = 4.4 Hz), 7.99–7.90 (m, 5H), 7.66–7.61 (m, 1H), 7.47–7.42 (m, 1H), 7.28 (d, 1H, J = 4.5 Hz); 13C NMR (75 MHz, DMSO-d6) 164.33, 159.50, 159.26, 134.99, 131.77, 130.16, 129.04, 128.44, 127.99,123.94, 123.54, 122.28, 118.67, 108.61; HRMS(EI): calculated for C19H12N2O3(M + H), m/z 316.0848; resulting m/z 316.0839. (Figures S1–S3).
2.2. Plant Materials and Growth Conditions
Rice plants (Oryza sativa L. cv. TN67) were grown as described in [33] with minor modification. The seeds were incubated at 37 °C for 3 d in darkness. Ten germinated seeds with coleoptiles reaching 2 mm in length were transferred to a Petri dish (9 cm in diameter) with a filter paper. The rice seedlings were incubated with deionized water supplemented with Al(ClO4)3 (Sigma-Aldrich, St. Louis, MO, USA) from 25 to 200 μM, treated with Al3+ solution (10 mL in each Petri dish) for 10 d, then subcultured with fresh solution for another 10 d. Control seedlings were incubated without Al3+. The rice seedlings were analyzed for root elongation and reactive oxygen species (ROS) production. For measuring dry weight and accumulation of Al3+, samples were dried by incubation at 37 °C for 7 d. Data were obtained from at least three biological replicates.
2.3. Use of Probe L to Determine Al Concentration in Rice
Roots of 20-day-old rice seedlings were rinsed thoroughly with deionized water and oven-dried for 2 d at 37 °C. Ten rice seedlings were ground into fine powder and dissolved with 24× deionized water. The extract was mixed with an equal volume of chloroform and then centrifuged at 2000 g for 2 min. Al3+ content was determined in the supernatant (270 μL) by supplementation with the fluorescence probe L (30 μL) dissolved in 10% DMSO. Samples of 400 μM probe L were incubated at 2 °C for 20 min. The Al3+-induced specific fluorescence was determined by fluorescence spectrometry (FP-8300, JASCO, Germany) at 375 nm excitation. Data are mean values from three independent biological replicates.
2.4. In Situ Detection of Reactive Oxygen Species (ROS)
Rice roots were treated with various concentrations of Al(ClO4)3 for 14 d. H2O2 levels were detected by treating roots with 3,3’-diamninobenzidine (DAB). To detect H2O2, root samples were placed in a solution [10 mM 2-(N-morpholino)ethanesulfonic acid (MES) buffer, pH 3.8] of 1 mg mL−1 DAB overnight in darkness. Root samples were rinsed briefly with deionized water. Staining was observed by stereomicroscopy.
3. Results and Discussion
3.1. Absorption and Fluorescence Studies of Probe L Toward Various Metal Ions
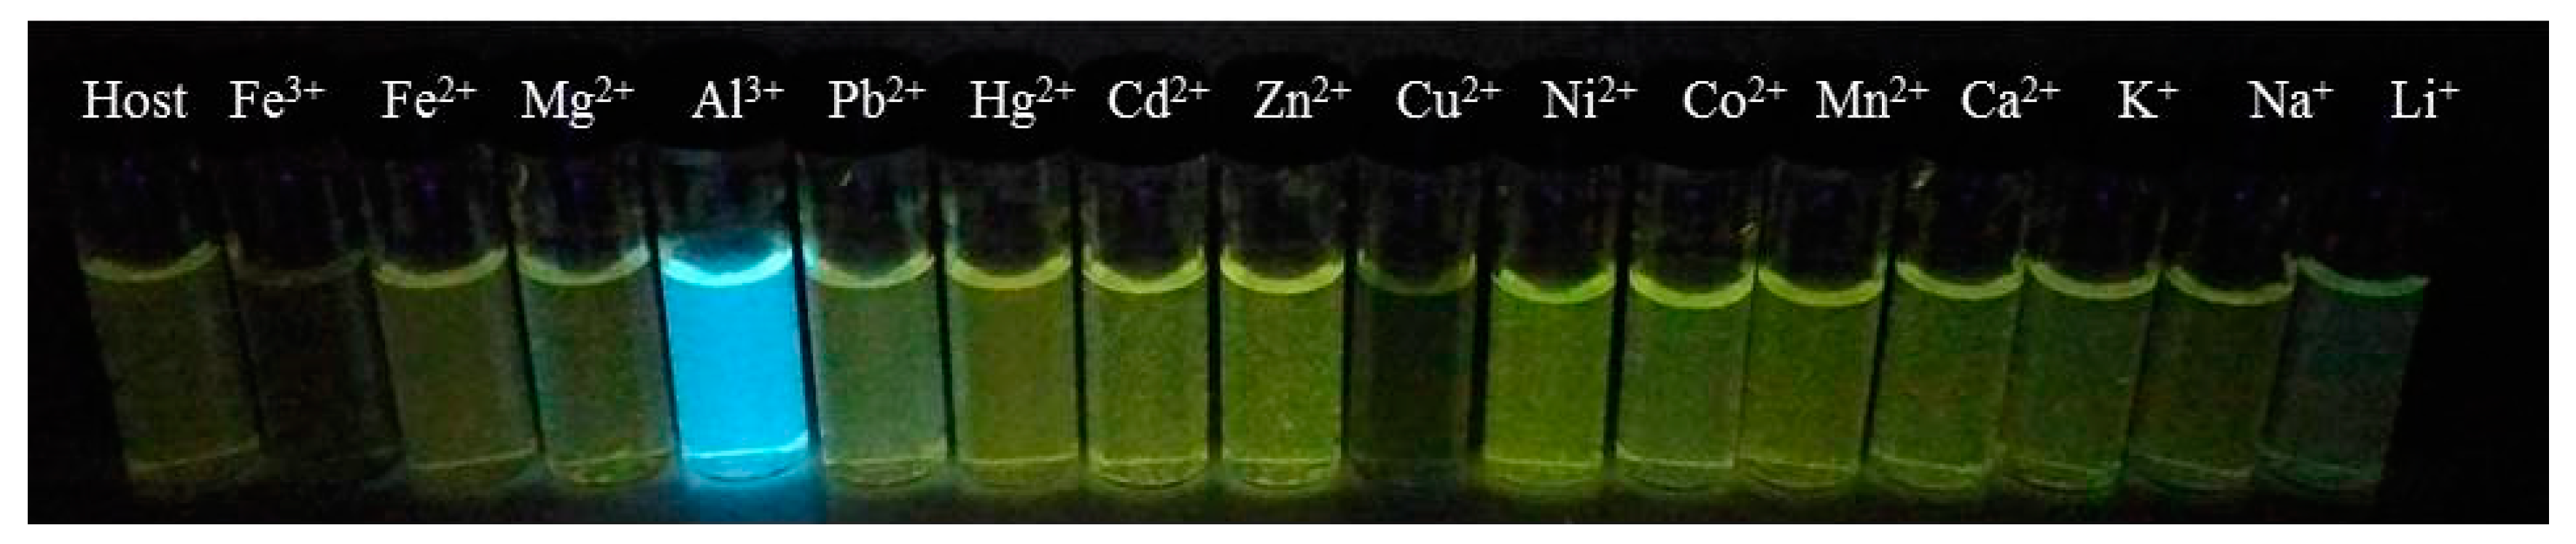
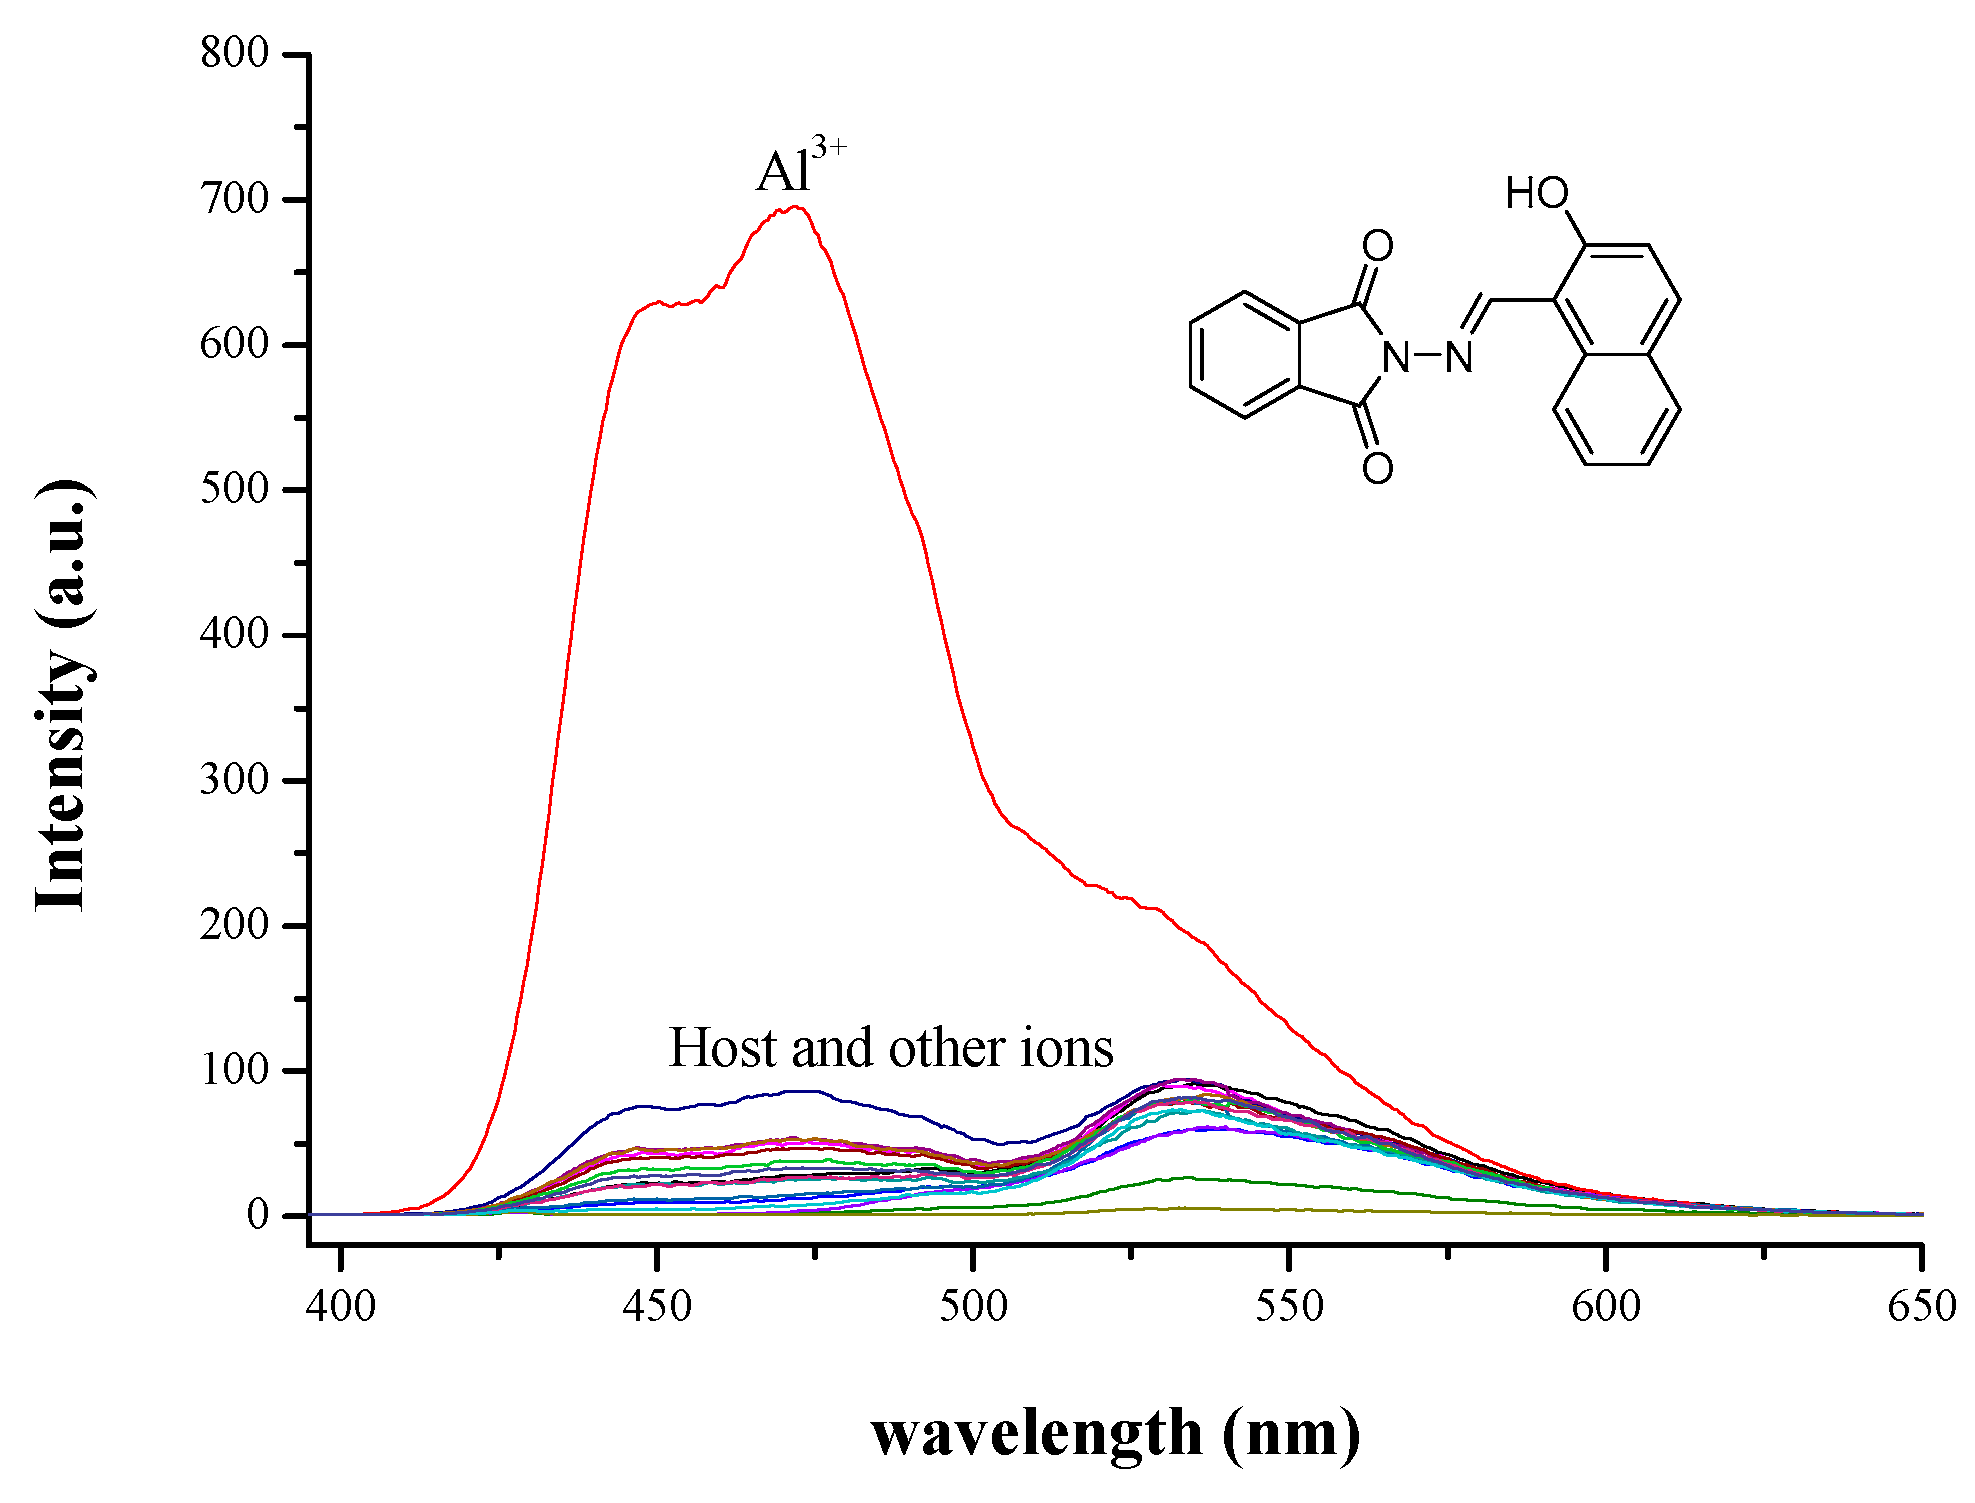
We used by UV/vis and fluorescence measurements to investigate the chemosensor behavior of probe L with the following 16 metal ions (as perchlorate salts): Li+, Na+, K+, Ca2+, Mg2+, Mn2+, Hg2+, Fe2+, Fe3+, Co2+, Ni2+, Cu2+, Pb2+, Cd2+, Zn2+, and Al3+ in DMSO-H2O (1:9 v/v). The solution of probe L itself showed two absorption bands at 320 nm and 370 nm, respectively (Figure 1). The addition of Fe3+ and Fe2+ to the solution enhanced the absorption band. In the presence of Cu2+, the absorption spectrum of probe L was red-shifted, accompanied by a striking color change from dark green to black, which could be seen under UV light (Figure 2). In the presence of Al3+, the intensity of the absorption spectrum of probe L was decreased, accompanied by a striking color change from dark green to blue, which could be detected under UV light (Figure 2). These changes in absorption bands indicated a partial interaction between the ions and probe L. As compared with the weak emission band of probe L alone, the addition of Al3+ generated an additional fluorescent-enhanced emission band at 472 nm (Figure 3). The enhanced efficiency at 472 nm was 11-fold greater than the control without Al3+ (Figure S4). The fluorescent enhancement may be attributed to the formation of a rigid system after binding with Al3+.
3.2. Fluorescence Titration and Binding Studies
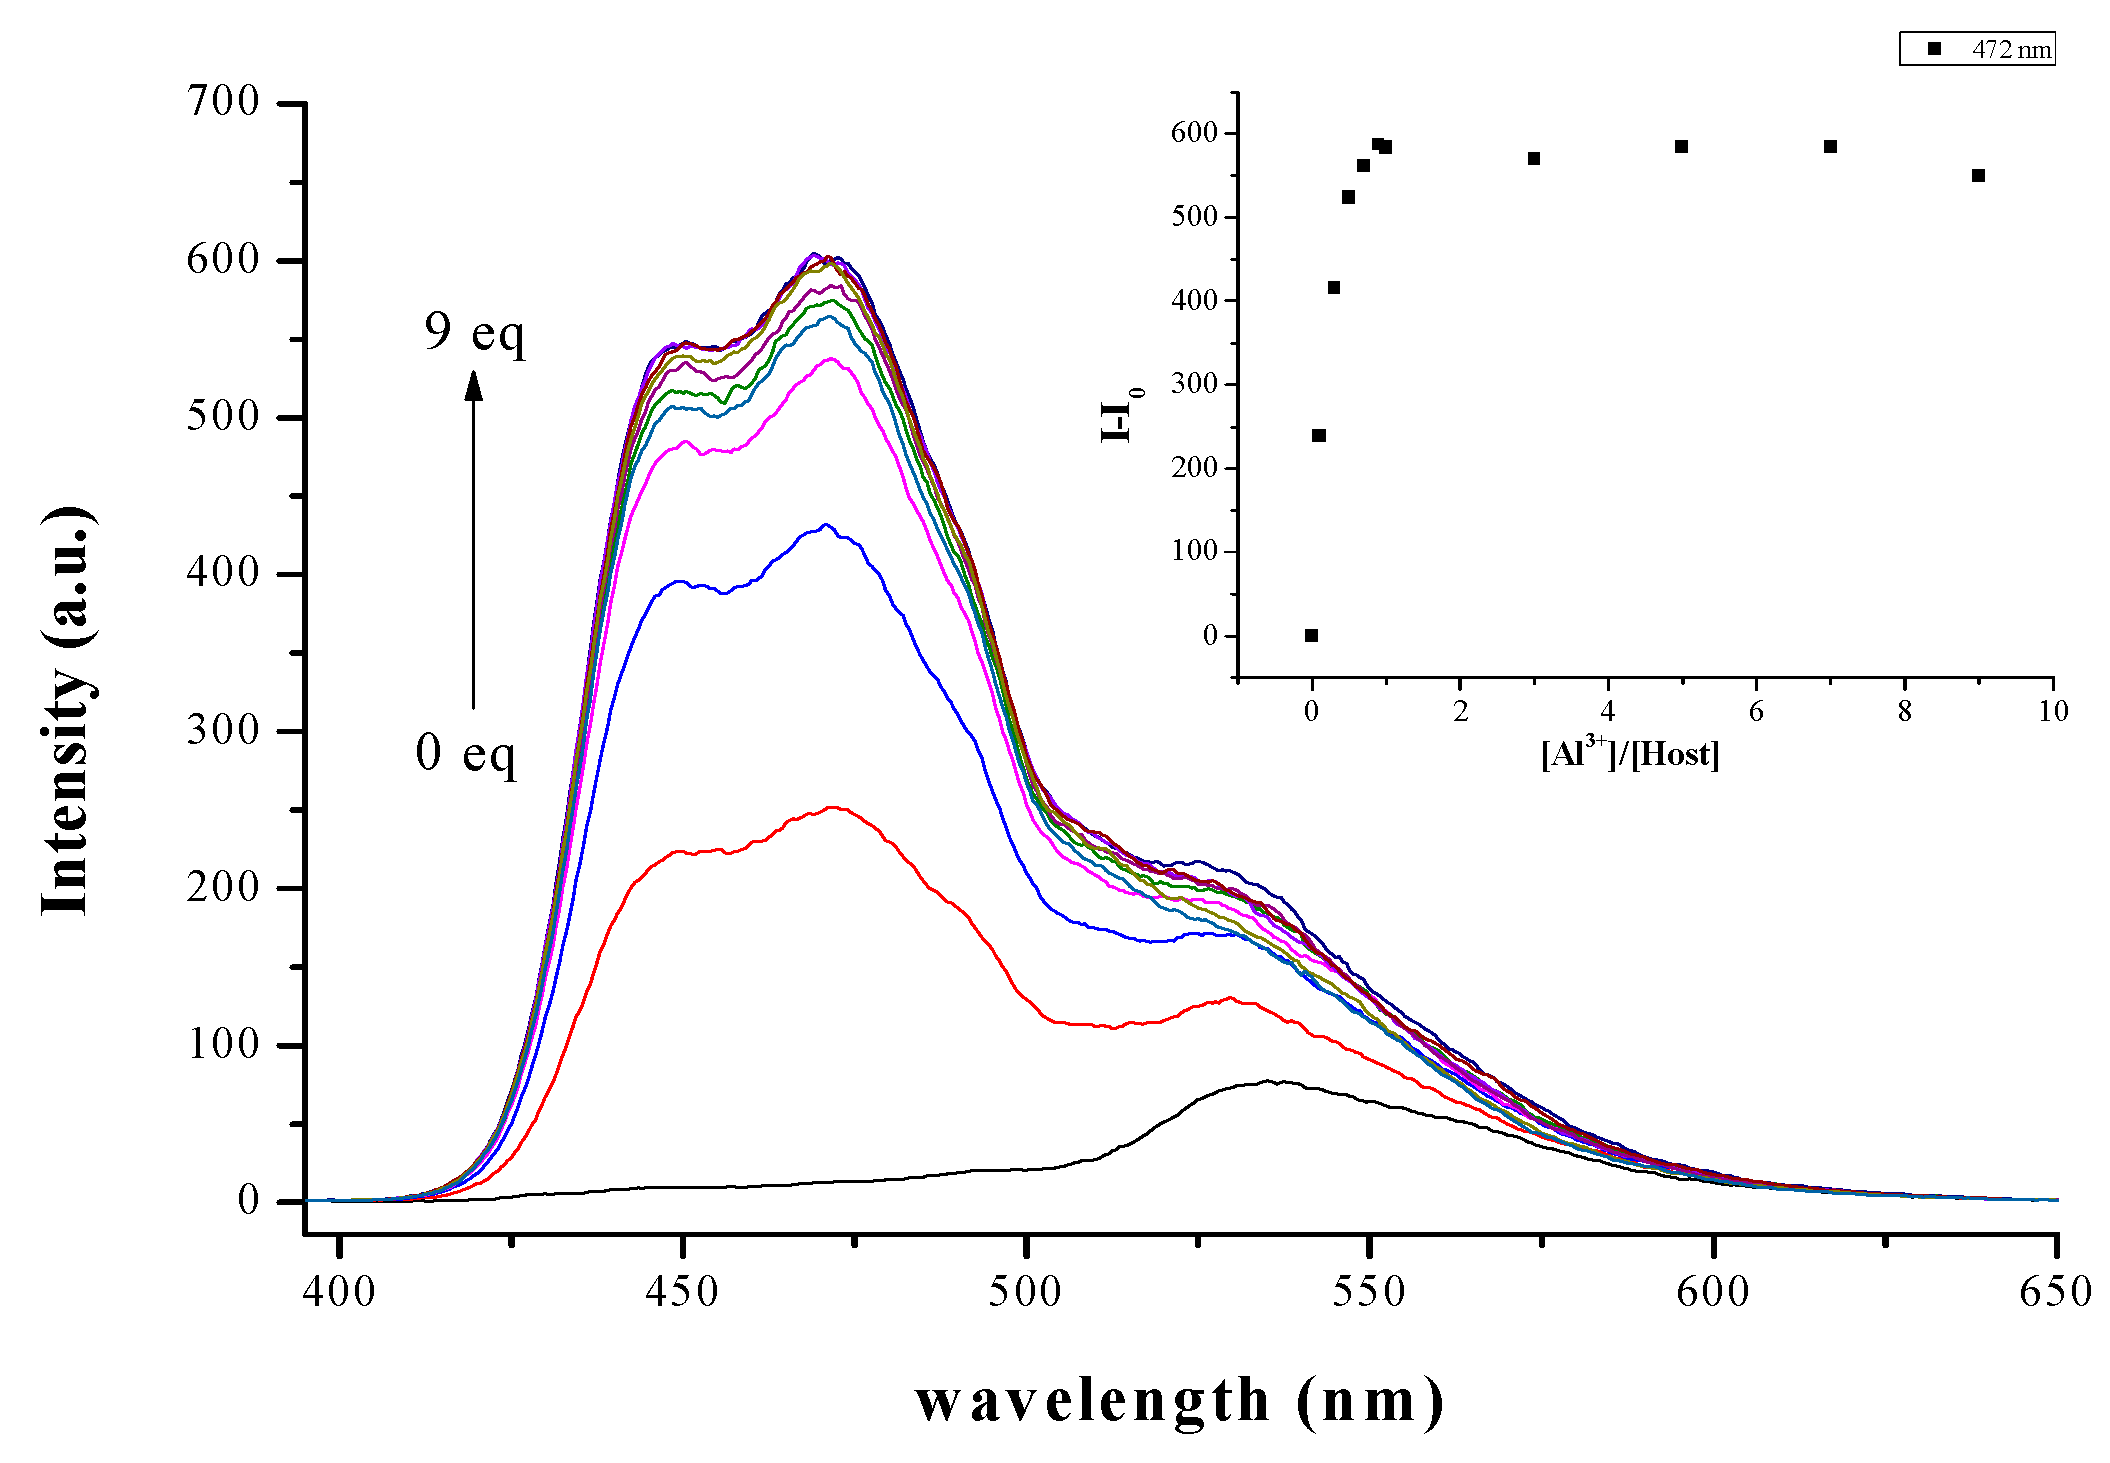
To further investigate the chemosensing properties of probe L, probe L was fluorescence-titrated with Al3+. The changes in fluorescence spectra for probe L as a function of Al3+ content are shown in Figure 4. With increasing amounts of Al3+ added to a solution of probe L in DMSO-H2O (1:9 v/v), the emission band at 530 nm gradually increased, and concomitantly a new emission band appeared that peaked at 472 nm. A Job plot indicated a 1:1 stoichiometric complexation of probe L with Al3+ (Figure S5). Additionally, the formation of a 1:1 complex between probe L and Al3+ was confirmed by the appearance of a peak at m/z 393, assignable to [probe L + Al3+ + 3H2O − 4H+] in the ESI/MS (Figure S6). From the fluorescent titration profiles, the association constant for probe L-Al3+ in DMSO-H2O (1:9 v/v) was determined as 3 × 10⁷ M−1 by a Hill plot (Figure S7). By using the abovementioned fluorescence titration results, the detection limit for Al3+ was estimated as 1 ppb.
3.3. Application in Water
In order to determine the optimal pH condition of the probe L in the water, we examined the effect of pH on the emission bands of the probe L–Al3+ complex in DMSO-H2O (1:9 v/v) solution. The fluorescence intensity showed a significant emission band (Figure S8) accompanied by a marked color change from dark green to light blue (Figure S9), which could be detected under UV light in the pH range 5–10. Thus, probe L could be applied for the analysis of environmental aqueous samples with a relatively wide pH range.
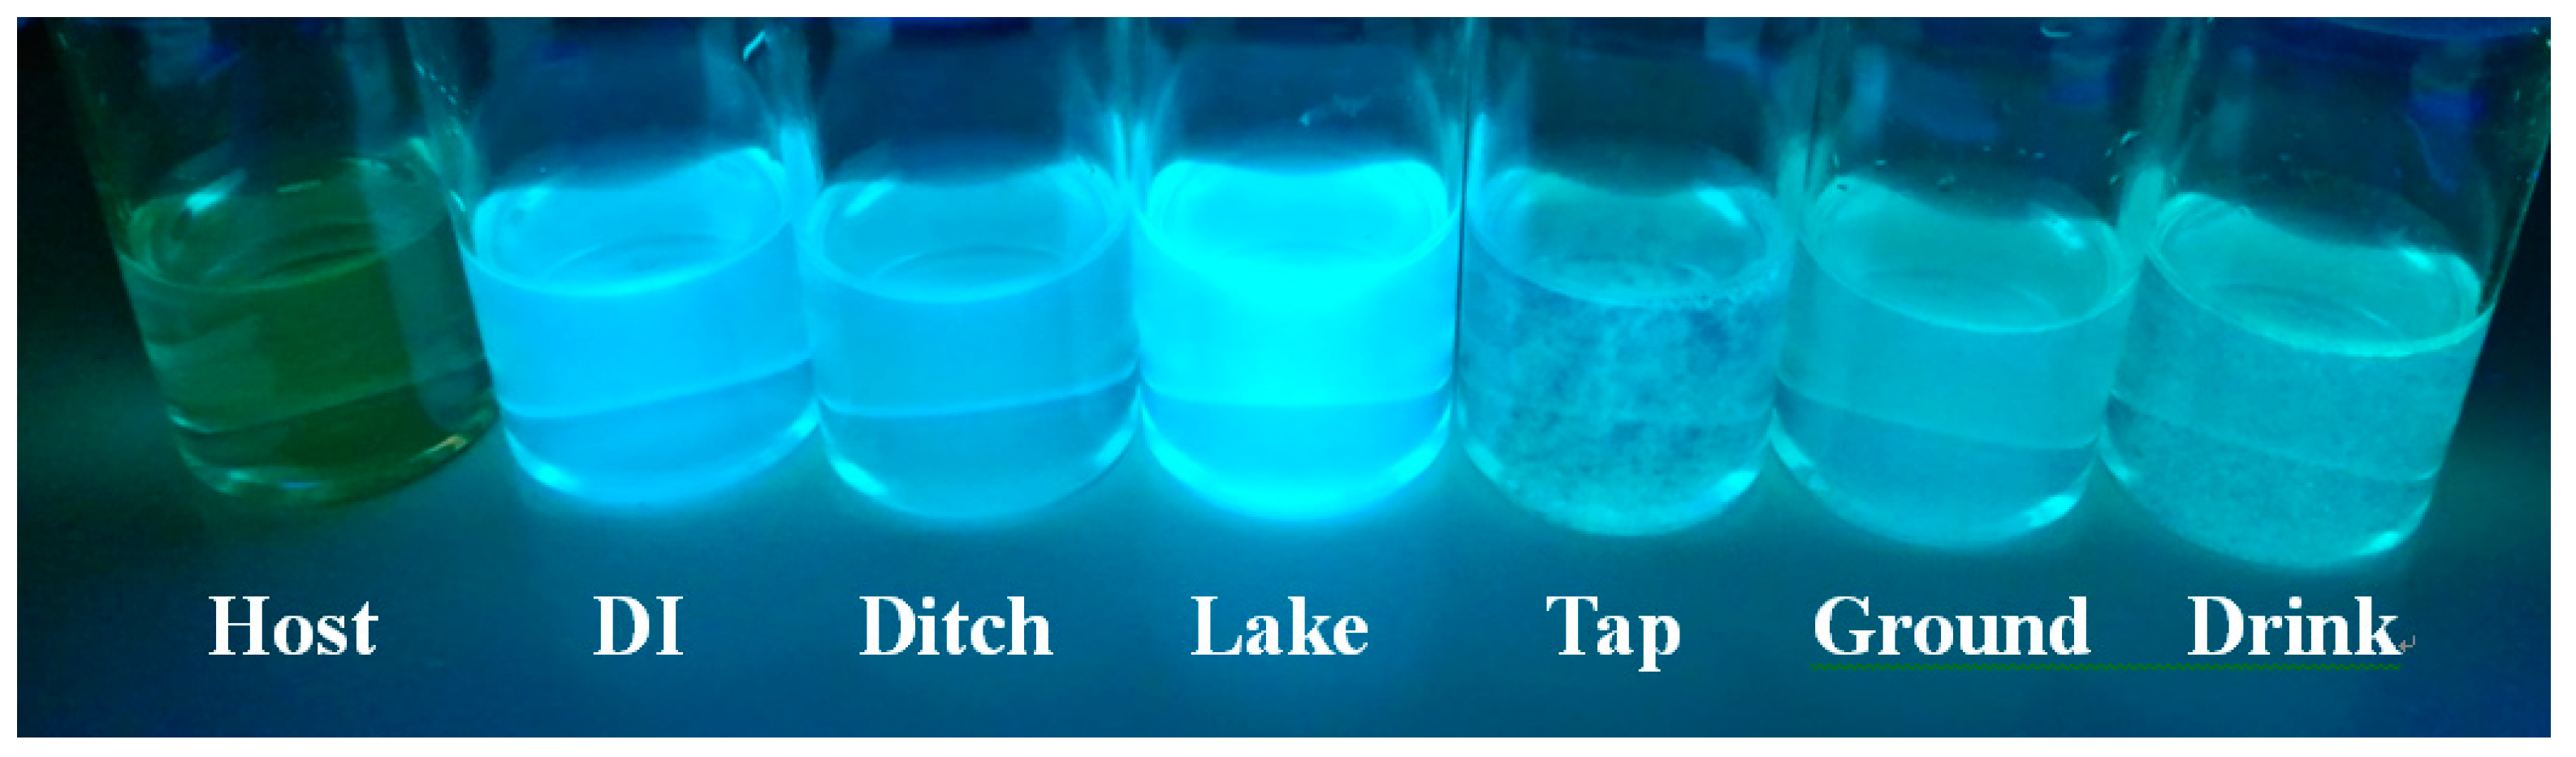
The practical application of probe L (40 μM) for selective sensing of Al3+ (5 equiv.) in different sources of water (DMSO: H2O = 1 : 9 v/v) was demonstrated (Figure 5). Al(ClO4)3 was first dissolved in water of the above source, followed by the addition of probe L to each water sample. All water samples containing Al3+ showed a clear color change from dark green to light blue. The result indicated that probe L can detect Al3+ in different water sources.
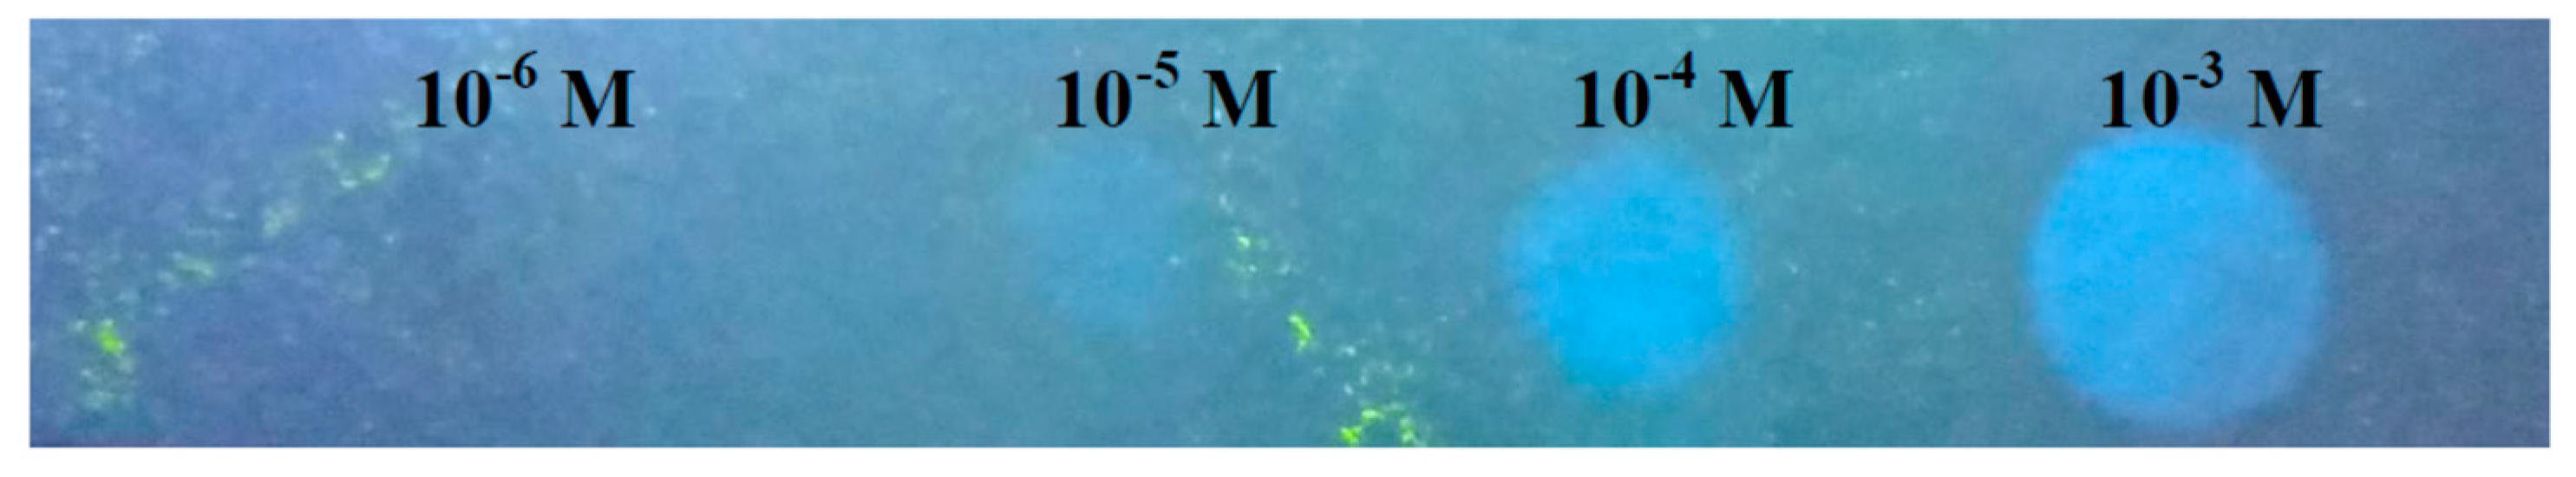
Testing paper detection is an inexpensive approach to detect the presence of an analyte. Toward this goal, we first coated filter paper with probe L by soaking in a DMSO-H2O (1:9 v/v) solution followed by air drying. Al3+ at different concentrations was added to this probe L-coated test paper: the color of the paper changed from dark green to light blue instantly (Figure 6), caused by the interaction of probe L and Al3+, therefore implying that the test paper specifically recognized Al3+. The detection limit of Al3+ with this probe L-coated test paper was 1.0 × 10⁻⁵ M.
3.4. Effect of Al3+ Stress on Root Elongation and Oxidative Burst in Rice
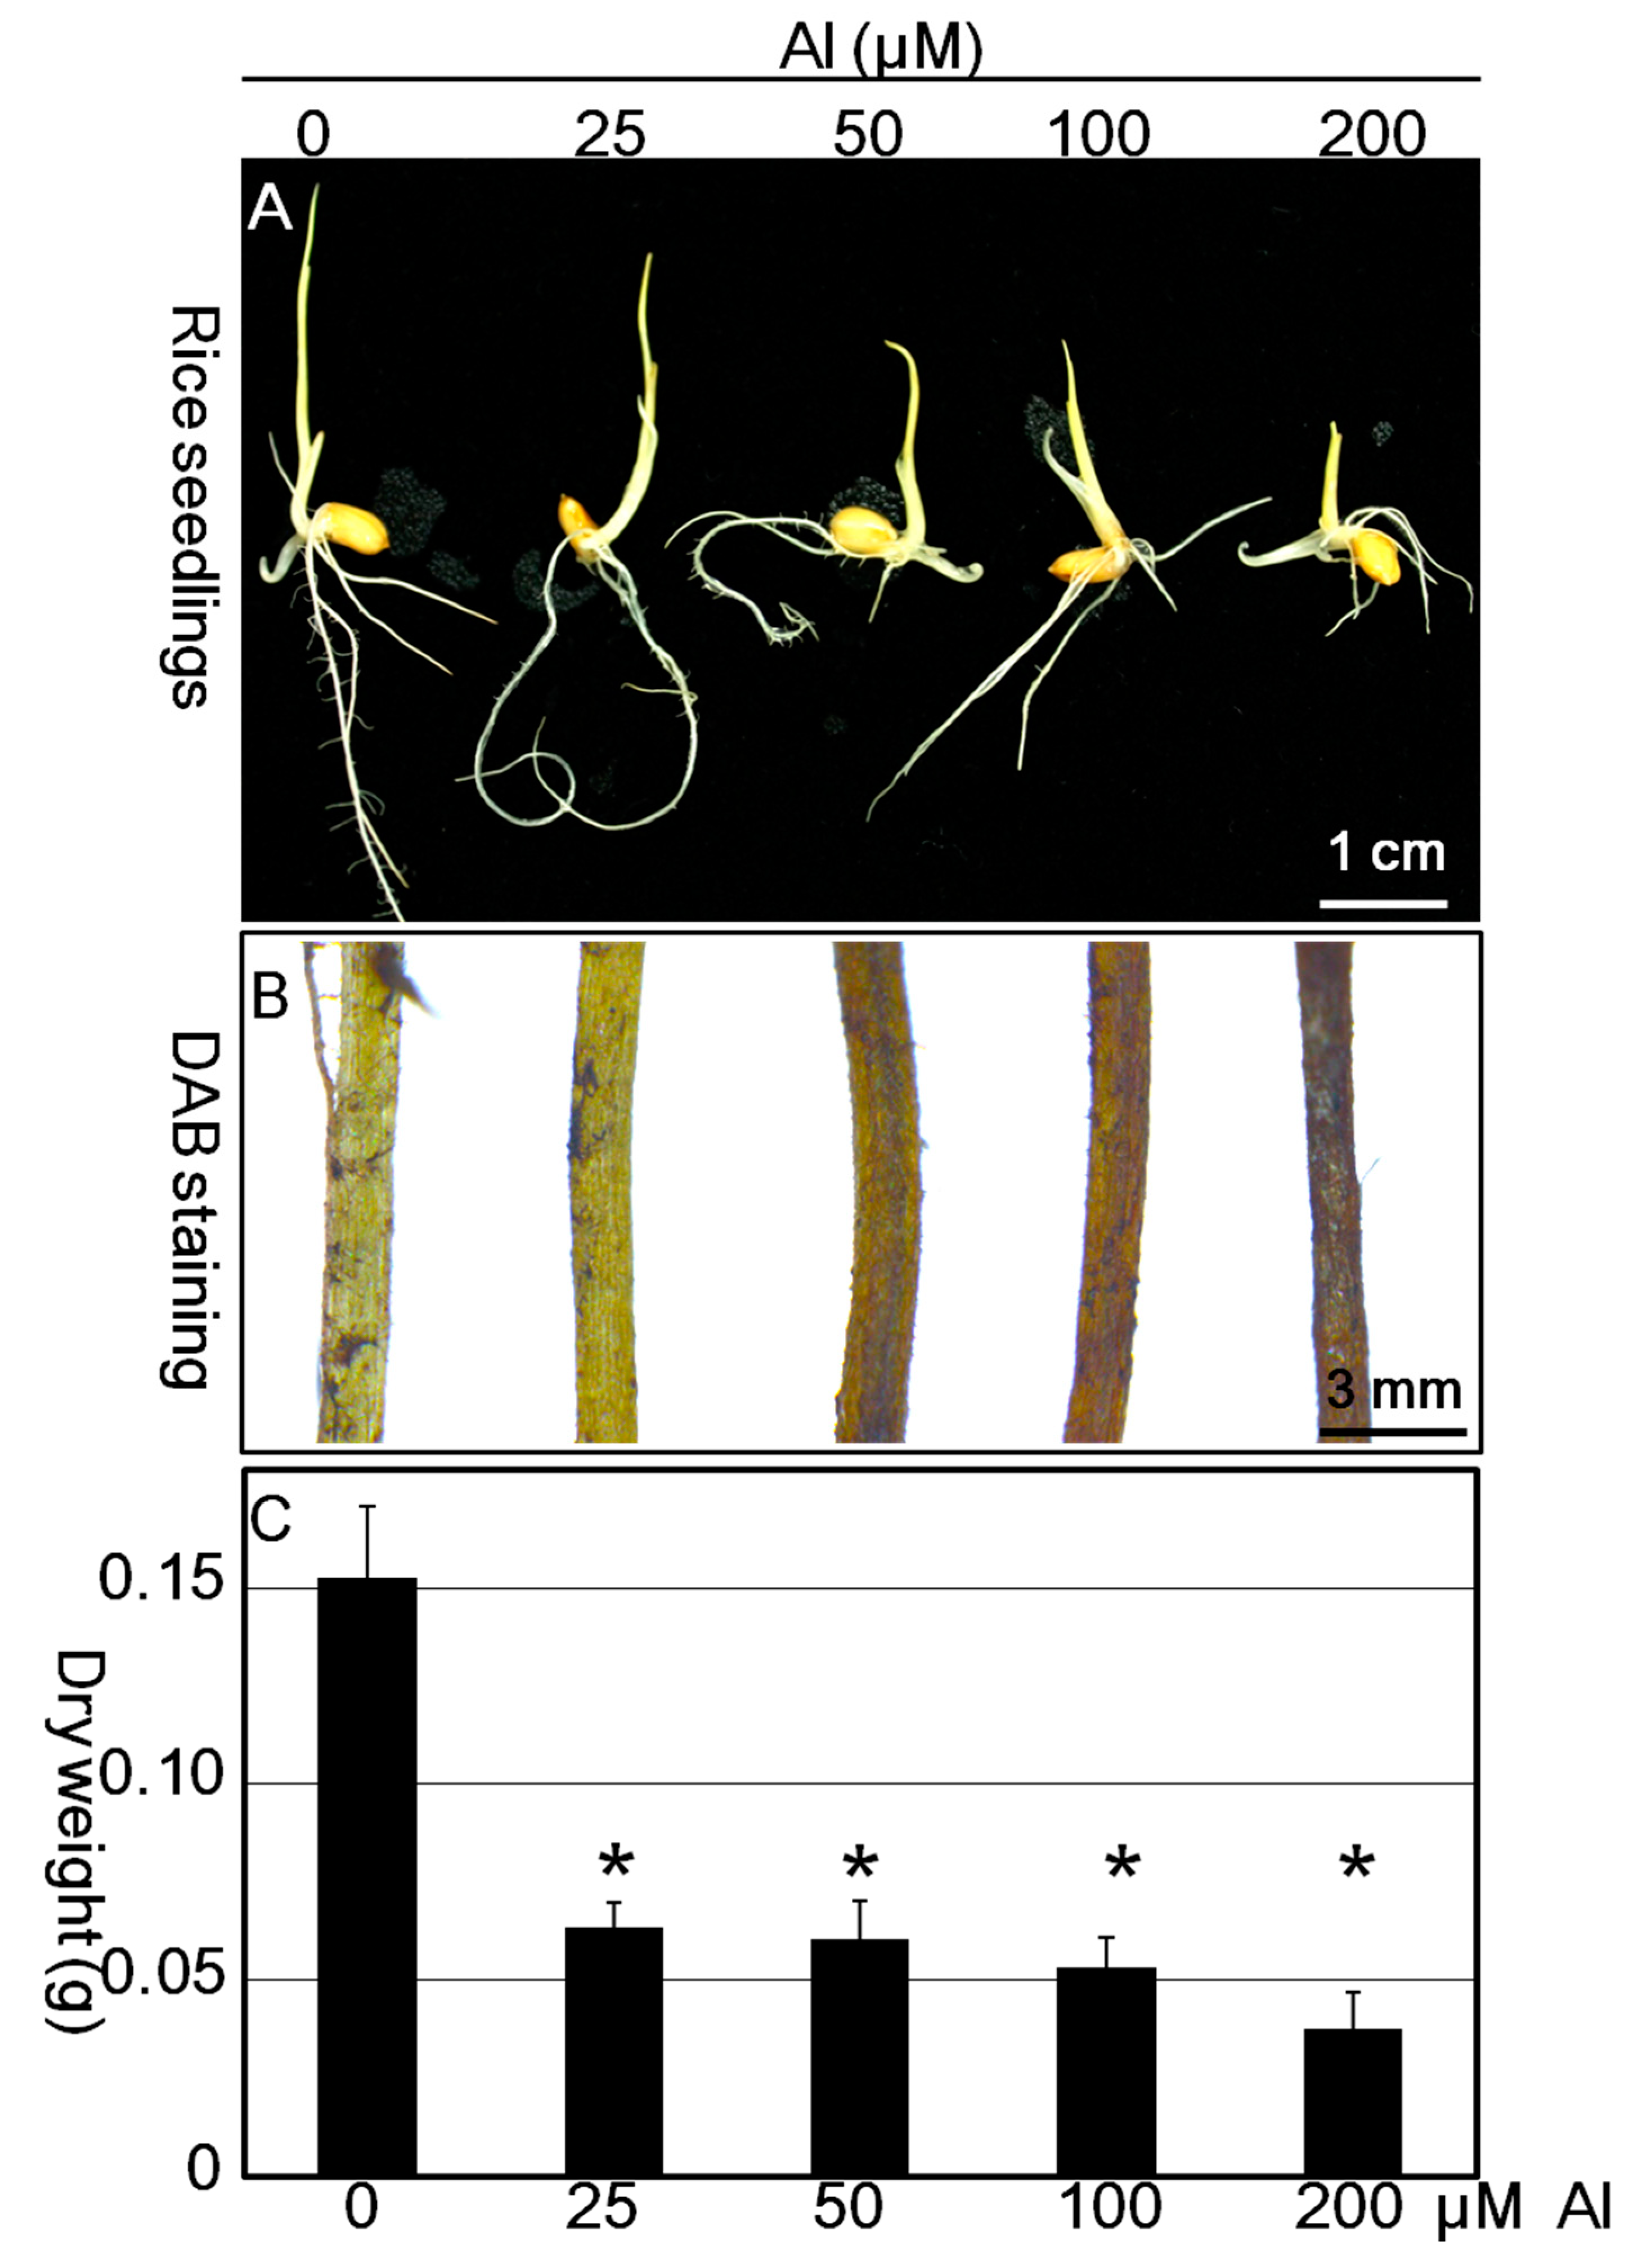
The inhibition of root growth is the primary response of the plant exposed to heavy metals. We analyzed the effect of Al3+ exposure on root elongation to evaluate Al3+ toxicity in rice seedlings. After exposing rice seedlings to Al3+ for 14 d, root elongation was measured. At 25 and 50 μM, Al3+ significantly reduced root elongation as compared with control conditions (Figure 7A). The root elongation decreased with increasing Al3+ concentration. At 100 μM Al3+, root elongation was reduced to about 50% of the control conditions. At 200 μM Al3+, root growth was completely inhibited. Al3+ at 200 μM inhibited root elongation by approximately 80%. We determined production of ROS such as H2O2 by treating roots with DAB. Treatment with 25 and 50 μM Al3+ induced more ROS production compared with control plants (Figure 7B). The ROS level was greater with 100 and 200 μM Al3+ than in controls (Figure 7B). Accordingly, the dry weight of roots was significantly decreased with 100 and 200 μM Al3+ (Figure 7C). It was reported that treatment of 200 μM perchlorate had subtle effects on root length and root weight of rice plants [34]. With treatment of 400 μM perchlorate, most of the rice varieties exhibited noticeable toxicity symptoms such as wilting, abscission, and even necrosis [34]. In our study, root weight was markedly inhibited by treatment with 25 μM Al(ClO4)3 (Figure 7C). It is suggested that Al3+ resulted in the heavy metal stress in the rice plants. Thus, Al3+-induced ROS production may inhibit growth in rice seedlings (Figure 8B,C). Thereafter, we treated rice seedlings with 25–200 μM Al3+ for the quantification of Al3+ by the colorimetric fluorescent probe.
3.5. Practical Applications of Probe L for Quantifying Al Content in Rice Seedlings
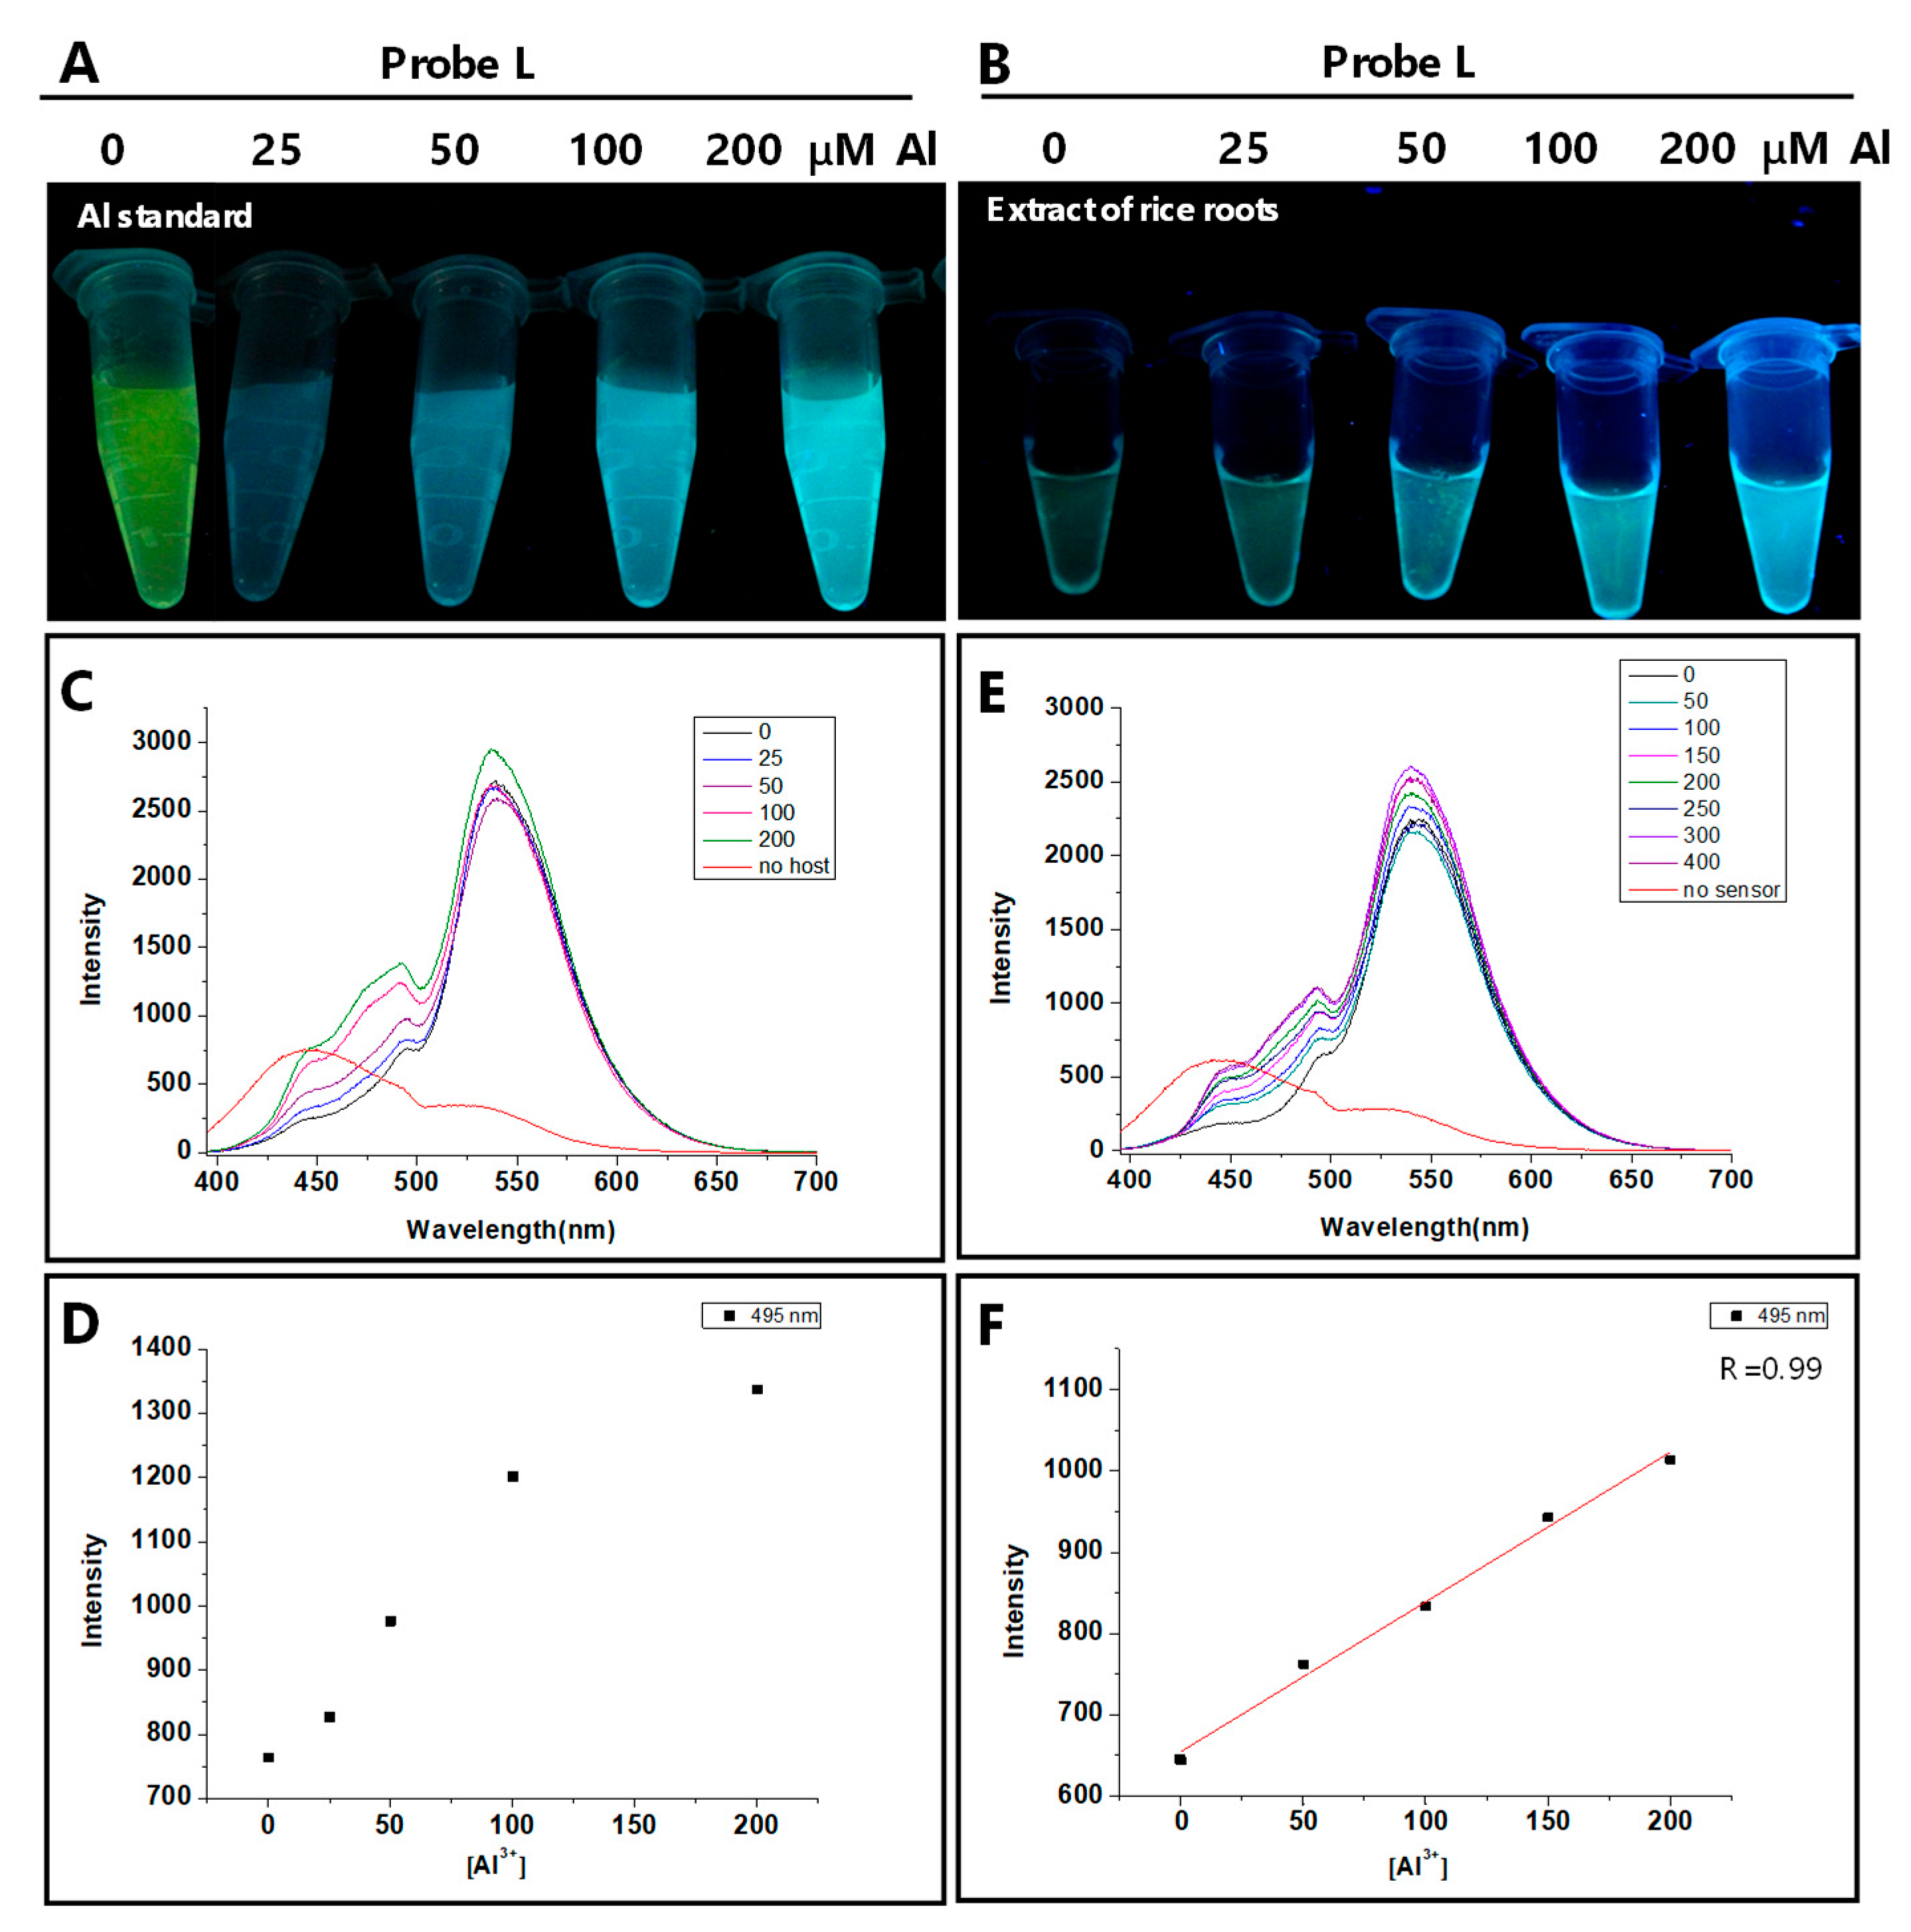
With the excellent response of probe L to Al3+ in aqueous solution, we investigated its ability to detect Al3+ content in rice seedlings. The intensity of blue fluorescence was increased with increasing Al3+ solution standard from 25 to 200 μM (Figure 8A). Extracts of Al3+-treated rice seedlings were incubated with the fluorescent probe. Extracts with 50 μM Al3+ showed mild fluorescence. The maximal fluorescence intensity was observed with 200 μM Al3+ (Figure 8B). The intensity of fluorescence was further quantified by fluorescence spectroscopy. Fluorescence emission spectra were measured at 495 nm (Figure 8C). Fluorescence intensity was increased with increasing Al3+ concentration from 25 to 100 μM (Figure 8D). The highest levels of Al3+ occurred with 200 μM Al3+. The stationary phase of Al3+ accumulation in rice seedlings may be due to reaching its saturation level (Figure 8D). Therefore, Al3+ accumulation in rice was associated with Al3+ concentration, with greater accumulation at 200 μM Al3+.
An Al3+ standard curve was constructed by linear regression with the Al3+ calibration standards in control seedling extracts (Figure 8E). The standard curve showed an acceptable regression line with concentration range 0 to 300 μM (Figure 8F). We then determined Al3+ content in 25, 50, 100, and 200 μM-treated samples. The level of heavy metals detected in rice seedlings was 98, 200, 353, and 446 μM, respectively. The differences in Al3+ toxicity (Figure 7) may be related to the accumulation in rice (Figure 8). This result agrees with the ratiometric fluorescence changes observed in aqueous solutions. Therefore, the fluorescence probe can be used for the quantification of Al3+ content in plants.
4. Conclusions
We developed a new fluorescent probe, probe L, for detecting Al3+ content. The probe exhibited rapid, highly selective and sensitive detection of Al3+ content, with distinct changes in fluorescent emission. Fluorescent quantification demonstrated that probe L could be used to detect plant samples with heavy metal Al3+ pollution. This study provides a promising fluorescent probe for the detection and accumulation of Al3+ that could be an easy potential alternative to existing analytical methods for investigating Al3+ content in plants.
Supplementary Materials
The following are available online at https://www.mdpi.com/1424-8220/19/3/623/s1, Figure S1: 1H NMR (DMSO-d6) spectra for probe L, Figure S2: 13C NMR (DMSO-d6) spectra for probe L, Figure S3: High-resolution mass spectrometry data for probe L, Figure S4: Fluorescence intensity at 536 nm (λex. = 320 nm) for probe L (40 μM) in the presence of 5 equiv. of various cations in DMSO-H2O (1:9 v/v), Figure S5: Job plot of probe L and Al3+, Figure S6: ESI mass spectra [(probe L + Al3+ + DMSO + ClO4−) + 2Na+], Figure S7: Hill plot, Figure S8: Fluorescence emission intensity for probe L (40 λM) in the presence and absence of Al3+ (5 equiv) at different pH, Figure S9: Color changes by UV light for probe L with the addition of 5 equiv. of Al3+ at different pH value.
Author Contributions
Supervision, funding acquisition and design of experiments, A.-T.W. and S.-F.F.; methodology, C.-L.L., S.-F.F. and P.-H.L.; Writing manuscript and revision, A.-T.W. and S.-F.F.; Data analysis and calculation, C.-L.L.
Funding
Ministry of Science and Technology, ROC (Grant number: 106-2113-M-018-002).
Acknowledgments
We thank the Ministry of Science and Technology, ROC.
Conflicts of Interest
The authors declare no conflict of interest.
References
- Kochian, L.V.; Hoekenga, O.A.; Pineros, M.A. How do crop plants tolerate acid soils? Mechanisms of aluminum tolerance and phosphorous efficiency. Annu. Rev. Plant Biol. 2004, 55, 459–493. [Google Scholar] [CrossRef] [PubMed]
- Fageria, N.K.; Carvalho, J.R.P. Influence of aluminum in nutrient solutions on chemical composition in upland rice cultivars. Plant Soil 1982, 69, 31–44. [Google Scholar] [CrossRef]
- Vasconcelos, S.S.; Jacob-Neto, J.; Rossiello, R.O.P. Differential root responses to aluminum stress among Brazilian rice genotypes. J. Plant Nutr. 2002, 25, 655–669. [Google Scholar] [CrossRef]
- Alvarez, E.; Fernandez-Marcos, M.L.; Monterroso, C.; Fernandez-Sanjurjo, M.J. Application of aluminium toxicity indices to soils under various forest species. For. Ecol. Manag. 2005, 211, 227–239. [Google Scholar] [CrossRef]
- Savory, J.; Ghribi, O.; Forbes, M.S.; Herman, M.M. Aluminium and neuronal cell injury: Inter-relationships between neurofilamentous arrays and apoptosis. J. Inorg. Biochem. 2001, 87, 15–19. [Google Scholar] [CrossRef]
- Walton, J.R. Aluminum in hippocampal neurons from humans with Alzheimer’s disease. Neurotoxicology 2006, 2, 385–394. [Google Scholar] [CrossRef] [PubMed]
- Croom, J.; Taylor, I.L. Neuropeptide Y, peptide YY and aluminum in Alzheimer’s disease: Is there an etiological relationship? J. Inorg. Biochem. 2001, 87, 51–56. [Google Scholar] [CrossRef]
- Perlmutter, J.S.; Tempel, L.W.; Black, K.J.; Parkinson, D.; Todd, R.D. MPTP induces dystonia and parkinsonism. Clues to the pathophysiology of dystonia. Neurology 1997, 49, 1432–1438. [Google Scholar] [CrossRef] [PubMed]
- Hau, F.K.; He, X.M.; Lam, W.H.; Yam, V.W. Highly selective ion probe for Al3+ based on Au(I) … Au(I) interactions in a bis-alkynyl calix[4]arene Au(I) isocyanide scaffold. Chem. Commun. 2011, 47, 8778–8780. [Google Scholar] [CrossRef]
- Maity, D.; Govindaraju, T. Naphthaldehyde–Urea/Thiourea Conjugates as Turn-On Fluorescent Probes for Al3+ Based on Restricted C=N Isomerization. Eur. J. Inorg. Chem. 2011, 36, 5479–5489. [Google Scholar] [CrossRef]
- Maity, D.; Govindaraju, T. Conformationally Constrained (Coumarin−Triazolyl−Bipyridyl) Click Fluoroionophore as a Selective Al3+ Sensor. Inorg. Chem. 2010, 49, 7229–7231. [Google Scholar] [CrossRef] [PubMed]
- Lu, Y.; Huang, S.S.; Liu, Y.Y.; He, S.; Zhao, L.C.; Zeng, X.S. Highly Selective and Sensitive Fluorescent Turn-on Chemosensor for Al3+ Based on a Novel Photoinduced Electron Transfer Approach. Org. Lett. 2011, 13, 5274–5277. [Google Scholar] [CrossRef] [PubMed]
- Jang, Y.K.; Nam, U.C.; Kwon, H.L.; Hwang, I.H.; Kim, C. A selective colorimetric and fluorescent chemosensor based-on naphthol for detection of Al3+ and Cu2+. Dyes Pigm. 2013, 99, 6–13. [Google Scholar] [CrossRef]
- Sahana, A.; Banerjee, A.; Lohar, S.; Sarkar, B.; Mukhopadhyay, S.K. Rhodamine-Based Fluorescent Probe for Al3+ through Time-Dependent PET–CHEF–FRET Processes and Its Cell Staining Application. Inorg. Chem. 2013, 52, 3627–3633. [Google Scholar] [CrossRef] [PubMed]
- Kim, S.H.; Choi, H.S.; Kim, J.; Lee, S.J.; Quang, D.T.; Kim, J.S. Novel Optical/Electrochemical Selective 1,2,3-Triazole Ring-Appended Chemosensor for the Al3+ Ion. Org. Lett. 2010, 12, 560–563. [Google Scholar] [CrossRef] [PubMed]
- Ramos, M.L.; Justino, L.L.G.; Salvador, A.I.N.; de Sousa, A.R.E.; Abreu, P.E.; Fonseca, S.M.; Burrows, H.D. NMR, DFT and luminescence studies of the complexation of Al(III) with 8-hydroxyquinoline-5-sulfonate. Dalton Trans. 2012, 41, 12478–12489. [Google Scholar] [CrossRef] [PubMed]
- Jung, J.Y.; Han, S.J.; Chun, J.; Lee, C.; Yoon, J. New thiazolothiazole derivatives as fluorescent chemosensors for Cr3+ and Al3+. Dyes Pigm. 2012, 94, 423–426. [Google Scholar] [CrossRef]
- Han, T.Y.; Feng, X.; Tong, B.; Shi, J.B.; Chen, L.; Zhi, J.G.; Dong, Y.P. A novel “turn-on” fluorescent chemosensor for the selective detection of Al3+ based on aggregation-induced emission. Chem. Commun. 2012, 48, 416–418. [Google Scholar] [CrossRef]
- Wang, F.; Nandhakumar, R.; Moon, J.H.; Kim, K.M.; Lee, J.Y.; Yoon, J. Ratiometric Fluorescent Chemosensor for Silver Ion at Physiological pH. Inorg. Chem. 2011, 50, 2240–2245. [Google Scholar] [CrossRef]
- Mahato, P.; Saha, S.; Suresh, E.; Liddo, R.D.; Parnigotto, P.P.; Conconi, M.T.; Kesharwani, M.K.; Ganguly, B.; Das, A. Ratiometric Detection of Cr3+ and Hg2+ by a Naphthalimide-Rhodamine Based Fluorescent Probe. Inorg. Chem. 2012, 51, 1769–1777. [Google Scholar] [CrossRef]
- Xuan, W.; Chen, C.; Cao, Y.; He, W.; Jiang, W.; Liu, K.; Wang, W. Rational design of a ratiometric fluorescent probe with a large emission shift for the facile detection of Hg2+. Chem. Commun. 2012, 48, 7292–7294. [Google Scholar] [CrossRef] [PubMed]
- Sun, X.; Wang, Y.-W.; Peng, Y. A Selective and Ratiometric Bifunctional Fluorescent Probe for Al3+ Ion and Proton. Org. Lett. 2012, 14, 3420–3423. [Google Scholar] [CrossRef] [PubMed]
- Wang, Y.; Xiong, L.; Geng, F.; Zhang, F.; Xu, M. Design of a dual-signaling sensing system for fluorescent ratiometric detection of Al3+ ion based on the inner-filter effect. Analyst 2011, 136, 4809–4814. [Google Scholar] [CrossRef] [PubMed]
- Goswami, S.; Paul, S.; Manna, A. A differentially selective chemosensor for a ratiometric response to Zn2+ and Al3+ in aqueous media with applications for molecular switches. RSC Adv. 2013, 3, 25079–25085. [Google Scholar] [CrossRef]
- Maity, D.; Govindaraju, T. A differentially selective sensor with fluorescence turn-on response to Zn2+ and dual-mode ratiometric response to Al3+ in aqueous media. Chem. Commun. 2012, 48, 1039–1041. [Google Scholar] [CrossRef] [PubMed]
- Goswami, S.; Aich, K.; Das, A.K.; Manna, A.; Das, S. A naphthalimide–quinolone based probe for selective, fluorescence ratiometric sensing of trivalent ions. RSC Adv. 2013, 3, 2412–2416. [Google Scholar] [CrossRef]
- Sahana, A.; Banerjee, A.; Lohar, S.; Banik, A.; Mukhopadhyay, S.K.; Safin, D.A.; Babashkina, M.G.; Bolte, M.; Garcia, Y.; Das, D. FRET based tri-color emissive rhodamine–pyrene conjugate as an Al3+ selective colorimetric and fluorescence sensor for living cell imaging. Dalton Trans. 2013, 42, 13311–13314. [Google Scholar] [CrossRef]
- Kumar, J.; Sarma, M.J.; Phukan, P.; Das, D.K. A new simple Schiff base fluorescence “on” sensor for Al3+ and its living cell imaging. Dalton Trans. 2015, 44, 4576–4581. [Google Scholar] [CrossRef] [PubMed]
- Lee, S.A.; You, G.R.; Choi, Y.W.; Jo, H.Y.; Kim, A.R.; Noh, I.; Kim, S.-J.; Kim, Y.; Kim, C. A new multifunctional Schiff base as a fluorescence sensor for Al3+ and a colorimetric sensor for CN− in aqueous media: An application to bioimaging. Dalton Trans. 2014, 43, 6650–6659. [Google Scholar] [CrossRef]
- Mahapatra, A.K.; Ali, S.S.; Maiti, K.; Manna, S.K.; Maji, R.; Mondal, S.; Uddin, M.R.; Mandal, S.; Sahoo, P. Aminomethylpyrene-based imino-phenols as primary fluorescence switch-on sensors for Al3+ in solution and in Vero cells and their complexes as secondary recognition ensembles toward pyrophosphate. RSC Adv. 2015, 5, 81203–81211. [Google Scholar] [CrossRef]
- Ranatunge, I.; Adikary, S.; Dasanayake, P.; Fernando, C.D.; Soysa, P. Development of a rapid and simple method to remove polyphenols from plant extracts. Int. J. Anal. Chem. 2017, 2017, 7230145. [Google Scholar] [CrossRef] [PubMed]
- Abd-Elsalam, K.; Bahkali, A.; Moslem, M.; Amin, O.E.; Niessen, L. An optimized protocol for DNA extraction from wheat seeds and Loop-Mediated Isothermal Amplification (LAMP) to detect Fusarium graminearum contamination of wheat grain. Int. J. Mol. Sci. 2011, 12, 3459–3472. [Google Scholar] [CrossRef] [PubMed]
- Huang, T.L.; Nguyen, Q.T.T.; Fu, S.F.; Lin, C.Y.; Chen, Y.C.; Huang, H.J. Transcriptomic changes and signalling pathways induced by arsenic stress in rice roots. Plant Mol. Biol. 2012, 80, 587–608. [Google Scholar] [CrossRef]
- Chen, G.K.; Li, X.B.; He, H.Z.; Li, H.S.; Zhang, Z.M. Varietal differences in the growth of rice seedlings exposed to perchlorate and their antioxidative defense mechanisms. Environ. Toxicol. Chem. 2015, 34, 1926–1933. [Google Scholar] [CrossRef] [PubMed]
Scheme 1.
Synthesis of probe L.
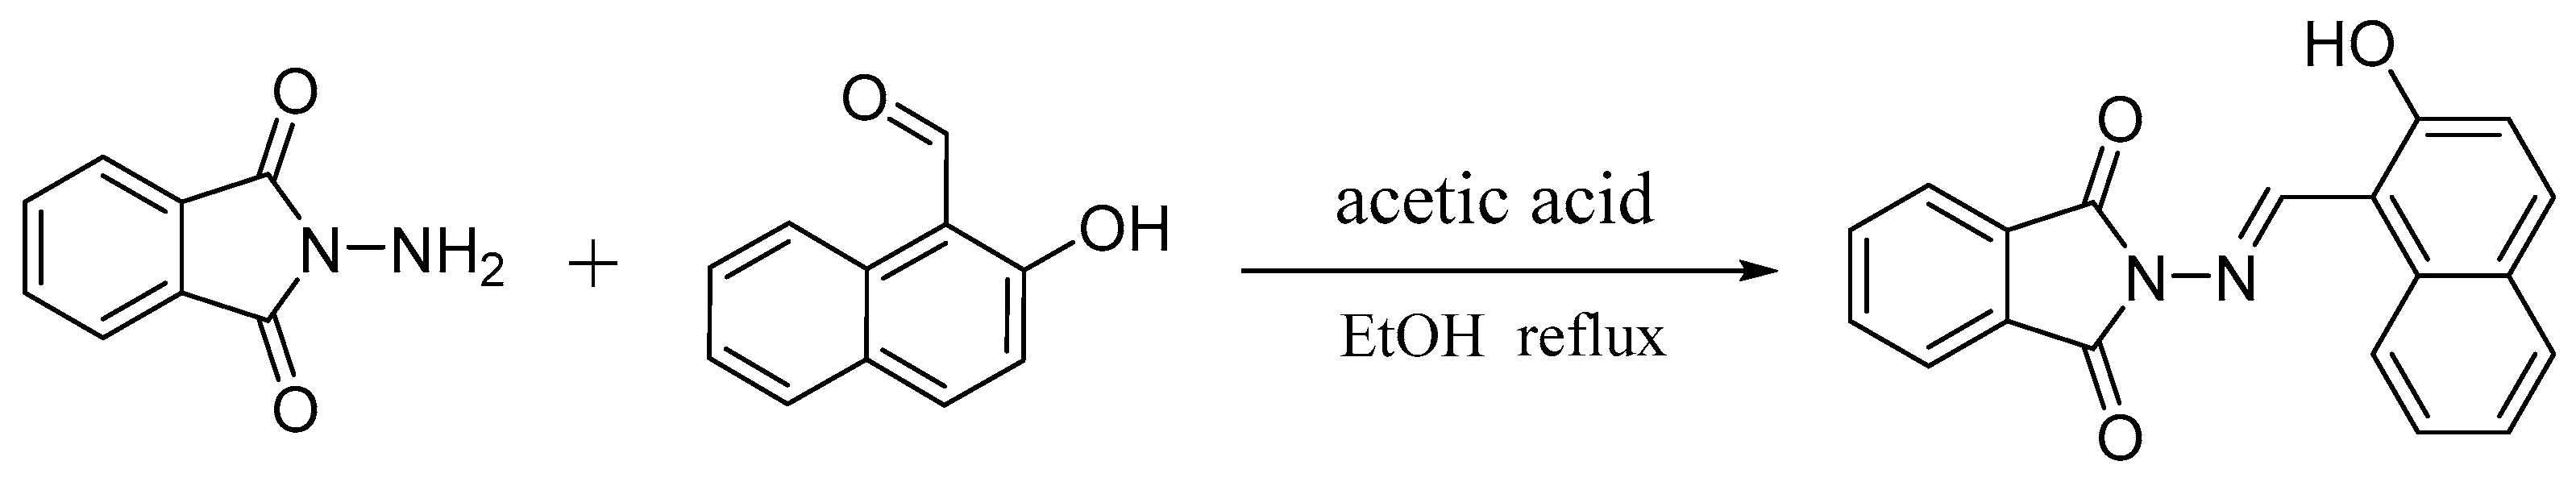
Figure 1.
UV/vis spectra for probe L (40 μM) in DMSO-H2O (1:9 v/v) with the addition of 5 equiv. of various metal ions.
Figure 1.
UV/vis spectra for probe L (40 μM) in DMSO-H2O (1:9 v/v) with the addition of 5 equiv. of various metal ions.
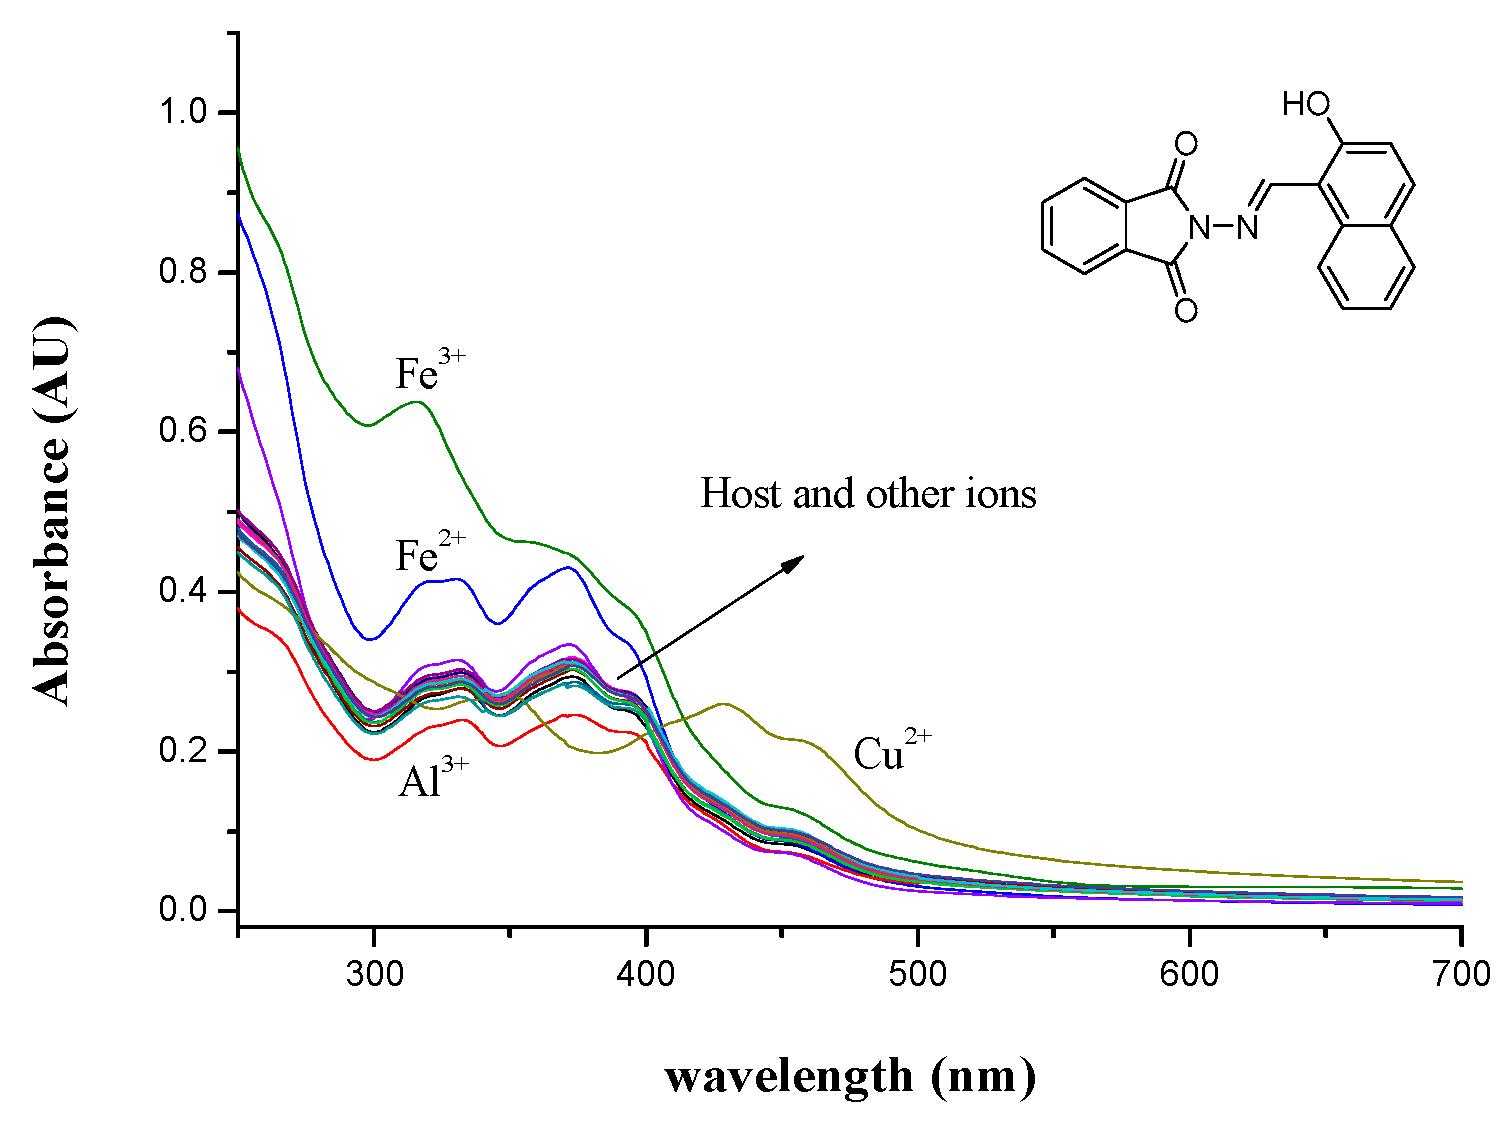
Figure 2.
Color changes by UV light for probe L (40 μM) with the addition of 5 equiv. of various metal ions.
Figure 2.
Color changes by UV light for probe L (40 μM) with the addition of 5 equiv. of various metal ions.

Figure 3.
Fluorescence emission spectra for probe L (40 μΜ) in the presence of 5 equiv. of various metal ions in DMSO-H2O (1:9 v/v).
Figure 3.
Fluorescence emission spectra for probe L (40 μΜ) in the presence of 5 equiv. of various metal ions in DMSO-H2O (1:9 v/v).

Figure 4.
Fluorescence emission spectra for probe L (40 μM) in DMSO-H2O (1:9 v/v) with increasing concentrations of Al3+. Inset: intensity (at 540 nm) for probe L as a function of Al3+ equiv.
Figure 4.
Fluorescence emission spectra for probe L (40 μM) in DMSO-H2O (1:9 v/v) with increasing concentrations of Al3+. Inset: intensity (at 540 nm) for probe L as a function of Al3+ equiv.

Figure 5.
Color changes by UV light for probe L (40 μM) in different sources of water (DMSO : H2O = 1 : 9 v/v) containing 5 equiv. of Al3+.
Figure 5.
Color changes by UV light for probe L (40 μM) in different sources of water (DMSO : H2O = 1 : 9 v/v) containing 5 equiv. of Al3+.

Figure 6.
The color changes of probe L observed by UV light upon the addition of Al3+ at different concentrations in the filter paper.
Figure 6.
The color changes of probe L observed by UV light upon the addition of Al3+ at different concentrations in the filter paper.

Figure 7.
Growth and production of reactive oxygen species (ROS) in rice seedlings with Al treatment. (A) Rice seedlings were treated with different concentrations of Al(ClO4)3 (0, 25, 50, 100, and 200 μM) for 20 d, and the morphology of rice seedlings was photographed. (B) Al-induced ROS accumulation in rice roots. Root samples treated with Al3+ were stained with 3, 3’-diamninobenzidine (DAB) for determining H2O2. (C) Dry weight of rice seedlings with treatment of Al. Data represent the mean ± SD of three independent experiments. Results are the mean ± SE (n = 10). * Significantly different from the control at P < 0.05 by paired t test.

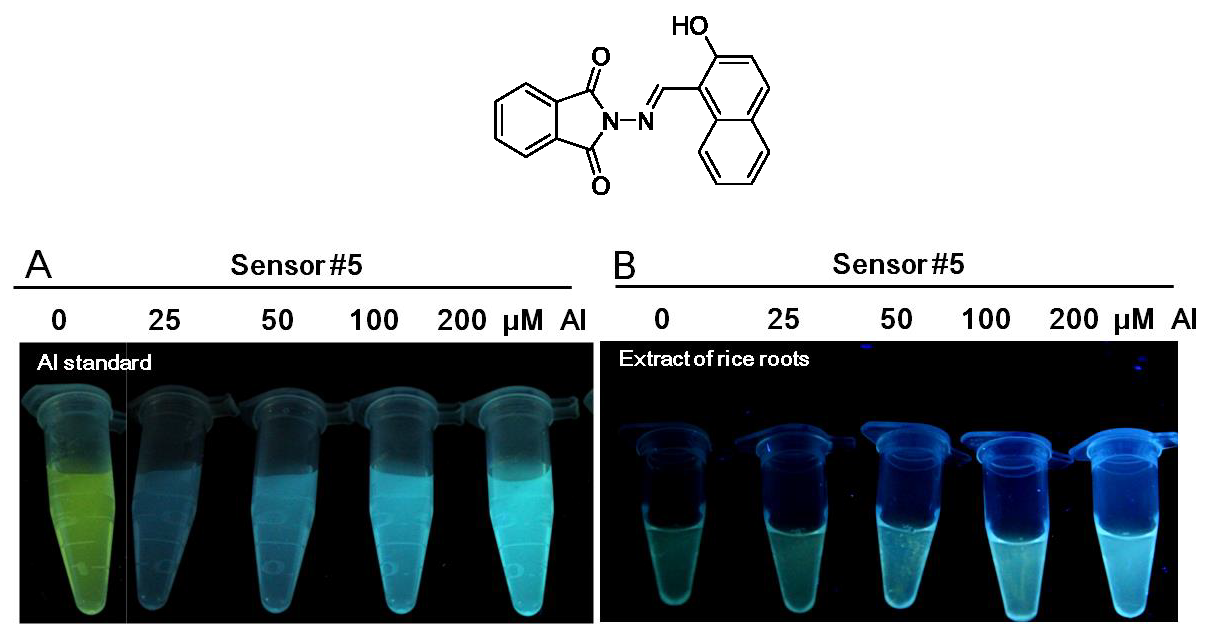
Figure 8.
Quantitative determination of Al concentrations in rice seedlings. (A) Fluorescence probe L with the addition of various concentrations of Al(ClO4)3 solution (0, 25, 50, 100, and 200 μM) was excited by a handheld UV lamp with 345 nm excitation. The blue emission was photographed immediately in the dark. (B) Fluorescence probe L with the addition of rice extracts on treatment with various concentrations of Al3+. The samples were excited by UV, and blue emission was photographed. (C) Measurement of fluorescence intensity of probe L at 495 nm with the addition of rice extracts on treatment with various concentrations of Al3+. All data were measured after 20 min nm. (D) Fluorescence values corresponding to each treatment in (C) were plotted. (E) Measurement of fluorescence intensity of probe L with increasing concentrations of Al3+ standards (0, 50, 100, 150, 200, and 300 μM) dissolved in control seedling extracts. (F) A linear calibration curve was constructed on the basis of fluorescence intensity and Al3+ standards. Three replicates were performed with nearly identical results.
© 2019 by the authors. Licensee MDPI, Basel, Switzerland. This article is an open access article distributed under the terms and conditions of the Creative Commons Attribution (CC BY) license (http://creativecommons.org/licenses/by/4.0/).
Share and Cite
MDPI and ACS Style
Li, C.-L.; Lu, P.-H.; Fu, S.-F.; Wu, A.-T. A Highly Selective and Sensitive Fluorescent Chemosensor for Detecting Al3+ Ion in Aqueous Solution and Plant Systems. Sensors 2019, 19, 623. https://doi.org/10.3390/s19030623
AMA Style
Li C-L, Lu P-H, Fu S-F, Wu A-T. A Highly Selective and Sensitive Fluorescent Chemosensor for Detecting Al3+ Ion in Aqueous Solution and Plant Systems. Sensors. 2019; 19(3):623. https://doi.org/10.3390/s19030623
Chicago/Turabian StyleLi, Chia-Lin, Ping-Hsuan Lu, Shih-Feng Fu, and An-Tai Wu. 2019. "A Highly Selective and Sensitive Fluorescent Chemosensor for Detecting Al3+ Ion in Aqueous Solution and Plant Systems" Sensors 19, no. 3: 623. https://doi.org/10.3390/s19030623
Note that from the first issue of 2016, this journal uses article numbers instead of page numbers. See further details here.