The optimization of irrigation water consumption entails the improvement of crop development conditions through irrigation planning: water quantity and scheduling. For this purpose, automatic systems for monitoring variables and taking decisions are required.
1.1. State of the Art
The need for optimization in agriculture became a reality in the 1970s. At the beginning, non-standardized wired electronic solutions designed ex professo were used. Since then, the development of irrigation system optimization has been closely linked to the rise and evolution of ICT [
4].
There has been a trend in the last decade to implement intelligent irrigation management systems based on Wireless Sensor Networks (WSNs) [
5], which have also been used in other agriculture areas. The characteristics and potentialities of WSNs perfectly match irrigation needs [
6]. Presently, the integration of the devices to local communication networks, as well as to storing platforms, big data and information processing in the cloud, enable them to interact with other networks and the environment. [
7,
8] propose applications of IoT and Cloud Computing in agriculture
Among the advantages of WSNs, we can highlight the option of automating irrigation, since networks allow taking measurements (humidity, temperature, irradiance, etc.) and actions (solenoid valves, pumps) through the different independent electronic systems (nodes) that compose these networks. Several authors [
5,
9,
10] have developed methodologies for the analysis and development of efficient networks based on needs assessment for different crops, soil attributes, climate, etc. In [
11] the authors developed an application for smartphones to programme urban lawn irrigation by using evapotranspiration data from weather stations. This proposal achieved a saving of 48% of water in comparison to the previous irrigation system. In [
12] the authors monitored golf courses and greenhouses by running an Android management application using WSN. This kind of tools allows instant decision making for any event and from any place.
The integration of WSN and decision-making systems enables the development of irrigation plans based on energy savings, available water or the reduction of greenhouse gases. In [
13] the authors developed an application whose aim is to save costs in pumping stations by finding balances between the flow (the result of valve opening levels) and the pressure at different points of the system. For this purpose, the authors implemented contrasted heuristic models ([
14,
15,
16]). In [
17], a system aimed at saving energy in irrigation facilities by making real-time decisions based on data acquisition was designed through WSN. A fuzzy control to optimize WSN energy consumption by establishing when to transmit the data collected [
18]. In [
19], the authors designed a multi-objective optimization algorithm to maximize benefits in every irrigation plot while reducing greenhouse gas emissions. With the same purpose, we can find works such as that of [
20] which are oriented towards the search for pumping and monitoring systems that are totally disconnected from the electricity grid system. This is achieved by means of a real time model that synchronizes the photovoltaic energy available with the requirements for each sector.
Thanks to the automatic storage and the analysis of the measured data, in [
21] the authors proposed the elaboration of databases from sensor measurements allowing the user of the application to model the operation of the irrigation system. The deployment of these solutions based on real-time data availability requires wireless communication networks both at local level and to the cloud.
Networks of distributed nodes in fields and farms require specific attention since the quality of transmissions among devices needs to be ensured. The vegetative state of the crop canopy or the shape of the soil are known to affect the information loss rates in radio wave transmissions. In this sense, the works developed in ([
22,
23]) must be highlighted.
1.2. Typology of Communication Networks
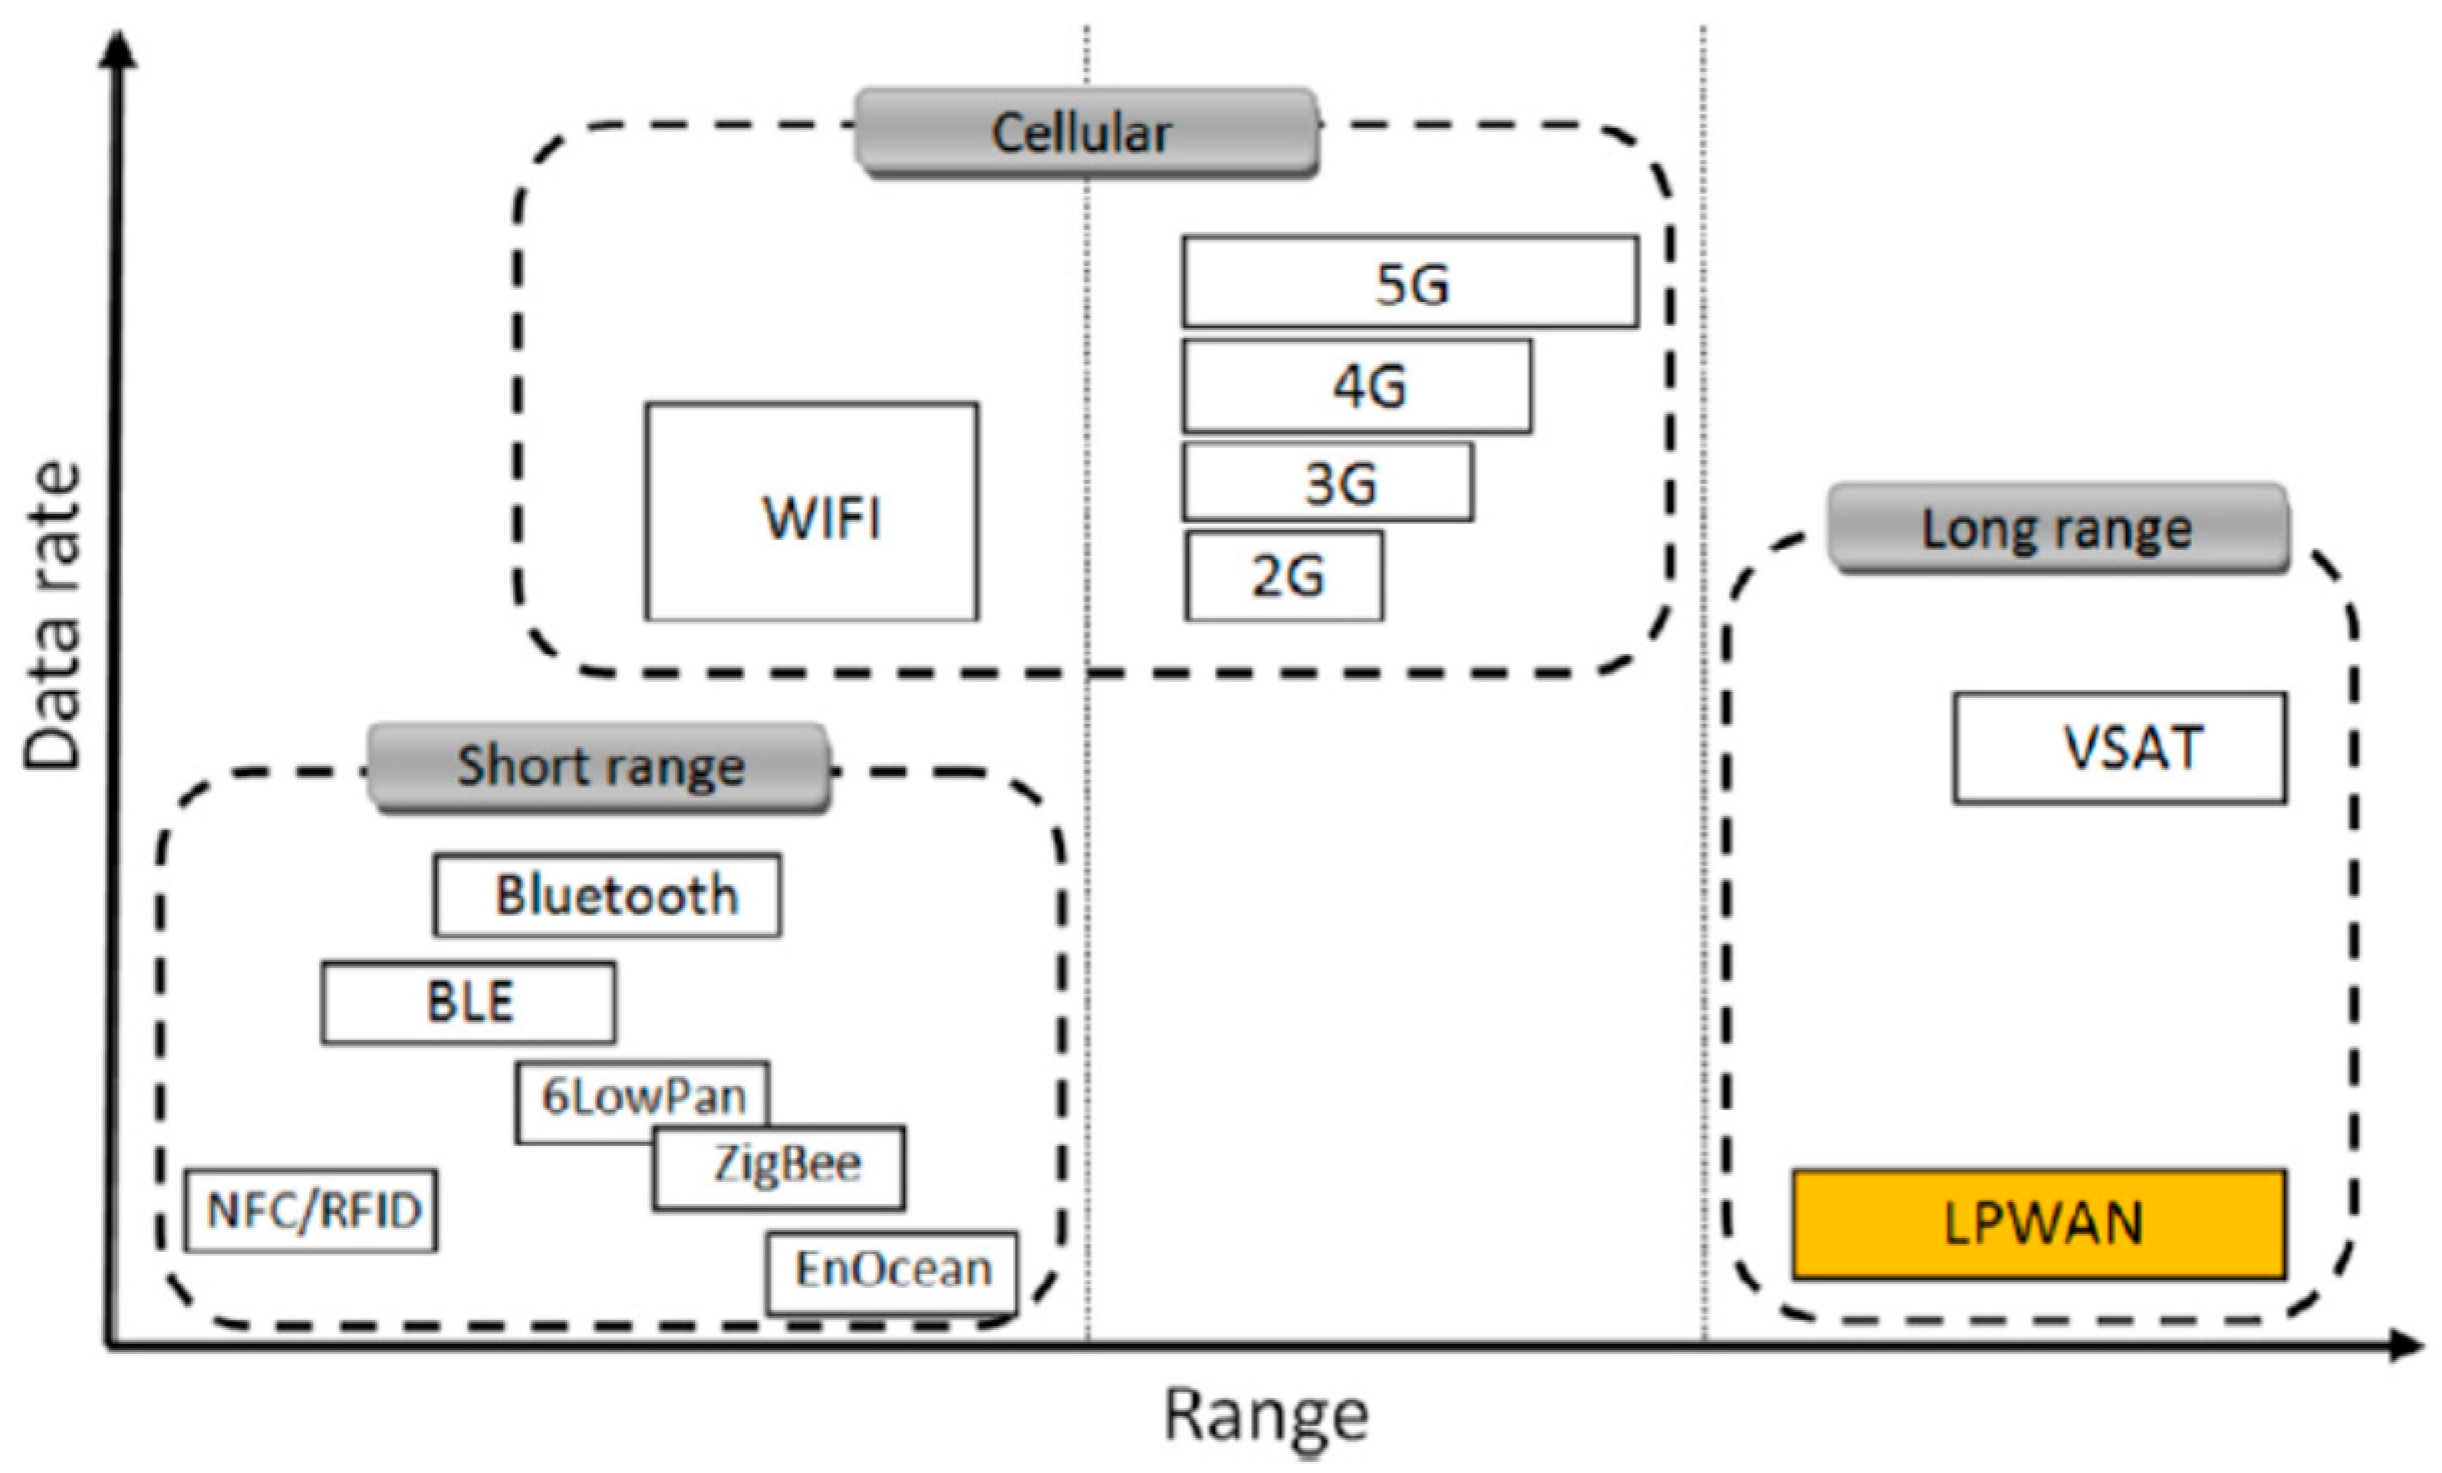
Communications networks are classified into three different groups according to their range and transmission speed as shown in
Figure 1 ([
24,
25]), namely:
Short-range networks.
Cellular networks.
Long-range networks.
Short-range networks do not require a license for use. This group includes ZigBee or Bluetooth, among others. They are characterized by their low power consumption and high data exchange speed, although these features are limited to a short range (
Table 1). In [
21] the authors used this sort of networks for monitoring the irrigation infrastructure.
Cellular networks outstand for a high transmission speed including short (Wi-Fi) and long-range with license (GSM, GPRS, 3G, 4G, 5G). In [
26] a tracking system for sprayers in vineyards based on GSM and GPRS high data flow was developed.
Long-range networks present as advantages to the previous two systems that they have lower energy consumption, lower cost and a greater range.
A new model of long-range wireless networks, Low Power Wide Area Networks (LPWANs), has been recently developed. Its main feature is to have a star topology which has led to two models of technological development [
28]. On the one hand, several telecommunications companies have used existing facilities (antennas, relay stations, etc.) to offer coverage to devices compatible with this technology [
29]. On the other, collaborative networks have emerged for the global integration of IoT applications through low-cost open tools [
30].
This “ease of use” increases since electronics companies, aware of the impulse of LPWANs, have incorporated compatible communication modules to the already known boards, thus facilitating connectivity (e.g., Arduino MKR 1200, Arduino MKR 1300, Pycom Lopy 4, etc.).
LPWANs are very promising for the development of a monitoring, control and computing solution “in the cloud” in agriculture. Relevant variables are well known and, in most cases, have reaction times that limit the measurement frequency required (temperature, soil humidity, atmospheric humidity, precipitation, solar radiation, wind, hail). For this reason, the information transfer rate is low, and long-range communications are required [
31].
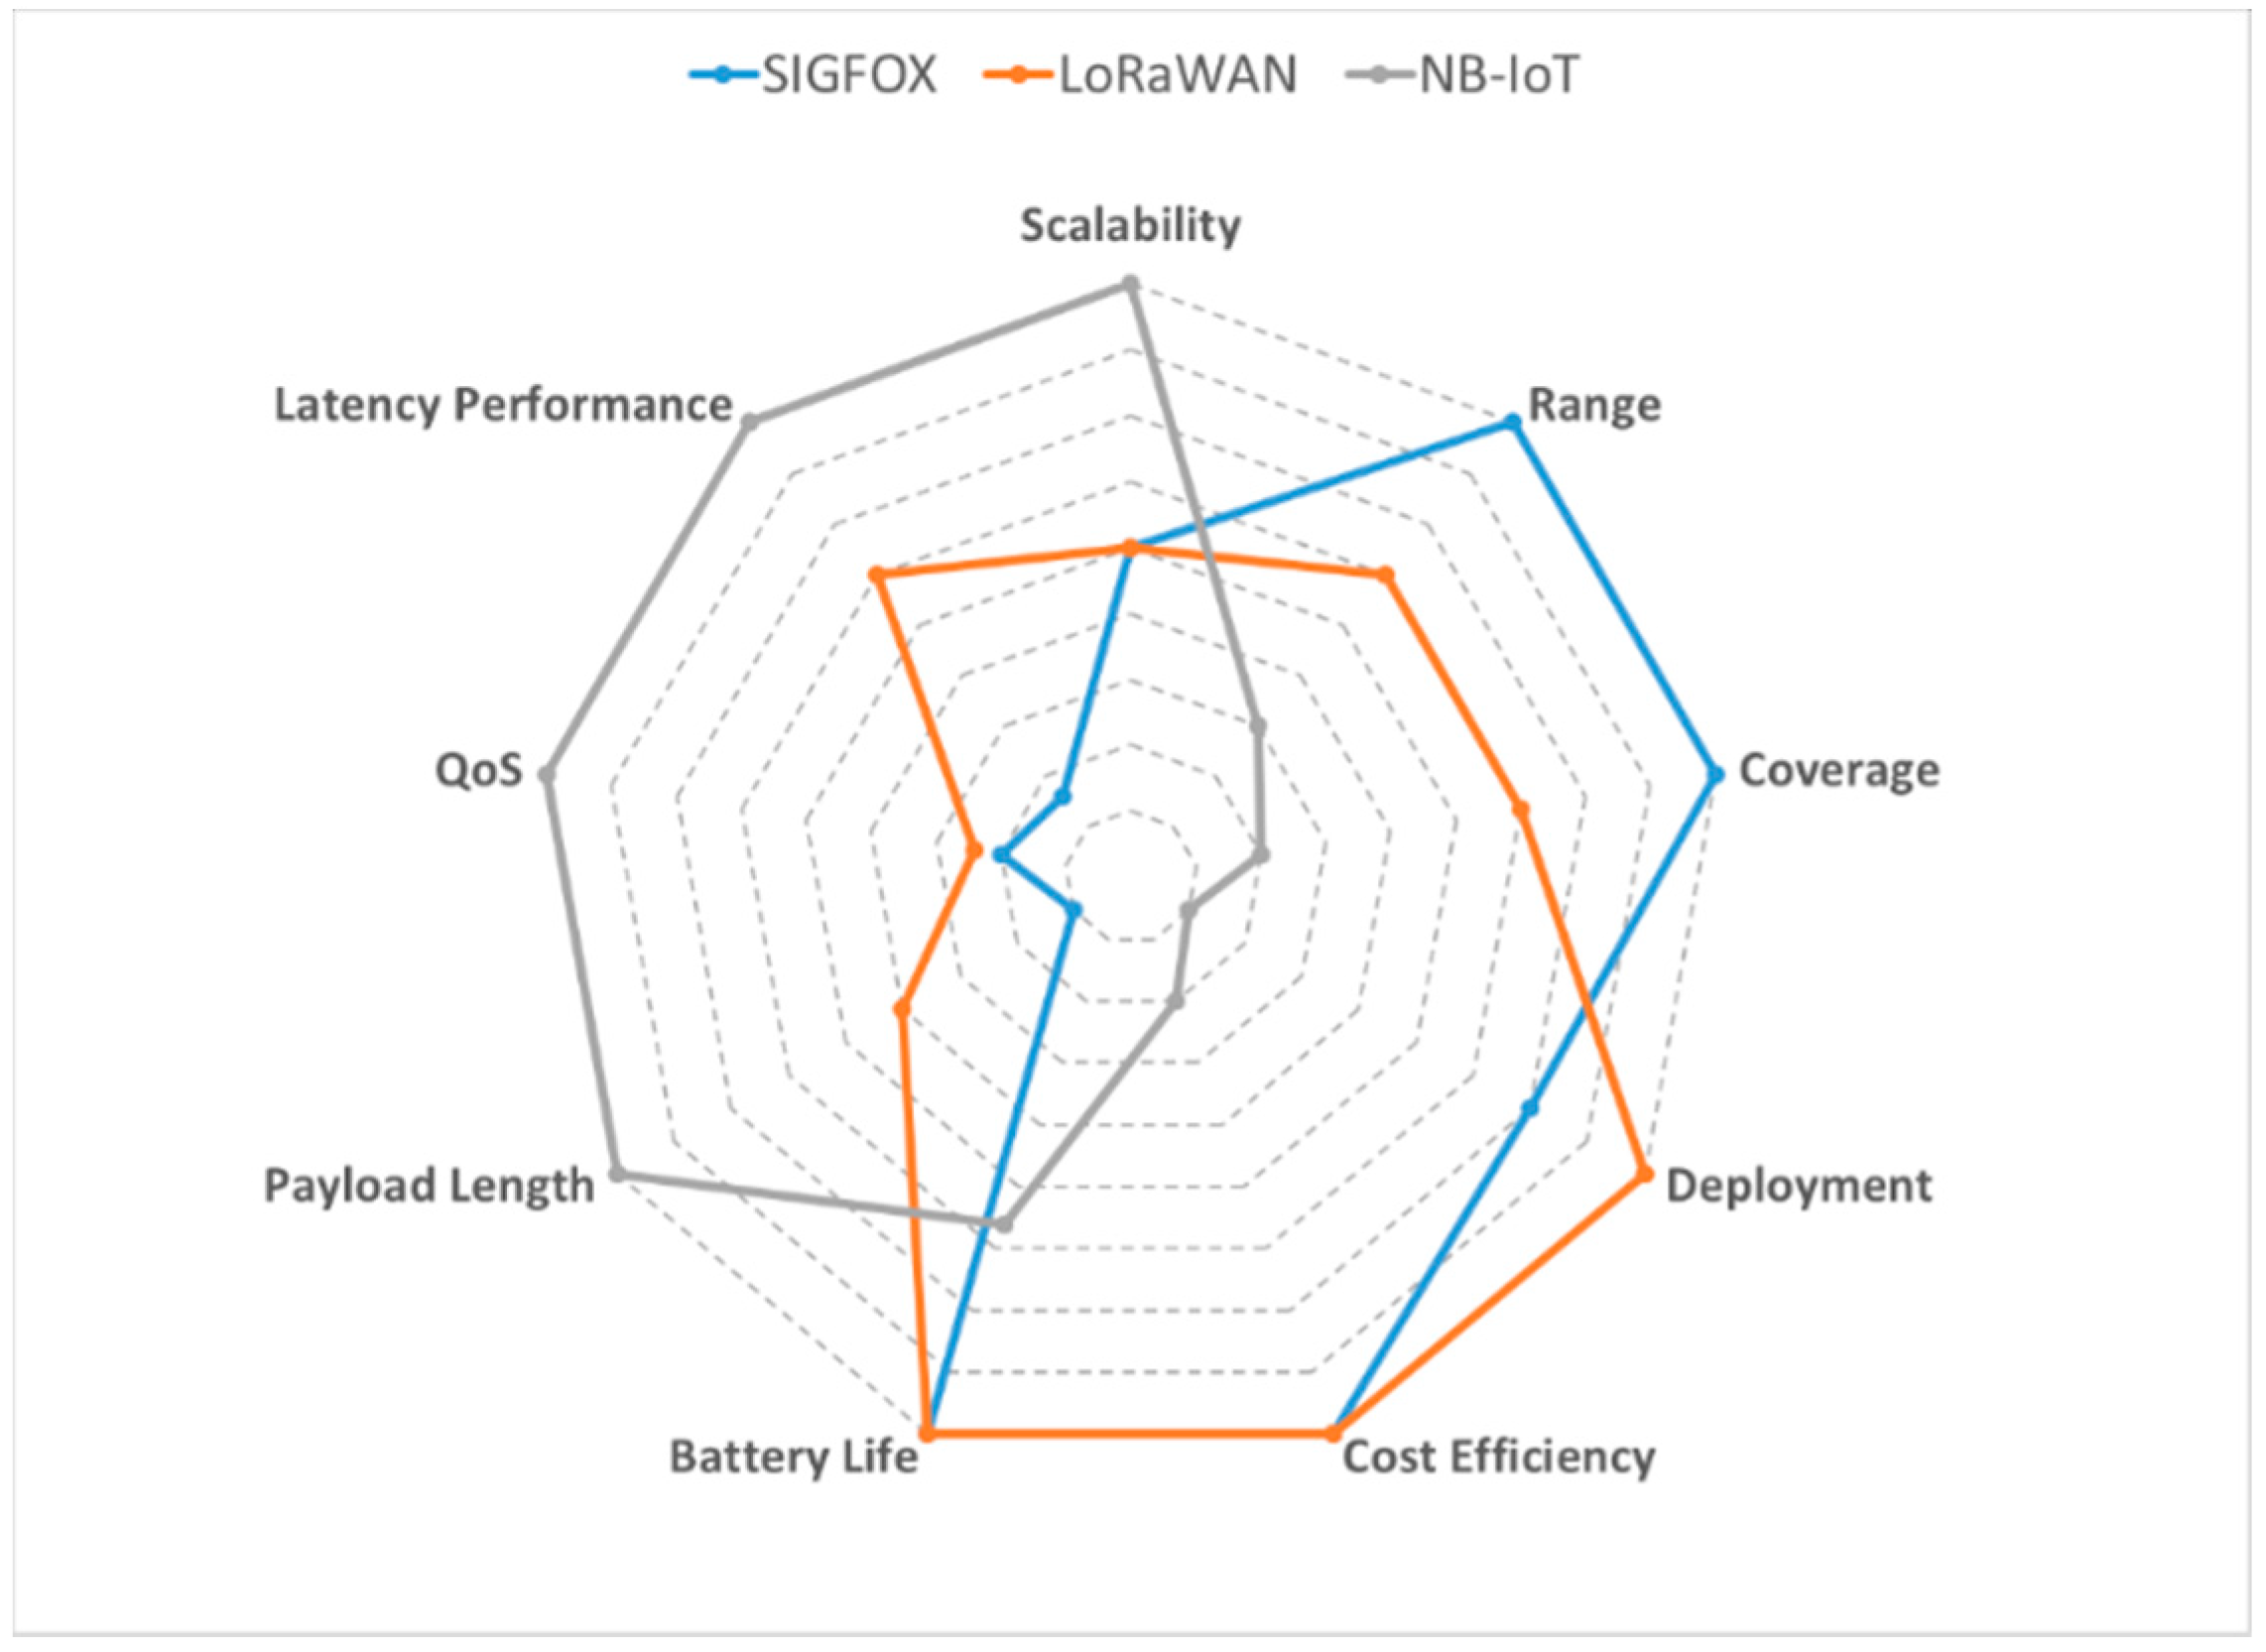
The main aspects of SIGFOX, LoraWan and NBIoT are presented below considering their applicability in the digitalization of irrigation exploitations
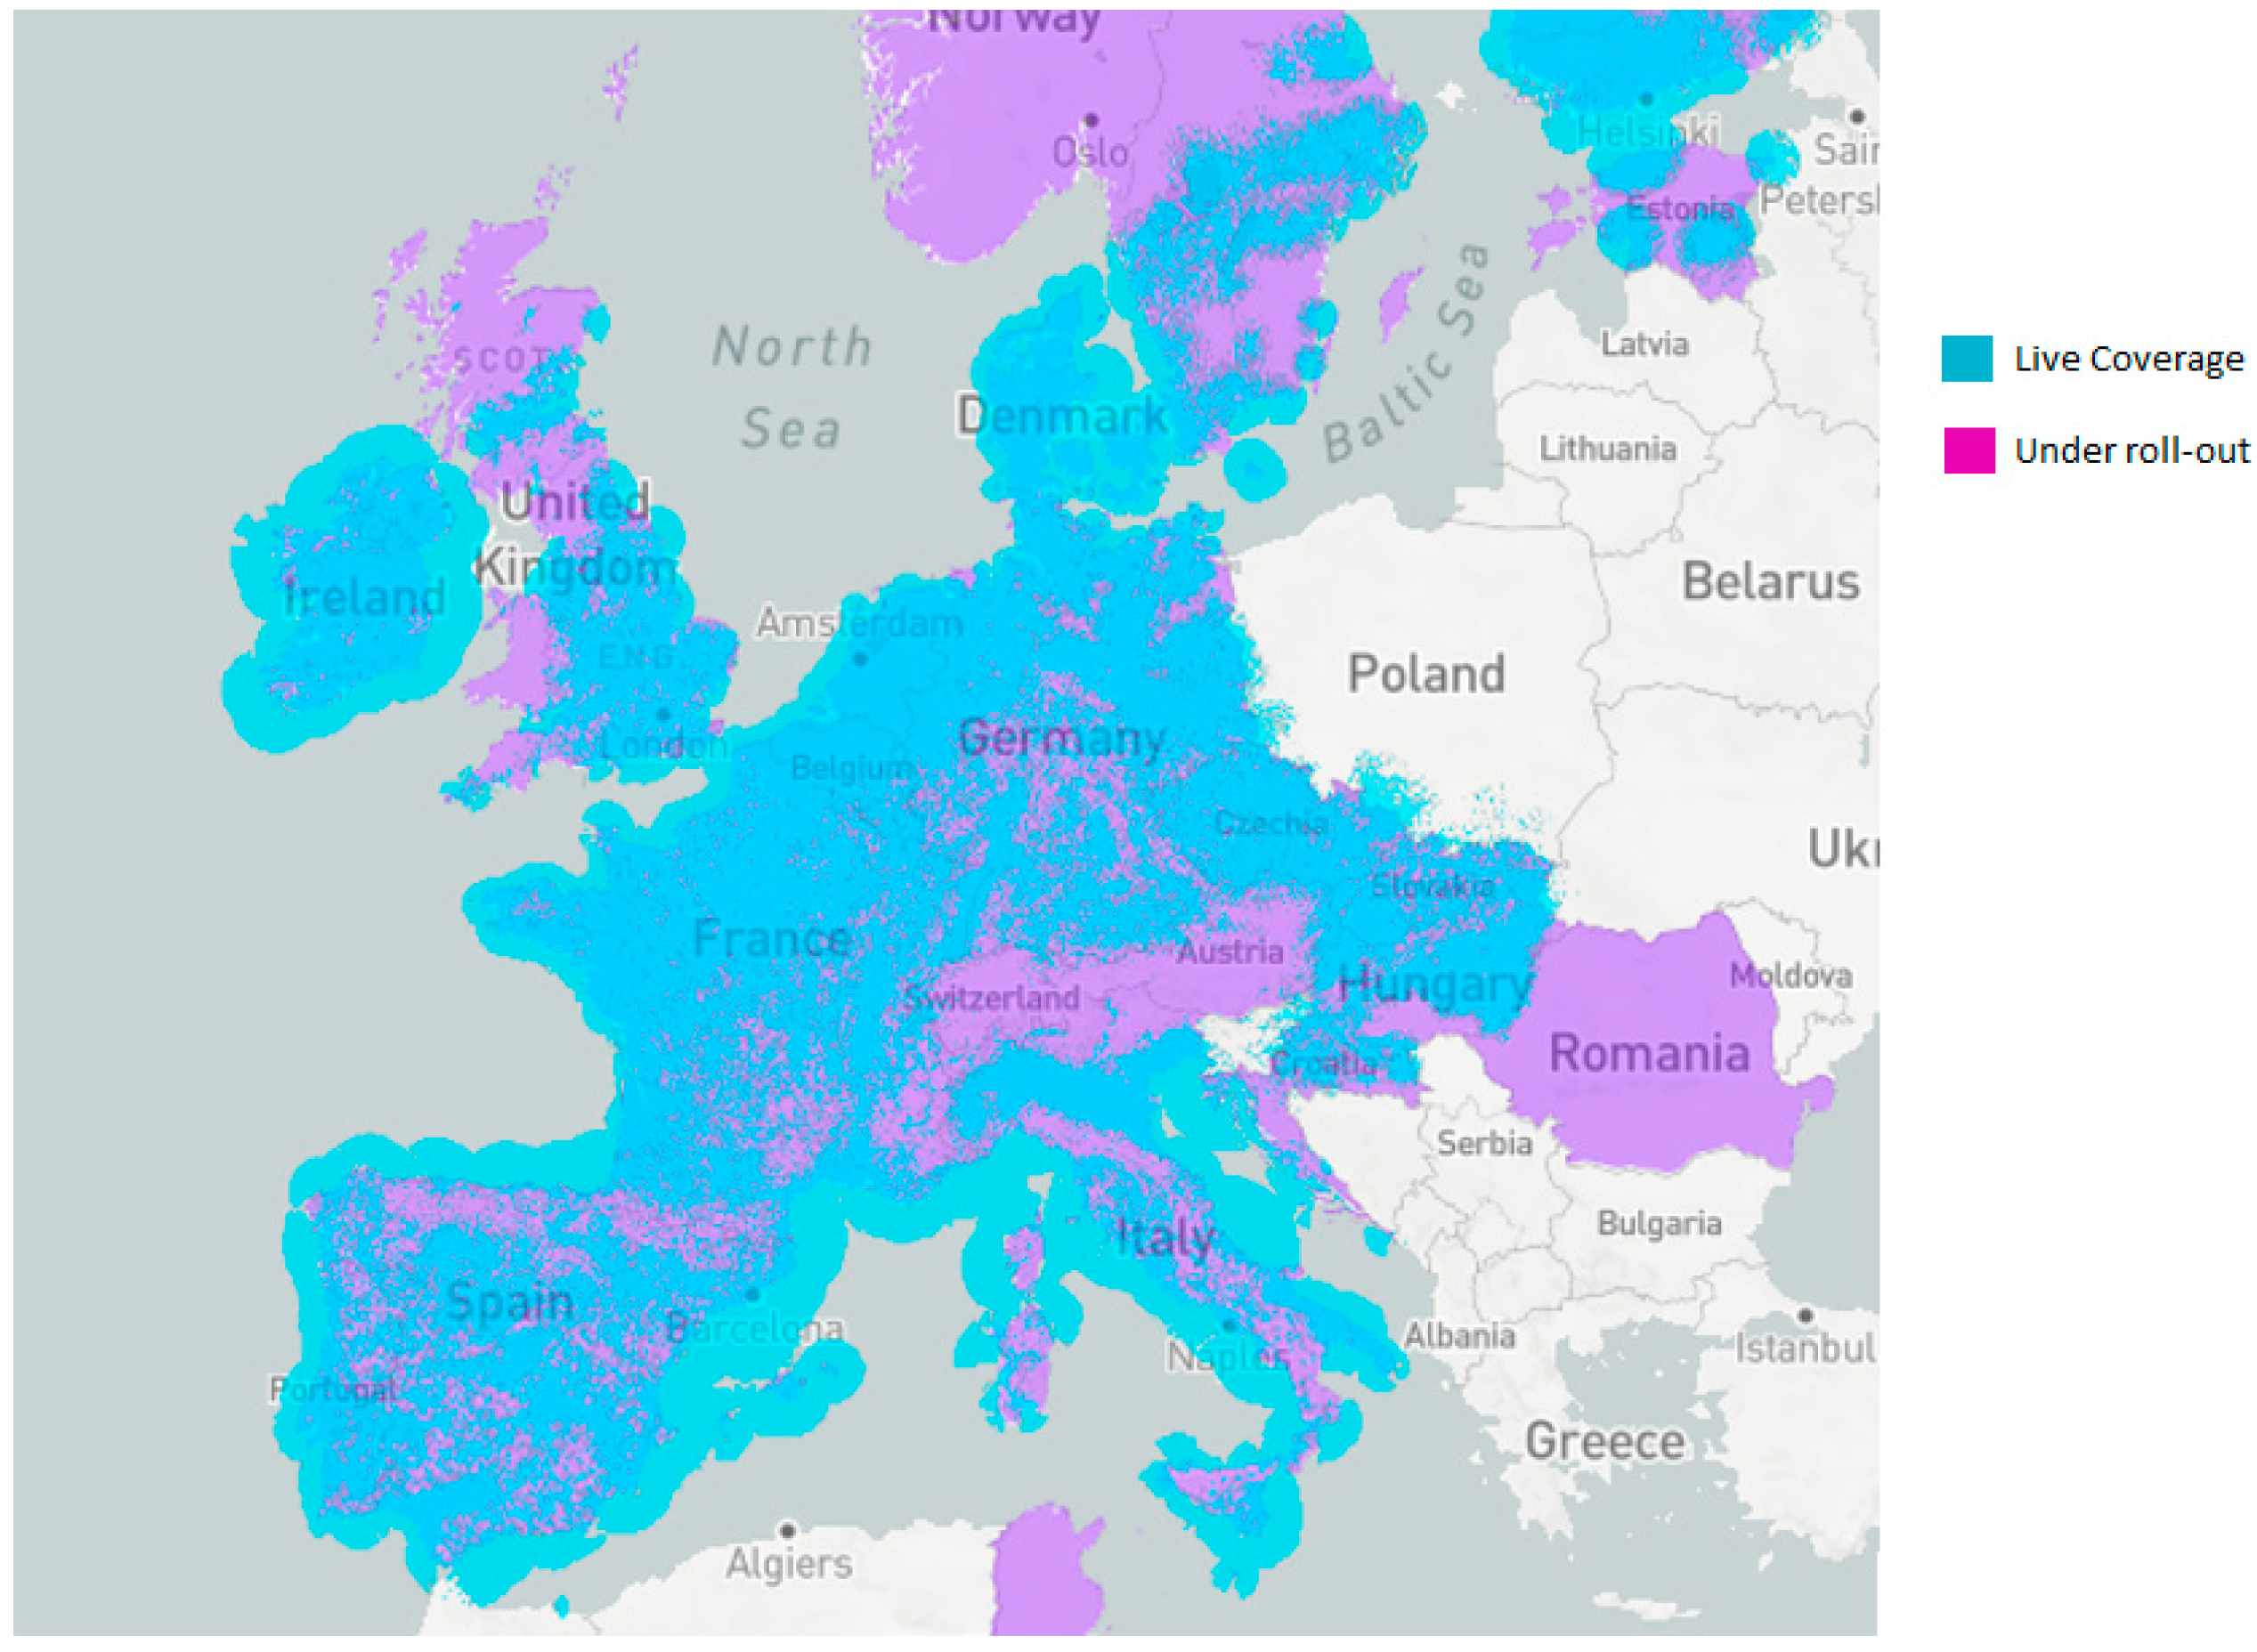
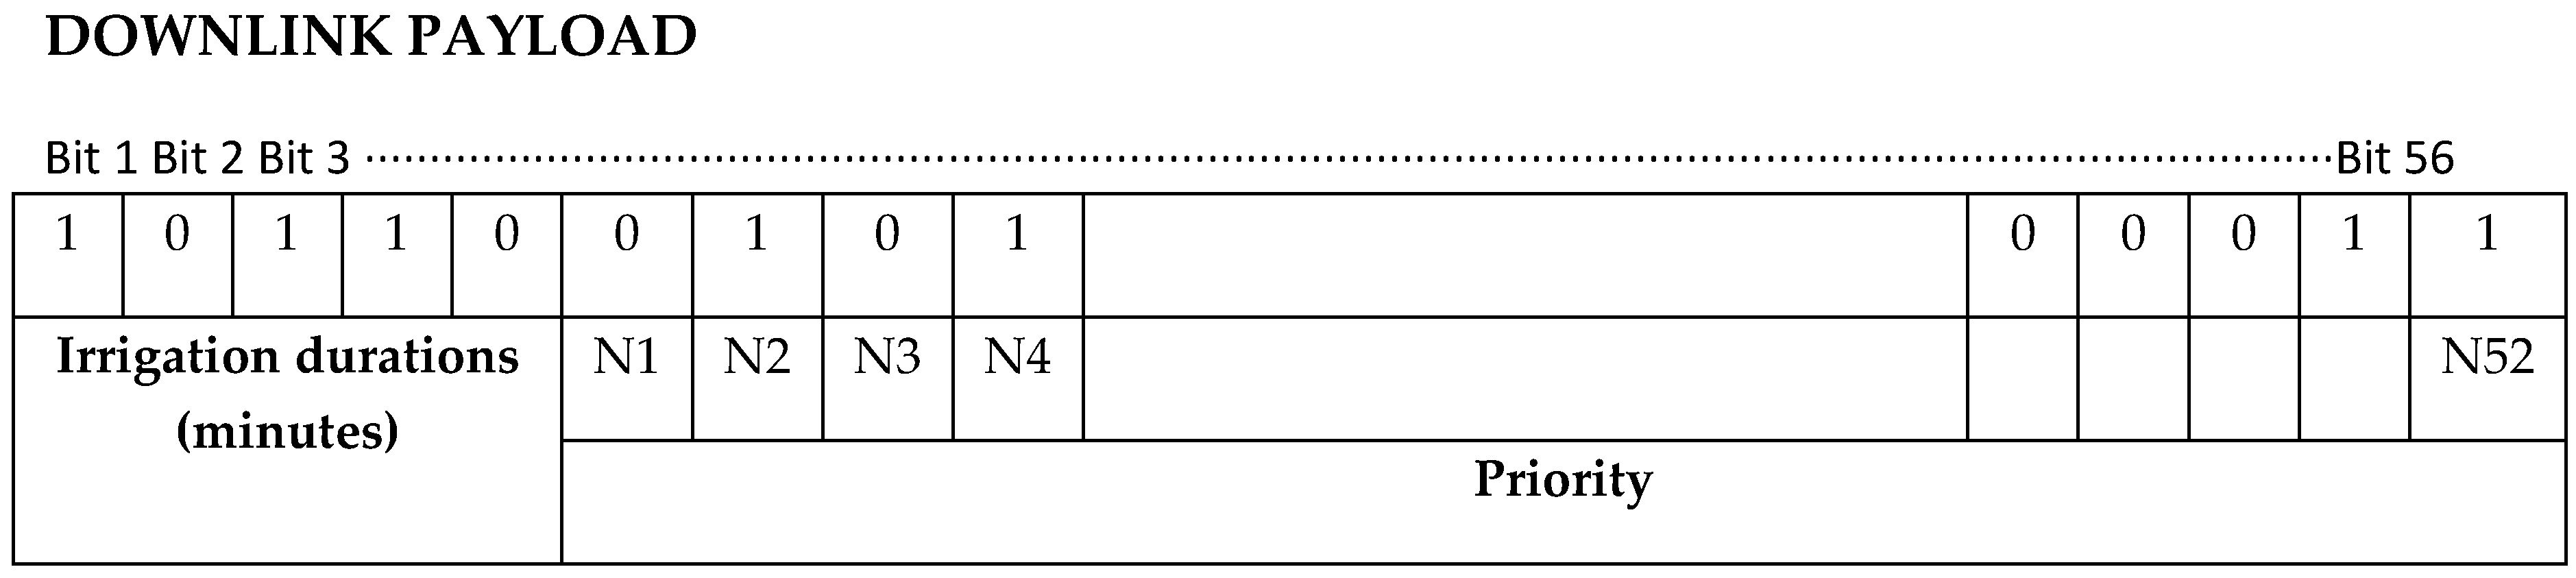
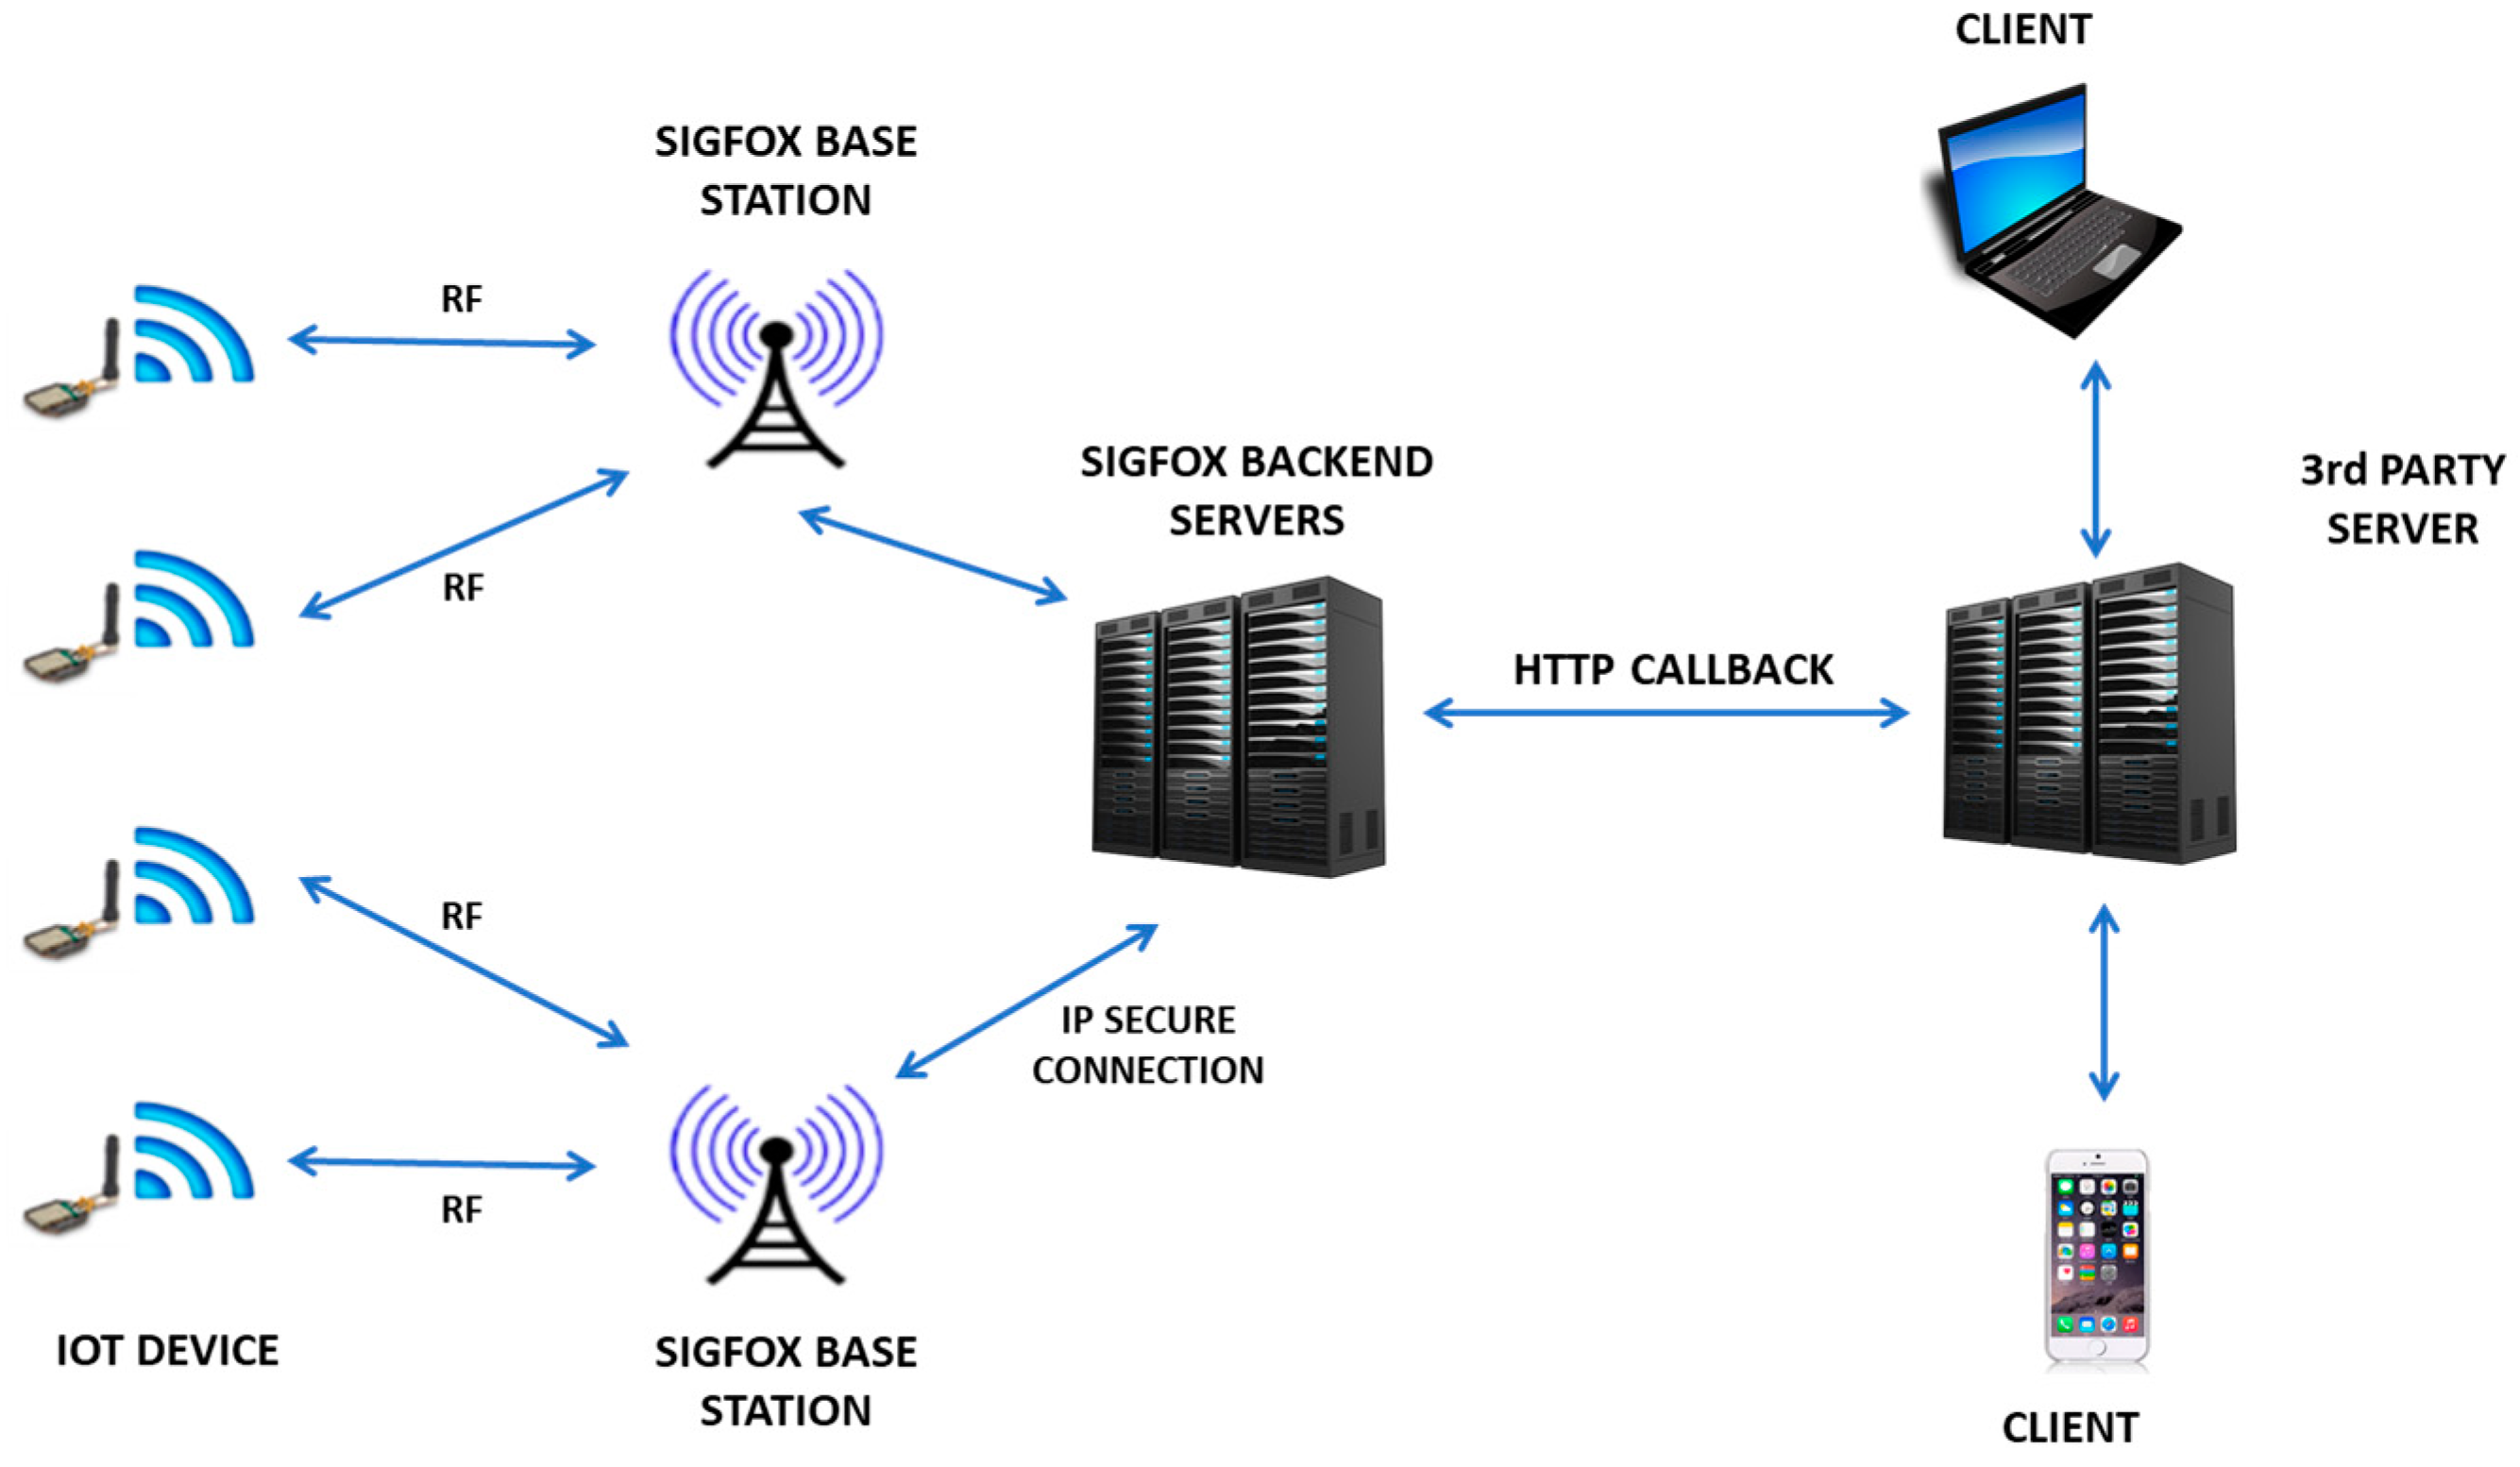
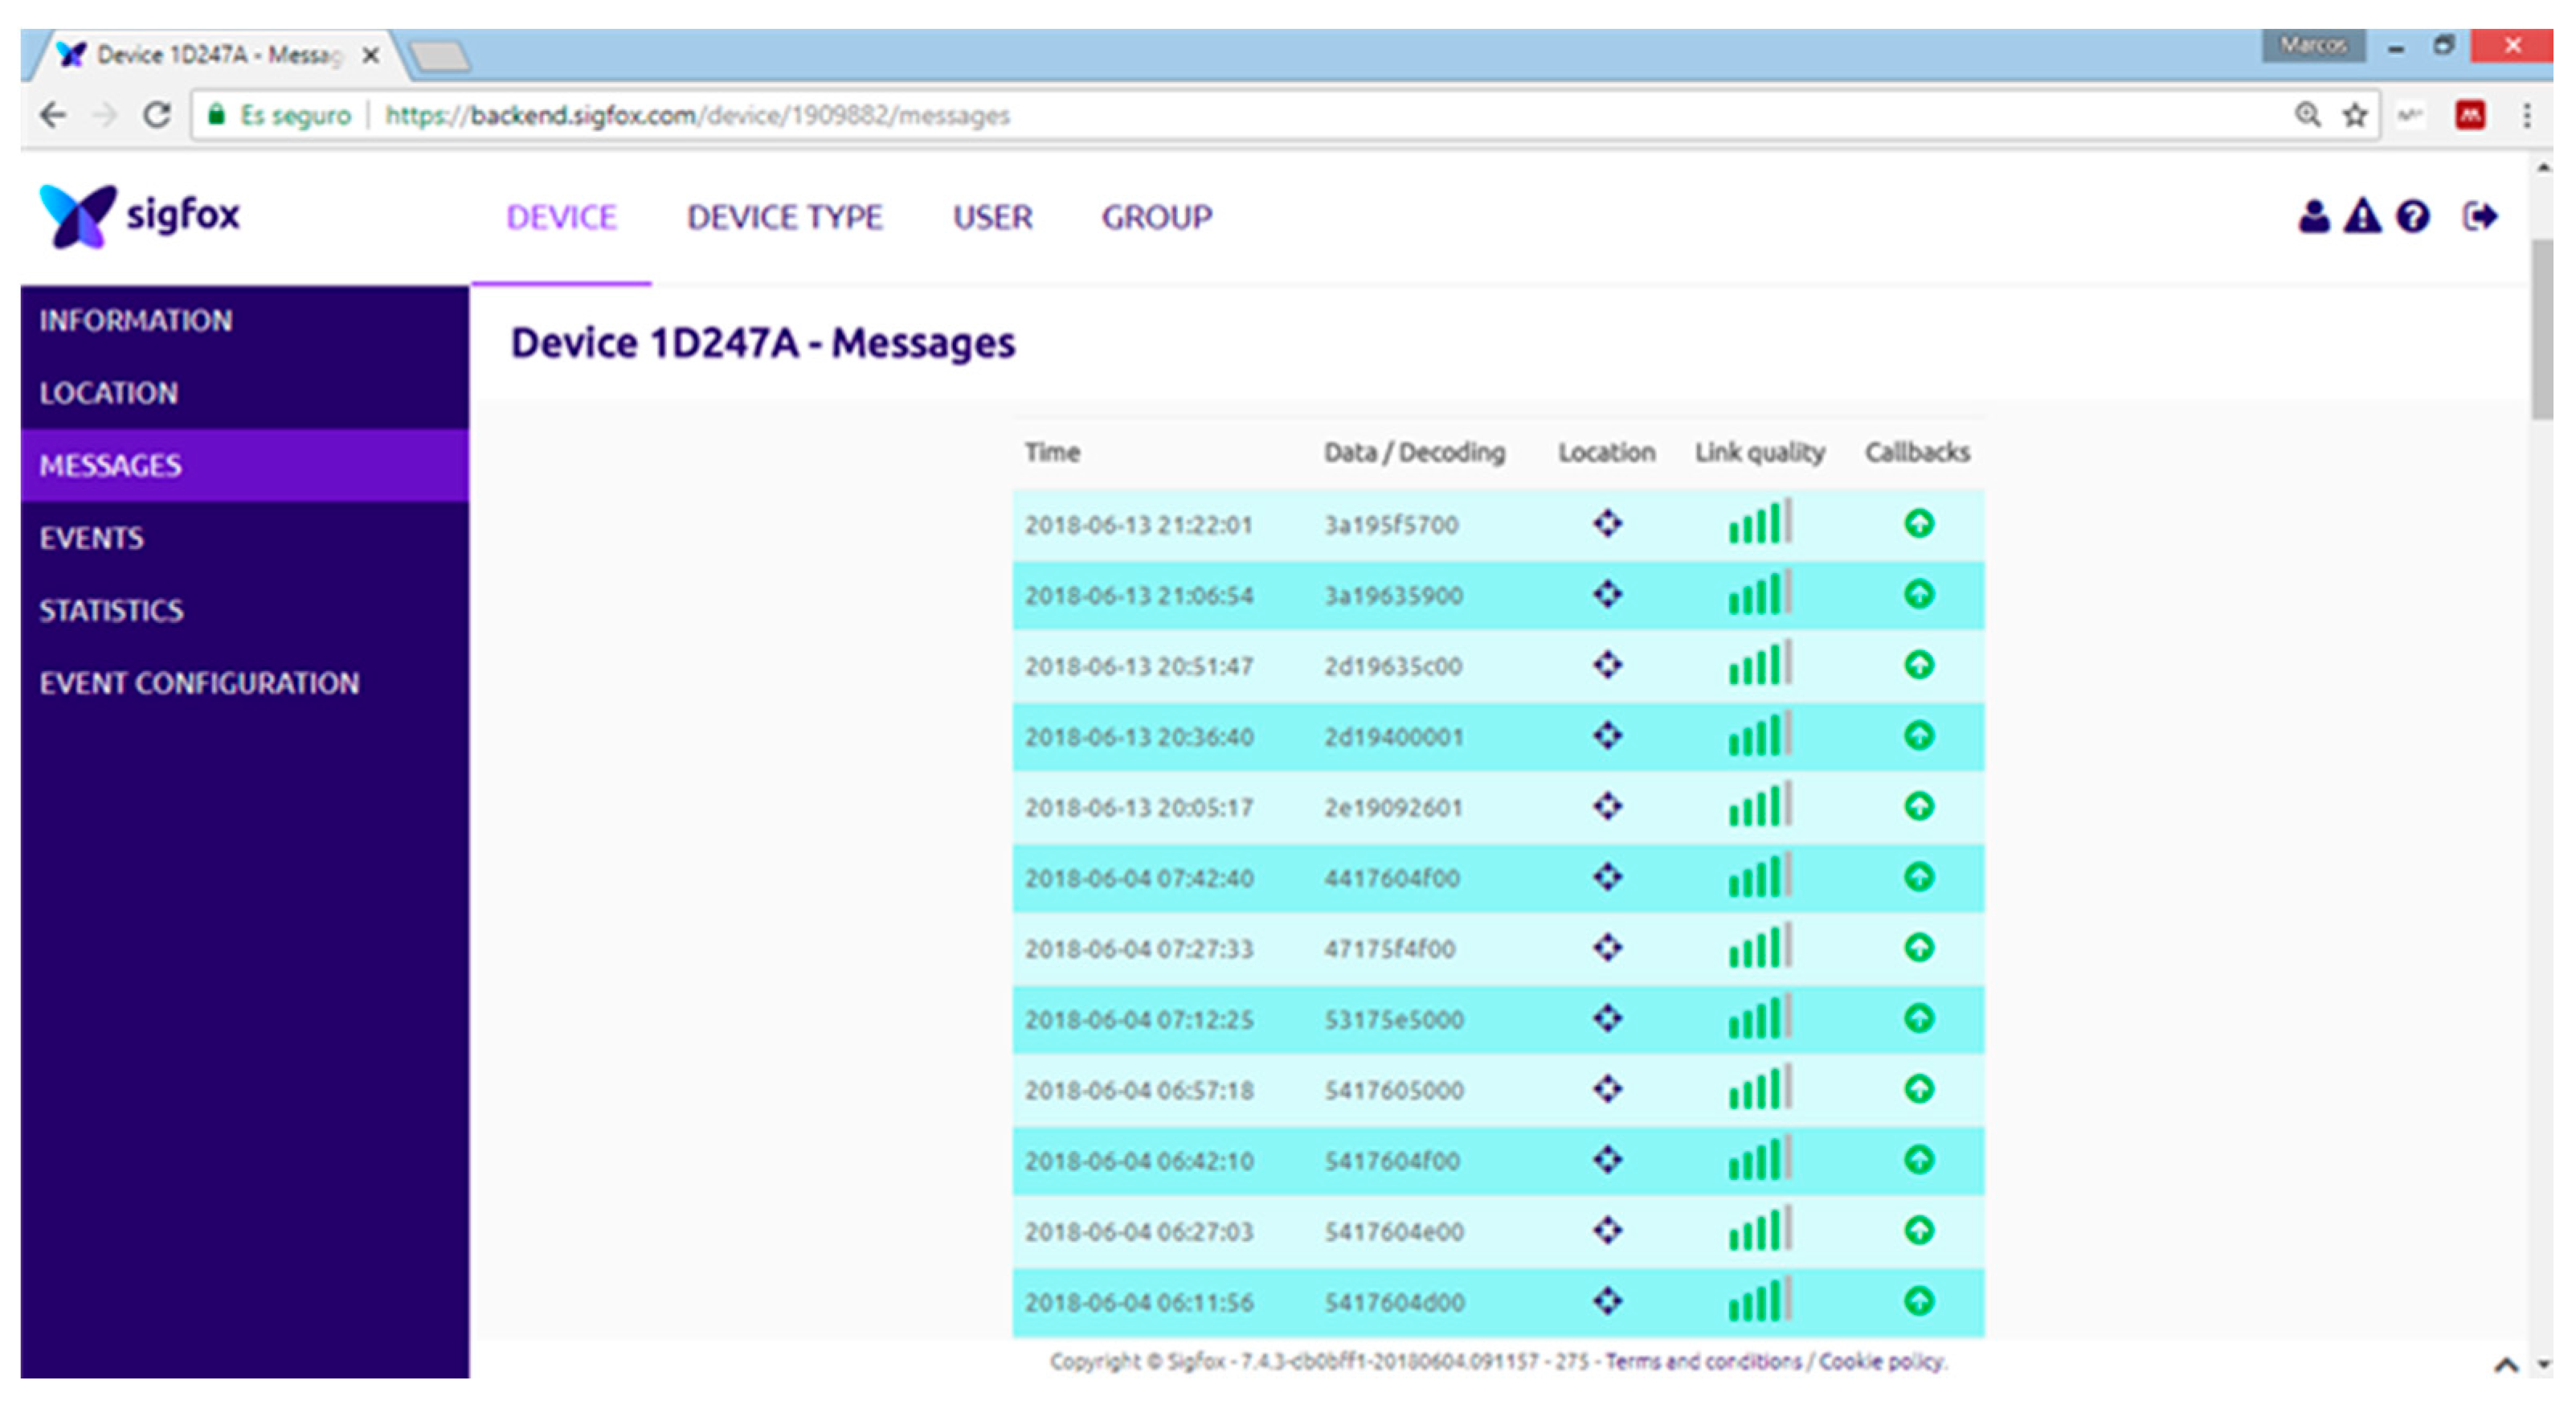
SIGFOX: It is presented as the most limited option in terms of transmission speed (100 bps) and asymmetry, as it allows 140 uplink and 4 downlink messages per day. The uploading of messages admits up to 12 bytes for payload and up to 8 bytes for download. Moreover, the network use involves a cost per device similar to the use of the GPRS network in M2M (Machine to Machine) mode. Despite these limitations, SIGFOX is considered to be a suitable option for a wide range of agricultural projects since no additional facilities are required to be deployed and it achieves a high coverage in many EU countries (
Figure 2). Several devices incorporating the SIGFOX communication module have emerged on the market due to the rapid growth of this technology.
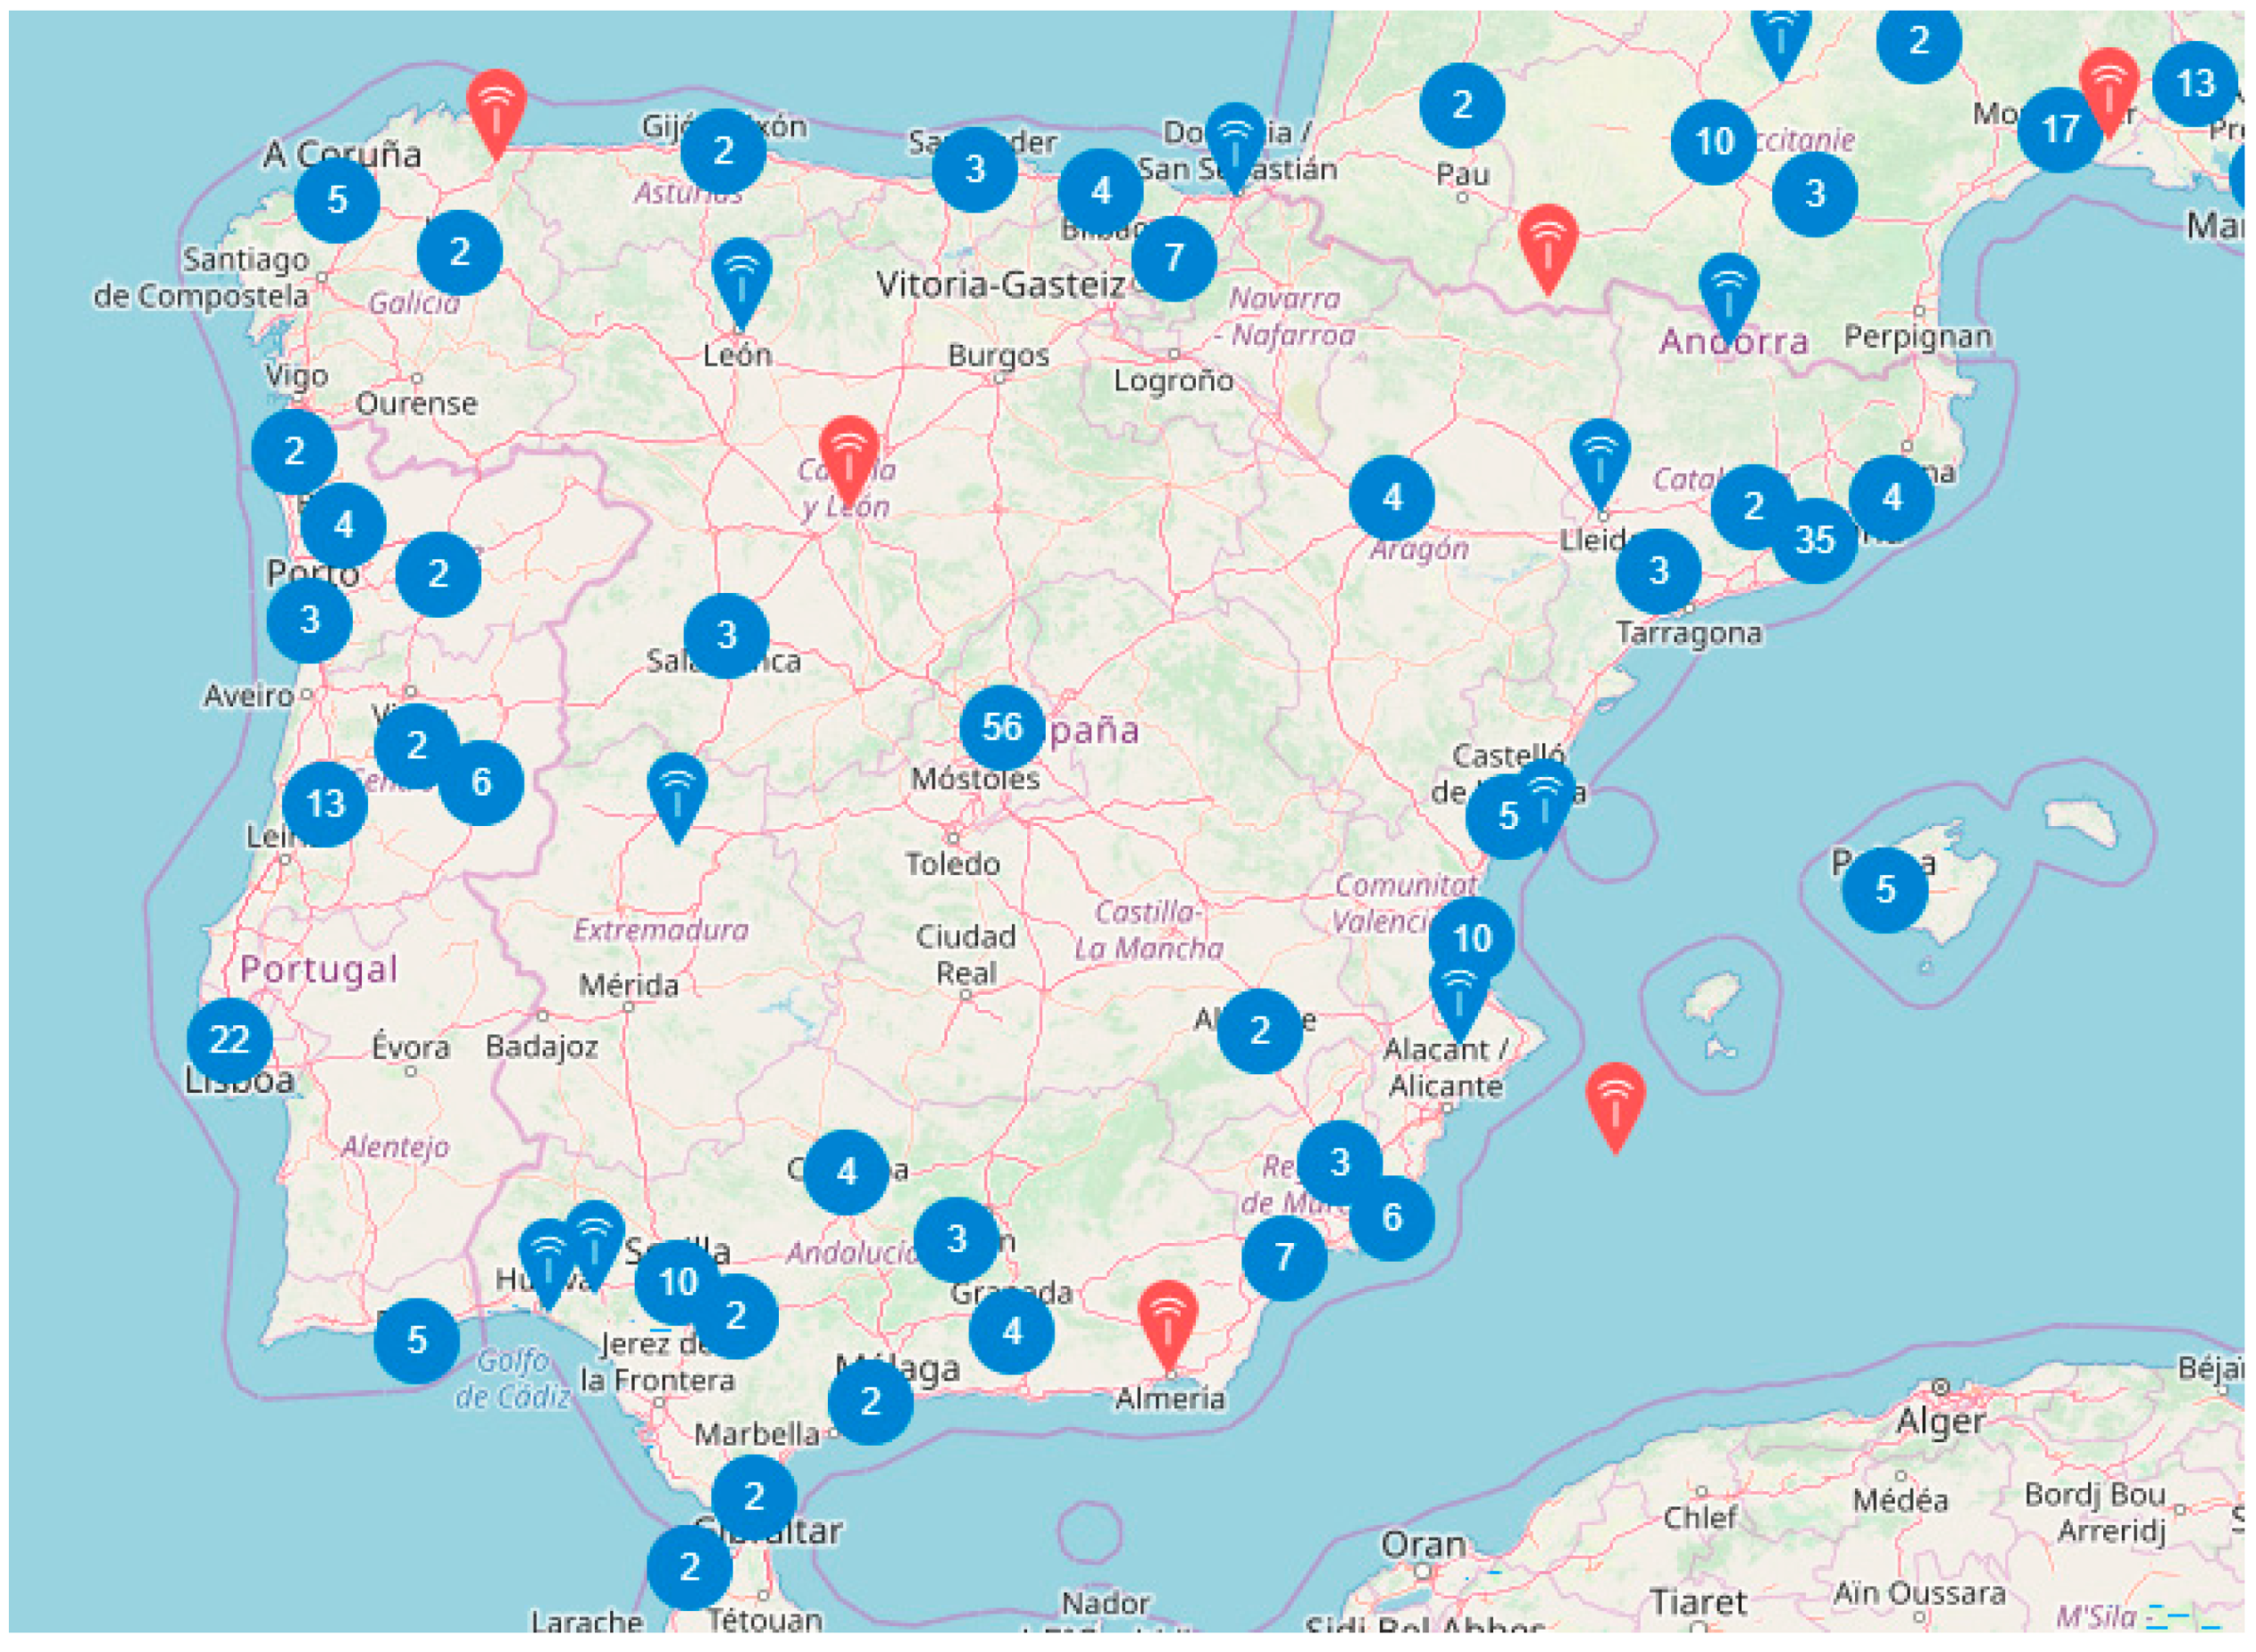
LoraWan: this option has significant advantages in terms of operating costs, no costs associated with the use of radio space, and symmetry in communication [
32]. While there is a 1%-time limitation on band occupancy, the transfer rate required in the applications analysed is not a constraint. The number of messages in both directions is a favourable aspect. The Things Network (TTN) platform that channels information from any LoraWan node has allowed an expansion of this type of network [
30]. As an example,
Figure 3 shows the current status of gateway deployment assigned to TTN in Spain.
Considering that the areas covered by the gateways are, on average, circles with a radius of 20 km, the availability of the network in agricultural areas is still very low. The growth in coverage is the result of ad hoc gateways implemented by users of the network.
NBIOT: This technology employs restricted frequencies which require a license for use. Its deployment is being carried out by the main telephone operators of each country (Vodafone, T-Mobile, AT&T, etc.). NBIOT provides a higher transmission speed than the other LPWAN options, although it involves a service cost per use and the range is reduced. Moreover, the availability of devices is still limited.
Figure 4 presents a qualitative comparison of the three standards analysed above.
Free hardware philosophy has been used in LPWAN network applications ([
33,
34]), and more specifically ATMEL microcontrollers compatible with its development environment (IDE) [
35]. Its widespread popularity has allowed the development of boards adapted to Bluetooth communications, Wi-Fi, Ethernet, LoRa, LORAWAN, SIGFOX, or Android, as well as a catalogue of sensors to interact with and measure any variable. These features, together with its low cost and size, have led to its gradual integration in the field of WSNs ([
36,
37]).
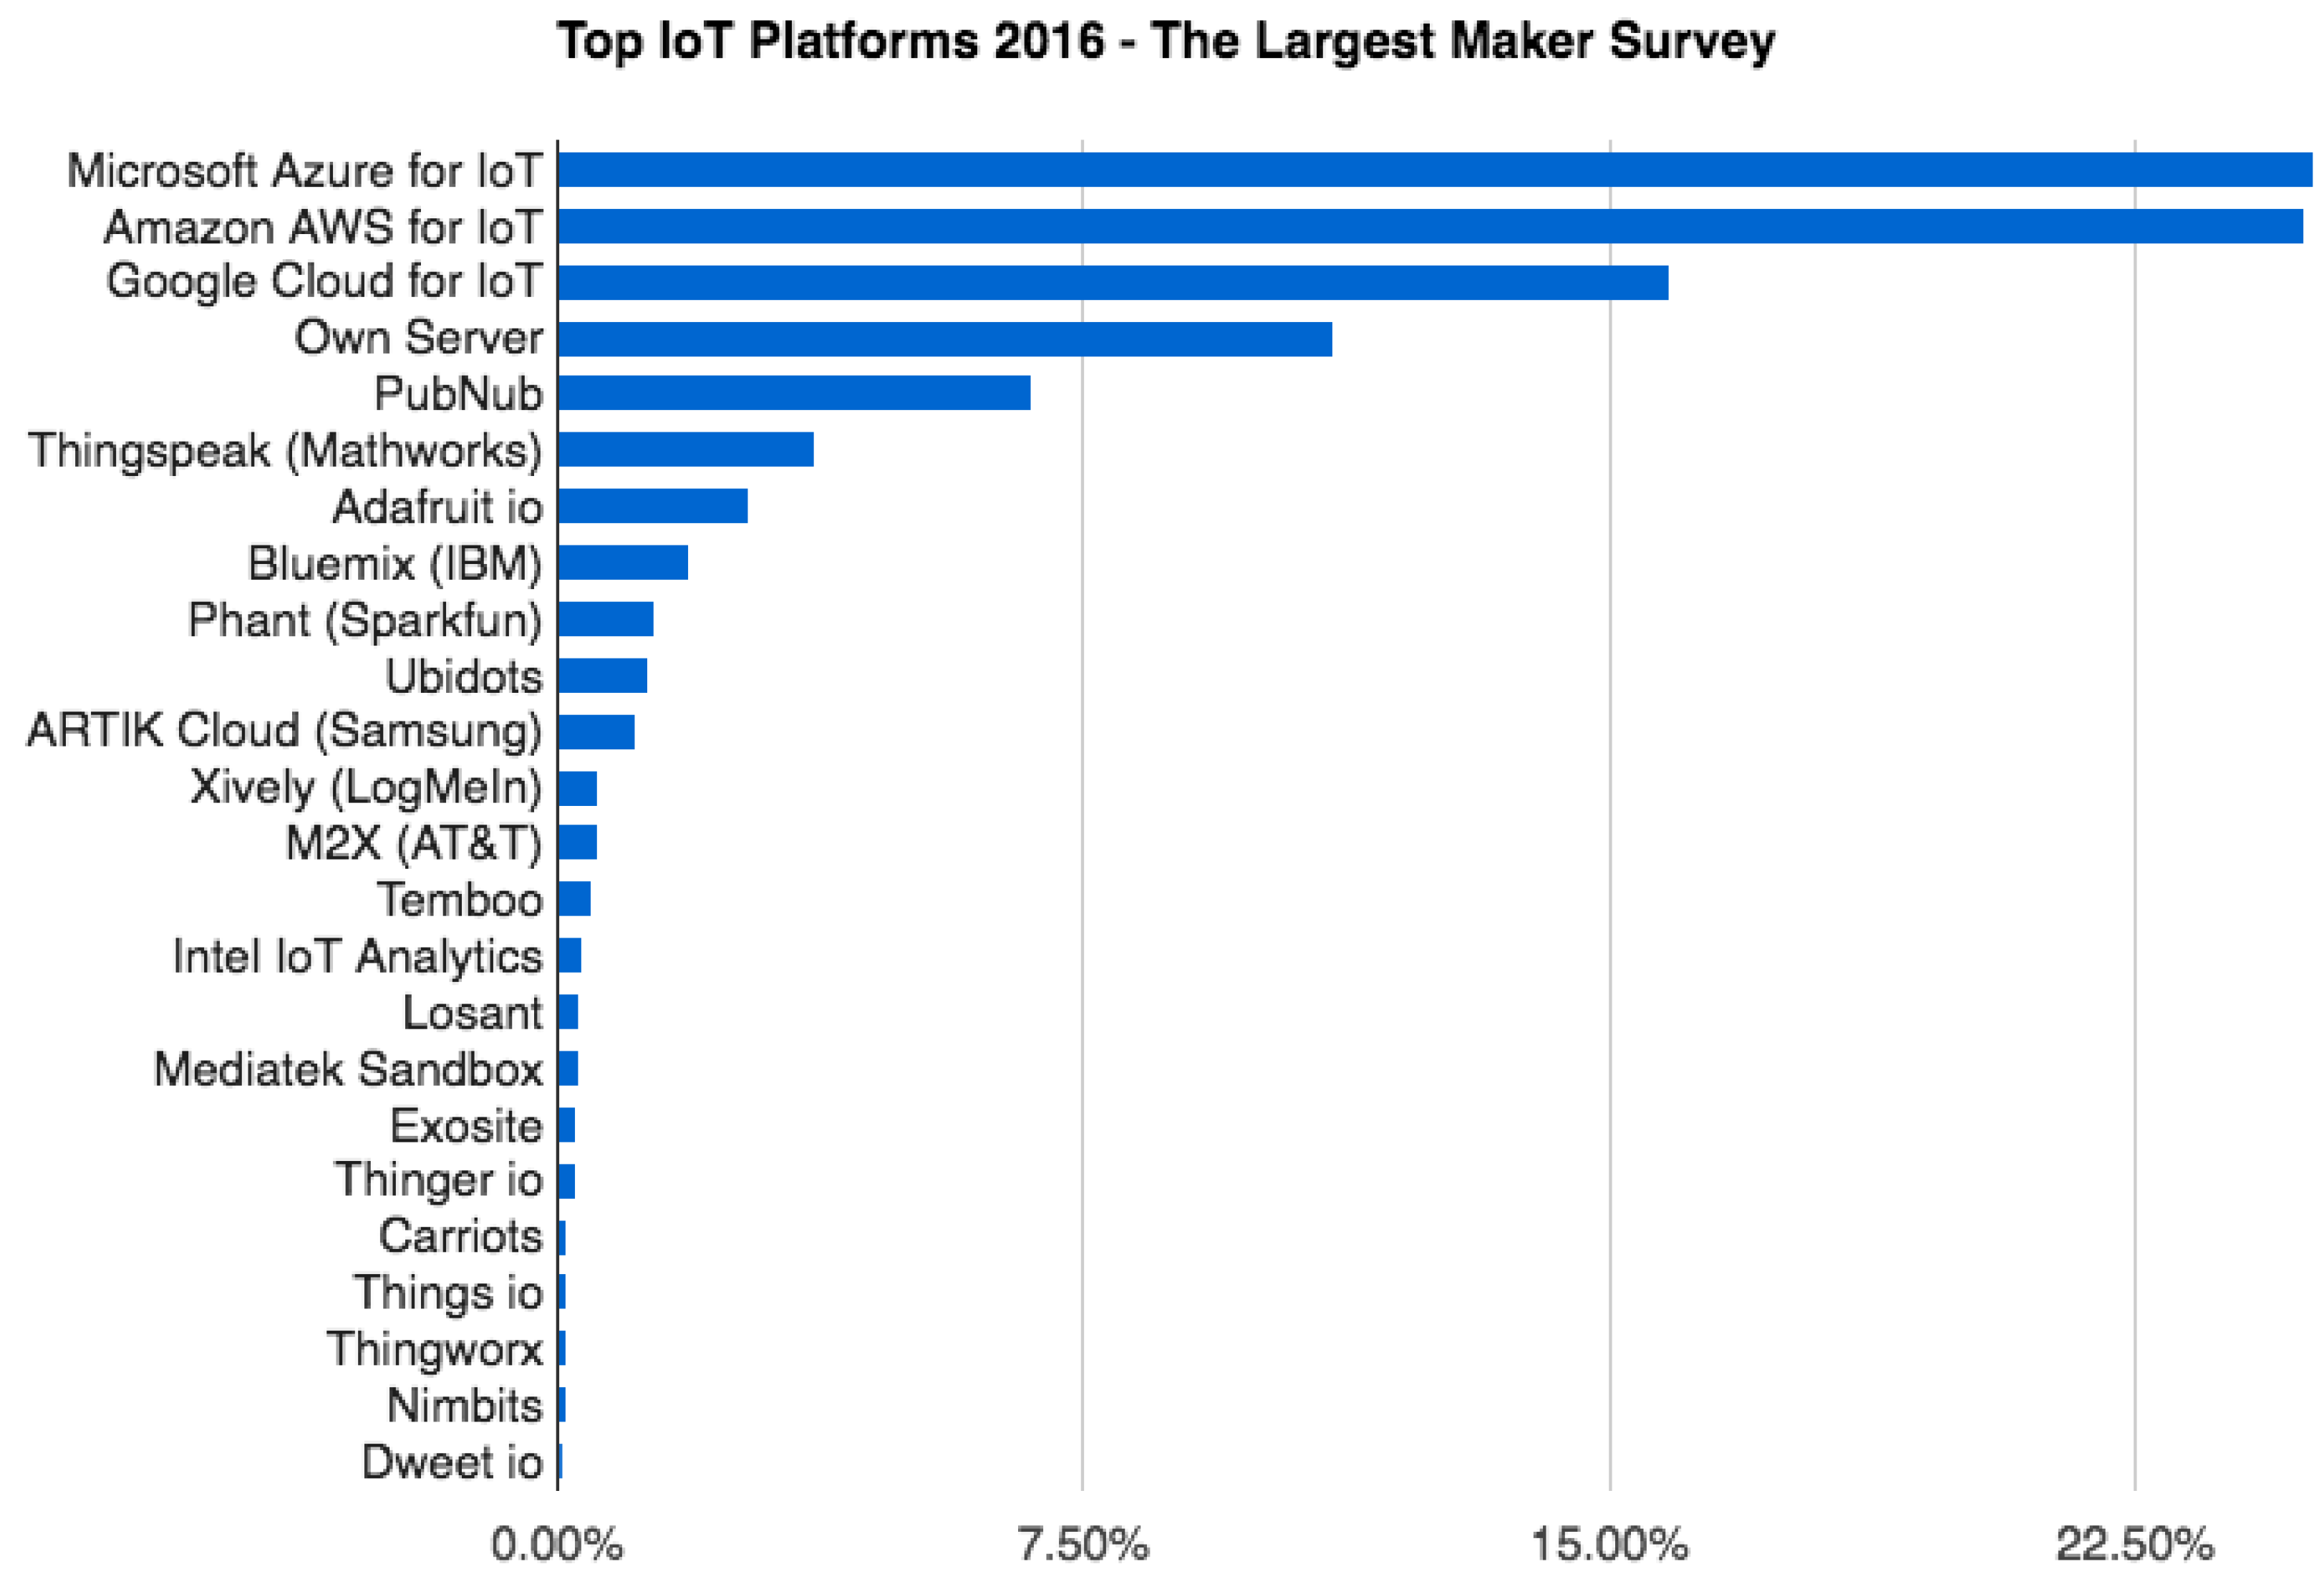
1.3. IoT Platforms
The literature shows three possibilities to approach the implementation of monitoring and performance based on IoT and Cloud Computing. Firstly, specific programming models can be referred for specific problems, as the ones used for precision agriculture management [
7] or for the control of irrigation valves [
38]. This method entails a high programming effort, as it requires the coding of the entire application without reuse of code or adaptation to standard software. Secondly, we find commercial solutions adapted to the client’s needs in terms of data measuring and uploading to the cloud ([
39,
40]). As a drawback, these solutions are closed to the user. Finally, another way to address these technological challenges is to work with generic commercial tools (IoT platforms) where developers adapt the application to their specific needs. The report presents the most representative IoT platforms and their distribution in the market (
Figure 5).
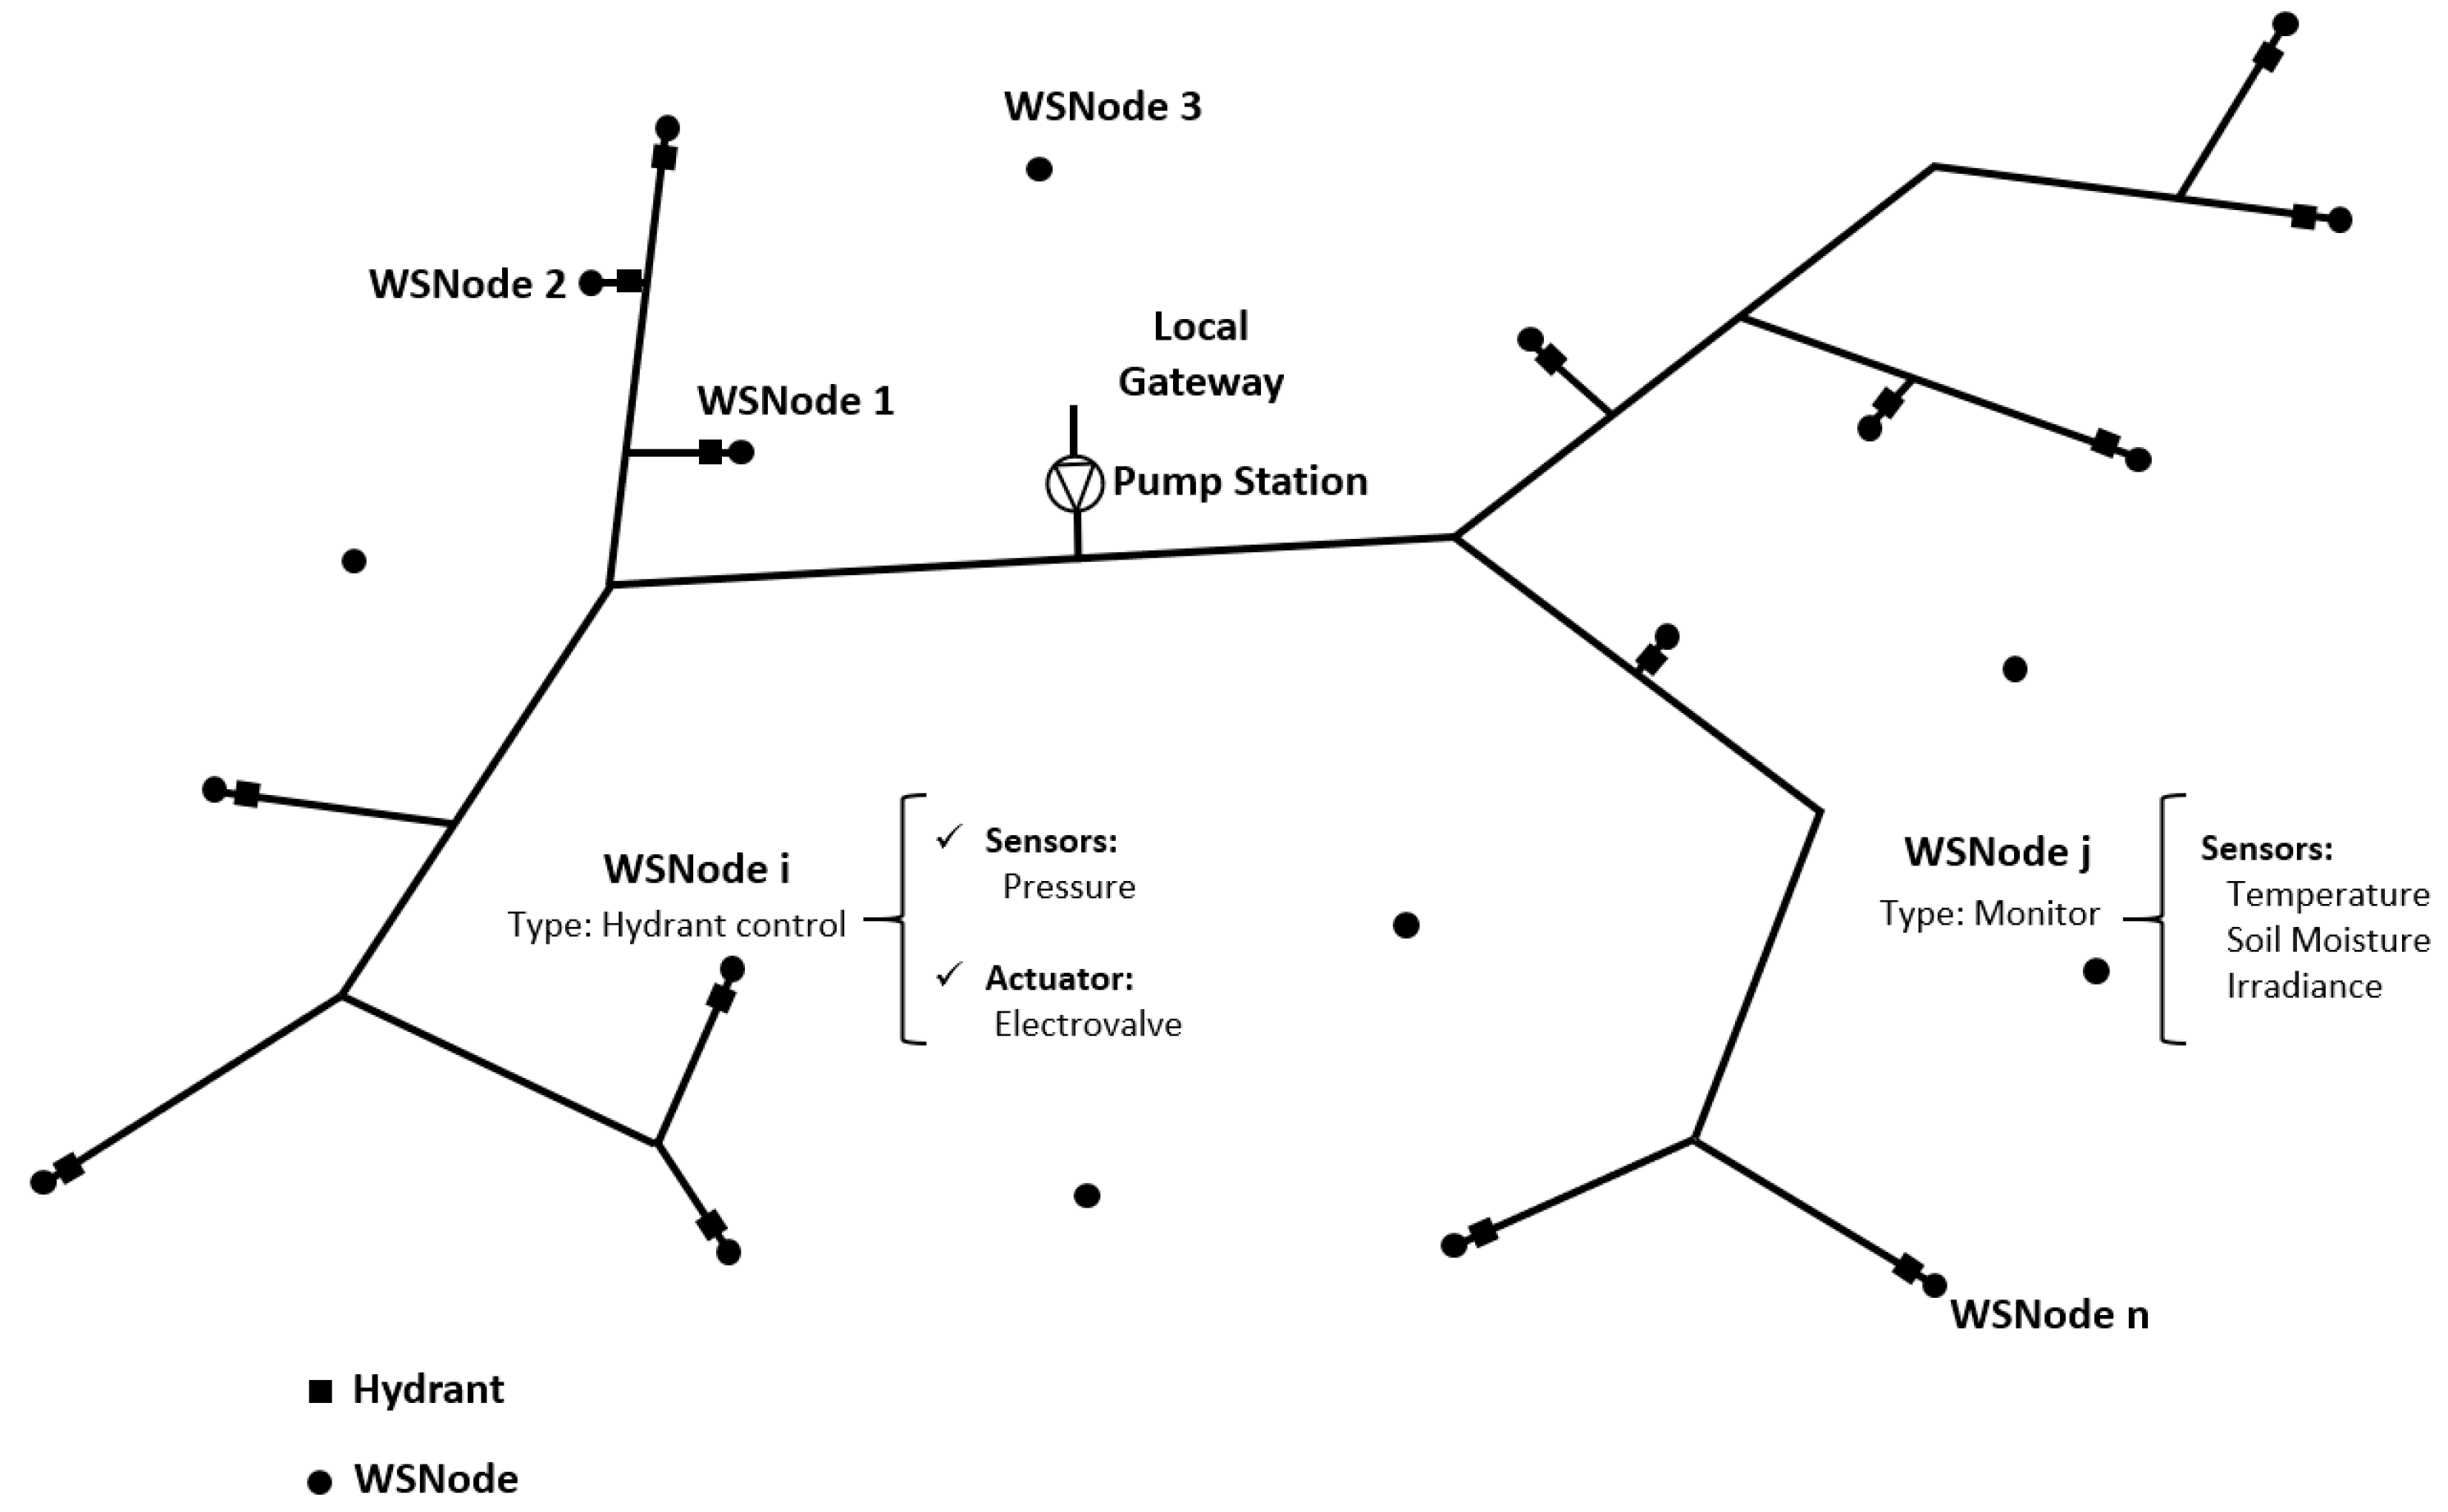
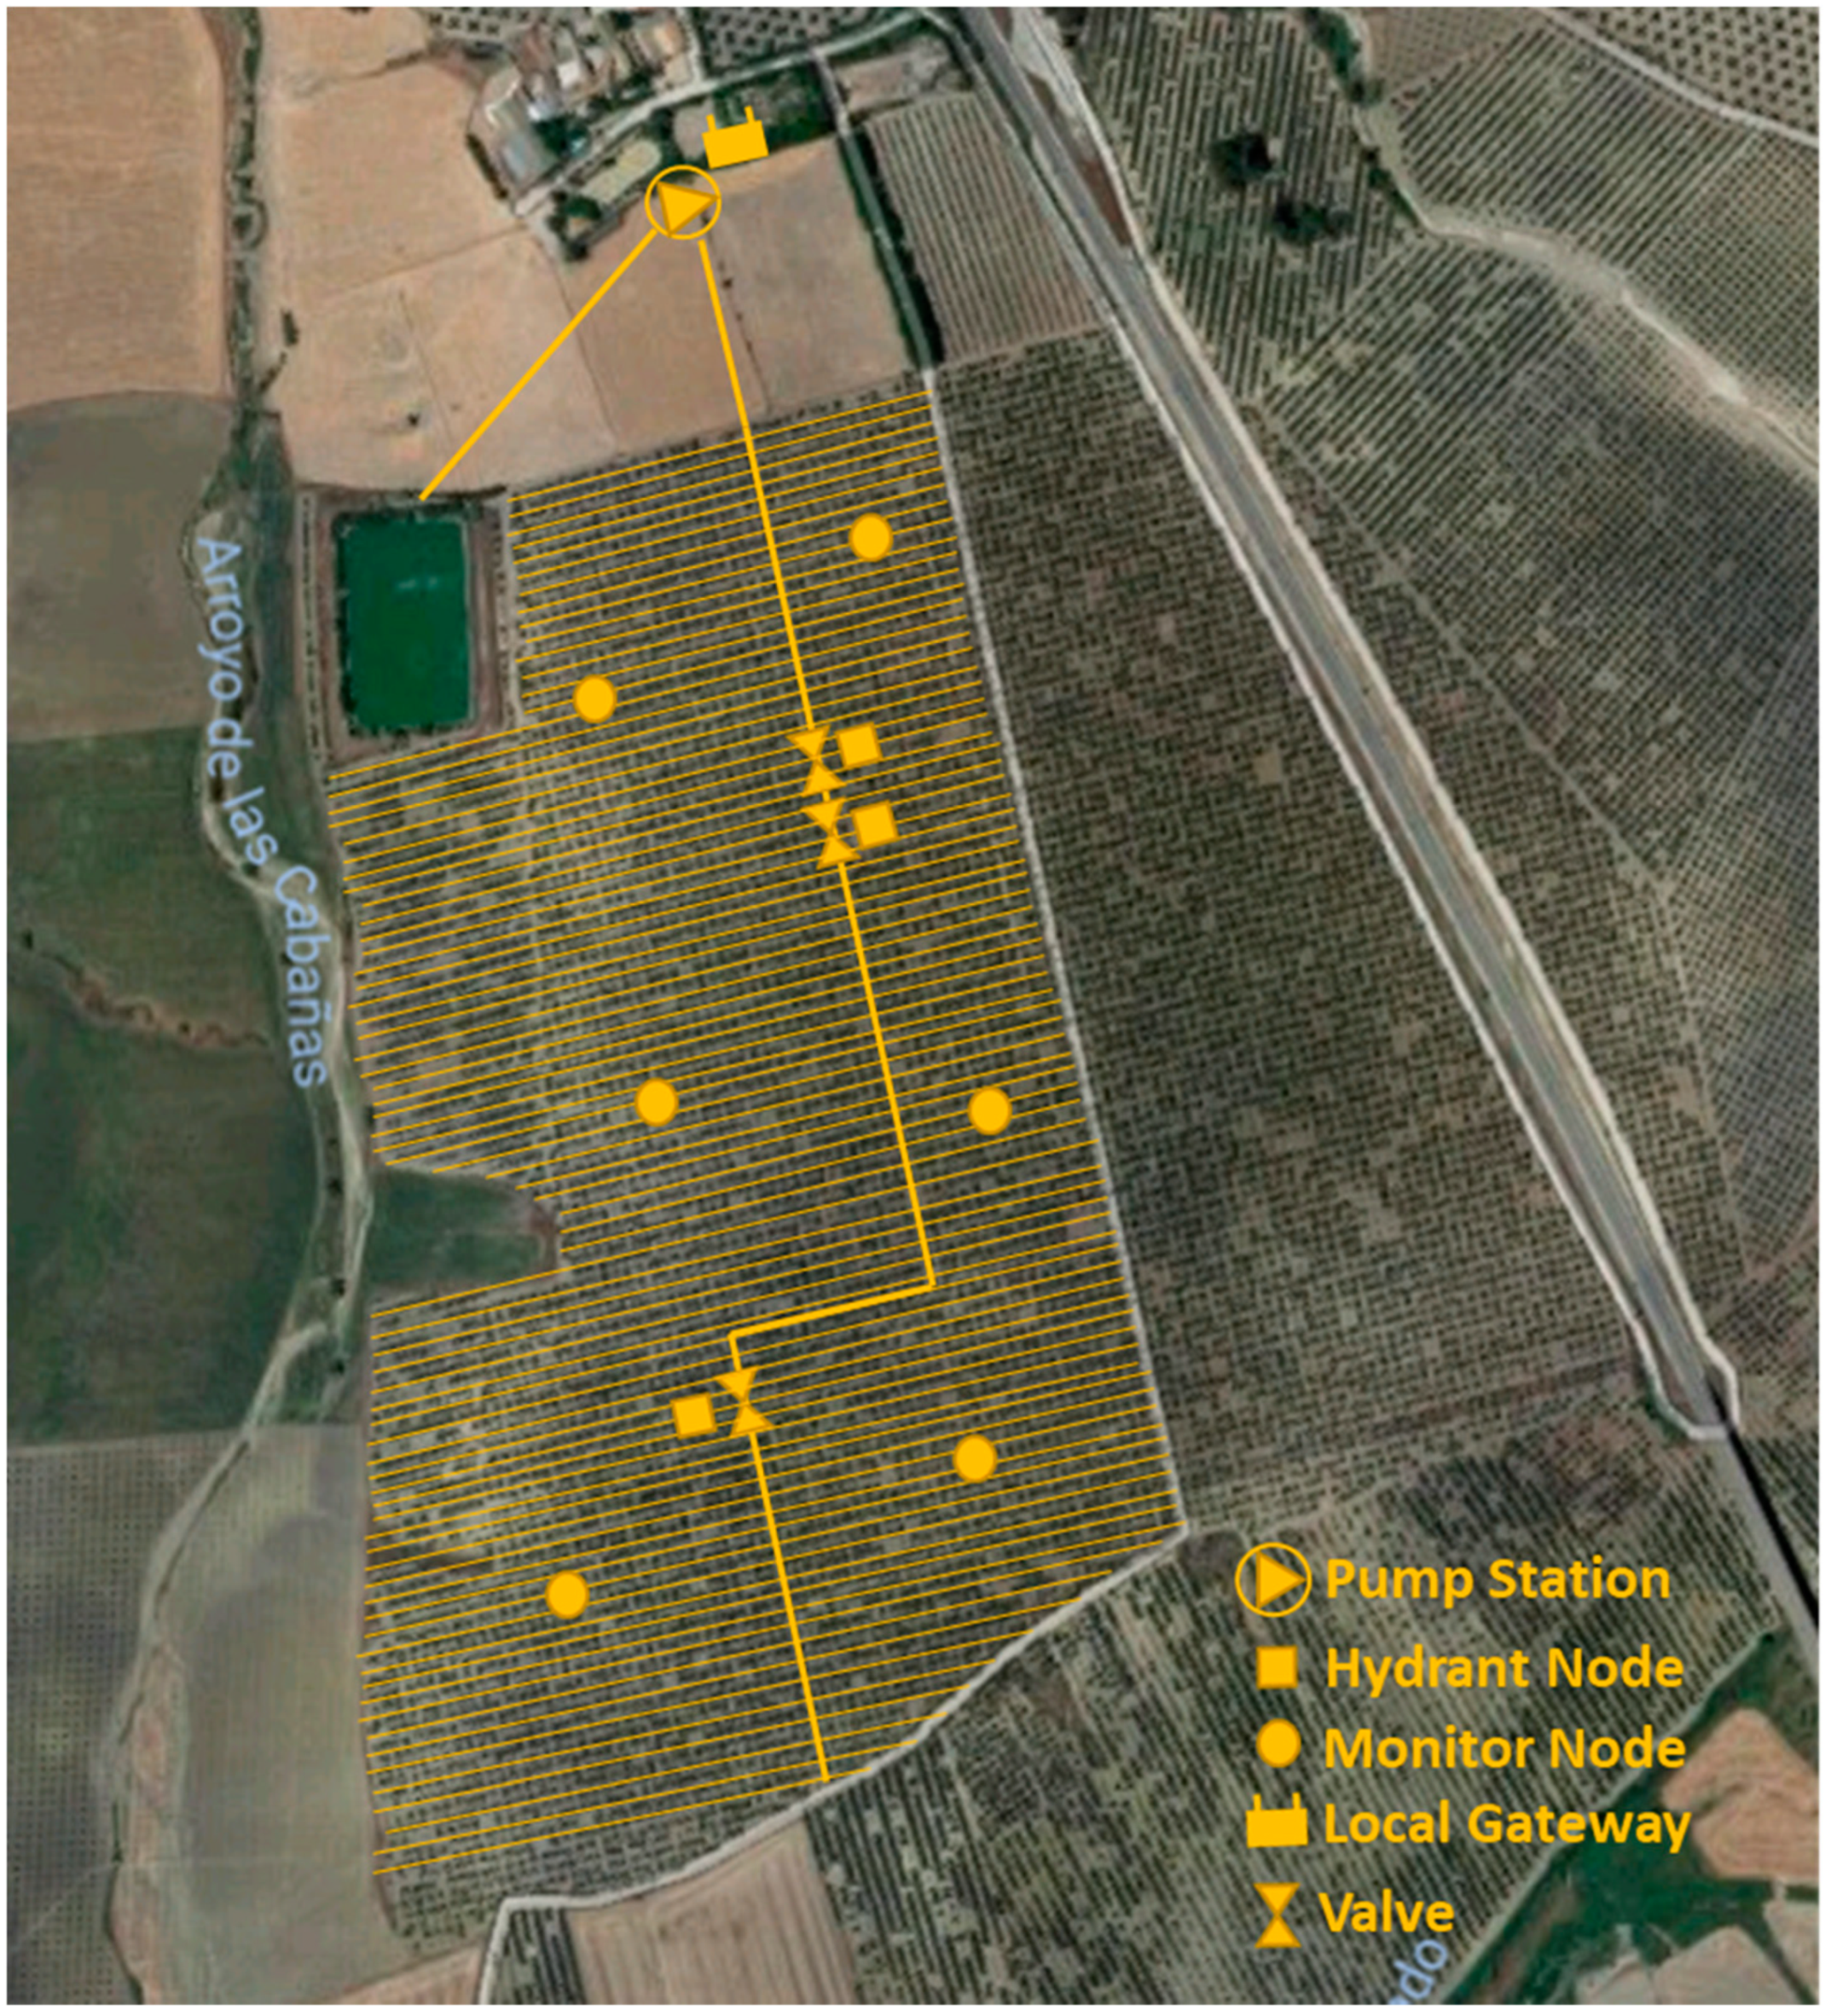
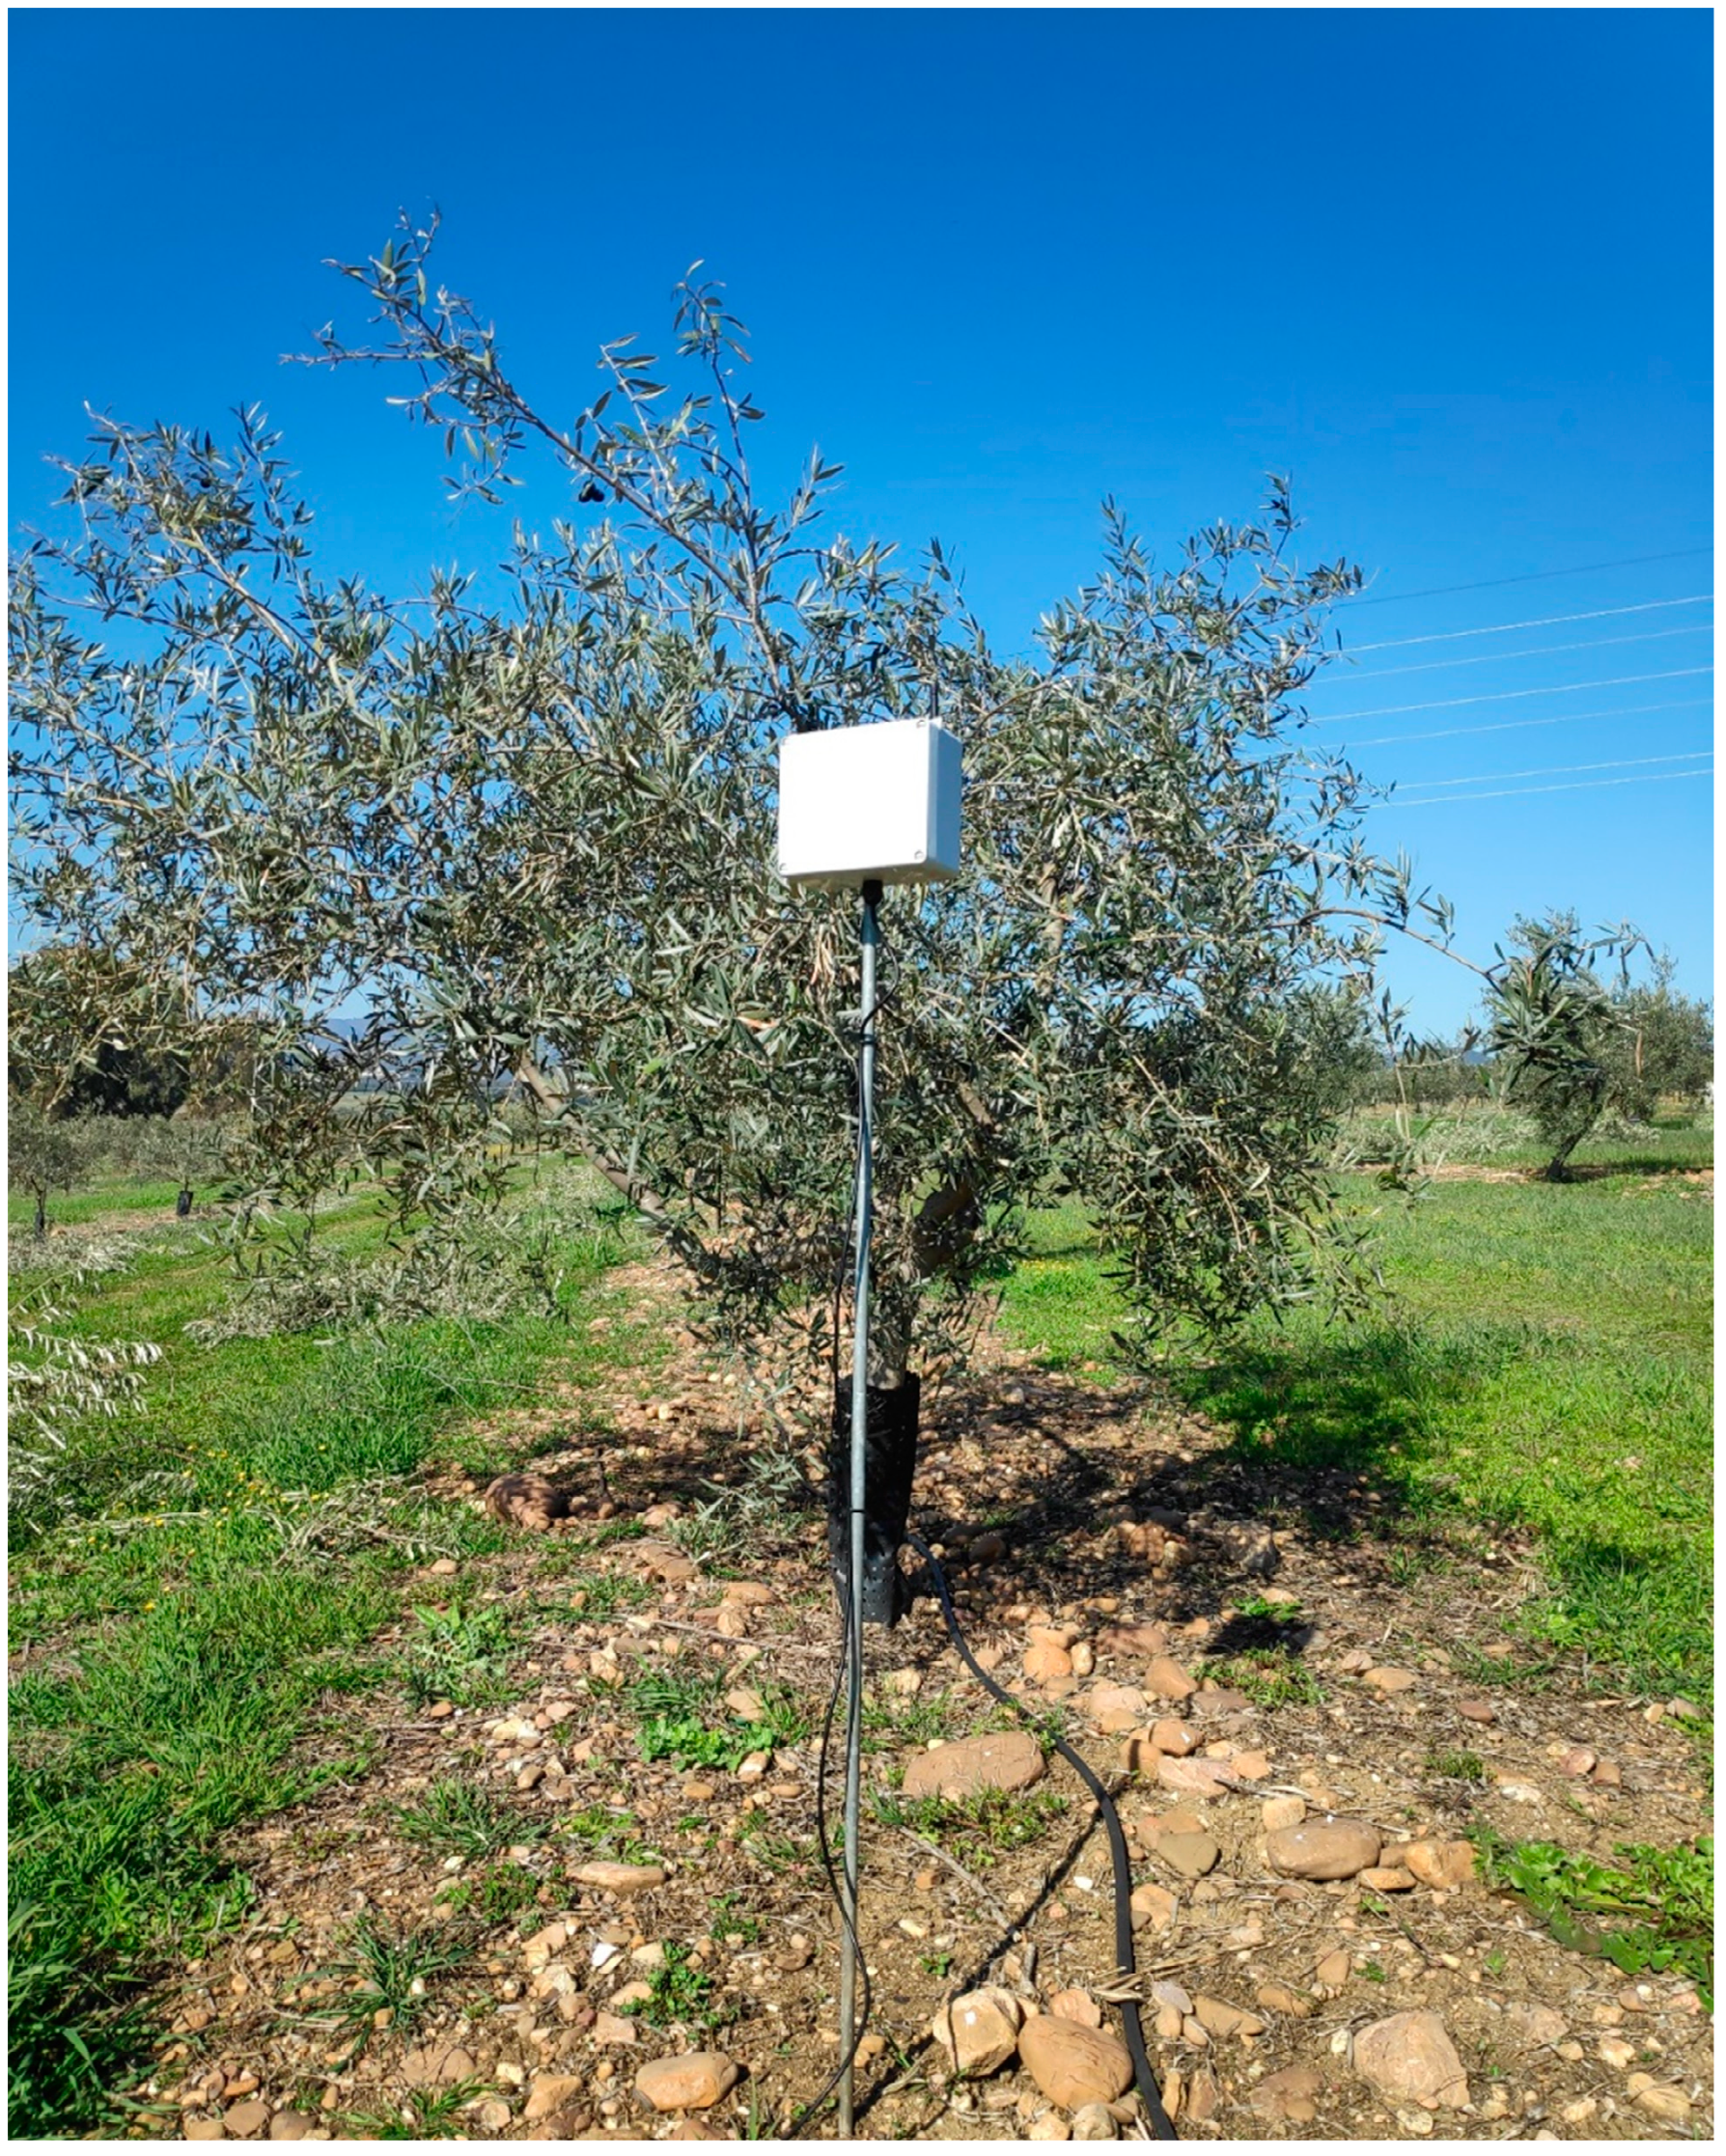
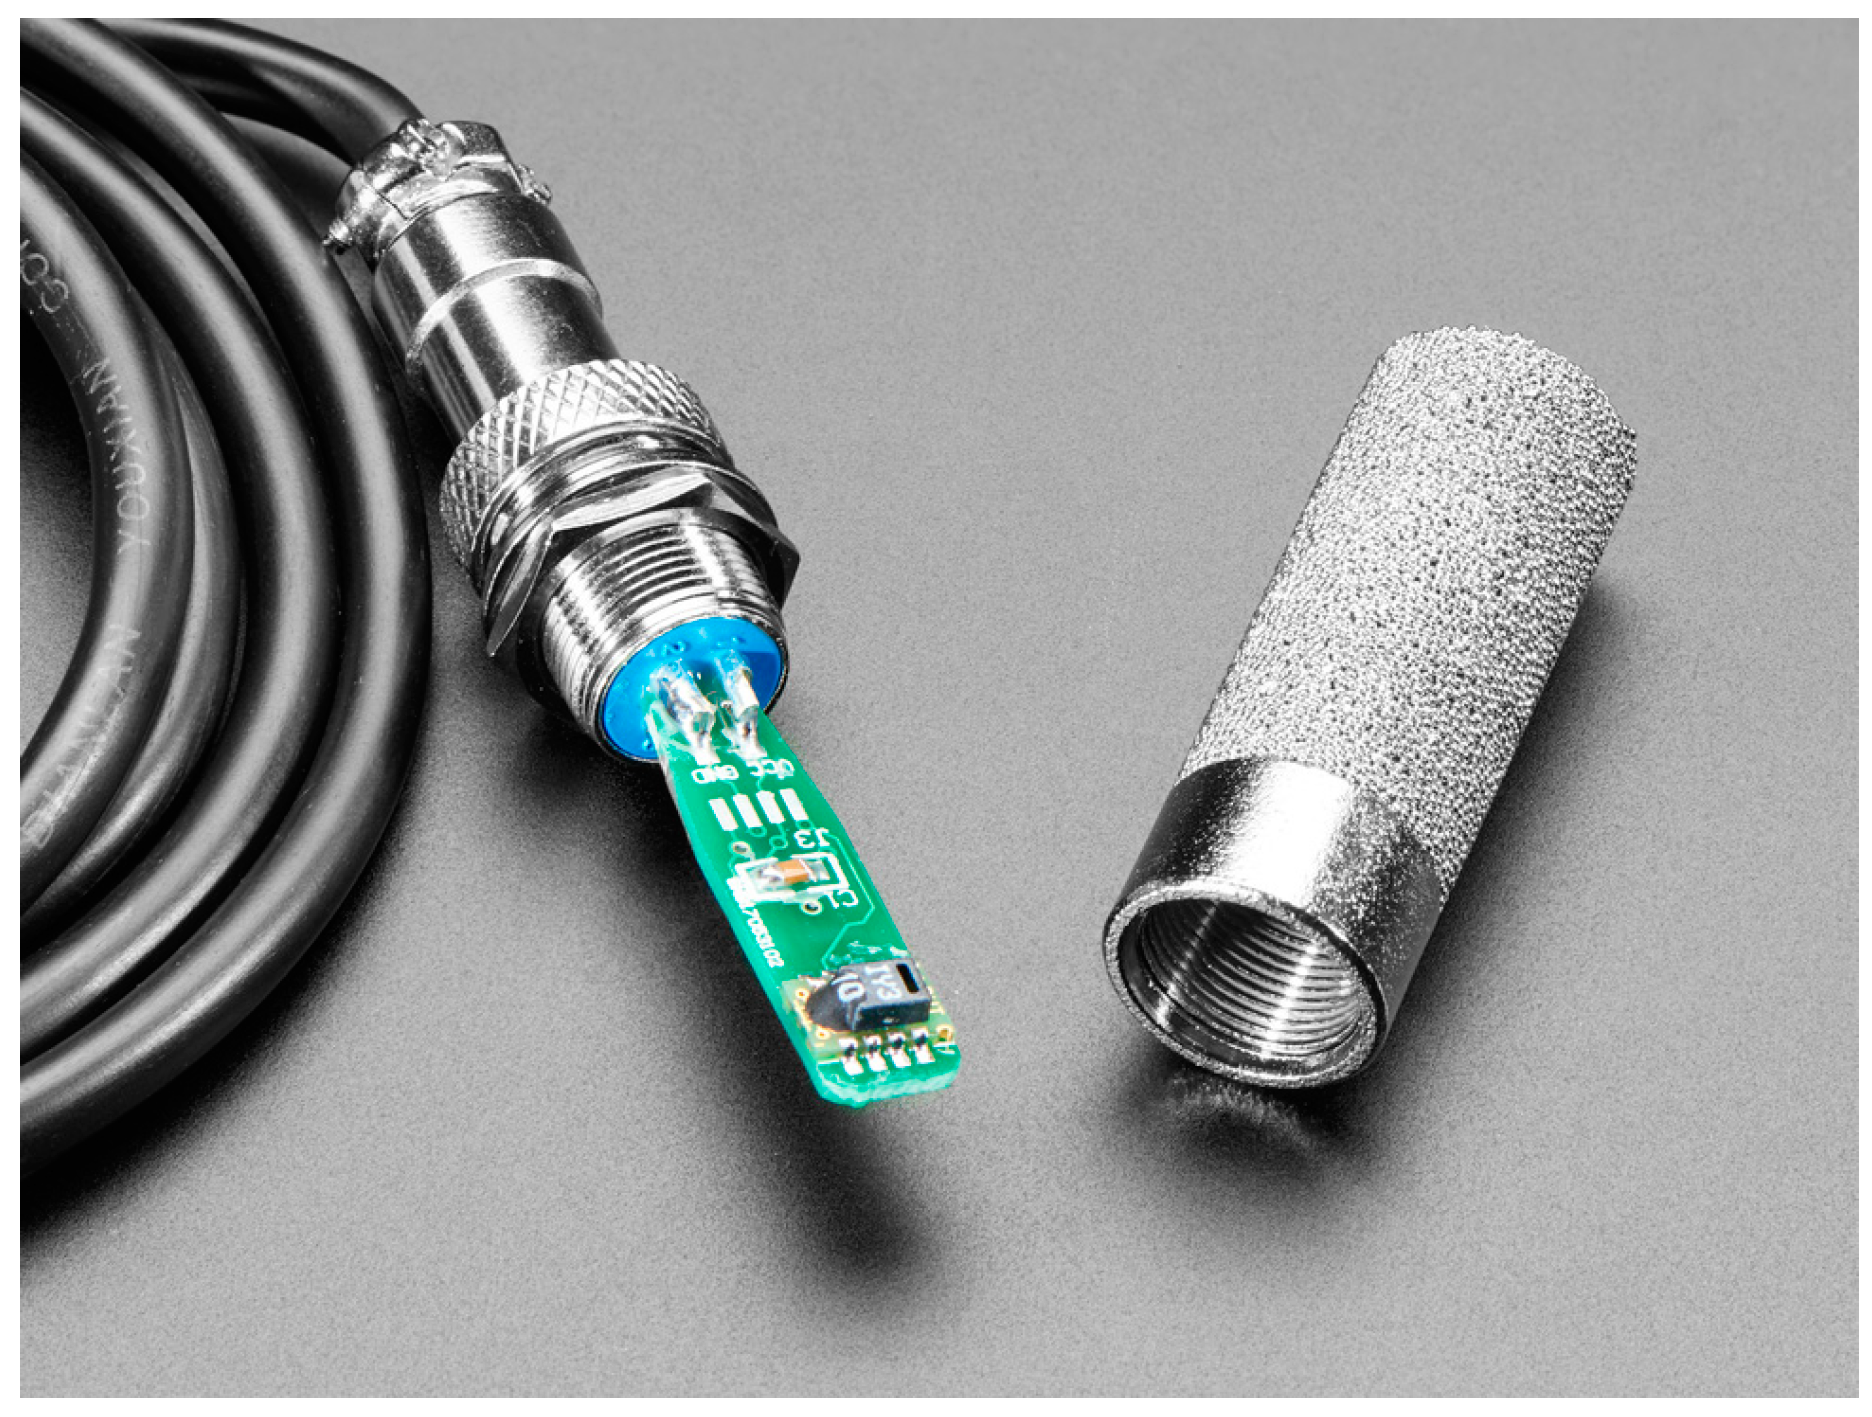
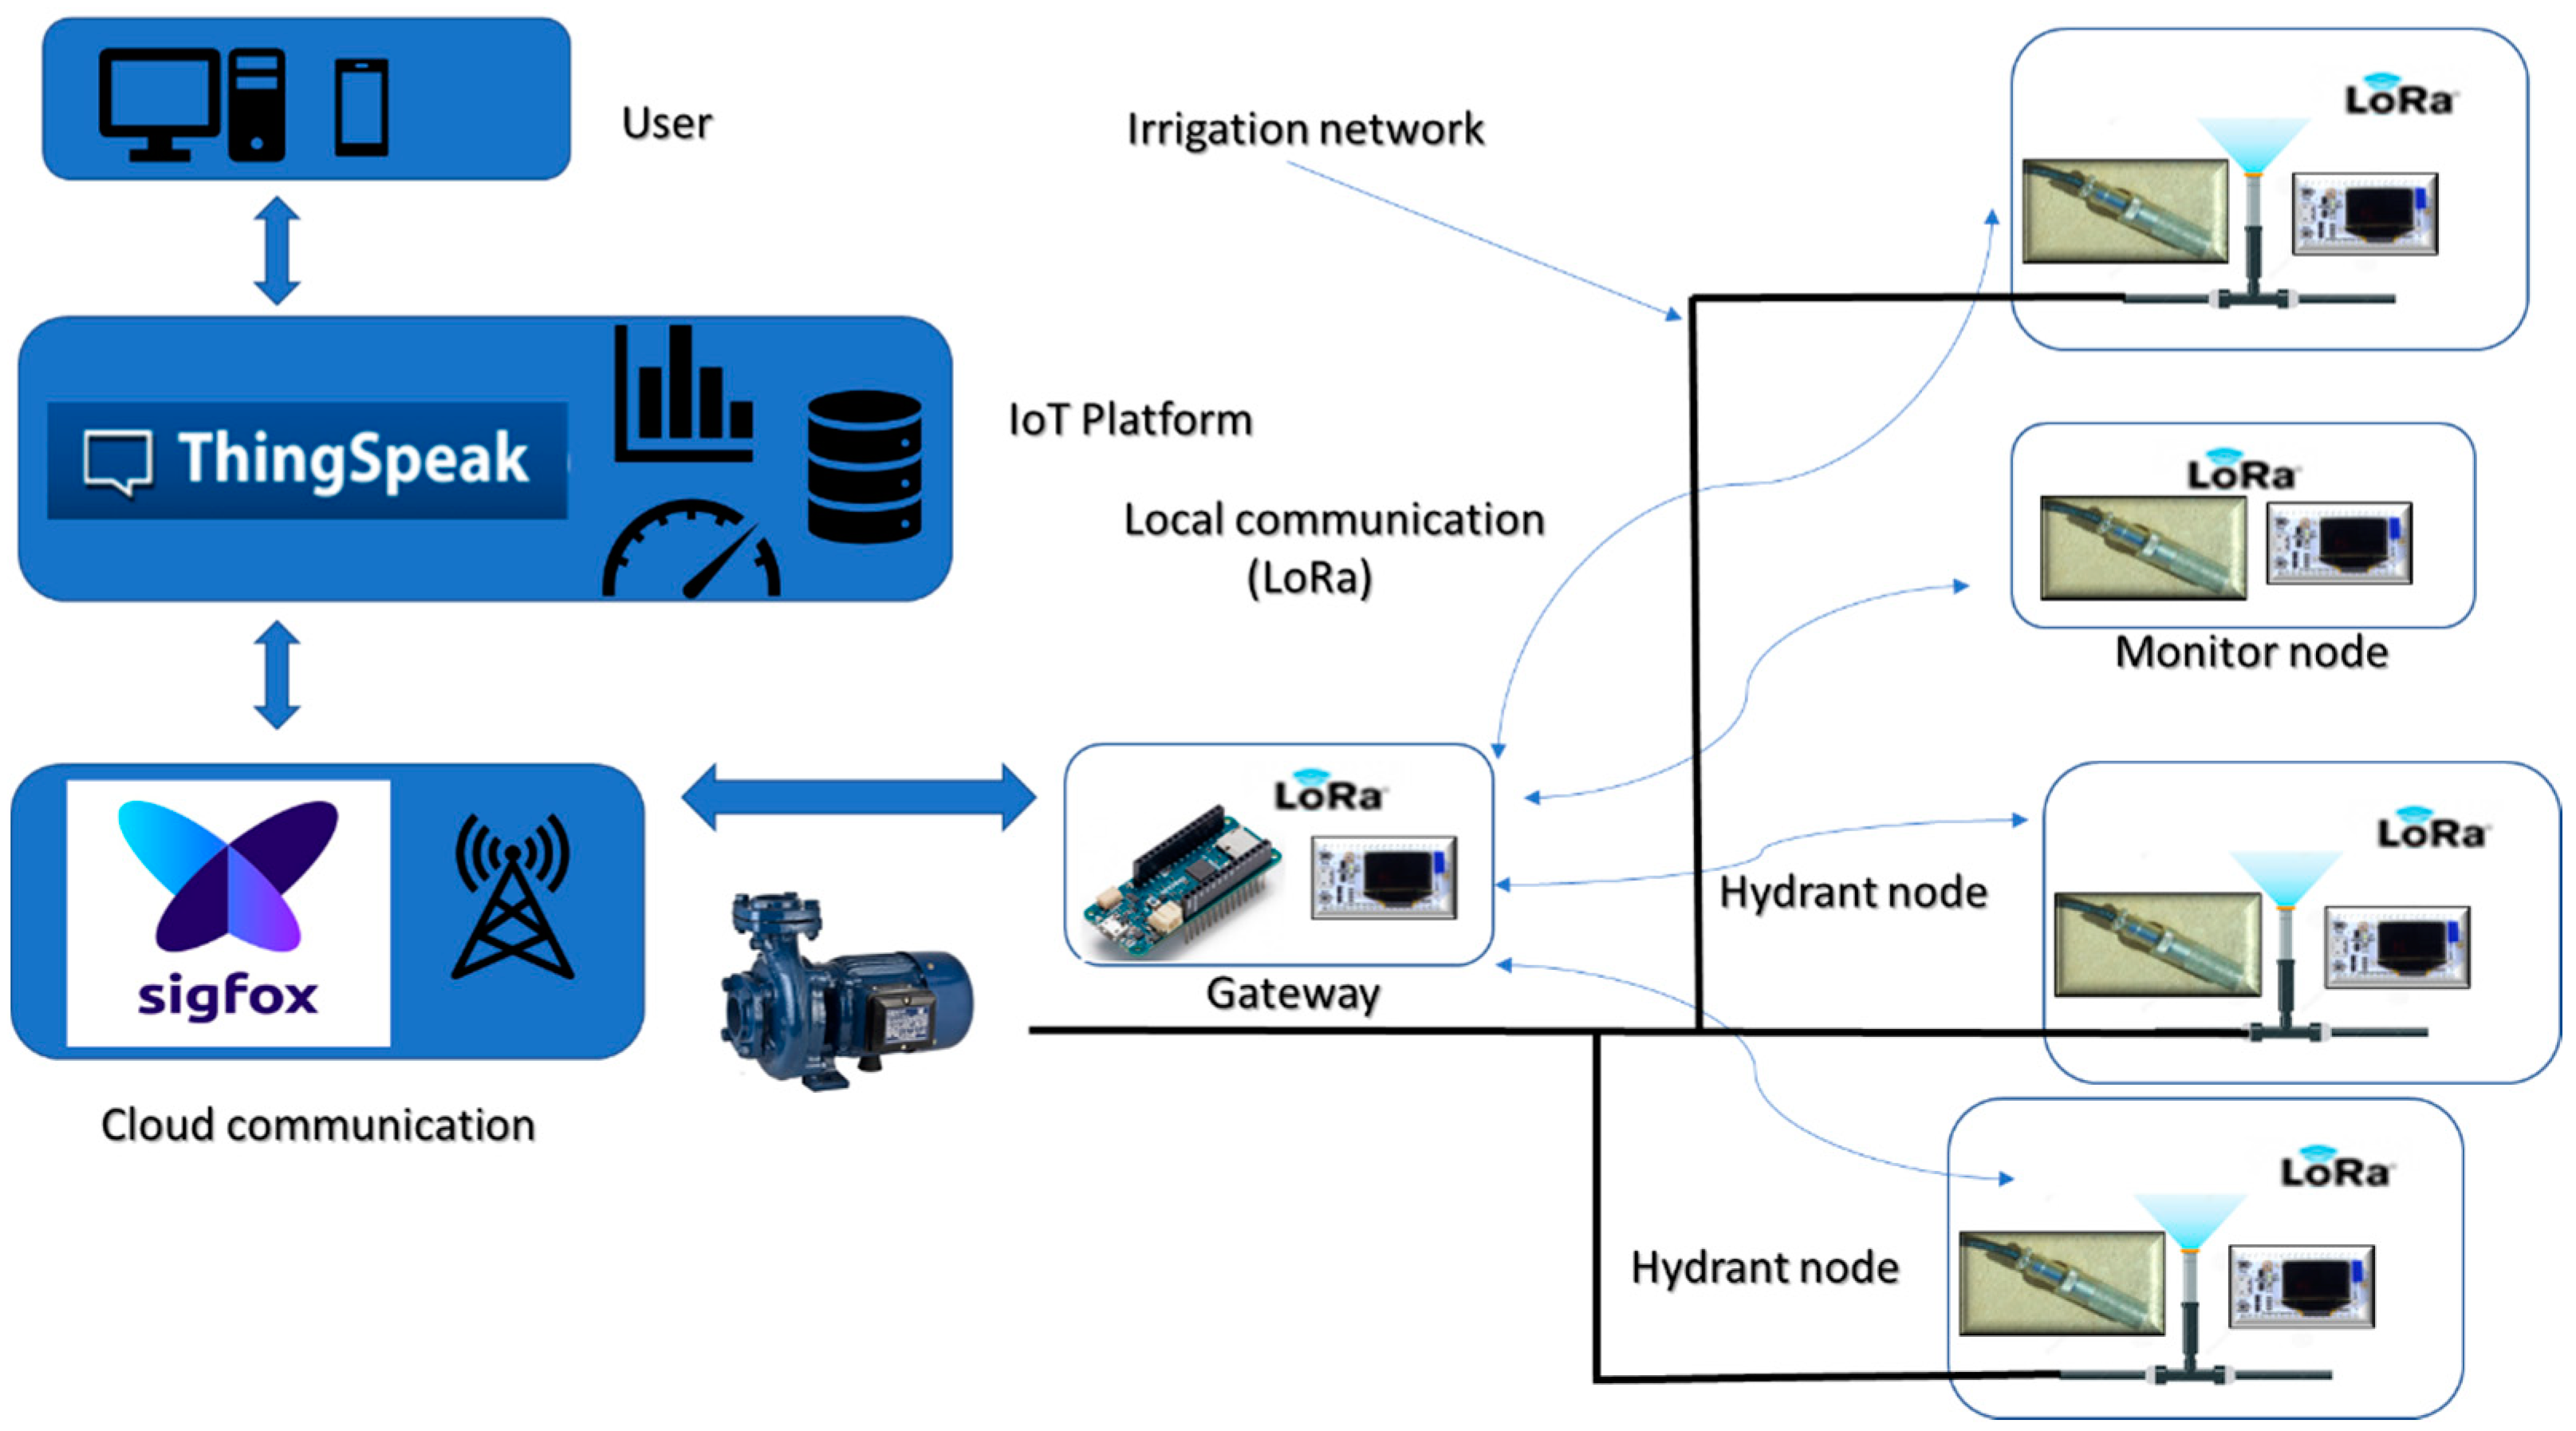
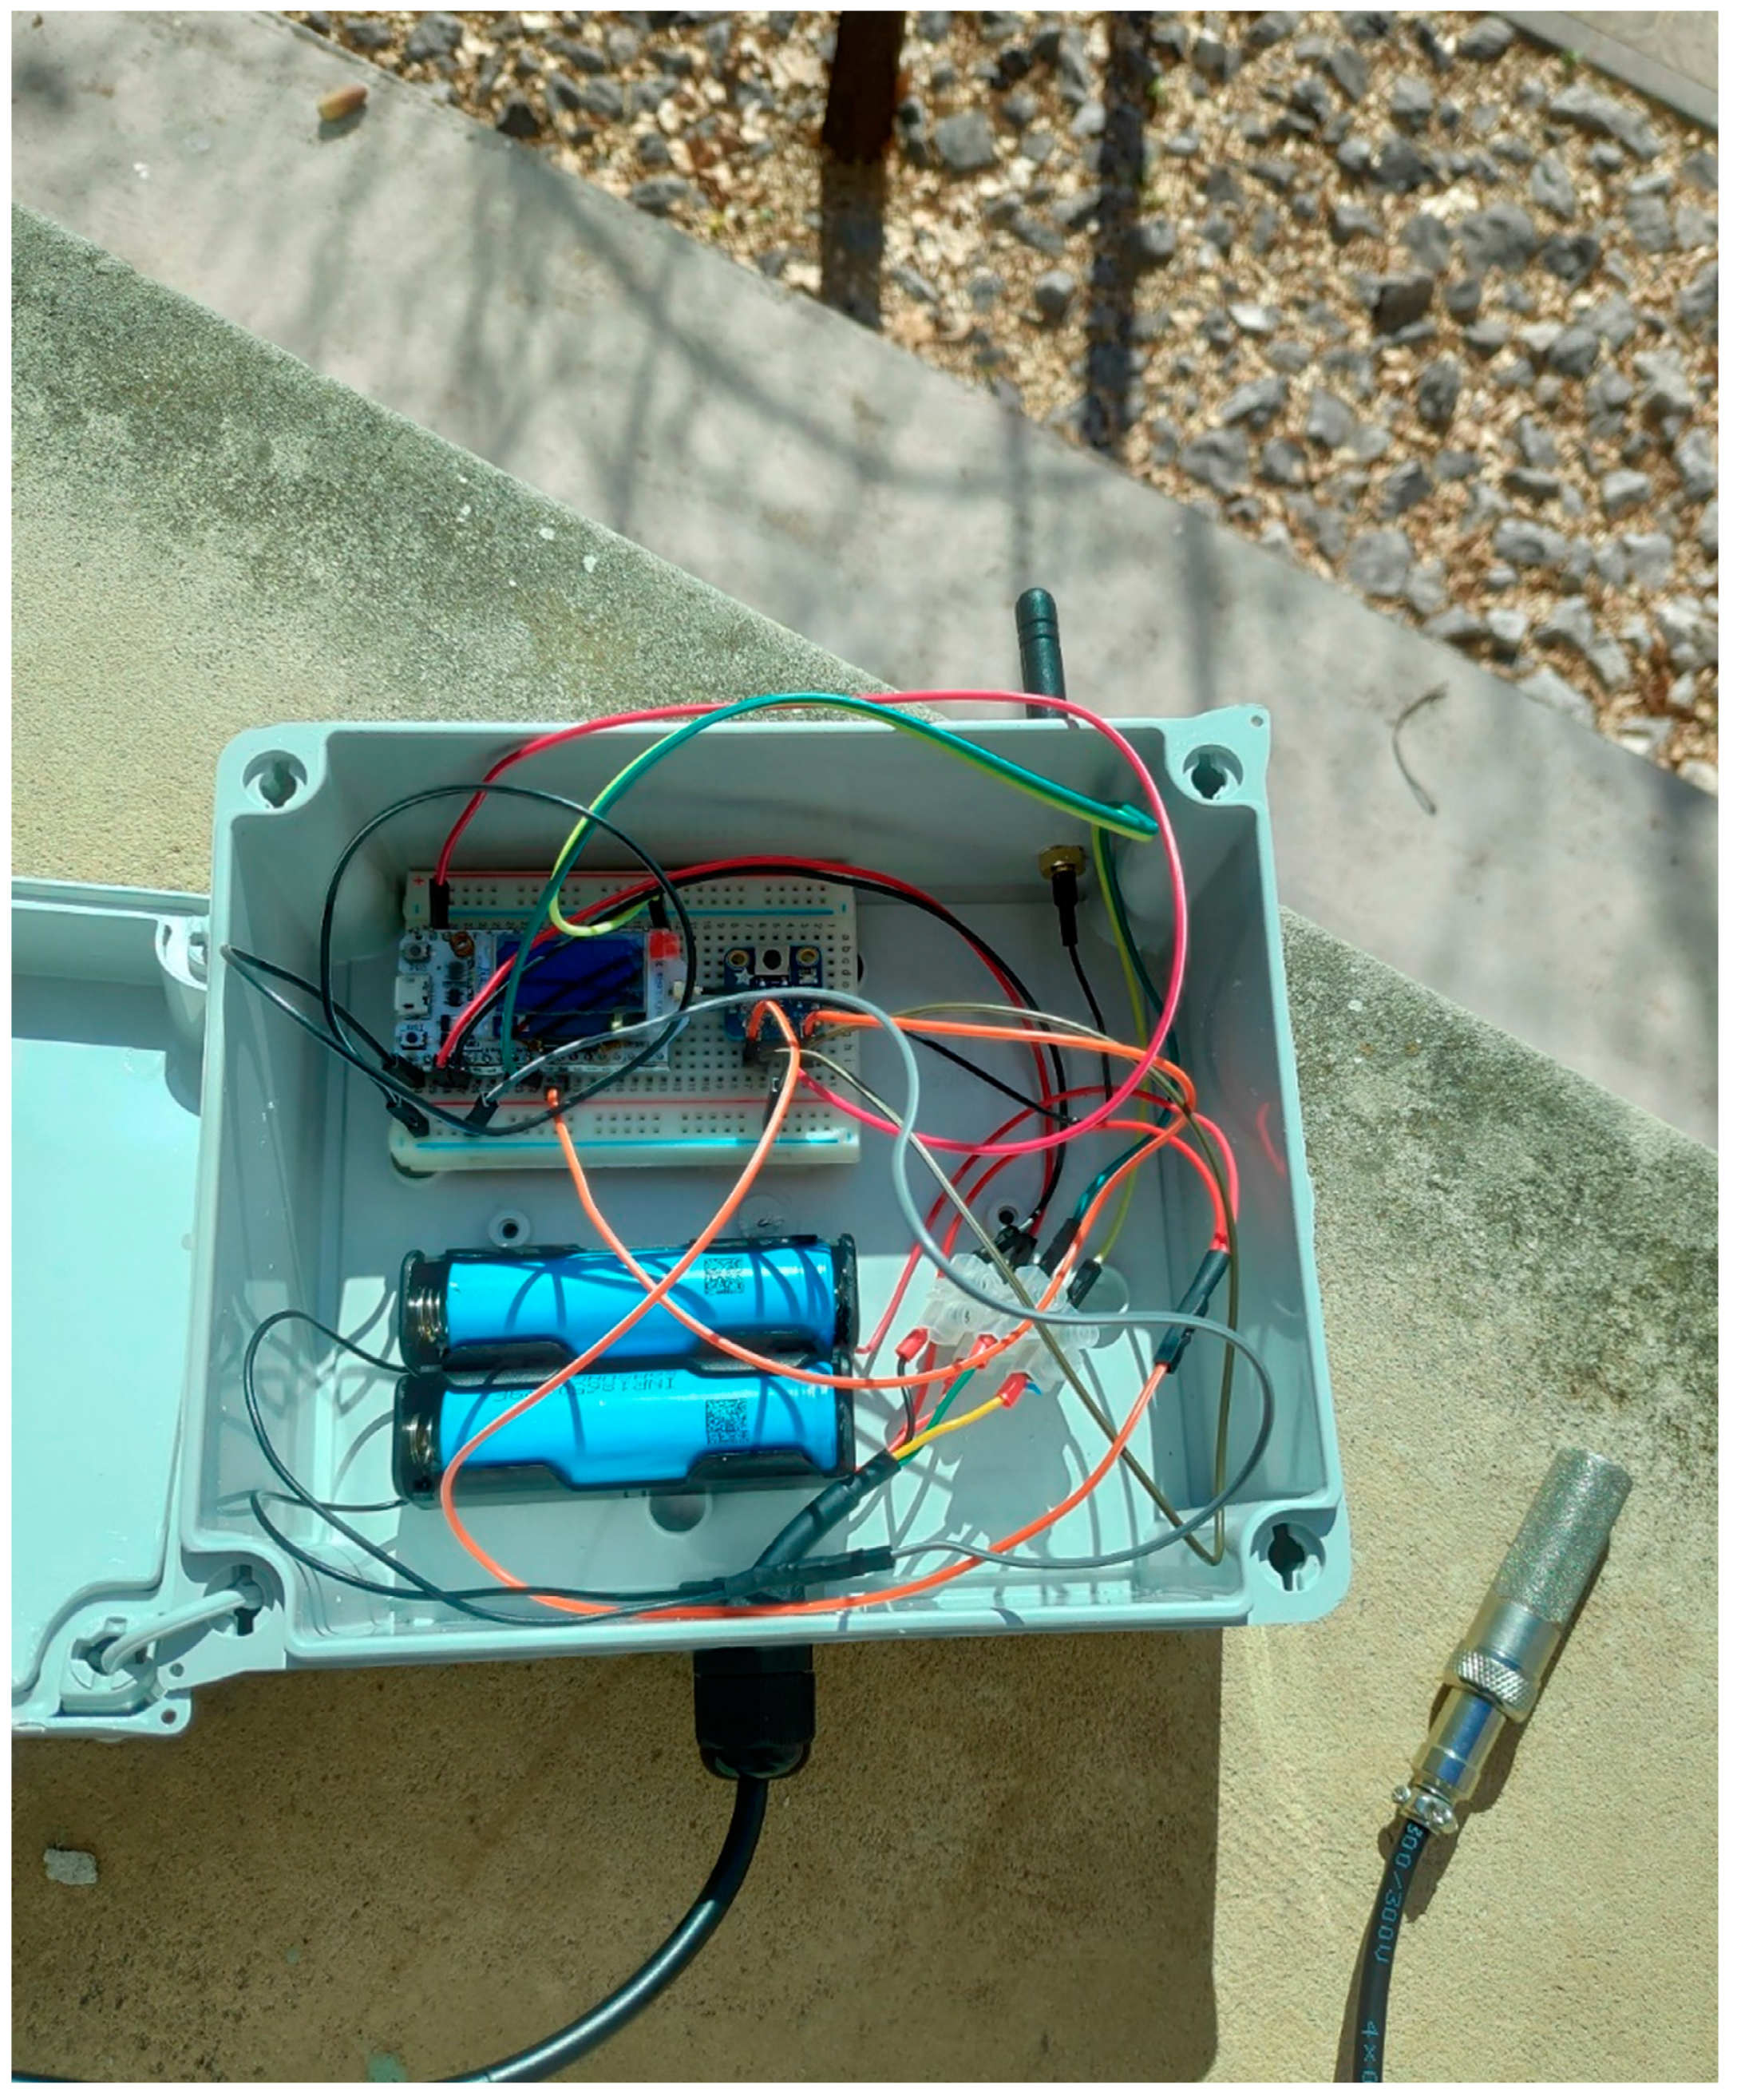
This paper presents a new system for monitoring and acting on interesting variables in irrigation management. Economic competitiveness, standardization, and the use of flexible platforms are the key considerations for this design, which is based on the use of WSN and LPWAN communications, as well as on IoT platform integration. The solution presented here uses LoRa communications at the local level, and SIGFOX communications to access IoT platforms. At the hardware level, free hardware boards compatible with Arduino IDE have been used.
The structure of the article is as follows.
Section 2 describes the choice of the control board, the communication system and the monitoring platform, as well as their development and programming.
Section 3 details the implementation of the proposed system and the results obtained. Finally,
Section 4 presents the conclusions of this work and the further lines of research to be developed.

 ,
, 


