Evaluation of Metal Oxide Surface Catalysts for the Electrochemical Activation of Amino Acids


Department of Chemical Engineering, University of New Hampshire, Durham, NH 03824, USA
*
Author to whom correspondence should be addressed.
Sensors 2018, 18(9), 3144; https://doi.org/10.3390/s18093144
Submission received: 9 August 2018
/
Revised: 9 September 2018
/
Accepted: 14 September 2018
/
Published: 18 September 2018
(This article belongs to the Section Chemical Sensors)
Abstract
:Electrochemical detection of amino acids is important due to their correlation with certain diseases; however, most amino acids require a catalyst to electrochemically activate. One common catalyst for electrochemical detection of amino acids are metal oxides. Metal oxide nanoparticles were electrodeposited onto glassy carbon and platinum working electrodes. Cyclic voltammetry (CV) experiments in a flow cell were performed to evaluate the sensors’ ability to detect arginine, alanine, serine, and valine at micromolar and nanomolar concentrations as high as 4 mM. Solutions were prepared in phosphate buffer saline (PBS) and then 100 mM NaOH. Specifically, NiO surfaces were responsive to amino acids but variable, especially when exposed to arginine. Polarization resistance experiments and scanning electron microscopy (SEM) and energy-dispersive X-ray spectroscopy (EDS) data indicated that arginine accelerated the corrosion of the NiO catalyst through the formation of a Schiff base complex.
1. Introduction
Changes in baseline amino acid concentrations are correlated with various diseases such as obesity [1] or major depressive disorder [2,3,4]. Specifically, alanine, serine, arginine, and valine, among others, have been shown to be disrupted in major depressive disorder patients compared to healthy controls [2,3,4]. Monitoring these changes can be done by high performance liquid chromatography–mass spectrometry (HPLC-MS) or nuclear magnetic resonance (NMR) spectroscopy [2,3,4,5,6,7]; limitations of these spectroscopic techniques include low throughput with complicated and/or tedious analysis. These disadvantages are contrasted by electrochemistry; electrochemical detection is highly rapid and sensitive, requiring little sample, and can evaluate the reduction or oxidation of an analyte through the current response [8].
Many amino acids lack electrochemically active functional groups. Derivatization is commonly used [9,10], but stability issues are introduced with amino acid derivatives [11]. Furthermore, derivatization can be costly because the product needs to be extracted into organic solvent before analysis [12,13]. A robust sensor would not require extensive sample preparation and analysis would ideally be performed under aqueous conditions. Alternatively, a surface catalyst could be used to electrochemically activate amino acids [14]. Transition metal nanoparticle surface modifications have demonstrated electrocatalytic activity with various amino acids. Amino acids exhibited electro-catalysis with NiO [15,16], CuO [17], and Fe3O4-graphene oxide nanocomposite [18] surface catalysts.
The mechanism of electrooxidation is not well understood. According to the leading theory, the amino acid chelates to the transition metal nanoparticle to form a catalytic intermediate (Figure 1A) [17]. Chelation only occurs under basic conditions, when the carboxylic acid is negatively charged and the amine has a lone pair to allow complexation (Figure 1A) [19,20]. The chelation intermediate complex allows the metal oxide to catalytically react with the amino acid, presumably through an inner sphere electron transfer, creating an electrochemical measurement. Alternatively, for guanidine derivatives such as arginine, a Schiff base complex can form between the double-bonded nitrogen and metal ion (Figure 1B) [21,22,23]. Since arginine and other structural analogs of alkyl-guanidines are able to complex to various transition metals like Pt(II), the authors propose that a Schiff base complex is formed with the guanidine functional group. If a Schiff base complex is formed, a reverse or variable current vs. concentration would be observed due to the increases of the solubility of the catalyst and the delamination or removal of metal nanoparticles from the electrode surface (Figure 1B).
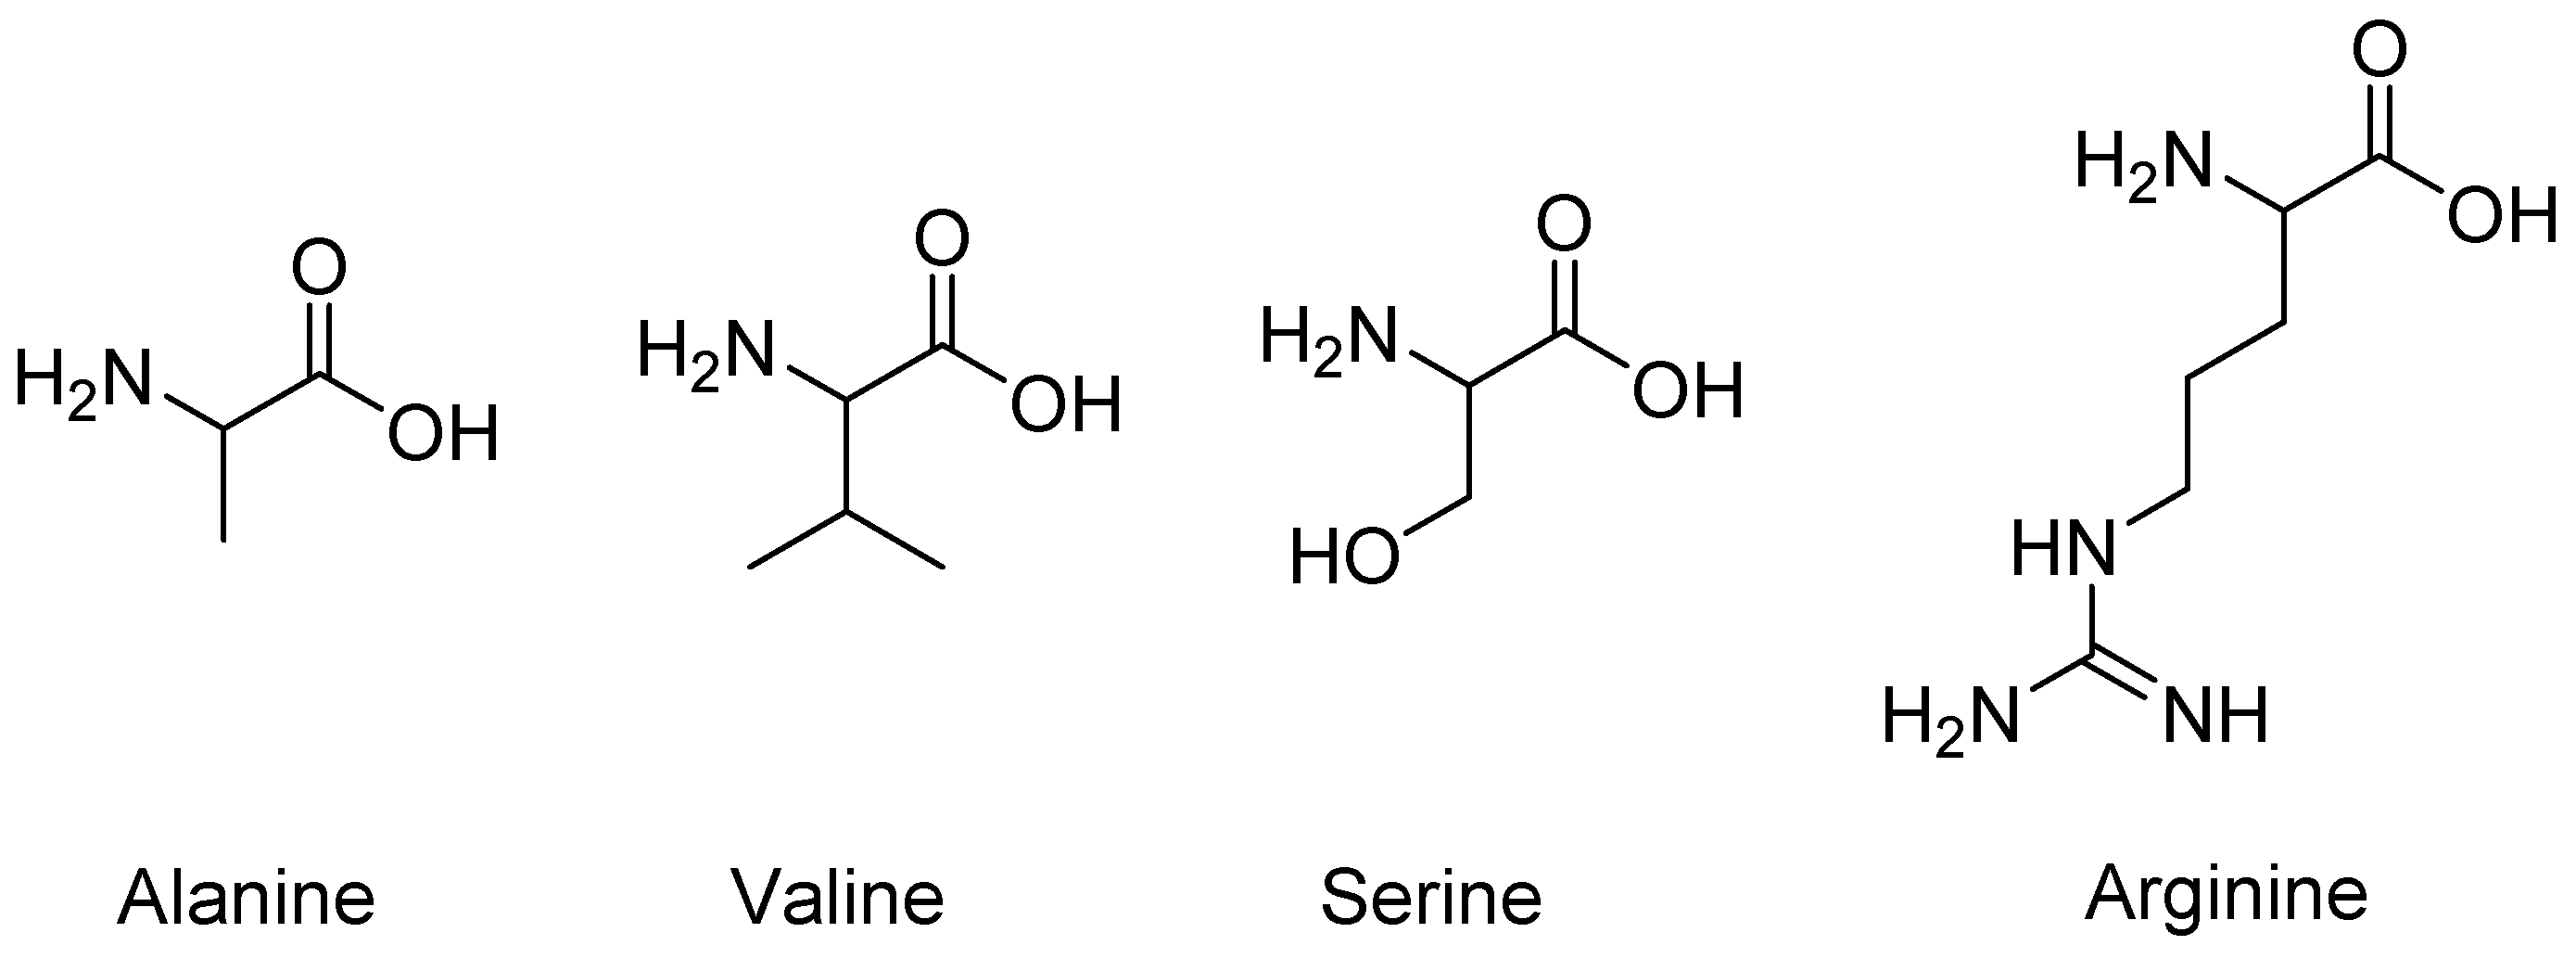
Reported in this study are metal oxide surfaces on glassy carbon and platinum working electrodes and their evaluation as sensors for the detection of alanine, arginine, serine, and valine (Figure 2). Alanine, valine, serine, and arginine are chosen because of their range of pKa values, differences in relative charge and branch groups, and relevancy in various diseases as potential biomarkers [24,25]. Where metal oxides are commonly tested with alanine or serine, they are rarely tested with arginine. The authors used cyclic voltammetry (CV) in a flow cell to electrochemically oxidize the amino acid analytes in 100 mM NaOH solution. They also used corrosion tests and scanning electron microscopy (SEM) and energy-dispersive X-ray spectroscopy (EDS) to evaluate the nickel oxide surfaces to look for any changes before and after amino acid exposure.
2. Materials and Methods
2.1. Materials and Apparatus
Cyclic voltammetry measurements were recorded on a 600+ Reference Potentiostat (Gamry Instruments Inc., Warminster, PA, USA). Samples were injected into a platinum counterelectrode flow cell with Ag/AgCl reference electrode using a syringe pump (flow rate of 15 μL/h). A dual 3 mm glassy carbon and dual 3 mm platinum working electrode (BASi, West Lafayette, IN, USA) were used in the electrochemistry experiments.
All chemicals were purchased from Fisher Scientific (Bridgewater, NJ, USA), as follows: 2 mM Fe(NO)3(aq) and 2 mM Ni(NO)3(aq) solutions were prepared in acetate buffer (pH ~4); 2 mM Cu(SO4)2(aq) solution was prepared in 100 mM Na2SO4(aq); and 4000 μM, 2000 μM, 1000 μM, 400 μM, 200 μM, 100 μM, 75 μM, 50 μM, and 25 μM solutions of alanine, arginine, serine, and valine were prepared by serial dilution in 100 mM sodium hydroxide as well as 10 mM phosphate buffer saline (PBS) solution (pH ~7.4).
A Tescan Lyra3 GMU FIB SEM (Kohoutovice, Czech Republic) was used to obtain the SEM and EDS measurements. A default of a 22 μm view field, at 25.2 k× magnification, and either a 6.0 or 15.0 kV beam was used, indicated on the SEM figures. For EDS measurements, only a 15.0 kV beam was used.
2.2. Attachment Method
The modification procedure followed previously published attachment methods [15,17]. A 2 mM metal ion solution in acidic buffer was syringe pumped through the flow cell at a rate of 15 mL/h. Cyclic voltammetry was performed by sweeping the potential sweep from 0 to −0.8 V at a rate of 100 mV/s for 40 cycles with auto max current. Sodium hydroxide (100 mM) was syringe pumped through the flow cell at a rate of 15 mL/h.
2.3. Cyclic Voltammetry and Polarization Resistance Measurements
Cyclic voltammetry was performed by sweeping the potential from 0 to +0.6 V at a rate of 100 mV/s for 40 cycles. Polarization resistance was performed by flowing 100 µM amino acid in 100 mM NaOH at a rate of 1 mL/h over a NiO modified amorphous carbon electrode.
3. Results and Discussion
Bare platinum electrodes were tested with the four amino acids which resulted in no electrochemical activity (Figure S1). The working electrodes were modified with a metallic surface by applying a negative potential sweep from 0 to −0.8 V in a metal ion salt solution (Figure S2). A strong cathodic current was measured, which was indicative of electrodeposition of the elemental metal. Passivation to the metal oxide was done in 100 mM NaOH by sweeping the potential from 0 to +0.6 V (Figure S3). For the nickel surface, an oxidation current was measured at approximately +450 mV during passivation and a reduction event occurred at approximately +388 mV, which was indicative of a NiO/NiO(OH) formation.
At physiological pH, catalytic current was not measured presumably because amino acid analytes are unable to chelate at near neutral pH due to protonation of the amine group (Figures S4 and S5). Protonation of the amino group prohibits formation of the dative bond between the nitrogen and metal ion.
3.1. Amino Acid Detection at a CuO Surface
The copper oxide catalyst on the platinum working electrode did not catalyze the electrochemical oxidation of amino acids (Figure 3). Interestingly, the amino acids exhibited lower current measurement than the blank. Luo et al. suggested that amino acid complexation to the electrochemically reduced Cu2O surface leads to delamination of the metal oxide surface [26]. In order to obtain a more stable catalyst, the authors attempted to detect amino acids with Fe2O3 surfaces.
3.2. Amino Acid Detection at a Fe2O3 Surface
Reports have demonstrated that amino acids are able to chelate to iron oxide surfaces through vibrational spectroscopy [27,28,29,30]. The Fe2O3 surface on a glassy carbon electrode exhibited very low current measurements, below 0.6 μA (Figure 4). Furthermore, current measurements decreased in the presence of amino acid analytes. Delamination may occur during amino acid ligation to the iron oxide surface due to increased solubility. According to the Pourbaix diagram, Fe(OH)−4 could form on the surface, solubilizing surface iron groups and leading to a decrease in activity over time. The amino acid analytes might be facilitating the dissolution of the iron surface. Therefore, the authors tried NiO surface modifications, which are considered more stable according to the nickel Pourbaix diagram.
3.3. Amino Acid Detection at a NiO Surface
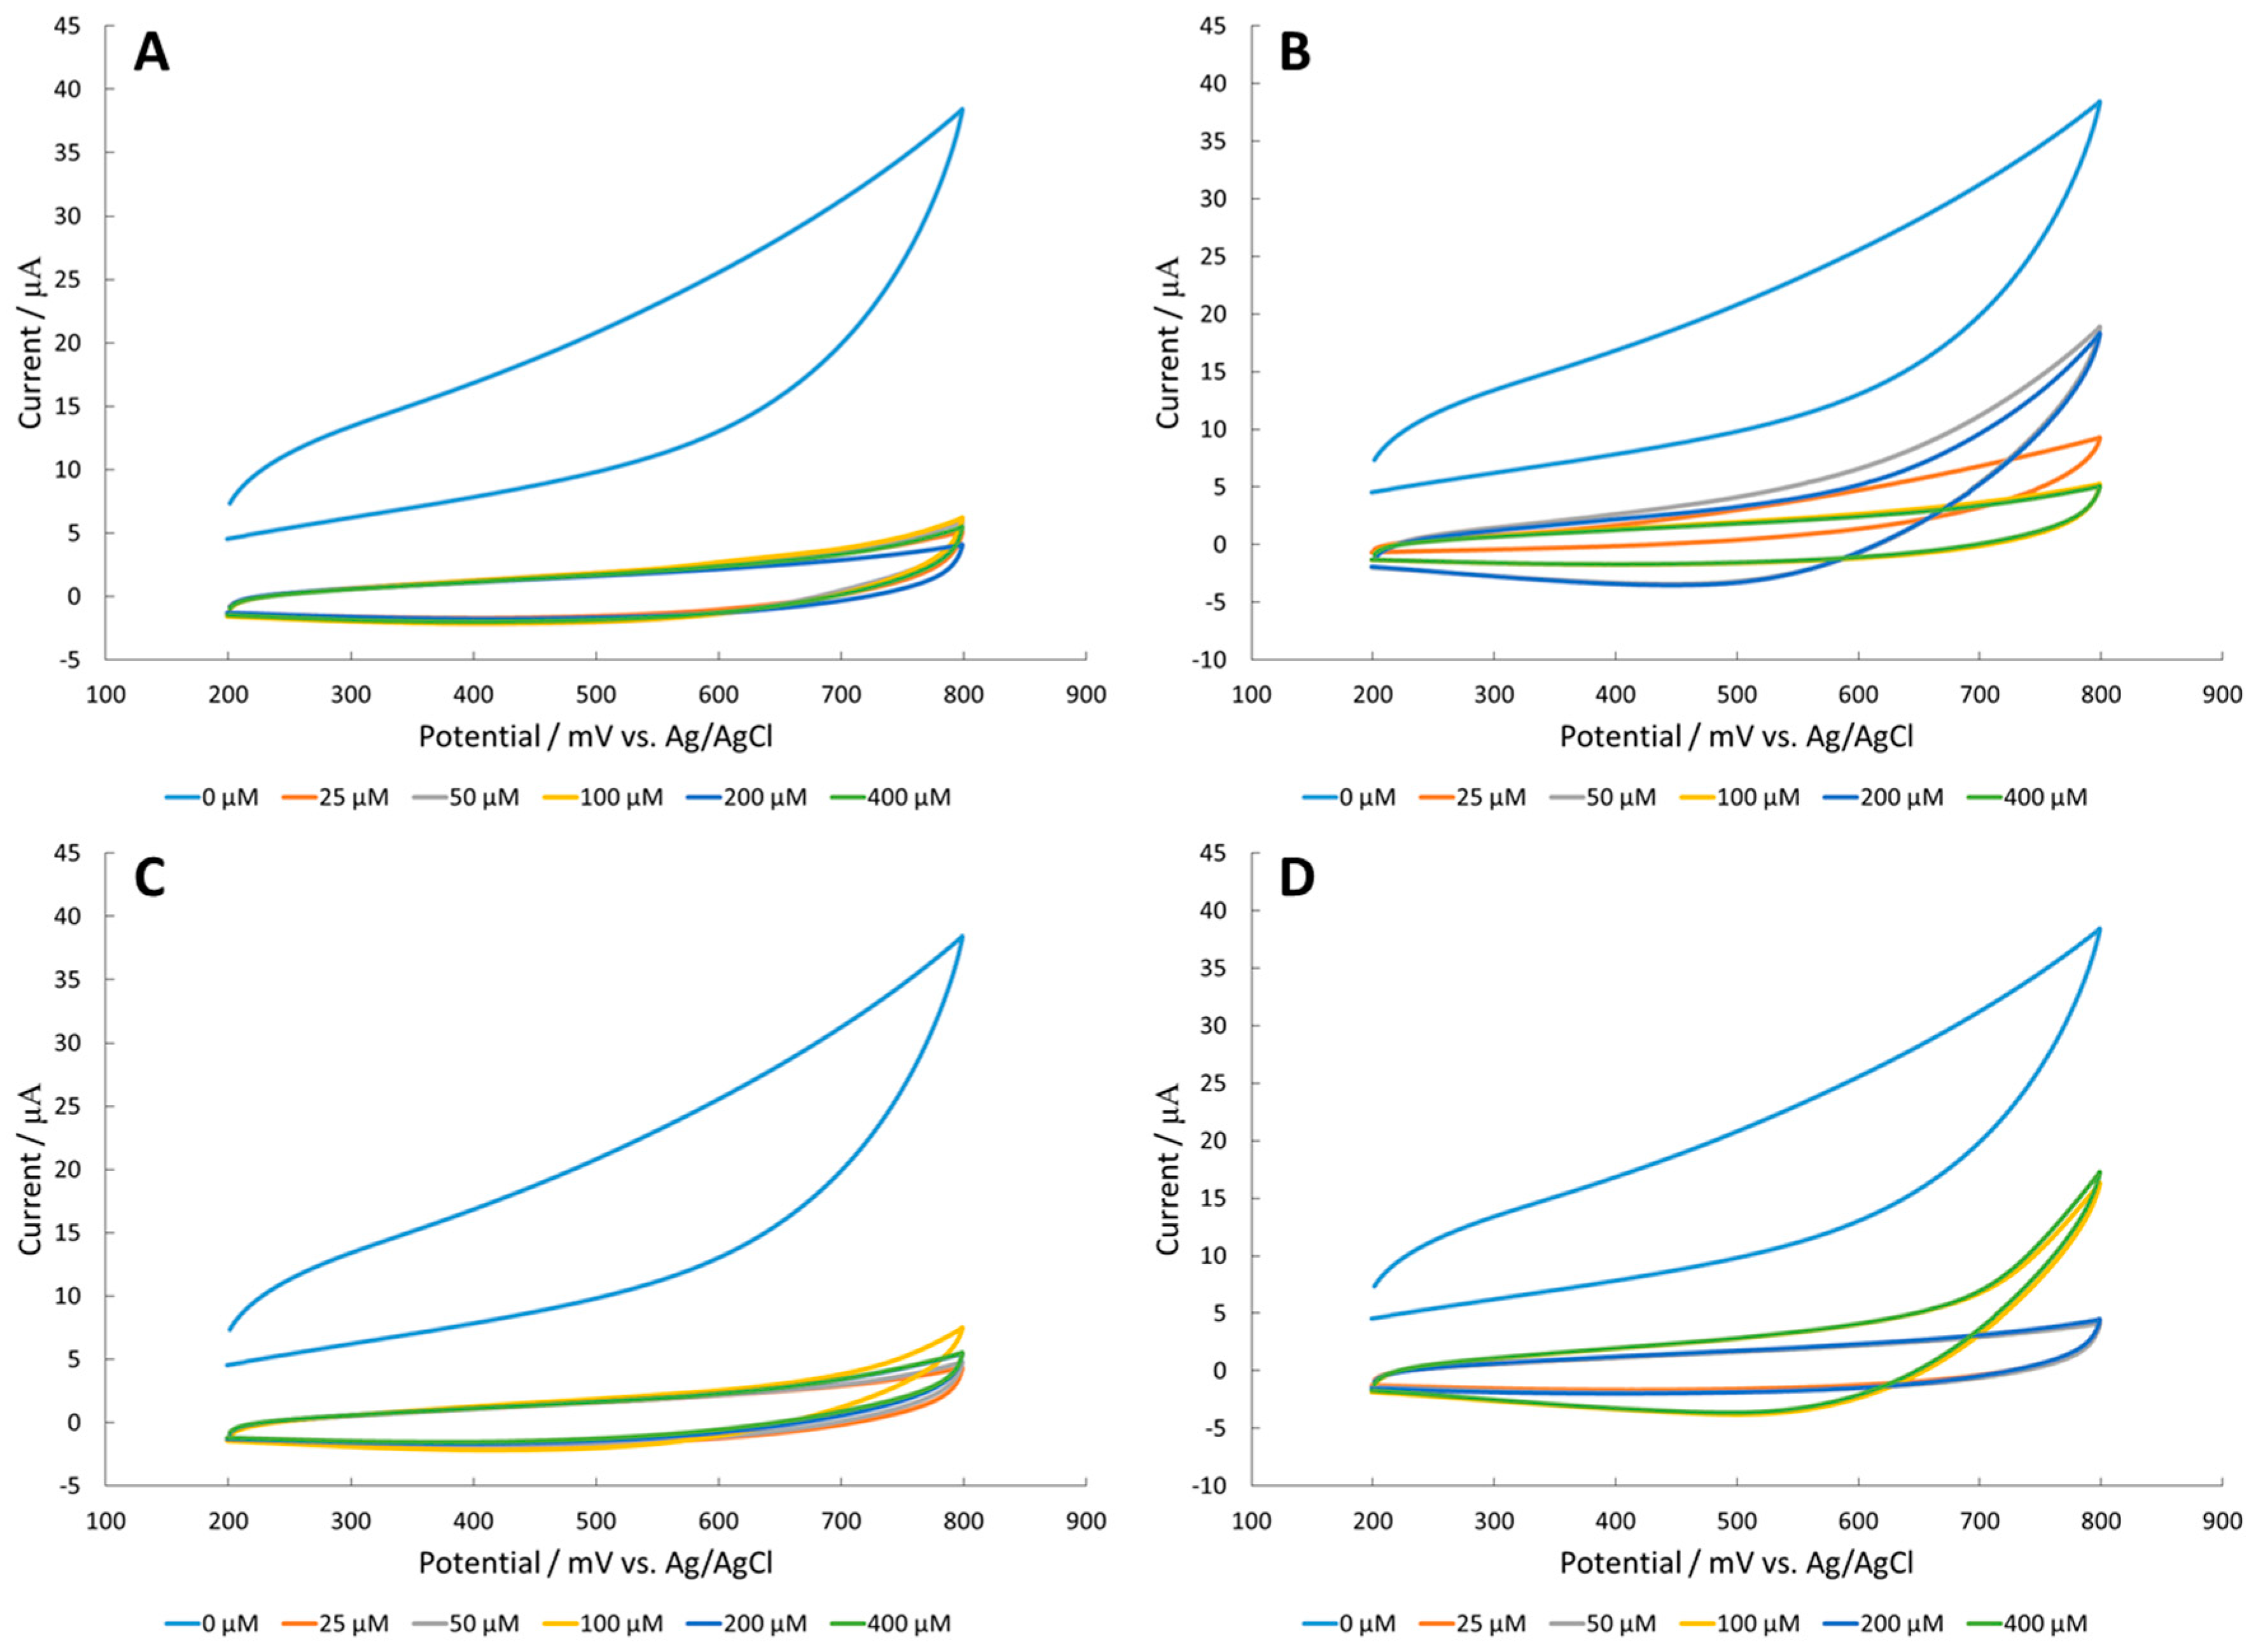
NiO was reported as a competent catalyst for the electrochemical oxidation of glycine, alanine, serine [15], and arginine [16] between 1 and 400 μM in NaOH. To confirm that the Ni(II) surface did not inactivate or reduce activity with an electrochemical standard, ferrocyanide was measured before and after modification (Figure S6). The Ni(II) surface had the greatest effect on the electrochemical catalytic activity of the amino acids, more specifically arginine (Figure 5). Although activity was observed in the presence of arginine, no clear trend between current and analyte concentration was observed (Figure 5). Alanine and arginine had catalytic activity at 100, 200, and 400 μM, but the signal transitioned to a reversible peak at 1000 μM (1 mM). The detection of serine had concentration-independent electrocatalytic activity at 200 μM and 400 μM, but no activity over 1000 μM. The activity for valine was sporadic, leading to an increase in catalytic activity and reversibility at 400 μM with less activity at higher and lower concentrations. It is possible to get a trend of concentration vs. current signal at one specific potential (amperometric effect). Yet, the overall cyclic voltammetry activity indicates an instable surface, loss of activity (i.e., fouling), or saturation effects.
3.4. Corrosion of Nickel Oxide Surface Measured Through Polarization Resistance and Proposed Mechanism
Polarization resistance experiments were conducted to determine whether the analytes were accelerating the corrosion of the NiO surface. The corrosion rate of the surface was extrapolated from a current resistance vs. potential curve over a stable and controlled region (Figures S6–S9). New surfaces were prepared of the NiO surface to compare the effect of arginine on the nickel surface compared to a buffered solution. Arginine had the greatest effect on voltammograms at (7.8 ± 0.6) × 10−3 mpy compared to no analyte present (6.3 ± 0.7) × 10−3 mpy (Table 1). The corrosion rate of creatine, which has a guanidine functional group, was also tested and was found at (9.5 ± 1.2) × 10−3 mpy.
To ensure that the corrosion was specific to arginine and not inactivity, the authors ran a corrosion rate of arginine and valine in PBS which was found to be 8.5 × 10⁻³ mpy and 4.6 × 10⁻³ mpy, respectively. This indicates that arginine corrodes at a similar rate in both PBS and NaOH. Additional corrosion measurements, measured on already used surfaces, can be found in (Table S1). The data follows the same trend presented above, yet the rates are less accurate because of potential delamination and surface degradation that occurred with prior experiments.
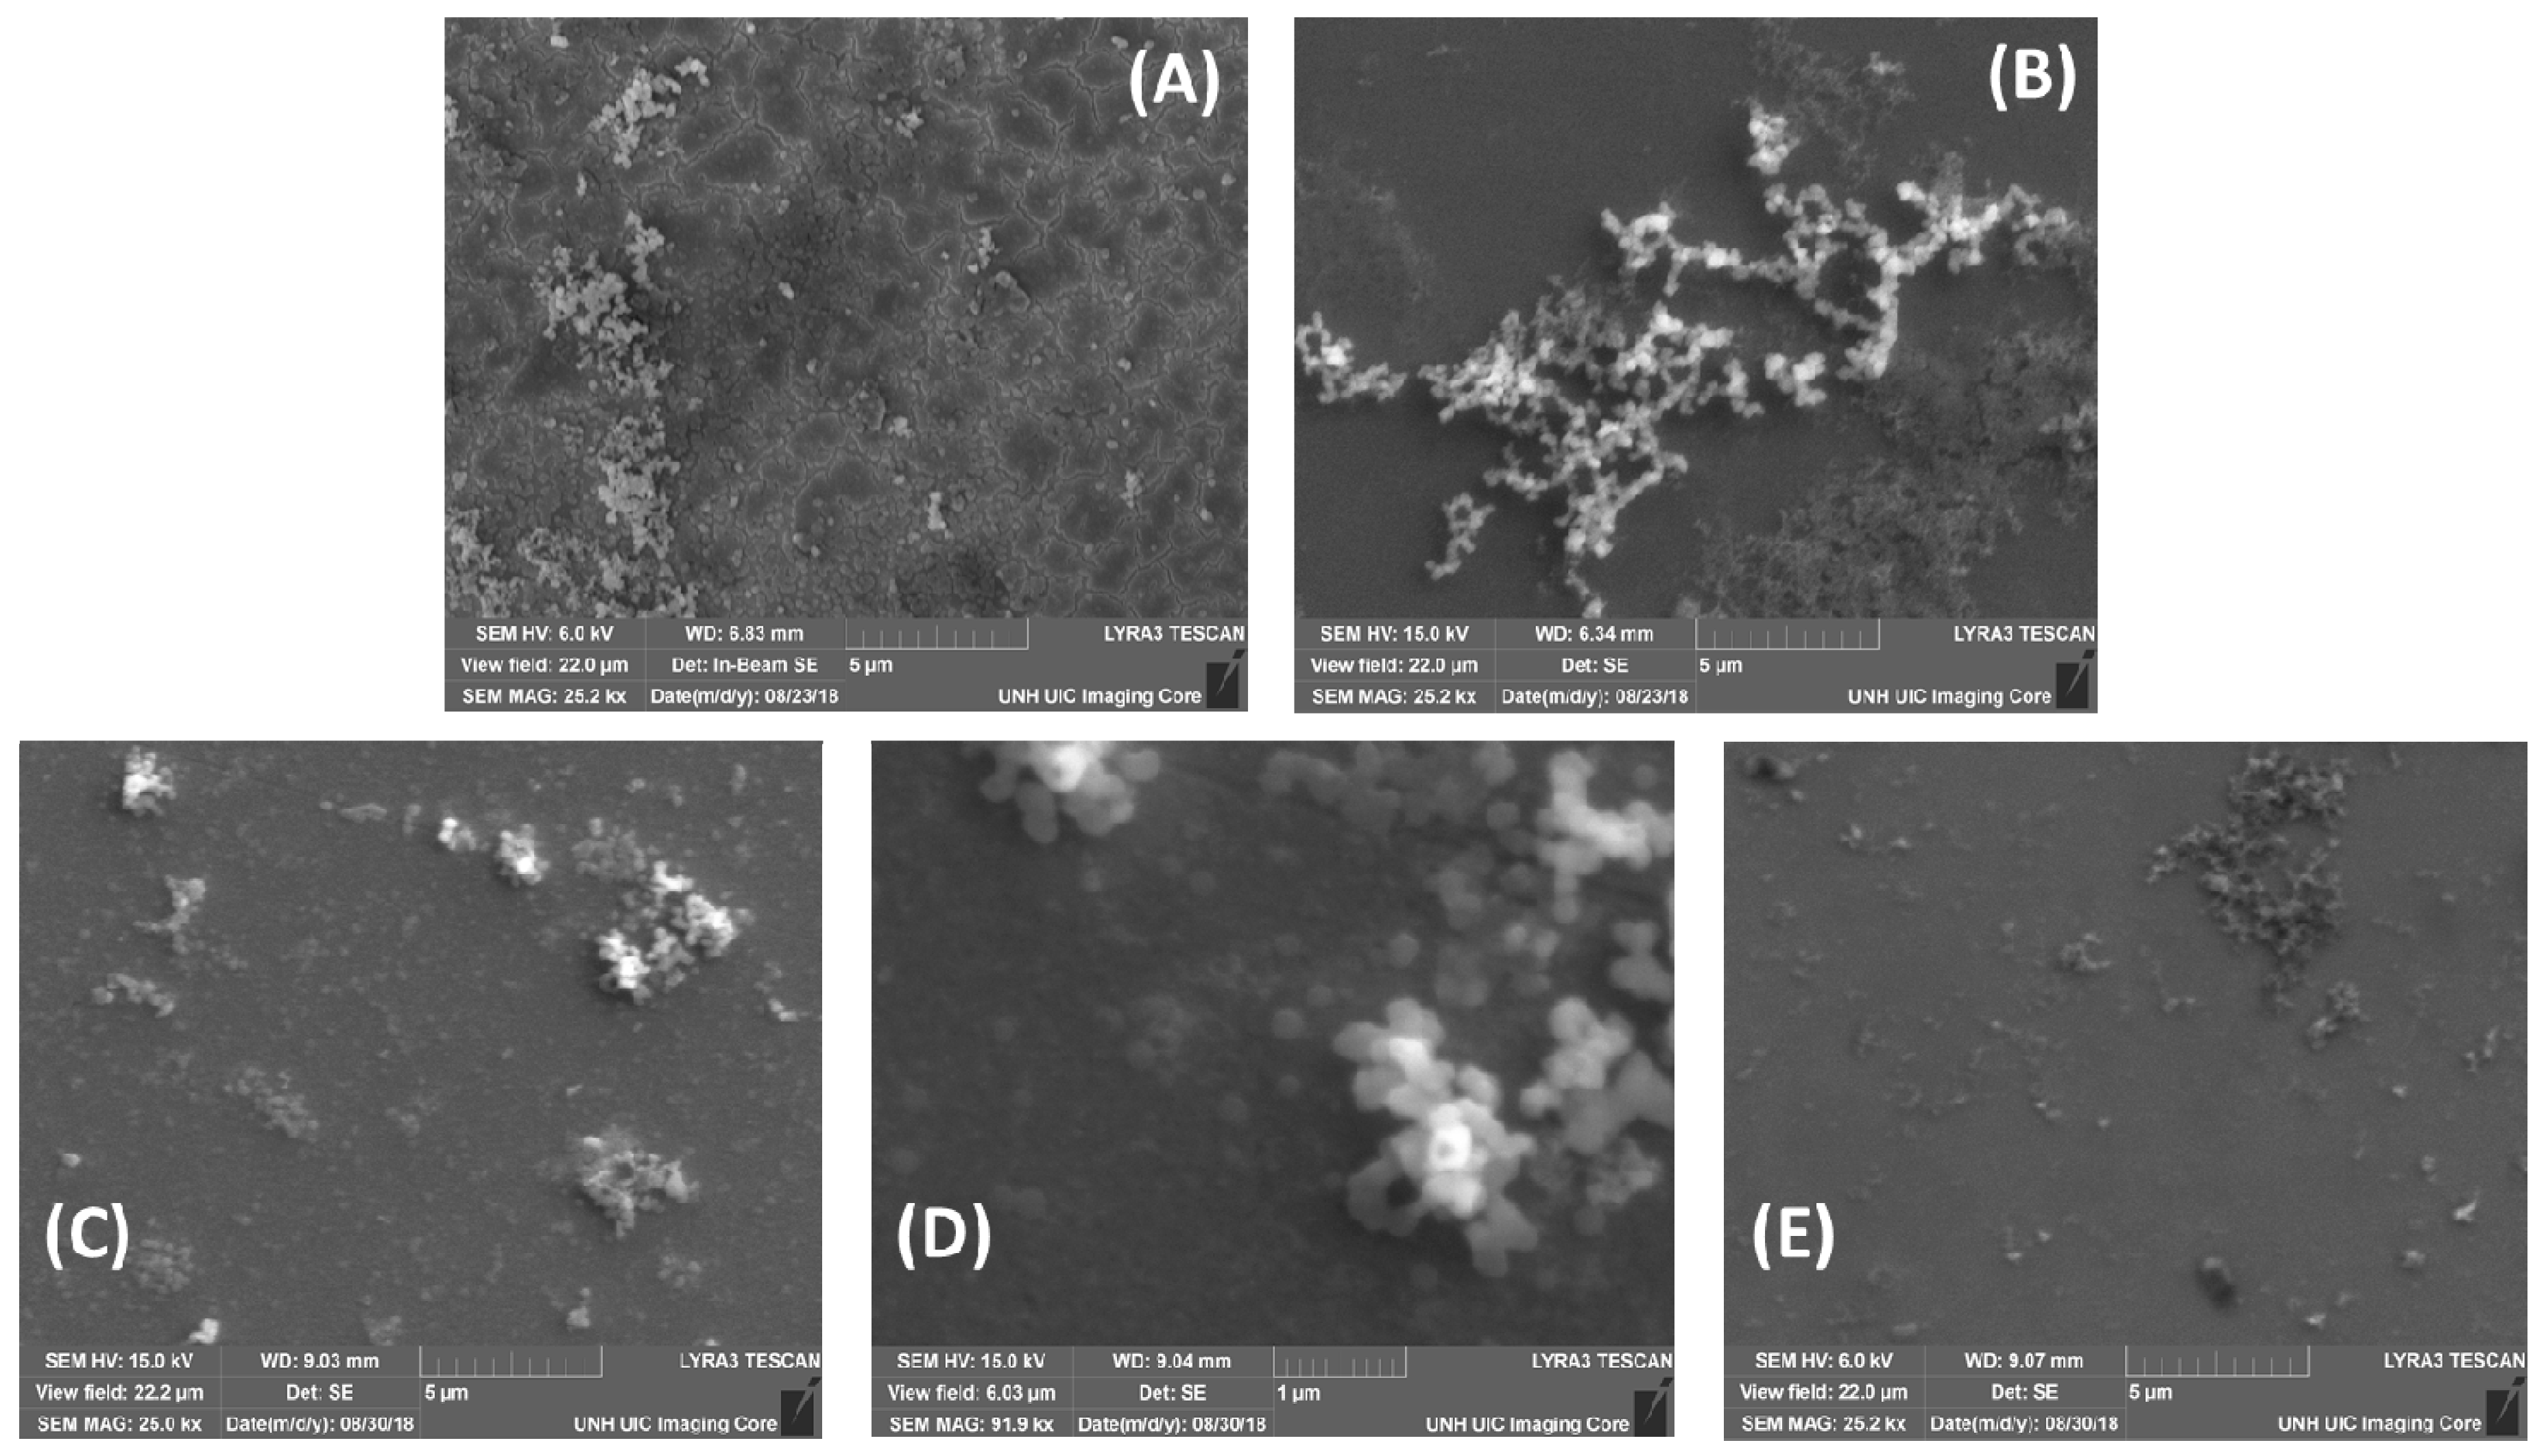
SEM images were taken of both nickel (Figure 6A) and nickel oxide (Figure 6B) during the formation process. EDS results indicated the pure nickel composition and NiO composition proposed (see Supplemental Information for the full EDS report). After experiments, surfaces were reevaluated with SEM. The surface exposed to valine in PBS had minimal surface variation (Figure 6C), with the EDS report indicating some PBS salt residue on the surface, but the NiO surface intact. A zoomed-in image of the NiO particles, confirmed with EDS, showed clear round structures (Figure 6D). SEM images after arginine showed less particulate and less nickel oxide content compared to the other surfaces (Figure 6E).
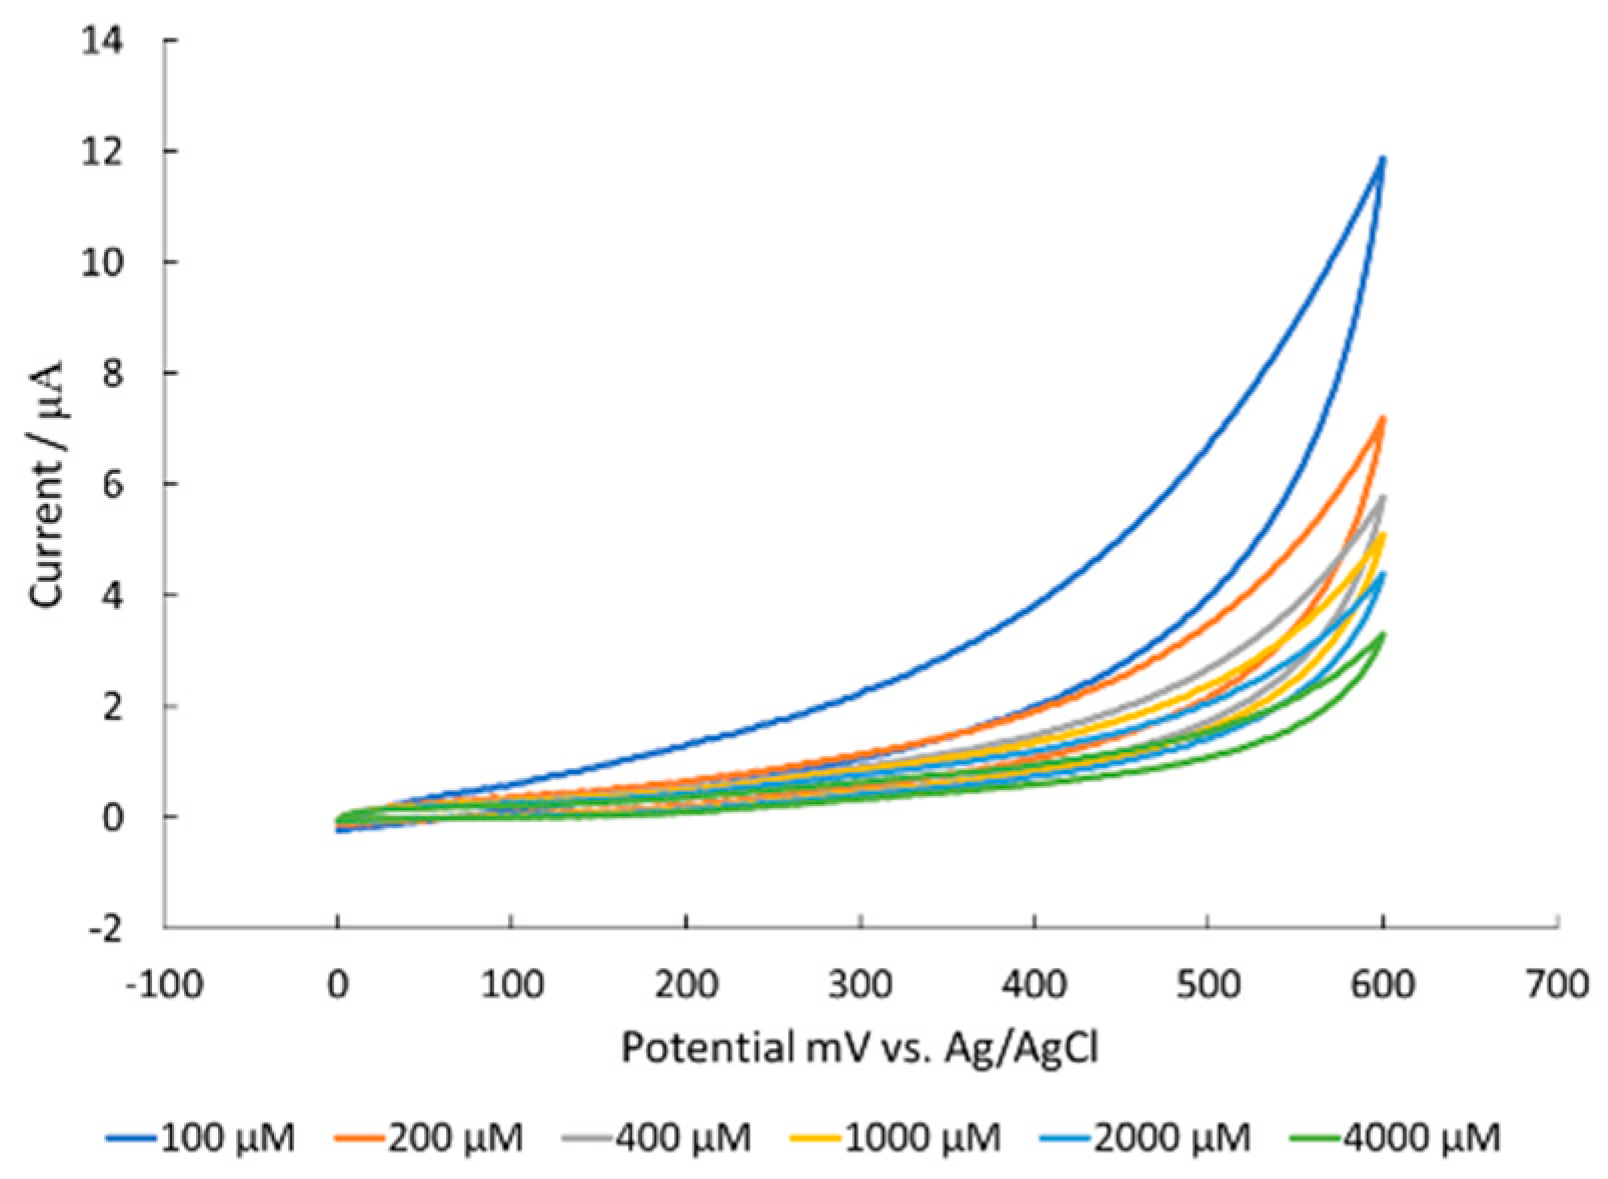
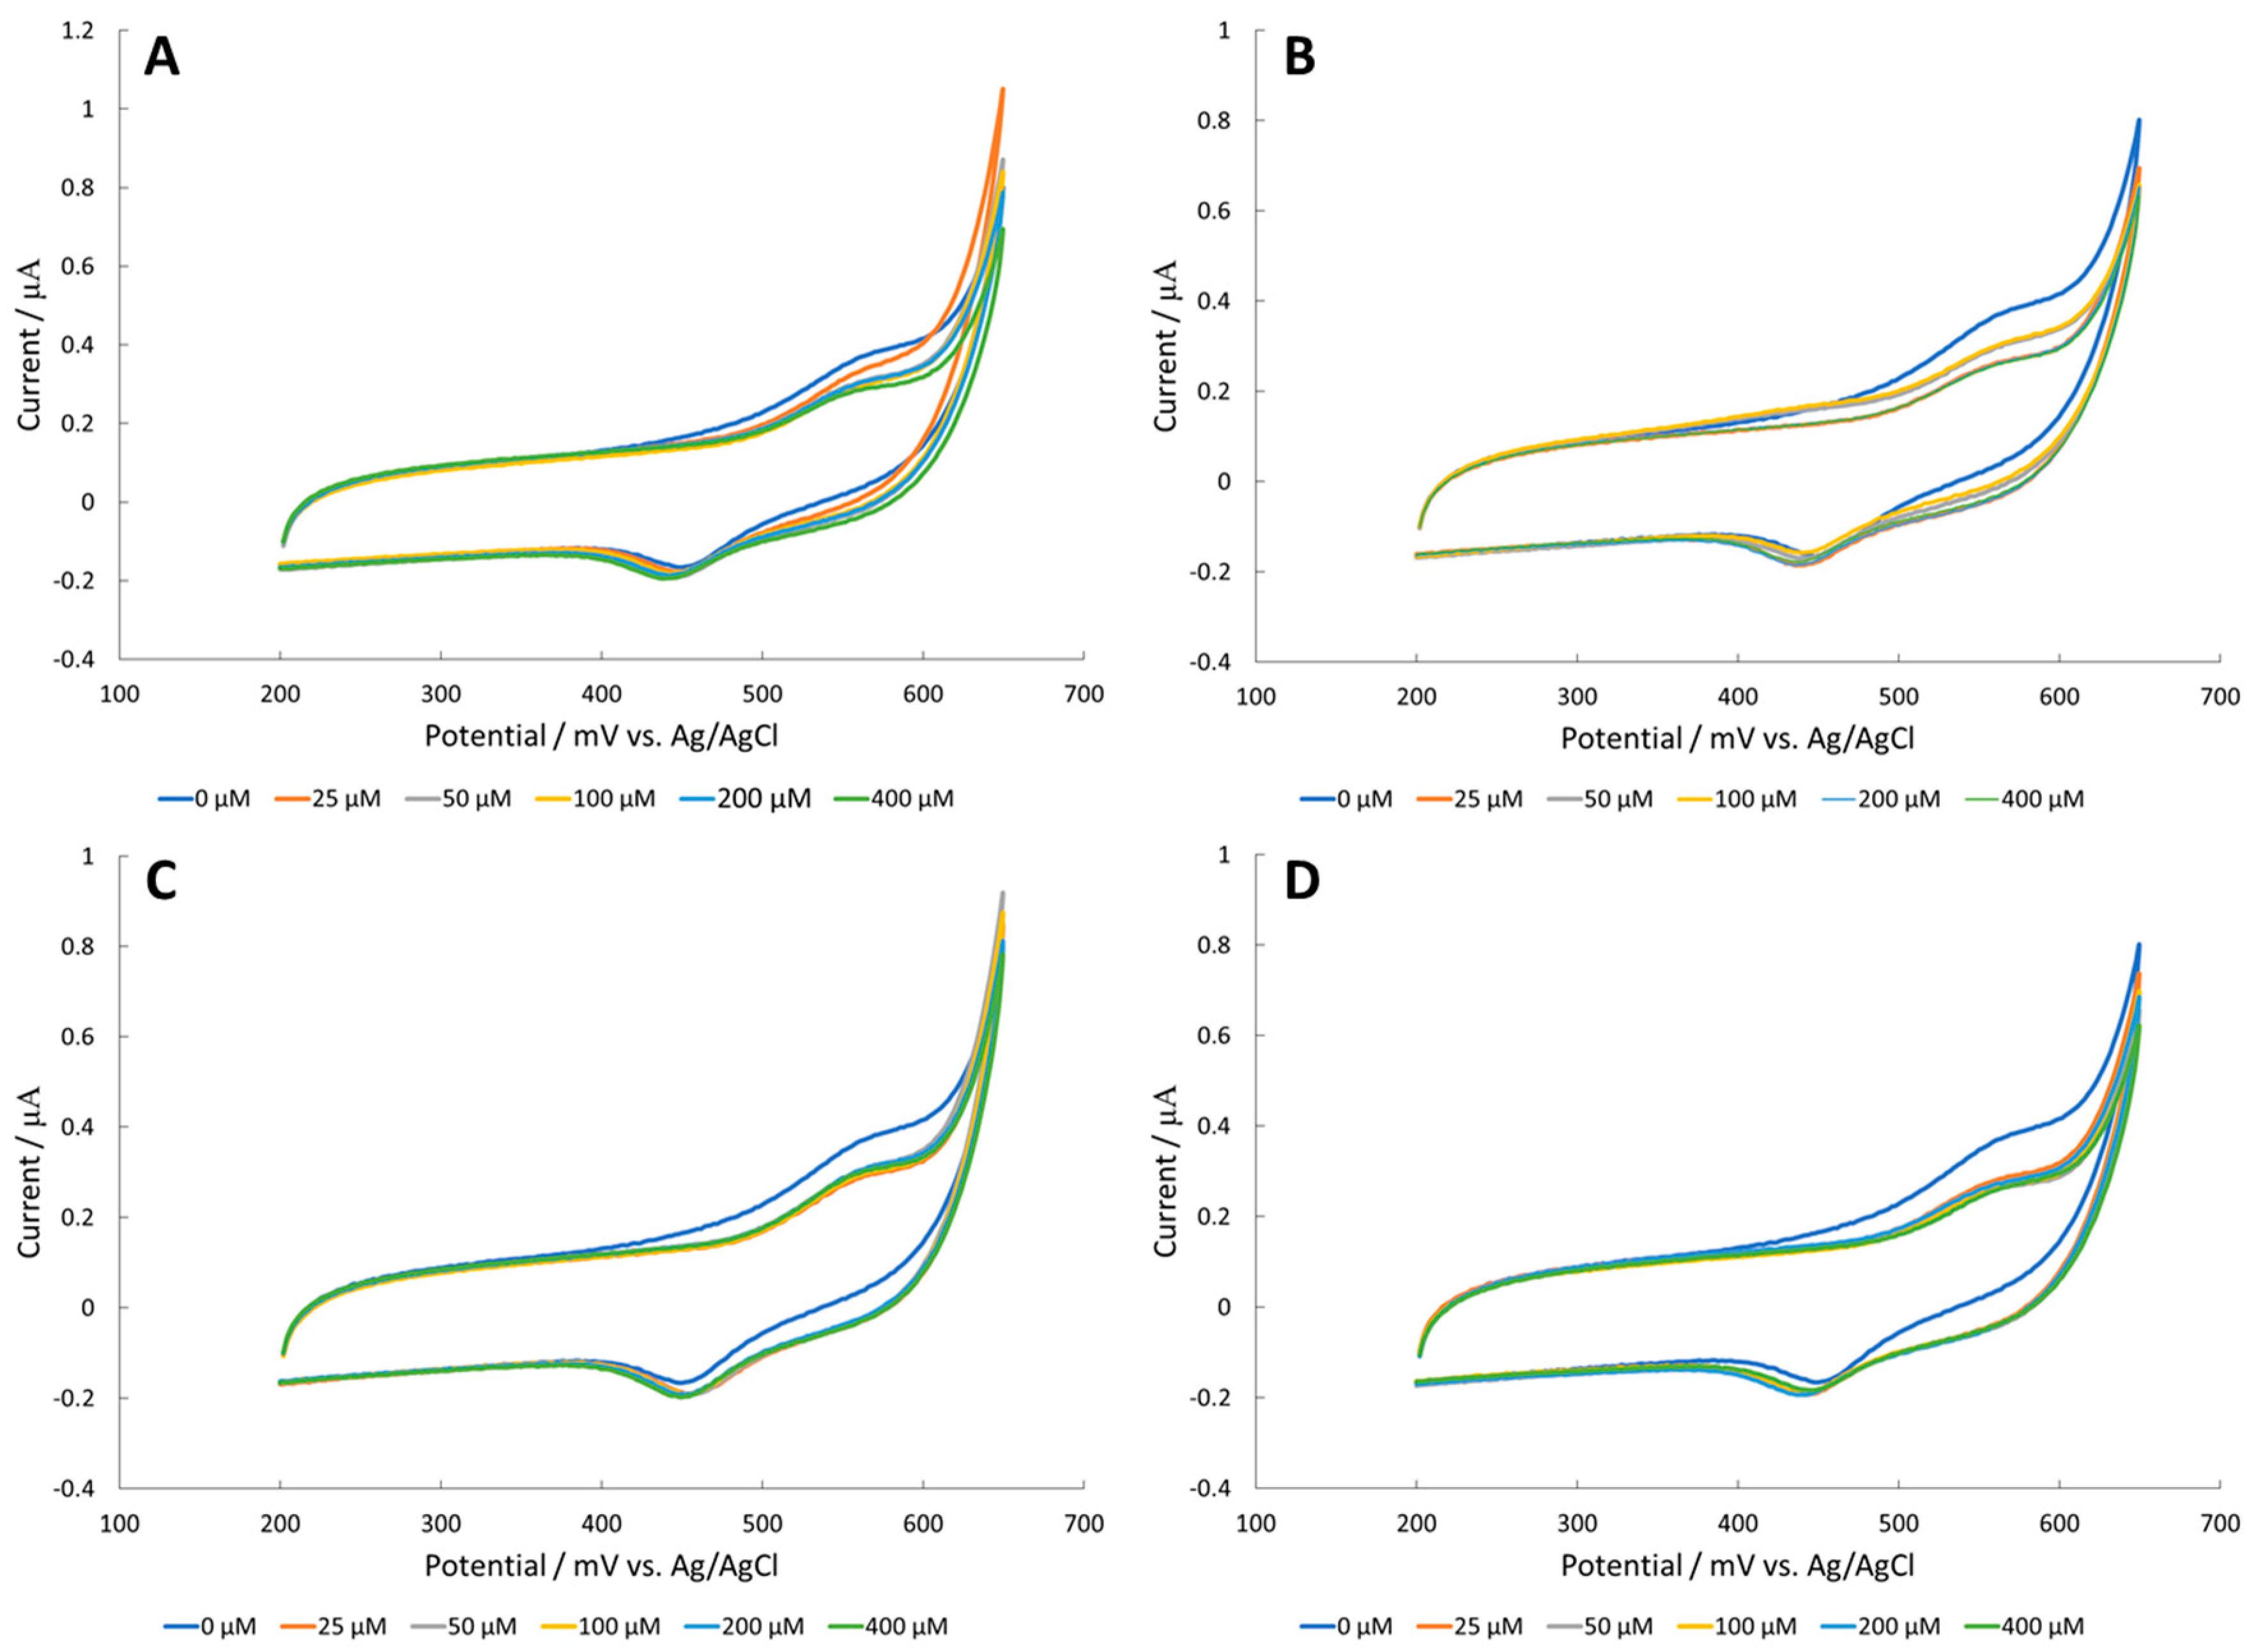
CV data exposing nickel oxide modified surfaces to creatine showed no electrochemical catalytic activity, yet a reduction of capacitive current as concentration increased (Figure 7). This data, with the corrosion and SEM data, further supported the authors’ hypothesis that the guanidine moiety created a Schiff base that resulted in irreversible corrosion of the surface.
4. Conclusions
CuO, Fe2O3, and NiO surfaces were evaluated as catalysts for the electrochemical activation of various amino acids in a flow cell. While CuO and Fe2O3 did not yield strong current responses toward the amino acids, arginine had interesting effects on the NiO surface. The drastic changes in current shape and response of the NiO modified GCE in response to arginine was presumably due to accelerated degradation by complexation of the guanidine unit to Ni2+, which was supported by polarization resistance experiments.
Creatine, a structural analog of arginine, was evaluated with the NiO surface. Polarization resistance measurements demonstrated a similar rate of corrosion for creatine and arginine. That result supported the proposition that complexation of the catalyst to the guanidine moiety led to an increased solubility (delamination) of the NiO surface.
The authors encourage researchers interested in measuring arginine, and other guanidine moieties, to investigate more stable catalytic surfaces. To prevent the Schiff base formation, they propose two possible approaches. First, carbon nanotubes (e.g., multi-walled carbon nanotubes) and graphene, have the ability to host metal oxides with a Schiff base complex, which can impede the formation of additional Schiff base complexes from the solution [31]. Second, a negatively charged substrate, such as polyaniline and poly(N-isopropylacrylamide), can be used to host the nanoparticles and inhibit the Schiff base complex.
Supplementary Materials
The following are available online at https://www.mdpi.com/1424-8220/18/9/3144/s1, Figure S1: CVs of (A) alanine, (B) arginine, (C) serine, and (D) valine in 100 mM NaOH with a bare Pt working electrode. No electrochemical activity is observed. (B) For arginine, a degrease upon addition of amino acid is observed potentially due to a Schiff-base complex, Figure S2: Deposition of (A) Cu onto a Pt working electrode, (B) Fe onto GCE and (C) Ni onto GCE. The cathodic currents are indicative of reduction of the metal ion to the elemental metal. The decrease in current response with additional cycles is indicative of multiple layers of metal depositing on the surface, Figure S3: Passivation to (A) CuO onto a Pt working electrode, (B) Fe2O3 and (C) NiO onto GCE in 100 mM NaOH. A slight anodic current is occurred in the presence of 100 mM for the CuO surface and Fe2O3 surface, which decreased with iterative cycles due to the addition of more layers on the electrode surface, Figure S4: CVs of (A) alanine, (B) arginine, (C) serine, and (D) valine in PBS with an Fe2O3 modified GCE. Electrochemical activation of amino acids was not evident the CVs, presumably due to lack of chelation delamination of the surface from corrosion, Figure S5: CVs of (A) alanine, (B) arginine, (C) serine, and (D) valine in PBS with a NiO modified GCE. Electrochemical activation of amino acids was not evident the CVs, presumably due to lack of chelation delamination of the surface from corrosion, Figure S6: CVs of ferrocyanide in 100 mM NaOH from a (A) bare electrode and (B) after NiO modification. Three cycles of the same scan is displayed. No major changes of activity is observed, Figure S7: Polarization resistance plot of alanine on a NiO modified carbon QCM sensor. Corrosion Rate was found to be 1.960 × 10⁻³ mpy, Figure S8: Polarization resistance plot of arginine on a NiO modified carbon QCM sensor. Corrosion Rate was found to be 3.354 × 10⁻³ mpy; Figure S9: Polarization resistance plot of serine on a NiO modified carbon QCM sensor. Corrosion Rate was found to be 2.088 × 10⁻³ mpy, Figure S10: Polarization resistance of valine on a NiO modified carbon QCM sensor. Corrosion Rate was found to be 2.035 × 10⁻³ mpy, Table S1: Effect of 1 mM amino acid in 100 mM NaOH on corrosion of NiO surface after use in sensing experiments. Corrosion rate is highest with arginine at 3.4 × 10⁻³ mpy and lowest with a blank of 100 mM NaOH at 1.9 × 10⁻³ mpy. The rates reported in the manuscript are from a newly modified surface, which is different than the rates reported here, on an already used surface. The trend of the reported rates are still in agreement.
Author Contributions
Conceptualization, J.M.H.; Methodology, C.A.T.; Formal Analysis, C.A.T. and C.H.G.; Investigation, C.A.T., C.H.G. and S.M.; Validation, C.A.T. and S.M.; Resources, J.M.H.; Data Curation, J.M.H.; Writing–Original Draft Preparation, C.A.T.; Writing–Review and Editing, J.M.H.; Visualization, C.A.T.; Supervision, J.M.H.; Project Administration, J.M.H.; Funding Acquisition, J.M.H. and C.H.G.
Funding
This research was funded by National Institutes of Health [name of funder] grant number P20 GM113131. CHG was funded in part by the Research Experience Apprenticeship Program through the University of New Hampshire’s Hamel Center for Undergraduate Research.
Acknowledgments
The authors would like to acknowledge the University of New Hampshire College of Engineering and Physical Sciences. The authors would like to thank Nancy Cherim, University Instrumentation Center, University of New Hampshire, for her guidance obtaining SEM and EDS measurements. The authors would also like to thank the Surface Enhanced Electrochemical Diagnostic Sensors (SEEDS) Laboratory and Chris Beasley at Gamry Instrumentation Inc. for their guidance and feedback.
Conflicts of Interest
The authors declare no conflict of interest.
References
- Xie, B.; Waters, M.J.; Schirra, H.J. Investigating potential mechanisms of obesity by metabolomics. J. Biomed. Biotechnol. 2012, 2012, 1–10. [Google Scholar] [CrossRef] [PubMed]
- Woo, H.-I.; Chun, M.-R.; Yang, J.-S.; Lim, S.-W.; Kim, M.-J.; Kim, S.-W.; Myung, W.-J.; Kim, D.-K.; Lee, S.-Y. Plasma amino acid profiling in major depressive disorder treated with selective serotonin reuptake inhibitors. CNS Neurosci. Ther. 2015, 21, 417–424. [Google Scholar] [CrossRef] [PubMed]
- Zheng, P.; Gao, H.-C.; Qi, Z.-G.; Jia, J.-M.; Li, F.F.; Chen, J.J.; Wang, Y.; Guo, J.; Melgiri, N.D.; Xie, P. Peripheral metabolic abnormalities of lipids and amino acids implicated in increased risk of suicidal behavior in major depressive disorder. Metabolomics 2013, 9, 688–696. [Google Scholar] [CrossRef]
- Shao, W.; Chen, J.; Fan, S.; Lei, Y.; Xu, H.; Zhou, J.; Cheng, P.; Yang, Y.; Rao, C.; Wu, B.; et al. Combined metabolomics and proteomics analysis of major depression in an animal model: Perturbed energy metabolism in the chronic mild stressed rat cerebellum. OMICS 2015, 19, 383–392. [Google Scholar] [CrossRef] [PubMed]
- Shushan, B. A review of clinical diagnostic applications of liquid chromatography–tandem mass spectrometry. Mass Spectrom. Rev. 2010, 29, 930–944. [Google Scholar] [CrossRef] [PubMed]
- Madsen, R.; Lundstedt, T.; Trygg, J. Chemometrics in metabolomics—A review in human disease diagnosis. Anal. Chim. Acta 2010, 659, 23–33. [Google Scholar] [CrossRef] [PubMed]
- Gowda, G.N.; Zhang, S.; Gu, H.; Asiago, V.; Shanaiah, N.; Raftery, D. Metabolomics-based methods for early disease diagnostics. Expert Rev. Mol. Diagn. 2008, 8, 617–633. [Google Scholar] [CrossRef] [PubMed] [Green Version]
- Herzog, G.; Arrigan, D.W.M. Electrochemical strategies for the label-free detection of amino acids, peptides and proteins. Analyst 2007, 132, 615–632. [Google Scholar] [CrossRef] [PubMed]
- Martens-Lobenhoffer, J.; Bode-Böger, S.M. Mass spectrometric quantification of L-arginine and its pathway related substances in biofluids: The road to maturity. J. Chromatogr. B 2014, 964, 89–102. [Google Scholar] [CrossRef] [PubMed]
- Krumpochova, P.; Bruyneel, B.; Molenaar, D.; Koukou, A.; Wuhrer, M.; Niessen, W.M.A.; Giera, M. Amino acid analysis using chromatography–mass spectrometry: An inter platform comparison study. J. Pharm. Biomed. Anal. 2015, 114, 398–407. [Google Scholar] [CrossRef] [PubMed]
- Hernando, D.; Saurina, J.; Hernández-Cassou, S. Liquid chromatographic determination of aniline in table-top sweeteners based on pre-column derivatization with 1,2-naphthoquinone-4-sulfonate. J. Chromatogr. A 1999, 859, 227–233. [Google Scholar] [CrossRef]
- Schiesel, S.; Lämmerhofer, M.; Lindner, W. Multitarget quantitative metabolic profiling of hydrophilic metabolites in fermentation broths of β-lactam antibiotics production by HILIC–ESI–MS/MS. Anal. Bioanal. Chem. 2010, 396, 1655–1679. [Google Scholar] [CrossRef] [PubMed]
- Kaspar, H.; Dettmer, K.; Gronwald, W.; Oefner, P.J. Automated GC–MS analysis of free amino acids in biological fluids. J. Chromatogr. B 2008, 870, 222–232. [Google Scholar] [CrossRef] [PubMed]
- Casella, I.G.; Cataldi, T.R.I.; Guerrieri, A.; Desimoni, E. Copper dispersed into polyaniline films as an amperometric sensor in alkaline solutions of amino acids and polyhydric compounds. Anal. Chim. Acta 1996, 335, 217–225. [Google Scholar] [CrossRef]
- Roushani, M.; Shamsipur, M.; Pourmortazavi, S.M. Amprometric detection of Glycine, l-Serine, and l-Alanine using glassy carbon electrode modified by NiO nanoparticles. J. Appl. Electrochem. 2012, 42, 1005–1011. [Google Scholar] [CrossRef]
- Martínez-Periñán, E.; Revenga-Parra, M.; Zamora, F.; Pariente, F.; Lorenzo, E. Nanostructured electrochemical detector for the quantification of amino acids related to metabolic diseases. Sens. Actuators B Chem. 2016, 236, 773–780. [Google Scholar] [CrossRef]
- Zen, J.-M.; Hsu, C.-T.; Senthil Kumar, A.; Lyuu, H.-J.; Lin, K.-Y. Amino acid analysis using disposable copper nanoparticle plated electrodes. Analyst 2004, 129, 841–845. [Google Scholar] [CrossRef] [PubMed]
- Song, Y.; He, Z.; Hou, H.; Wang, X.; Wang, L. Architecture of Fe3O4–graphene oxide nanocomposite and its application as a platform for amino acid biosensing. Electrochim. Acta 2012, 71, 58–65. [Google Scholar] [CrossRef]
- Sigel, H.; Martin, R.B. Coordinating properties of the amide bond. Stability and structure of metal ion complexes of peptides and related ligands. Chem. Rev. 1982, 82, 385–426. [Google Scholar] [CrossRef]
- Nakamoto, K.; Morimoto, Y.; Martell, A.E. Infrared spectra of aqueous solutions. I. metal chelate compounds of amino acids 1. J. Am. Chem. Soc. 1961, 83, 4528–4532. [Google Scholar] [CrossRef]
- Legin, A.A.; Jakupec, M.A.; Bokach, N.A.; Tyan, M.R.; Kukushkin, V.Y.; Keppler, B.K. Guanidine platinum(II) complexes: Synthesis, in vitro antitumor activity, and DNA interactions. J. Inorg. Biochem. 2014, 133, 33–39. [Google Scholar] [CrossRef] [PubMed]
- Marin-Luna, M.; Sanchez-Sanz, G.; O’Sullivan, P.; Rozas, I. Guanidine complexes of platinum: A theoretical study. J. Phys. Chem. A 2014, 118, 5540–5547. [Google Scholar] [CrossRef] [PubMed]
- Bailey, P.J.; Pace, S. The coordination chemistry of guanidines and guanidinates. Coord. Chem. Rev. 2001, 214, 91–141. [Google Scholar] [CrossRef]
- Xu, H.-B.; Fang, L.; Hu, Z.-C.; Chen, Y.-C.; Chen, J.-J.; Li, F.-F.; Lu, J.; Mu, J.; Xie, P. Potential clinical utility of plasma amino acid profiling in the detection of major depressive disorder. Psychiatry Res. 2012, 200, 1054–1057. [Google Scholar] [CrossRef] [PubMed]
- Lawton, K.A.; Berger, A.; Mitchell, M.; Milgram, K.E.; Evans, A.M.; Guo, L.; Hanson, R.W.; Kalhan, S.C.; Ryals, J.A.; Milburn, M.V. Analysis of the adult human plasma metabolome. Pharmacogenomics 2008, 9, 383–397. [Google Scholar] [CrossRef] [PubMed]
- Luo, P.; Zhang, F.; Baldwin, R.P. Constant-potential amperometric detection of underivatized amino acids and peptides at a copper electrode. Anal. Chem. 1991, 63, 1702–1707. [Google Scholar] [CrossRef]
- Qu, H.; Ma, H.; Zhou, W.; O’Connor, C.J. In situ surface functionalization of magnetic nanoparticles with hydrophilic natural amino acids. Inorg. Chim. Acta 2012, 389, 60–65. [Google Scholar] [CrossRef]
- Durmus, Z.; Kavas, H.; Toprak, M.S.; Baykal, A.; Altınçekiç, T.G.; Aslan, A.; Bozkurt, A.; Coşgun, S. l-lysine coated iron oxide nanoparticles: Synthesis, structural and conductivity characterization. J. Alloys Compd. 2009, 484, 371–376. [Google Scholar] [CrossRef]
- Sousa, M.H.; Rubim, J.C.; Sobrinho, P.G.; Tourinho, F.A. Biocompatible magnetic fluid precursors based on aspartic and glutamic acid modified maghemite nanostructures. J. Magn. Magn. Mater. 2001, 225, 67–72. [Google Scholar] [CrossRef]
- Pušnik, K.; Peterlin, M.; Cigić, I.K.; Marolt, G.; Kogej, K.; Mertelj, A.; Gyergyek, S.; Makovec, D. Adsorption of amino acids, aspartic acid, and lysine onto iron-oxide nanoparticles. J. Phys. Chem. C 2016, 120, 14372–14381. [Google Scholar] [CrossRef]
- Veisi, H.; Azadbakht, R.; Saeidifar, F.; Abdi, M.R. Schiff based-functionalized multi walled carbon nano tubes to immobilization of palladium nanoparticles as heterogeneous and recyclable nanocatalyst for suzuki reaction in aqueous media under mild conditions. Catal. Lett. 2017, 147, 976–986. [Google Scholar] [CrossRef]
Figure 1.
(A) Chelation intermediate of amino acid with metal nanoparticle and (B) arginine Ni(II) complex through the guanidine moiety.
Figure 1.
(A) Chelation intermediate of amino acid with metal nanoparticle and (B) arginine Ni(II) complex through the guanidine moiety.
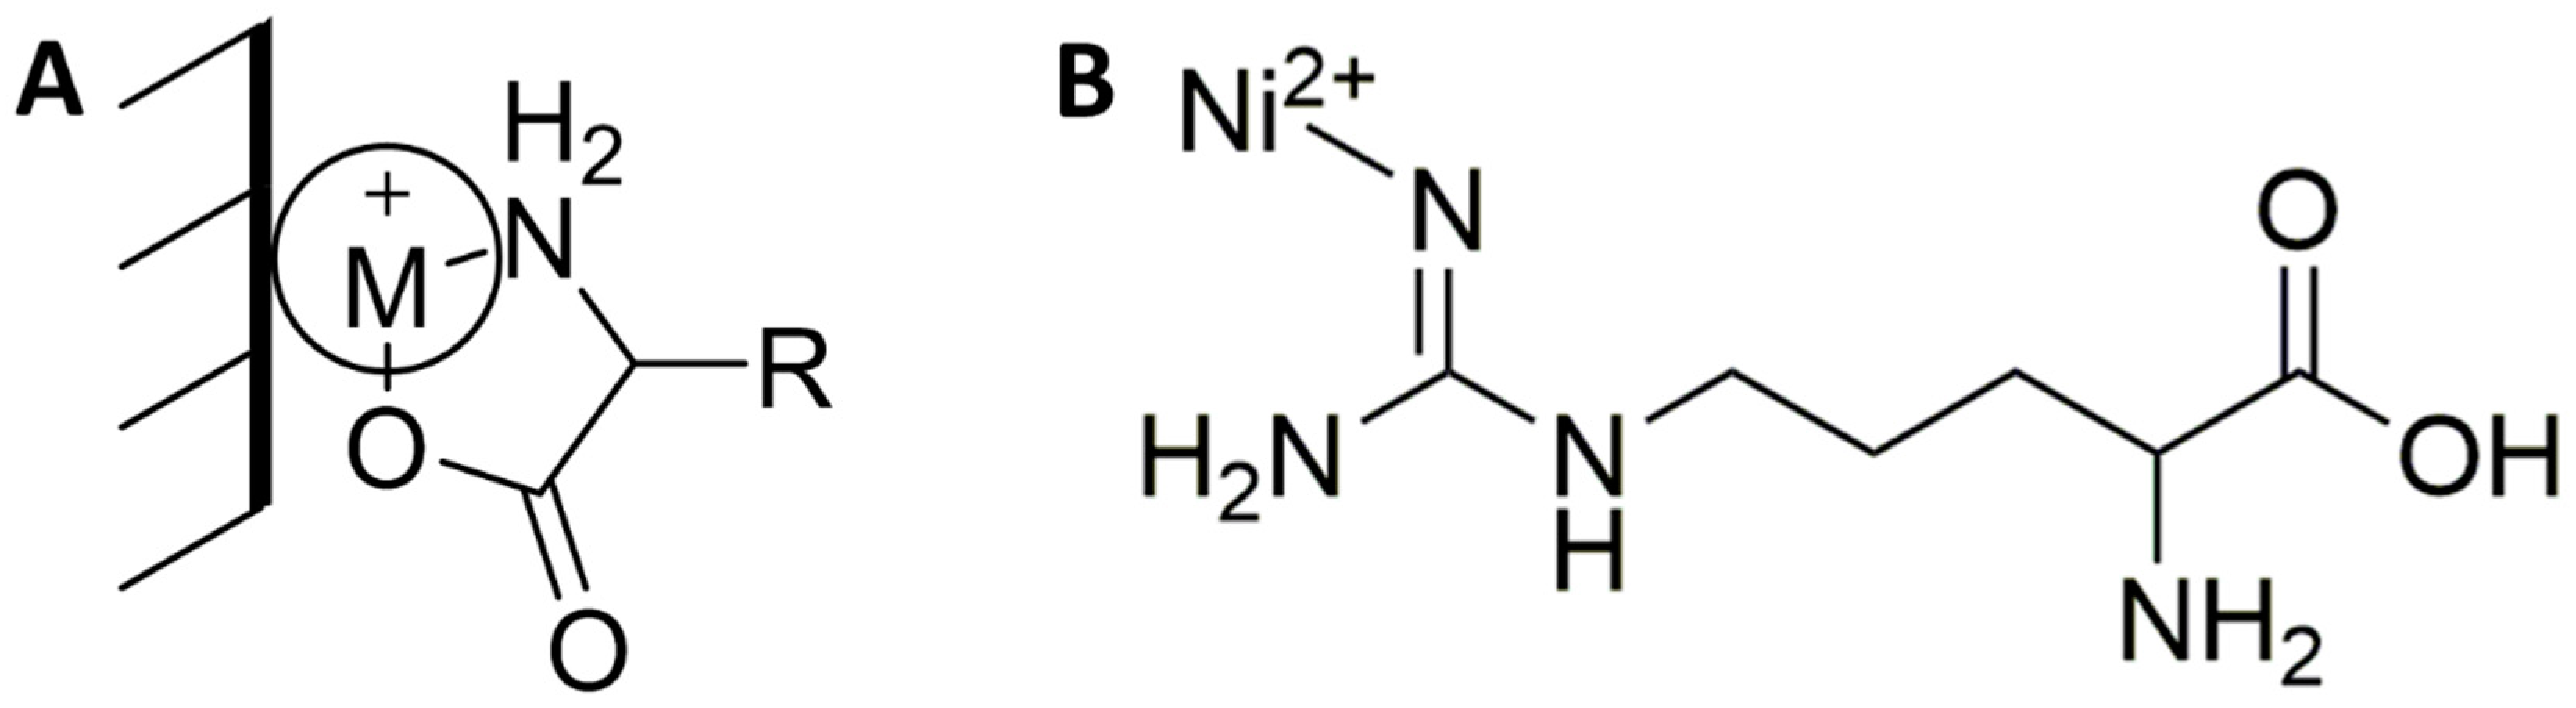
Figure 2.
Amino acids that were electrochemically evaluated.

Figure 3.
Cyclic voltammetry (CV) of (A) alanine, (B) arginine, (C) serine, and (D) valine in 100 mM NaOH with a CuO modified platinum working electrode.
Figure 3.
Cyclic voltammetry (CV) of (A) alanine, (B) arginine, (C) serine, and (D) valine in 100 mM NaOH with a CuO modified platinum working electrode.

Figure 4.
CV of (A) alanine, (B) arginine, (C) serine, and (D) valine in 100 mM NaOH with an Fe2O3 modified glassy carbon electrode.
Figure 4.
CV of (A) alanine, (B) arginine, (C) serine, and (D) valine in 100 mM NaOH with an Fe2O3 modified glassy carbon electrode.

Figure 5.
CV of (A) alanine, (B) arginine, (C) serine, and (D) valine in 100 mM NaOH with NiO modified glassy carbon electrode.
Figure 5.
CV of (A) alanine, (B) arginine, (C) serine, and (D) valine in 100 mM NaOH with NiO modified glassy carbon electrode.
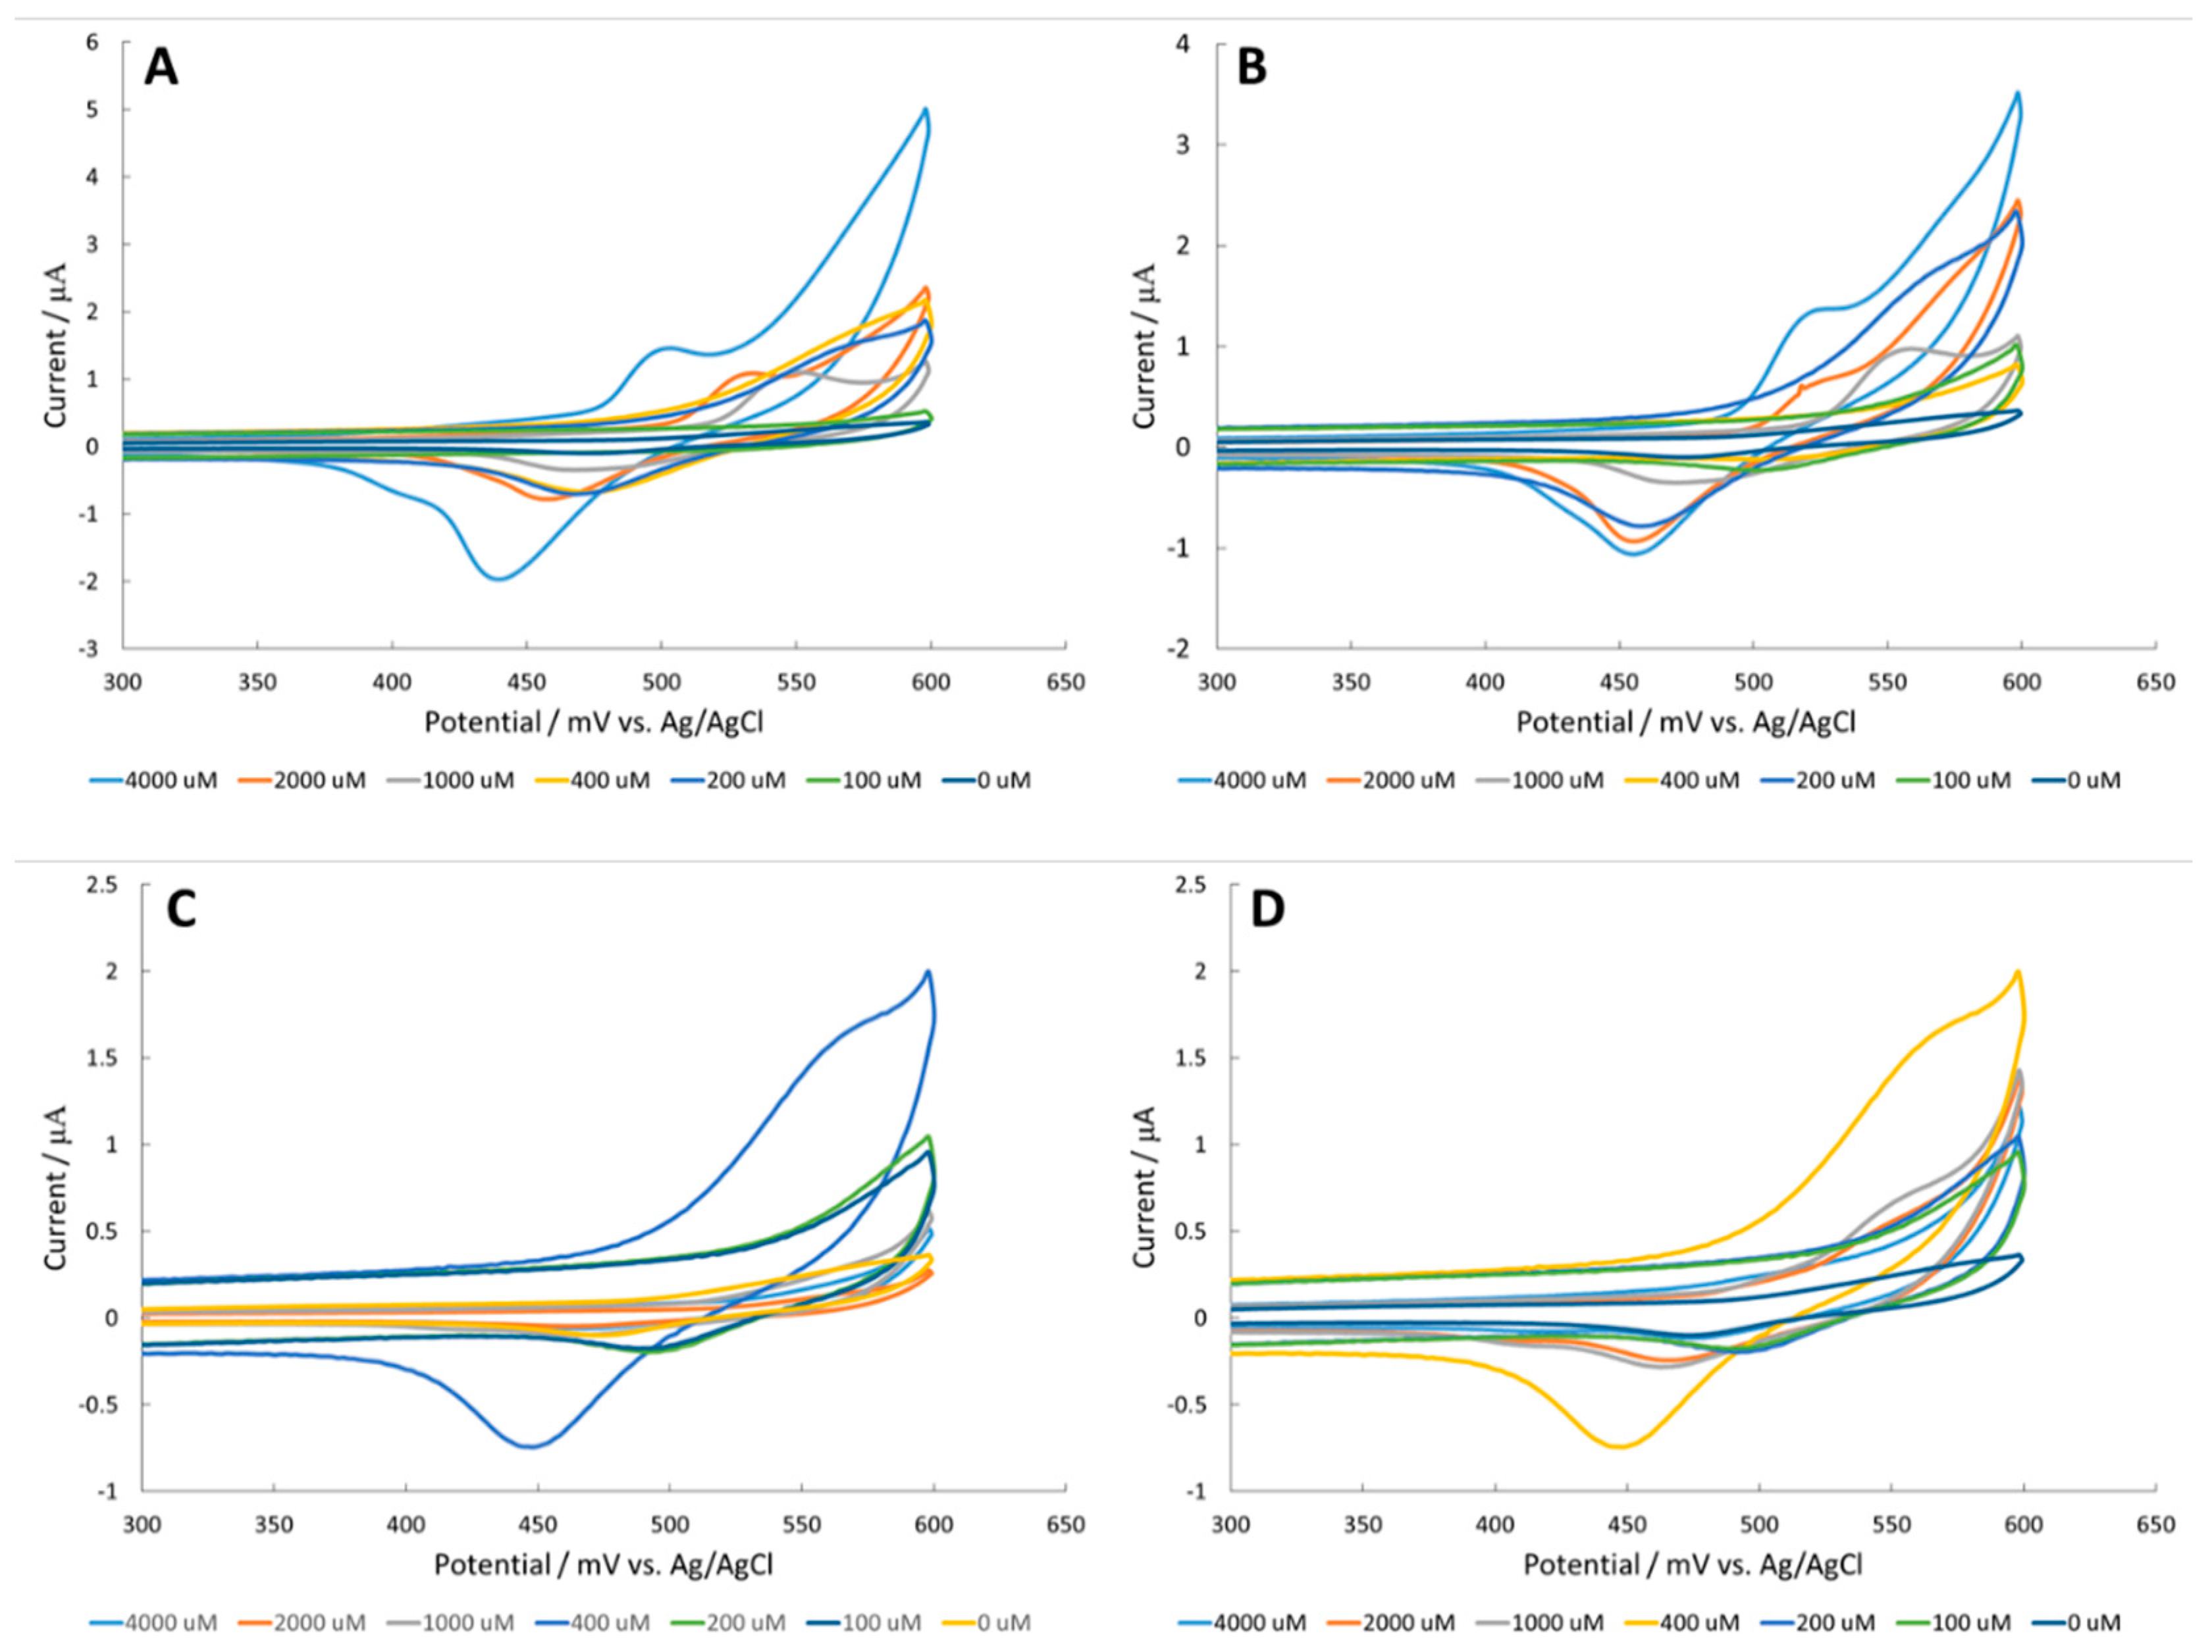
Figure 6.
Scanning electron microscopy (SEM) images of (A) nickel, (B) nickel oxide, (C) nickel oxide after phosphate buffer saline (PBS), (D), zoomed in on the particle of nickel oxide after PBS, and (E) nickel oxide after arginine. There is less nickel oxide content and thickness observed after arginine; this is comparable to original nickel graphs. All images are at 25 k× magnification except (D).

Figure 7.
CV data of a serial dilution of creatine in 100 mM NaOH with a NiO modified glassy carbon electrode.
Figure 7.
CV data of a serial dilution of creatine in 100 mM NaOH with a NiO modified glassy carbon electrode.

Table 1.
Effect of 1 mM arginine in 100 mM NaOH on corrosion of fresh NiO surfaces.
| Rate of Corrosion (10−3 Mils per Year) | |
|---|---|
| 1 mM Arginine in 100 mM NaOH | 7.8 ± 0.6 |
| 400 μM Creatine in 100 mM NaOH | 9.5 ± 1.2 |
| 100 mM NaOH (no analyte) | 6.3 ± 0.7 |
© 2018 by the authors. Licensee MDPI, Basel, Switzerland. This article is an open access article distributed under the terms and conditions of the Creative Commons Attribution (CC BY) license (http://creativecommons.org/licenses/by/4.0/).
Share and Cite
MDPI and ACS Style
Tooley, C.A.; Gasperoni, C.H.; Marnoto, S.; Halpern, J.M. Evaluation of Metal Oxide Surface Catalysts for the Electrochemical Activation of Amino Acids. Sensors 2018, 18, 3144. https://doi.org/10.3390/s18093144
AMA Style
Tooley CA, Gasperoni CH, Marnoto S, Halpern JM. Evaluation of Metal Oxide Surface Catalysts for the Electrochemical Activation of Amino Acids. Sensors. 2018; 18(9):3144. https://doi.org/10.3390/s18093144
Chicago/Turabian StyleTooley, Christian A., Charles H. Gasperoni, Sabrina Marnoto, and Jeffrey Mark Halpern. 2018. "Evaluation of Metal Oxide Surface Catalysts for the Electrochemical Activation of Amino Acids" Sensors 18, no. 9: 3144. https://doi.org/10.3390/s18093144
Note that from the first issue of 2016, this journal uses article numbers instead of page numbers. See further details here.