Predicting Key Agronomic Soil Properties with UV-Vis Fluorescence Measurements Combined with Vis-NIR-SWIR Reflectance Spectroscopy: A Farm-Scale Study in a Mediterranean Viticultural Agroecosystem


Abstract
:
1. Introduction
2. Materials and Methods
2.1. Study Area
2.2. Soil Samples
2.3. Reflectance Measurements
2.4. Fluorescence Measurements
2.5. Models for Soil Properties Prediction
3. Results
3.1. Description of the Dataset
3.2. Performance of PLSR Models
3.3. Performance of Single LR Models
4. Discussion
4.1. Fluorescence Is Complementary to Reflectance
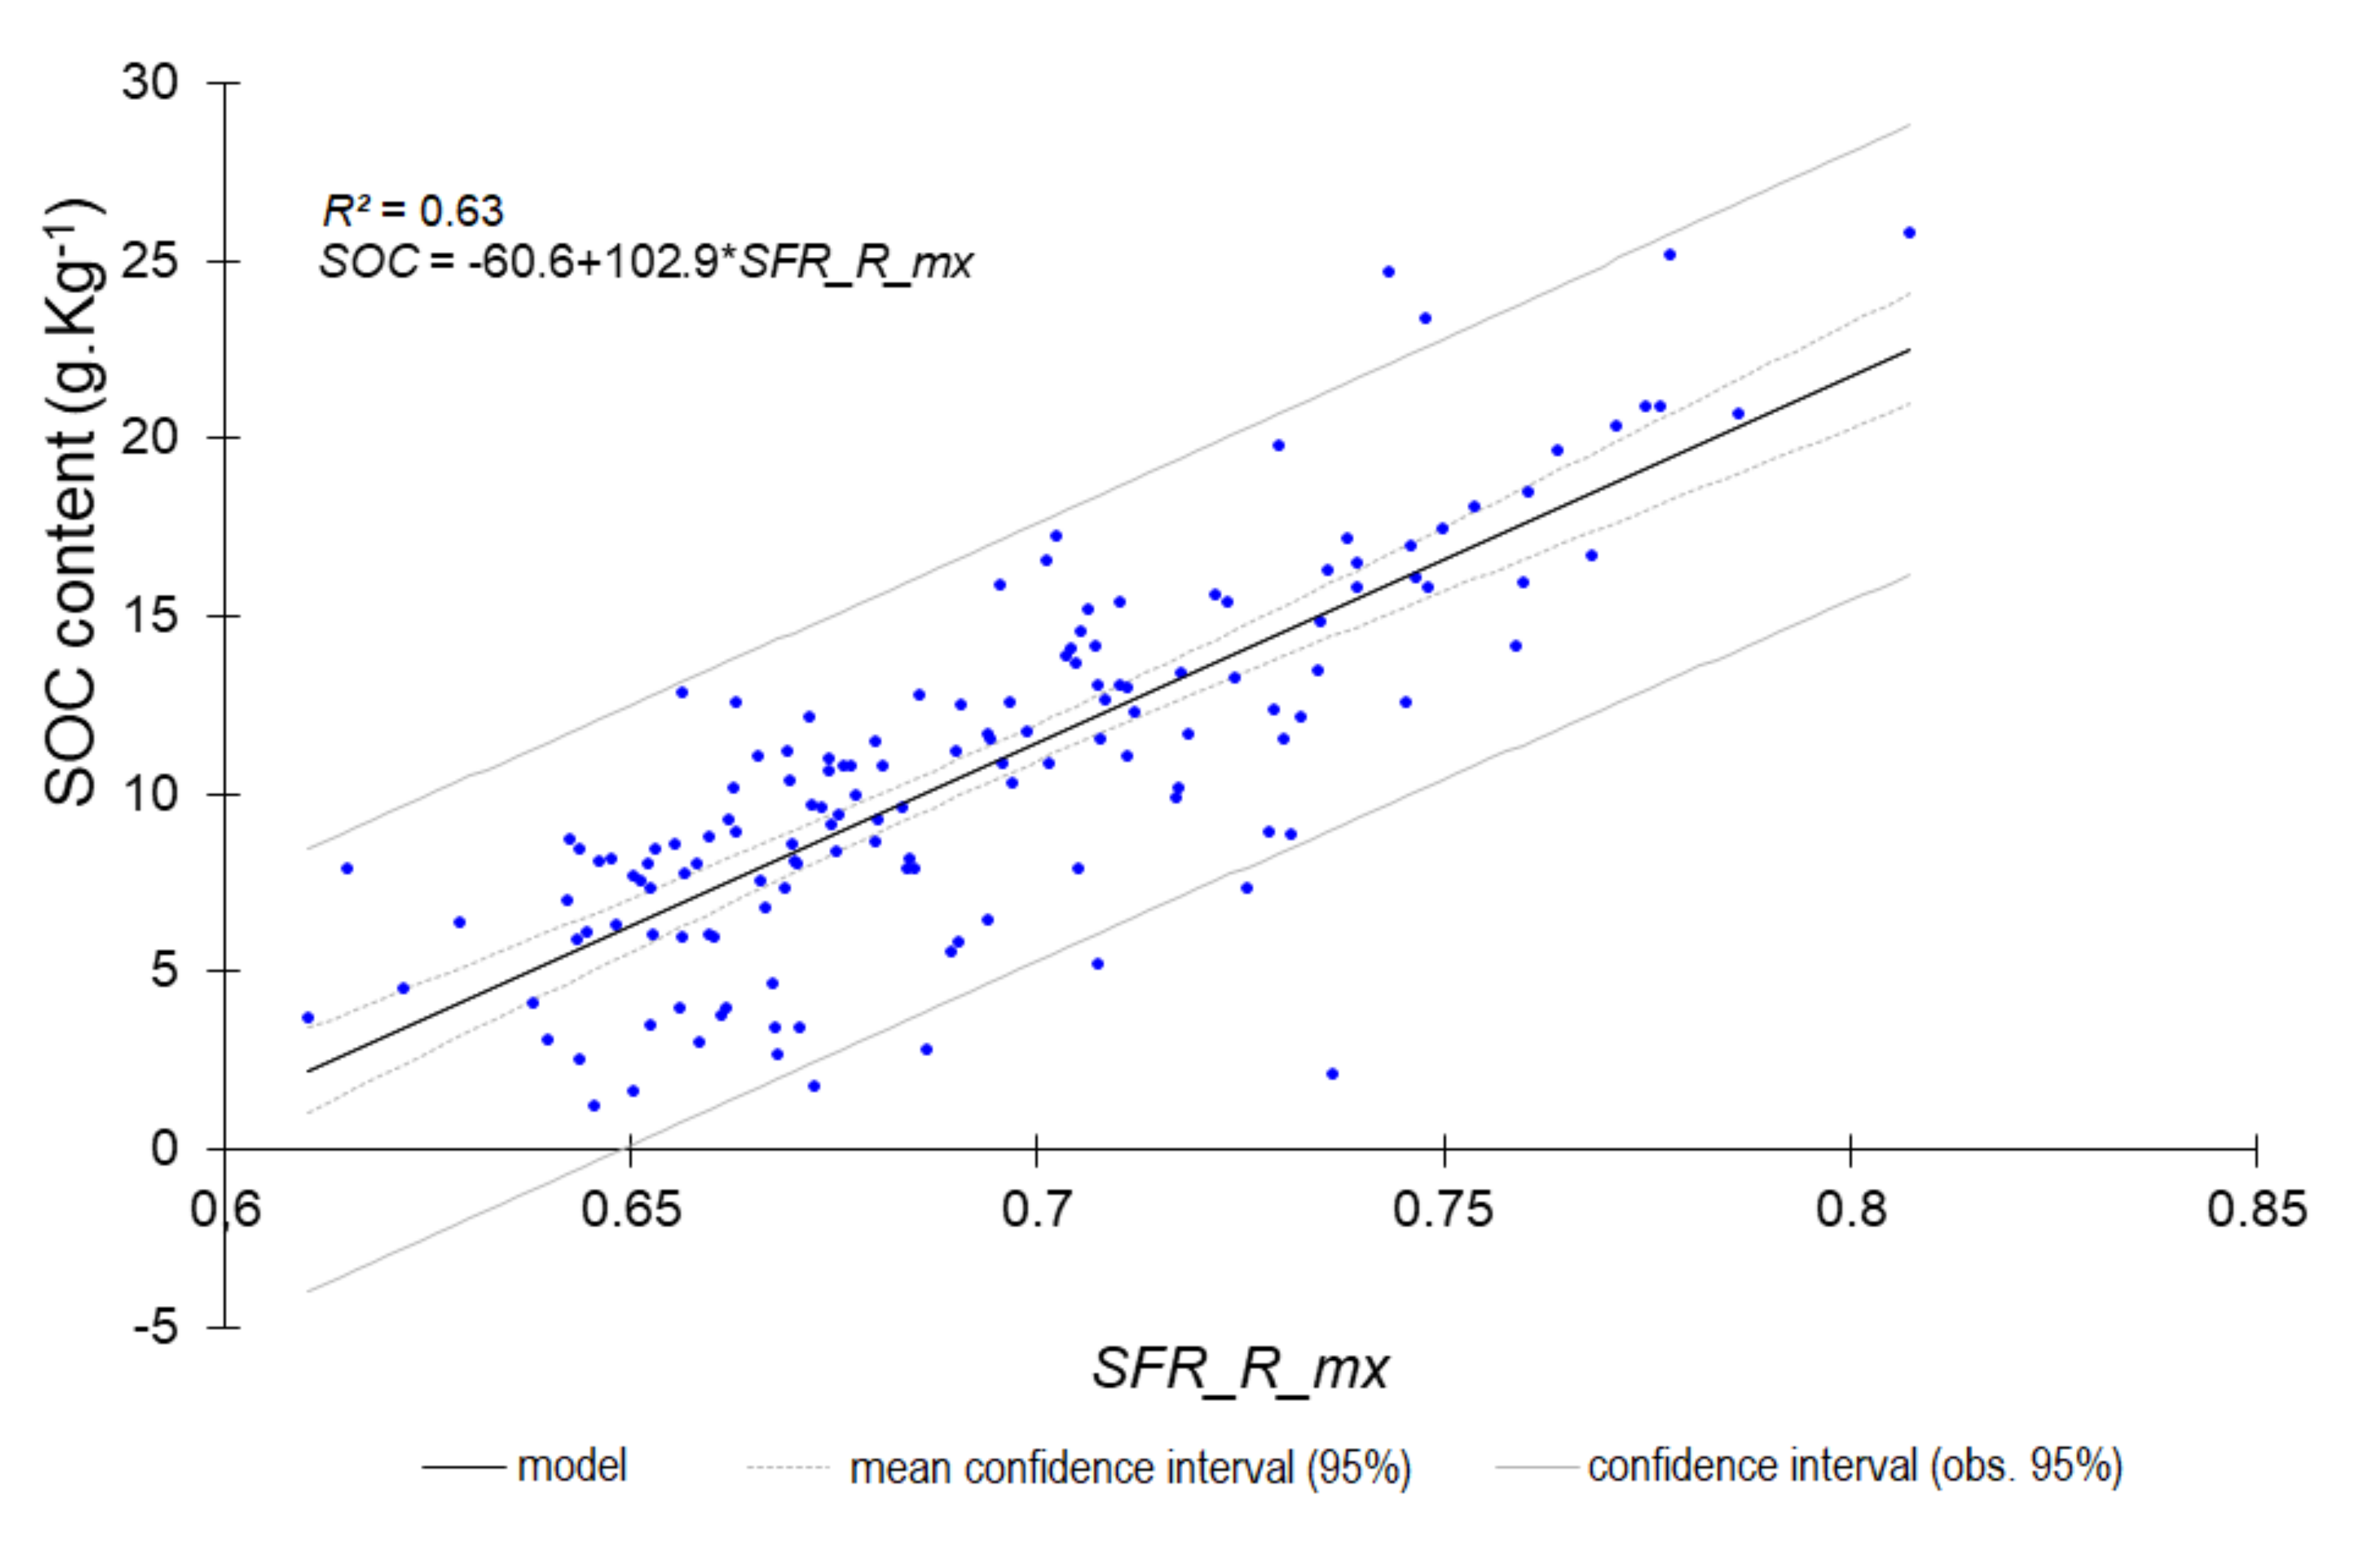
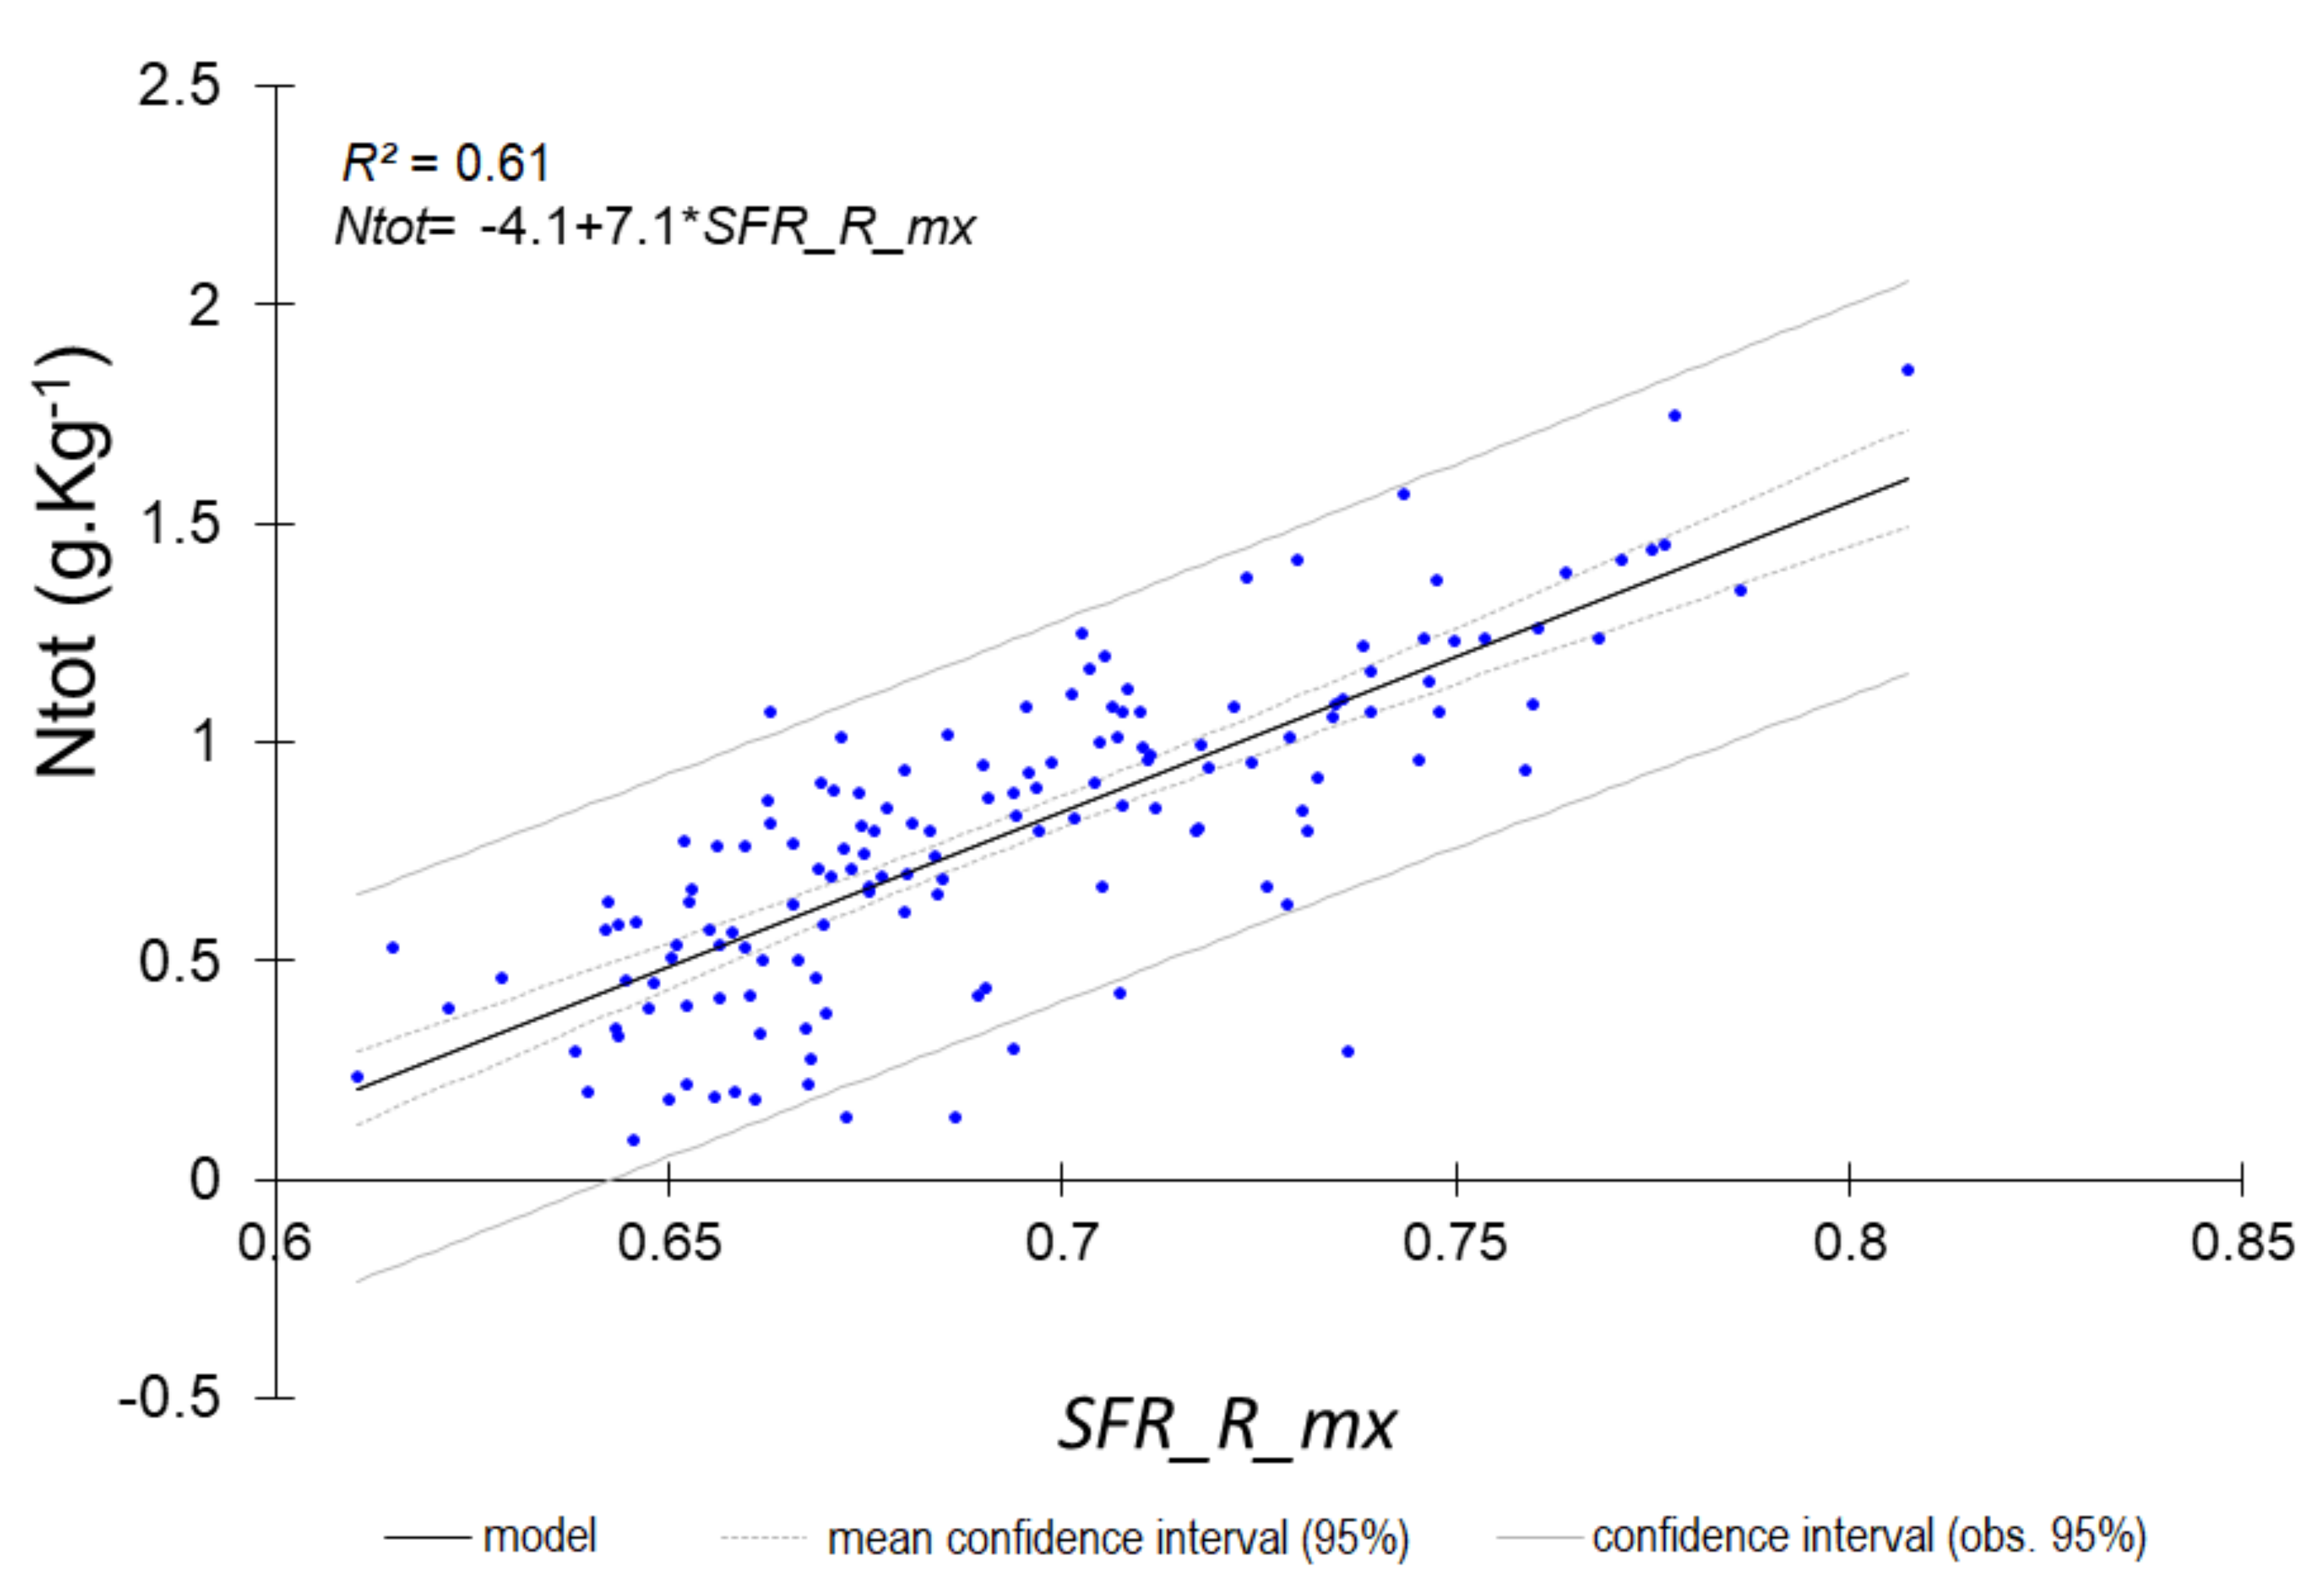
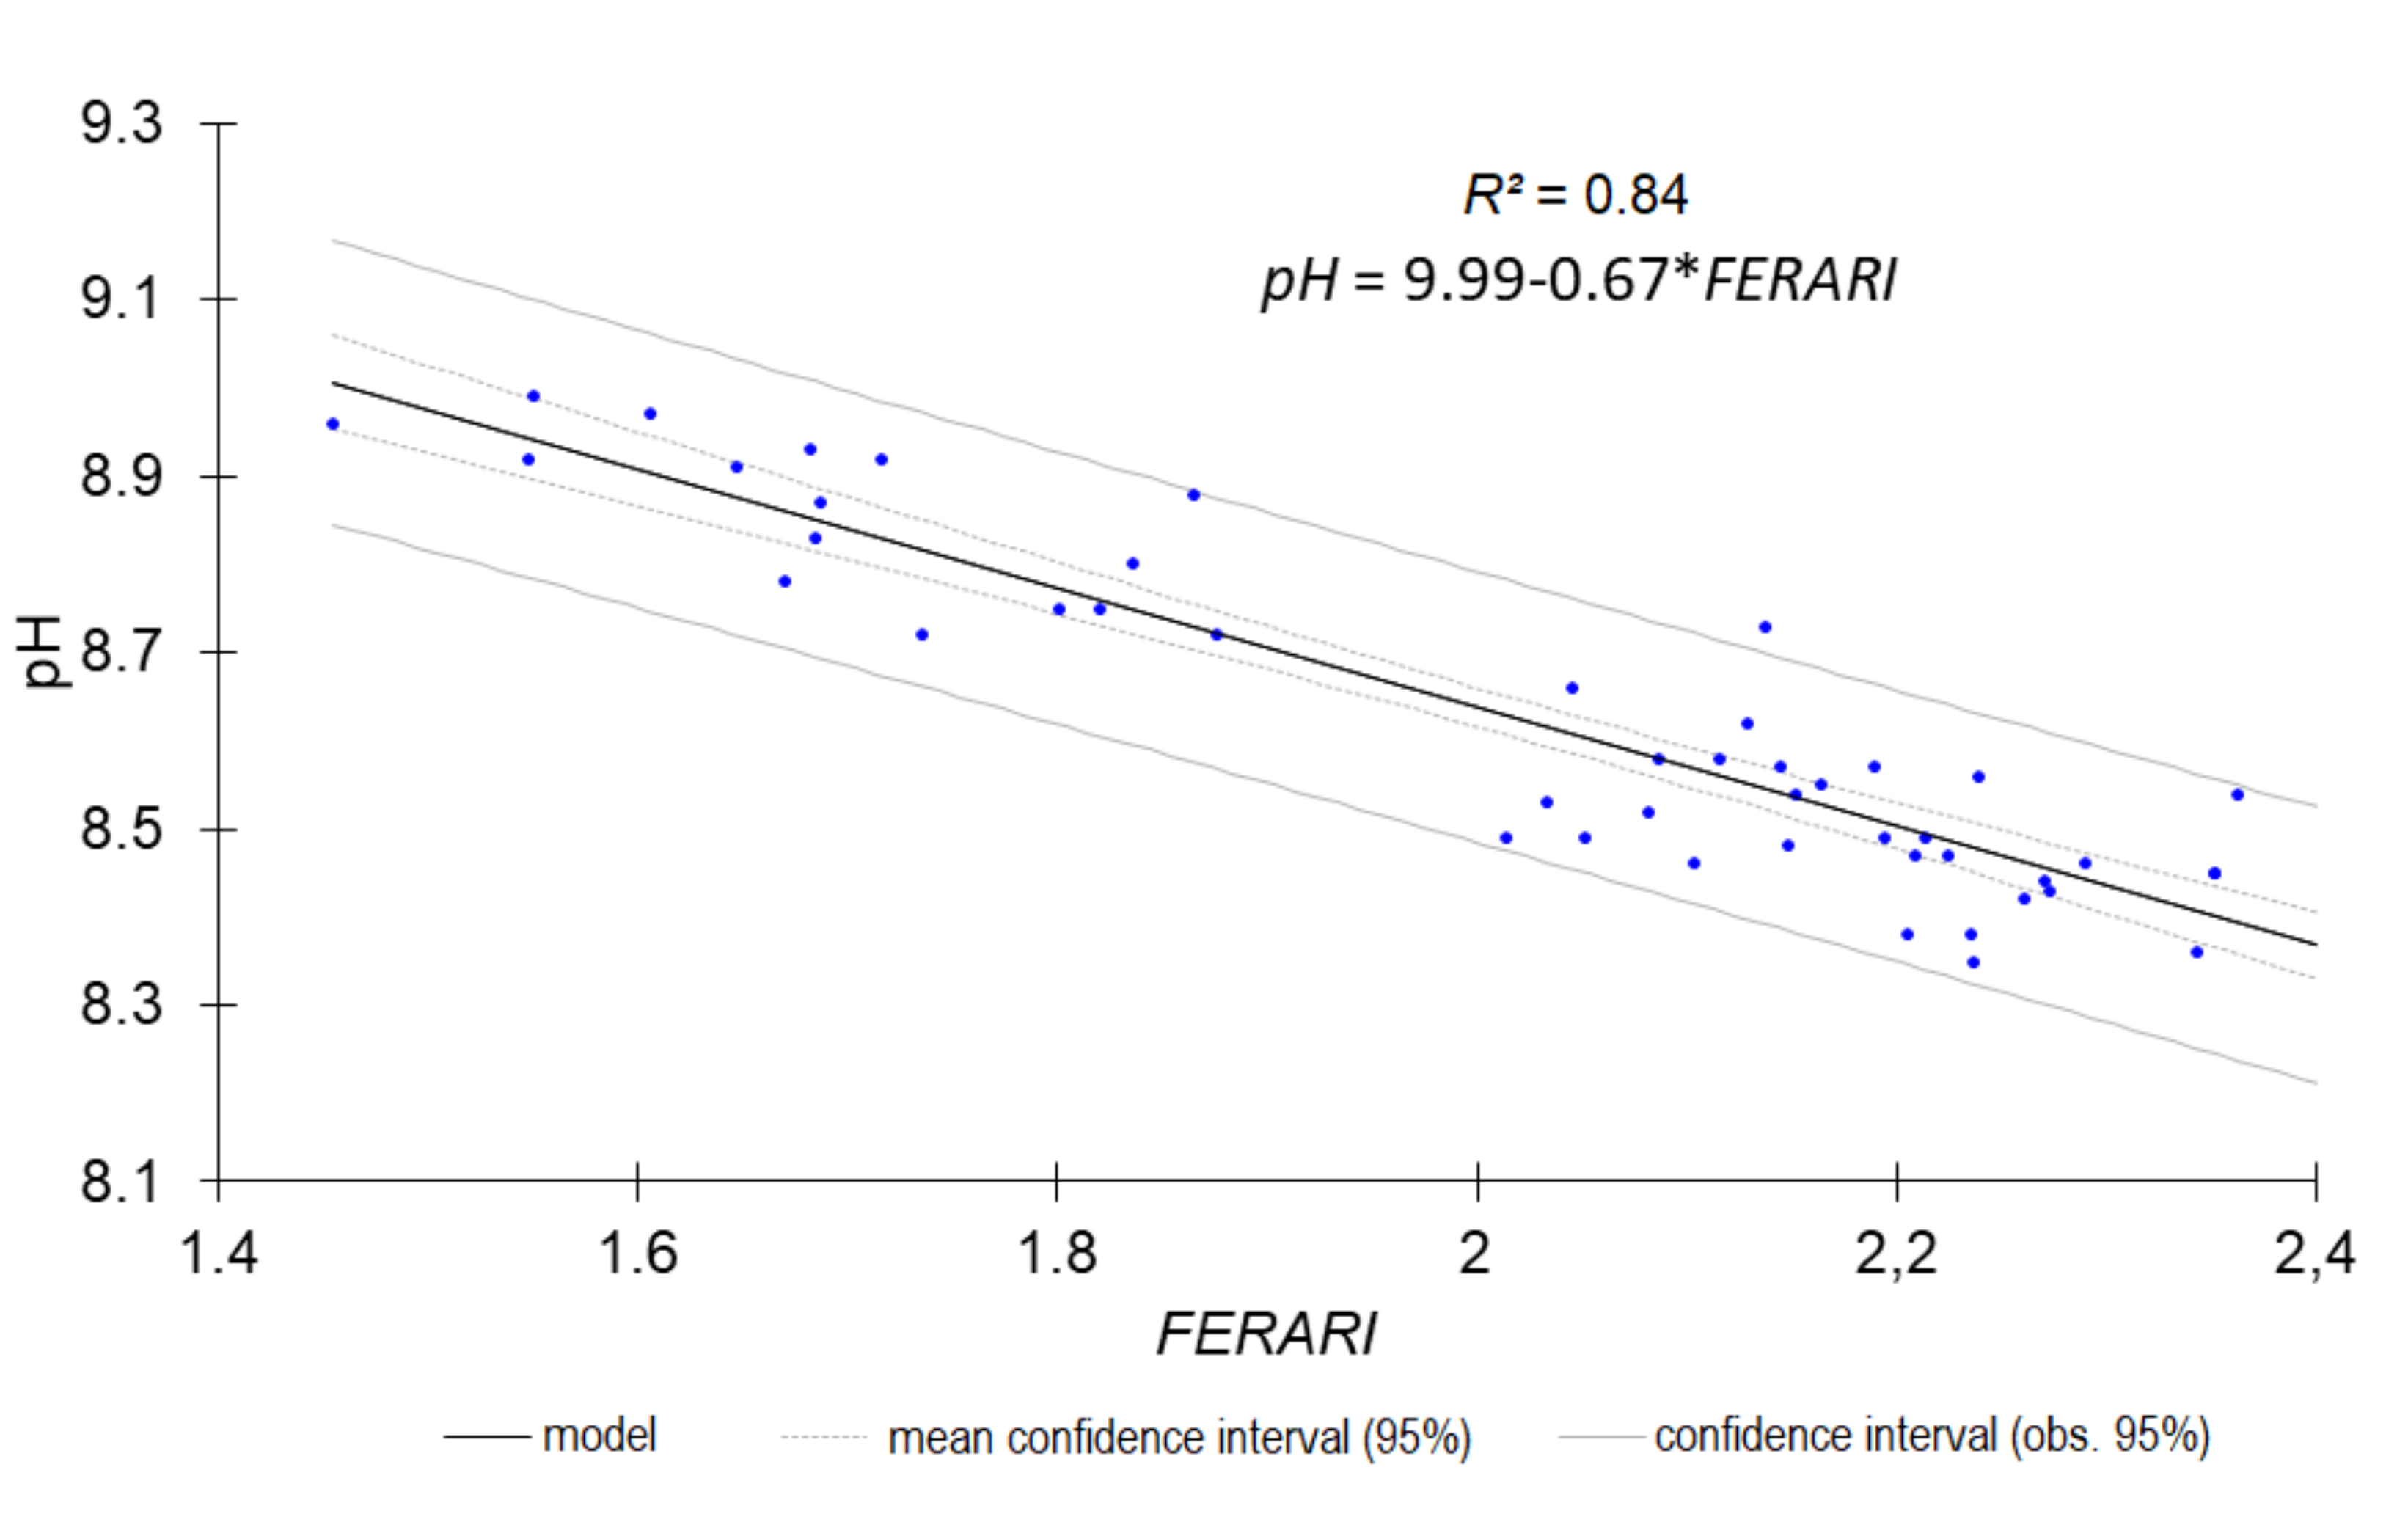
4.2. Fluorescence Single Signals May Provide a Rough Estimate in the Field
4.3. Red or Green Excitations Are Influential
4.4. Possible Extrapolation of These Results and Further Developments
5. Conclusions
Acknowledgments
Author Contributions
Conflicts of Interest
References
- Viscarra Rossel, R.A.; Walvoort, D.J.J.; McBratney, A.B.; Janik, L.J.; Skjemstad, J.O. Visible, near infrared, mid infrared or combined diffuse reflectance spectroscopy for simultaneous assessment of various soil properties. Geoderma 2006, 131, 59–75. [Google Scholar] [CrossRef]
- Ben-Dor, E.; Chabrillat, S.; Demattê, J.A.M.; Taylor, G.R.; Hill, J.; Whiting, M.L.; Sommer, S. Using Imaging Spectroscopy to study soil properties. Remote Sens. Environ. 2009, 113, S38–S55. [Google Scholar] [CrossRef]
- Demattê, J.A.M.; Morgan, C.L.S.; Chabrillat, S.; Rizzo, R.; Franceschini, M.H.D.; Terra, F.D.; Vasques, G.M.; Wetterlind, J. Spectral Sensing from Ground to Space in Soil Science: State of the Art, Applications, Potential, and Perspectives; Thenkabail, P.S., Ed.; Crc Press-Taylor & Francis Group: Boca Raton, FL, USA, 2016; ISBN 978-1-4822-1798-8. [Google Scholar]
- Sauer, M.; Hofkens, J.; Enderlein, J. Handbook of Fluorescence Spectroscopy and Imaging: From Single Molecules to Ensembles; Wiley-VCH: Weinheim, Germany, 2011; ISBN 978-3-527-31669-4. [Google Scholar]
- Bäuerle, D. Thermal, Photophysical, and Photochemical Processes. In Laser Processing and Chemistry; Springer: Berlin/Heidelberg, Germany, 2011; ISBN 978-3-642-17612-8. [Google Scholar]
- Andrade-Eiroa, Á.; Canle, M.; Cerdá, V. Environmental Applications of Excitation-Emission Spectrofluorimetry: An In-Depth Review I. Appl. Spectrosc. Rev. 2013, 48, 1–49. [Google Scholar] [CrossRef]
- Senesi, N.; Miano, T.M.; Provenzano, M.R.; Brunetti, G. Characterization, differentiation, and classification of humic substances by fluorescence spectroscopy. Soil Sci. 1991, 152, 259–271. [Google Scholar] [CrossRef]
- Miano, T.M.; Senesi, N. Synchronous excitation fluorescence spectroscopy applied to soil humic substances chemistry. Sci. Total Environ. 1992, 117, 41–51. [Google Scholar] [CrossRef]
- Barančíková, G.; Senesi, N.; Brunetti, G. Chemical and spectroscopic characterization of humic acids isolated from different Slovak soil types. Geoderma 1997, 78, 251–266. [Google Scholar] [CrossRef]
- Del Vecchio, R.; Blough, N.V. On the Origin of the Optical Properties of Humic Substances. Environ. Sci. Technol. 2004, 38, 3885–3891. [Google Scholar] [CrossRef] [PubMed]
- Fuentes, M.; González-Gaitano, G.; García-Mina, J.M. The usefulness of UV–visible and fluorescence spectroscopies to study the chemical nature of humic substances from soils and composts. Org. Geochem. 2006, 37, 1949–1959. [Google Scholar] [CrossRef]
- Ohno, T. Fluorescence Inner-Filtering Correction for Determining the Humification Index of Dissolved Organic Matter. Environ. Sci. Technol. 2002, 36, 742–746. [Google Scholar] [CrossRef] [PubMed]
- Milori, D.M.B. P.; Galeti, H.V.A.; Martin-Neto, L.; Dieckow, J.; González-Pérez, M.; Bayer, C.; Salton, J. Organic Matter Study of Whole Soil Samples Using Laser-Induced Fluorescence Spectroscopy. Soil Sci. Soc. Am. J. 2006, 70, 57. [Google Scholar] [CrossRef]
- Shirshova, L.T.; Ghabbour, E.A.; Davies, G. Spectroscopic characterization of humic acid fractions isolated from soil using different extraction procedures. Geoderma 2006, 133, 204–216. [Google Scholar] [CrossRef]
- Cho, H.; Lee, H.; Kim, S.; Kim, D.; Lefcourt, A.; Chan, D.; Chung, S.; Kim, M. Potential Application of Fluorescence Imaging for Assessing Fecal Contamination of Soil and Compost Maturity. Appl. Sci. 2016, 6, 243. [Google Scholar] [CrossRef]
- Brunetti, G.; Mezzapesa, G.N.; Traversa, A.; Bonifacio, E.; Farrag, K.; Senesi, N.; D’Orazio, V. Characterization of Clay- and Silt-Sized Fractions and Corresponding Humic Acids Along a Terra Rossa Soil Profile: Soil. CLEAN Soil Air Water 2016, 44, 1375–1384. [Google Scholar] [CrossRef]
- Vliet-Lanoe, B.V. Physico-chemical conditions determining the auto-fluorescence of clay minerals. Pedologie 1980, 30, 369–390. [Google Scholar]
- McMurtrey, J.E.; Chappelle, E.W.; Daughtry, C.S.T.; Kim, M.S. Fluorescence and reflectance of crop residue and soil. J. Soil Water Conserv. 1993, 48, 207–213. [Google Scholar]
- Daughtry, C.S.T.; McMurtrey, J.E.; Chappelle, E.W.; Dulaney, W.P.; Irons, J.R.; Satterwhite, M.B. Potential for Discriminating Crop Residues from Soil by Reflectance and Fluorescence. Agron. J. 1995, 87, 165. [Google Scholar] [CrossRef]
- Henkel, G. The Henkel Glossary of Fluorescent Minerals; Fluorescent Mineral Society: Tarzana, CA, USA, 1989. [Google Scholar]
- Robbins, M. Fluorescence: Gems and Minerals under Ultraviolet Light; Geoscience Press: Phoenix, AZ, USA, 1994; ISBN 0-945005-13-X. [Google Scholar]
- Loisy, C.; Verrecchia, E.; Dufour, P. Microbial origin for pedogenic micrite associated with a carbonate paleosol (Champagne, France). Sediment. Geol. 1999, 126, 193–204. [Google Scholar] [CrossRef]
- Cerovic, Z.G.; Moise, N.; Agati, G.; Latouche, G.; Ben Ghozlen, N.; Meyer, S. New portable optical sensors for the assessment of winegrape phenolic maturity based on berry fluorescence. J. Food Compos. Anal. 2008, 21, 650–654. [Google Scholar] [CrossRef]
- Agati, G.; Cerovic, Z.G.; Pinelli, P.; Tattini, M. Light-induced accumulation of ortho-dihydroxylated flavonoids as non-destructively monitored by chlorophyll fluorescence excitation techniques. Environ. Exp. Bot. 2011, 73, 3–9. [Google Scholar] [CrossRef]
- Ben Ghozlen, N.; Cerovic, Z.G.; Germain, C.; Toutain, S.; Latouche, G. Non-destructive optical monitoring of grape maturation by proximal sensing. Sensors 2010, 10, 10040–10068. [Google Scholar] [CrossRef] [PubMed]
- Bürling, K.; Cerovic, Z.G.; Cornic, G.; Ducruet, J.-M.; Noga, G.; Hunsche, M. Fluorescence-based sensing of drought-induced stress in the vegetative phase of four contrasting wheat genotypes. Environ. Exp. Bot. 2013, 89, 51–59. [Google Scholar] [CrossRef]
- Bellow, S.; Latouche, G.; Brown, S.C.; Poutaraud, A.; Cerovic, Z.G. Optical detection of downy mildew in grapevine leaves: Daily kinetics of autofluorescence upon infection. J. Exp. Bot. 2012, 64, 333–341. [Google Scholar] [CrossRef] [PubMed]
- Vaudour, E.; Leclercq, L.; Gilliot, J.M.; Chaignon, B. Retrospective 70 y-spatial analysis of repeated vine mortality patterns using ancient aerial time series, Pléiades images and multi-source spatial and field data. Int. J. Appl. Earth Obs. Geoinf. 2017, 58, 234–248. [Google Scholar] [CrossRef]
- Vaudour, E.; Girard, M.-C.; Brémond, L.M.; Lurton, L. Caractérisation spatiale des terroirs et constitution des raisins en AOC Côtes-du-Rhône méridionales (Bassin de Nyons-Valréas). J. Int. Sci. Vigne Vin 1998, 32, 169–182. [Google Scholar]
- Vaudour, E. Les Terroirs Viticoles; Dunod: Paris, France, 2003. [Google Scholar]
- Mehra, O.P.; Jackson, M.L. Iron oxide removal from soils and clays by a dithionite—Citrate system buffered with sodium bicarbonate. In Clays and Clay Minerals: Proceedings of the Seventh National Conference; Elsevier: Amsterdam, The Netherlands, 1960; pp. 317–327. [Google Scholar]
- Lichtenthaler, H.K.; Buschmann, C.; Rinderle, U.; Schmuck, G. Application of chlorophyll fluorescence in ecophysiology. Radiat. Environ. Biophys. 1986, 25, 297–308. [Google Scholar] [CrossRef] [PubMed]
- Gitelson, A.A.; Buschmann, C.; Lichtenthaler, H.K. The Chlorophyll Fluorescence Ratio F735/F700 as an Accurate Measure of the Chlorophyll Content in Plants. Remote Sens. Environ. 1999, 69, 296–302. [Google Scholar] [CrossRef]
- Bilger, W.; Veit, M.; Schreiber, L.; Schreiber, U. Measurement of leaf epidermal transmittance of UV radiation by chlorophyll fluorescence. Physiol. Plant. 2006, 101, 754–763. [Google Scholar] [CrossRef]
- Cerovic, Z.G.; Ounis, A.; Cartelat, A.; Latouche, G.; Goulas, Y.; Meyer, S.; Moya, I. The use of chlorophyll fluorescence excitation spectra for the non-destructive in situ assessment of UV-absorbing compounds in leaves. Plant Cell Environ. 2002, 25, 1663–1676. [Google Scholar] [CrossRef]
- Pfündel, E.E.; Ben Ghozlen, N.; Meyer, S.; Cerovic, Z.G. Investigating UV screening in leaves by two different types of portable UV fluorimeters reveals in vivo screening by anthocyanins and carotenoids. Photosynth. Res. 2007, 93, 205–221. [Google Scholar] [CrossRef] [PubMed]
- Agati, G.; Pinelli, P.; Cortés Ebner, S.; Romani, A.; Cartelat, A.; Cerovic, Z.G. Nondestructive Evaluation of Anthocyanins in Olive (Olea europaea ) Fruits by in Situ Chlorophyll Fluorescence Spectroscopy. J. Agric. Food Chem. 2005, 53, 1354–1363. [Google Scholar] [CrossRef] [PubMed]
- Cartelat, A.; Cerovic, Z.G.; Goulas, Y.; Meyer, S.; Lelarge, C.; Prioul, J.-L.; Barbottin, A.; Jeuffroy, M.-H.; Gate, P.; Agati, G.; et al. Optically assessed contents of leaf polyphenolics and chlorophyll as indicators of nitrogen deficiency in wheat (Triticum aestivum L.). Field Crop. Res. 2005, 91, 35–49. [Google Scholar] [CrossRef]
- Geladi, P.; Kowalski, B.R. Partial least-squares regression: A tutorial. Anal. Chim. Acta 1986, 185, 1–17. [Google Scholar] [CrossRef]
- Wold, S.; Sjöström, M.; Eriksson, L. PLS-regression: A basic tool of chemometrics. Chemom. Intell. Lab. Syst. 2001, 58, 109–130. [Google Scholar] [CrossRef]
- Granger, C.W.J.; Ramanathan, R. Improved methods of combining forecasts. J. Forecast. 1984, 3, 197–204. [Google Scholar] [CrossRef]
- O’Rourke, S.M.; Stockmann, U.; Holden, N.M.; McBratney, A.B.; Minasny, B. An assessment of model averaging to improve predictive power of portable vis-NIR and XRF for the determination of agronomic soil properties. Geoderma 2016, 279, 31–44. [Google Scholar] [CrossRef]
- R Core Team. R: A Language and Environment for Statistical Computing; R Core Team: Vienna, Austria, 2013. [Google Scholar]
- Wehrens, R.; Mevik, B.-H. The pls package: Principal component and partial least squares regression in R. J. Stat. Softw. 2007, 18, 1–24. [Google Scholar]
- Hu, G.; Sudduth, K.A.; He, D.; Myers, D.B.; Nathan, M.V. Soil phosphorus and potassium estimation by reflectance spectroscopy. Trans. ASABE 2016, 59, 97–105. [Google Scholar]
- Bellon-Maurel, V.; McBratney, A. Near-infrared (NIR) and mid-infrared (MIR) spectroscopic techniques for assessing the amount of carbon stock in soils—Critical review and research perspectives. Soil Biol. Biochem. 2011, 43, 1398–1410. [Google Scholar] [CrossRef]
- Chang, C.-W.; Laird, D.A.; Mausbach, M.J.; Hurburgh, C.R. Near-infrared reflectance spectroscopy–principal components regression analyses of soil properties. Soil Sci. Soc. Am. J. 2001, 65, 480–490. [Google Scholar] [CrossRef]
- Viscarra Rossel, R.A.; Taylor, H.J.; McBratney, A.B. Multivariate calibration of hyperspectral γ-ray energy spectra for proximal soil sensing. Eur. J. Soil Sci. 2007, 58, 343–353. [Google Scholar] [CrossRef]
- Zsolnay, A.; Baigar, E.; Jimenez, M.; Steinweg, B.; Saccomandi, F. Differentiating with fluorescence spectroscopy the sources of dissolved organic matter in soils subjected to drying. Chemosphere 1999, 38, 45–50. [Google Scholar] [CrossRef]
- Tivet, F.; de Moraes Sá, J.C.; Lal, R.; Milori, D.M.B.P.; Briedis, C.; Letourmy, P.; Pinheiro, L.A.; Borszowskei, P.R.; da Cruz Hartman, D. Assessing humification and organic C compounds by laser-induced fluorescence and FTIR spectroscopies under conventional and no-till management in Brazilian Oxisols. Geoderma 2013, 207, 71–81. [Google Scholar] [CrossRef]
- Korak, J.A.; Wert, E.C.; Rosario-Ortiz, F.L. Evaluating fluorescence spectroscopy as a tool to characterize cyanobacteria intracellular organic matter upon simulated release and oxidation in natural water. Water Res. 2015, 68, 432–443. [Google Scholar] [CrossRef] [PubMed]
- Zancan, S.; Trevisan, R.; Paoletti, M.G. Soil algae composition under different agro-ecosystems in North-Eastern Italy. Agric. Ecosyst. Environ. 2006, 112, 1–12. [Google Scholar] [CrossRef]
- Kögel-Knabner, I. The macromolecular organic composition of plant and microbial residues as inputs to soil organic matter. Soil Biol. Biochem. 2002, 34, 139–162. [Google Scholar] [CrossRef]
- Zornoza, R.; Guerrero, C.; Mataix-Solera, J.; Scow, K.M.; Arcenegui, V.; Mataix-Beneyto, J. Near infrared spectroscopy for determination of various physical, chemical and biochemical properties in Mediterranean soils. Soil Biol. Biochem. 2008, 40, 1923–1930. [Google Scholar] [CrossRef] [PubMed]
- D’Acqui, L.P.; Pucci, A.; Janik, L.J. Soil properties prediction of western Mediterranean islands with similar climatic environments by means of mid-infrared diffuse reflectance spectroscopy. Eur. J. Soil Sci. 2010, 61, 865–876. [Google Scholar] [CrossRef]
- Summers, D.; Lewis, M.; Ostendorf, B.; Chittleborough, D. Visible near-infrared reflectance spectroscopy as a predictive indicator of soil properties. Ecol. Indic. 2011, 11, 123–131. [Google Scholar] [CrossRef]
- P Leone, A.; A Viscarra-Rossel, R.; Amenta, P.; Buondonno, A. Prediction of soil properties with PLSR and vis-NIR spectroscopy: Application to mediterranean soils from Southern Italy. Curr. Anal. Chem. 2012, 8, 283–299. [Google Scholar] [CrossRef]
- Weindorf, D.C.; Chakraborty, S.; Herrero, J.; Li, B.; Castañeda, C.; Choudhury, A. Simultaneous assessment of key properties of arid soil by combined PXRF and Vis-NIR data: Arid soil assessment by PXRF and Vis-NIR. Eur. J. Soil Sci. 2016, 67, 173–183. [Google Scholar] [CrossRef]
- Kuang, B.; Mouazen, A.M. Calibration of visible and near infrared spectroscopy for soil analysis at the field scale on three European farms. Eur. J. Soil Sci. 2011, 62, 629–636. [Google Scholar] [CrossRef]
- Wang, D.; Chakraborty, S.; Weindorf, D.C.; Li, B.; Sharma, A.; Paul, S.; Ali, M.N. Synthesized use of VisNIR DRS and PXRF for soil characterization: Total carbon and total nitrogen. Geoderma 2015, 243, 157–167. [Google Scholar] [CrossRef]
- Vaudour, E.; Gomez, C.; Fouad, Y.; Gilliot, J.-M.; Lagacherie, P. Potential of SENTINEL-2 images for predicting common topsoil properties over Temperate and Mediterranean agroecosystems. In Proceedings of the EGU General Assembly 2017, Vienna, Austria, 23–28 April 2017; Volume 19. [Google Scholar]
- Islam, K.; Singh, B.; McBratney, A. Simultaneous estimation of several soil properties by ultra-violet, visible, and near-infrared reflectance spectroscopy. Aust. J. Soil Res. 2003, 41, 1101. [Google Scholar] [CrossRef]

| Signals | Excitation Wavelength (nm) | Emission Wavelength (nm) ± Bandwidth | Sensor Version |
|---|---|---|---|
| VBF_UV_flp | 335 | 417 ± 30 | Multiplex 330 |
| GF_UV_flp | 335 | 550 ± 50 | Multiplex 330 |
| FRF_UV_flp | 335 | 750 ± 30 | Multiplex 330 |
| GF_B_flp | 455 | 550 ± 50 | Multiplex 330 |
| FRF_B_flp | 455 | 750 ± 30 | Multiplex 330 |
| BGF_UV_mx | 373 | 447 ± 30 | Multiplex 3 |
| RF_UV_mx | 373 | 688 ± 11 | Multiplex 3 |
| FRF_UV_mx | 373 | 750 ± 30 | Multiplex 3 |
| GR_G_mx | 516 | 516 leak | Multiplex 3 |
| RF_G_mx | 516 | 688 ± 11 | Multiplex 3 |
| FRF_G_mx | 516 | 750 ± 30 | Multiplex 3 |
| RR_R_mx | 635 | 635 leak | Multiplex 3 |
| RF_R_mx | 635 | 688 ± 11 | Multiplex 3 |
| FRF_R_mx | 635 | 750 ± 30 | Multiplex 3 |
| Fluorescence Index | Description | Reference | Formula | Sensor Version |
|---|---|---|---|---|
| BRR_flp | Blue-to-red emission ratio | [32] | VBF_UV_flp/FRF_UV_flp | Multiplex 330 |
| SFR_G_mx | Simple chlorophyll fluorescence ratio | [32,33] | FRF_G_mx/RF_G_mx | Multiplex 3 |
| SFR_R_mx | Simple chlorophyll fluorescence ratio | [32,33] | FRF_R_mx/RF_R_mx | Multiplex 3 |
| FLAV_mx | Flavonols index | [34,35] | Log(FRF_R_mx/FRF_UV_mx) | Multiplex 3 |
| FER_RG_mx | Fluorescence Excitation Ratio | [36] | FRF_R_mx/FRF_G_mx | Multiplex 3 |
| ANTH_RG_mx | Anthocyanins index | [37] | Log(FRF_R_mx/FRF_G_mx) | Multiplex 3 |
| NBI_G_mx | Nitrogen Balance Index | [38] | FRF_UV_mx/RF_G_mx | Multiplex 3 |
| NBI_R_mx | Nitrogen Balance Index | [38] | FRF_UV_mx RF_R_mx | Multiplex 3 |
| FERARI | Anthocyanin Relative Index | [25] | Log(1/FRF_R_mx) | Multiplex 3 |
| Soil Property | Description | Unit | All Horizons | Topsoil Horizons | ||||||||
|---|---|---|---|---|---|---|---|---|---|---|---|---|
| Sample Size | Min | Mean | Max | sd | Sample Size | Min | Mean | Max | sd | |||
| SOC | soil organic C | g·Kg−1 | 146 | 1.27 | 10.7 | 25.8 | 5.1 | 112 | 2.6 | 12.1 | 25.8 | 4.73 |
| CaCO3 | total CaCO3 | g·Kg−1 | 146 | 27 | 398.6 | 767 | 146.0 | 112 | 53 | 396 | 689 | 126.7 |
| Iron | free iron | g/100 g | 146 | 0.32 | 1.00 | 1.92 | 0.36 | 112 | 0.39 | 1.02 | 1.92 | 0.35 |
| Clay | gr. fr. < 2 μm | g·Kg−1 | 146 | 124 | 274 | 477 | 84.9 | 112 | 148 | 280 | 477 | 78.6 |
| Fine silt | gr. fr. 2–20 μm | g·Kg−1 | 146 | 33 | 93.6 | 188 | 30.4 | 112 | 43 | 93.4 | 188 | 27.5 |
| Coarse silt | gr. fr. 20–50 μm | g·Kg−1 | 146 | 2 | 45 | 96 | 14.6 | 112 | 2 | 45.5 | 79 | 11.3 |
| Fine sand | gr. fr. 50–200 μm | g·Kg−1 | 146 | 13 | 101.8 | 387 | 55.1 | 112 | 42 | 99 | 229 | 43.4 |
| Coarse sand | gr. fr. 200 μm–2 mm | g·Kg−1 | 146 | 2 | 80.7 | 202 | 38.8 | 112 | 9 | 78.9 | 166 | 32.8 |
| CN | C/N ratio | - | 146 | 3.9 | 13.7 | 21.6 | 2.44 | 112 | 3.9 | 13.6 | 20.9 | 2.03 |
| Ntot | total nitrogen | g·Kg−1 | 146 | 0.09 | 0.79 | 1.85 | 0.35 | 112 | 0.30 | 0.89 | 1.85 | 0.31 |
| pH | water pH | - | 48 | 8.35 | 8.62 | 8.99 | 0.19 | |||||
| CEC | cation exchange capacity | cmol+.Kg−1 | 48 | 7.44 | 18.1 | 33.5 | 6.8 | |||||
| Ca | ex calcium | cmol+.Kg−1 | 48 | 9.11 | 18.9 | 33.2 | 6.48 | |||||
| Mg | ex magnesium | cmol+.Kg−1 | 48 | 0.05 | 0.42 | 1.42 | 0.26 | |||||
| Fe_cobalti | ex iron | cmol+.Kg−1 | 48 | 0 | 0.009 | 0.022 | 0.006 | |||||
| Al | ex aluminum | cmol+.Kg−1 | 48 | 0 | 0.041 | 0.103 | 0.028 | |||||
| Na | ex sodium | cmol+.Kg−1 | 48 | 0.010 | 0.024 | 0.042 | 0.009 | |||||
| P | assimilable phosphorus | g·Kg−1 | 48 | 0 | 0.007 | 0.05 | 0.011 | |||||
| K | ex potassium | cmol+.Kg−1 | 48 | 0.118 | 0.307 | 0.700 | 0.131 | |||||
| Variables | CN | Ntot | SOC | CaCO3 | Fe | Clay | Fine Silt | Coarse Silt | Fine Sand | Coarse Sand |
|---|---|---|---|---|---|---|---|---|---|---|
| CN | 1.00 | |||||||||
| Ntot | −0.14 | 1.00 | ||||||||
| SOC | 0.12 | 0.96 * | 1.00 | |||||||
| CaCO3 | 0.15 | −0.55 * | −0.53 * | 1.00 | ||||||
| Fe | −0.07 | 0.63 * | 0.64 * | −0.87 * | 1.00 | |||||
| Clay | −0.06 | 0.63 * | 0.62 * | −0.78 * | 0.90 * | 1.00 | ||||
| Fine silt | −0.14 | 0.49 * | 0.47 * | −0.85 * | 0.78 * | 0.71 * | 1.00 | |||
| Coarse silt | −0.21 * | 0.29 * | 0.27 * | −0.68 * | 0.49 * | 0.38 * | 0.54 * | 1.00 | ||
| Fine sand | −0.21 * | −0.03 | −0.07 | −0.41 * | 0.00 | −0.15 | 0.19 * | 0.57 * | 1.00 | |
| Coarse sand | 0.06 | 0.24 * | 0.26 * | −0.57 * | 0.52 * | 0.28 * | 0.41 * | 0.14 | 0.13 | 1.00 |
| Variables | CN | Ntot | SOC | CaCO3 | Fe | Clay | Fine Silt | Coarse Silt | Fine Sand | Coarse Sand |
|---|---|---|---|---|---|---|---|---|---|---|
| CN | 1.00 | |||||||||
| Ntot | −0.01 | 1.00 | ||||||||
| SOC | 0.30 * | 0.94 * | 1.00 | |||||||
| CaCO3 | −0.15 | −0.62 * | −0.65 * | 1.00 | ||||||
| Fe | 0.17 | 0.66 * | 0.69 * | −0.89 * | 1.00 | |||||
| Clay | 0.18 | 0.63 * | 0.65 * | −0.80 * | 0.89 * | 1.00 | ||||
| Fine silt | 0.16 | 0.54 * | 0.56 * | −0.87 * | 0.80 * | 0.75 * | 1.00 | |||
| Coarse silt | 0.15 | 0.26 * | 0.31 * | −0.56 * | 0.47 * | 0.31 * | 0.41 | 1.00 | ||
| Fine sand | −0.08 | −0.02 | −0.03 | −0.22 * | −0.13 | −0.34 * | 0.03 | 0.38 * | 1.00 | |
| Coarse sand | 0.07 | 0.39 * | 0.41 * | −0.75 * | 0.66 * | 0.42 * | 0.59 | 0.28 * | 0.23 * | 1.00 |
| Variables | CN | Ntot | SOC | CaCO3 | Fe | Clay | Fine Silt | Coarse Silt | Fine Sand | Coarse Sand | pH | CEC | Fe–Cobalti | Ca | Mg | Na | Al | P | K |
|---|---|---|---|---|---|---|---|---|---|---|---|---|---|---|---|---|---|---|---|
| CN | 1.00 | ||||||||||||||||||
| Ntot | −0.37 * | 1.00 | |||||||||||||||||
| SOC | −0.14 | 0.96 * | 1.00 | ||||||||||||||||
| CaCO3 | 0.51 * | −0.65 * | −0.56 * | 1.00 | |||||||||||||||
| Fe | −0.44 * | 0.75 * | 0.70 * | −0.87 * | 1.00 | ||||||||||||||
| Clay | −0.39 * | 0.75 * | 0.71 * | −0.78 * | 0.93 * | 1.00 | |||||||||||||
| Fine silt | −0.53 * | 0.68 * | 0.58 * | −0.84 * | 0.80 * | 0.72 * | 1.00 | ||||||||||||
| Coarse silt | −0.57 * | 0.39 * | 0.27 | −0.78 * | 0.52 * | 0.44 * | 0.69 * | 1.00 | |||||||||||
| Fine sand | −0.34 * | 0.02 | −0.08 | −0.58 * | 0.16 | 0.05 | 0.35 * | 0.74 * | 1.00 | ||||||||||
| Coarse sand | −0.02 * | 0.22 | 0.22 | −0.40 * | 0.37 * | 0.15 | 0.21 | 0.04 | 0.04 | 1.00 | |||||||||
| pH | 0.46 * | −0.87 * | −0.81 * | 0.87 * | −0.82 * | −0.78 * | −0.81 * | −0.69 * | −0.37 * | −0.27 | 1.00 | ||||||||
| CEC | −0.41 * | 0.80 * | 0.75 * | −0.83 * | 0.93 * | 0.96 * | 0.81 * | 0.50 * | 0.12 | 0.20 | −0.84 * | 1.00 | |||||||
| Fe–cobalti | −0.30 * | 0.55 * | 0.53 * | −0.68 * | 0.64 * | 0.56 * | 0.65 * | 0.56 * | 0.34 * | 0.23 | −0.70 * | 0.59 * | 1.00 | ||||||
| Ca | −0.40 * | 0.79 * | 0.75 * | −0.82 * | 0.93 * | 0.95 * | 0.80 * | 0.50 * | 0.12 | 0.20 | −0.84 * | 1.00 * | 0.61 * | 1.00 | |||||
| Mg | −0.31 * | 0.76 * | 0.73 * | −0.53 * | 0.60 * | 0.68 * | 0.47 * | 0.25 | 0.02 | 0.15 | −0.71 * | 0.67 * | 0.51 * | 0.66 * | 1.00 | ||||
| Na | −0.19 * | 0.35 * | 0.32 * | −0.57 * | 0.68 * | 0.70 * | 0.61 * | 0.37 * | 0.05 | 0.09 | −0.47 * | 0.77 * | 0.34 * | 0.77 * | 0.21 | 1.00 | |||
| Al | −0.25 * | 0.55 * | 0.54 * | −0.63 * | 0.60 * | 0.53 * | 0.61 * | 0.52 * | 0.29 * | 0.21 | −0.68 * | 0.56 * | 0.99 * | 0.58 * | 0.53 * | 0.29 * | 1.00 | ||
| P | −0.04 | 0.26 | 0.27 | 0.02 | 0.02 | 0.01 | −0.07 | −0.02 | −0.06 | 0.03 | −0.16 | −0.06 | 0.02 | −0.08 | 0.32 * | −0.39 * | 0.04 | 1.00 | |
| K | −0.43 * | 0.68 * | 0.60 * | −0.48 * | 0.41 * | 0.43 * | 0.46 * | 0.43 * | 0.21 | 0.09 | −0.68 * | 0.40 * | 0.40 * | 0.38 * | 0.68 * | −0.12 | 0.40 * | 0.65 * | 1.00 |
| Soil Property | Reflectance (2151 Bands) | Multiplex (21 Signals & Indices) | ||||||
|---|---|---|---|---|---|---|---|---|
| R²cv | RMSEcv | RPD | NLV | R²cv | RMSEcv | RPD | NLV | |
| CN | −0.05 | 2.5 | 0.98 | 9 | 0.01 | 2.42 | 1.01 | 1 |
| Ntot | 0.92 | 0.099 | 3.57 | 13 | 0.76 | 0.174 | 2.03 | 4 |
| SOC | 0.81 | 2.21 | 2.31 | 9 | 0.72 | 2.68 | 1.90 | 7 |
| CaCO3 | 0.88 | 50.0 | 2.92 | 6 | 0.84 | 58.7 | 2.49 | 7 |
| Iron | 0.90 | 0.114 | 3.17 | 12 | 0.82 | 0.153 | 2.36 | 7 |
| Clay | 0.78 | 40.0 | 2.12 | 7 | 0.63 | 51.4 | 1.65 | 8 |
| Fine silt | 0.69 | 16.8 | 1.81 | 9 | 0.49 | 21.7 | 1.40 | 4 |
| Coarse silt | 0.47 | 10.6 | 1.38 | 11 | 0.49 | 10.4 | 1.40 | 10 |
| Fine sand | 0.66 | 31.9 | 1.73 | 13 | 0.54 | 37.4 | 1.47 | 14 |
| Coarse sand | 0.53 | 26.6 | 1.46 | 13 | 0.41 | 29.7 | 1.31 | 9 |
| pH | 0.90 | 0.062 | 3.11 | 8 | 0.87 | 0.07 | 2.83 | 10 |
| CEC | 0.79 | 3.04 | 2.24 | 8 | 0.78 | 3.15 | 2.15 | 6 |
| Fe–cobalti | 0.46 | 0.004 | 1.37 | 2 | 0.47 | 0.005 | 1.38 | 2 |
| ex Ca | 0.78 | 2.98 | 2.18 | 8 | 0.76 | 3.17 | 2.04 | 3 |
| ex Mg | 0.32 | 0.213 | 1.22 | 3 | 0.32 | 0.21 | 1.23 | 1 |
| ex Na | 0.49 | 0.006 | 1.42 | 4 | 0.47 | 0.006 | 1.26 | 3 |
| ex Al | 0.42 | 0.0215 | 1.32 | 2 | 0.44 | 0.0211 | 1.35 | 2 |
| P | 0.12 | 0.011 | 1.08 | 3 | -0.07 | 0.0117 | 0.97 | 4 |
| ex K | 0.42 | 0.098 | 1.33 | 8 | 0.32 | 0.107 | 1.22 | 1 |
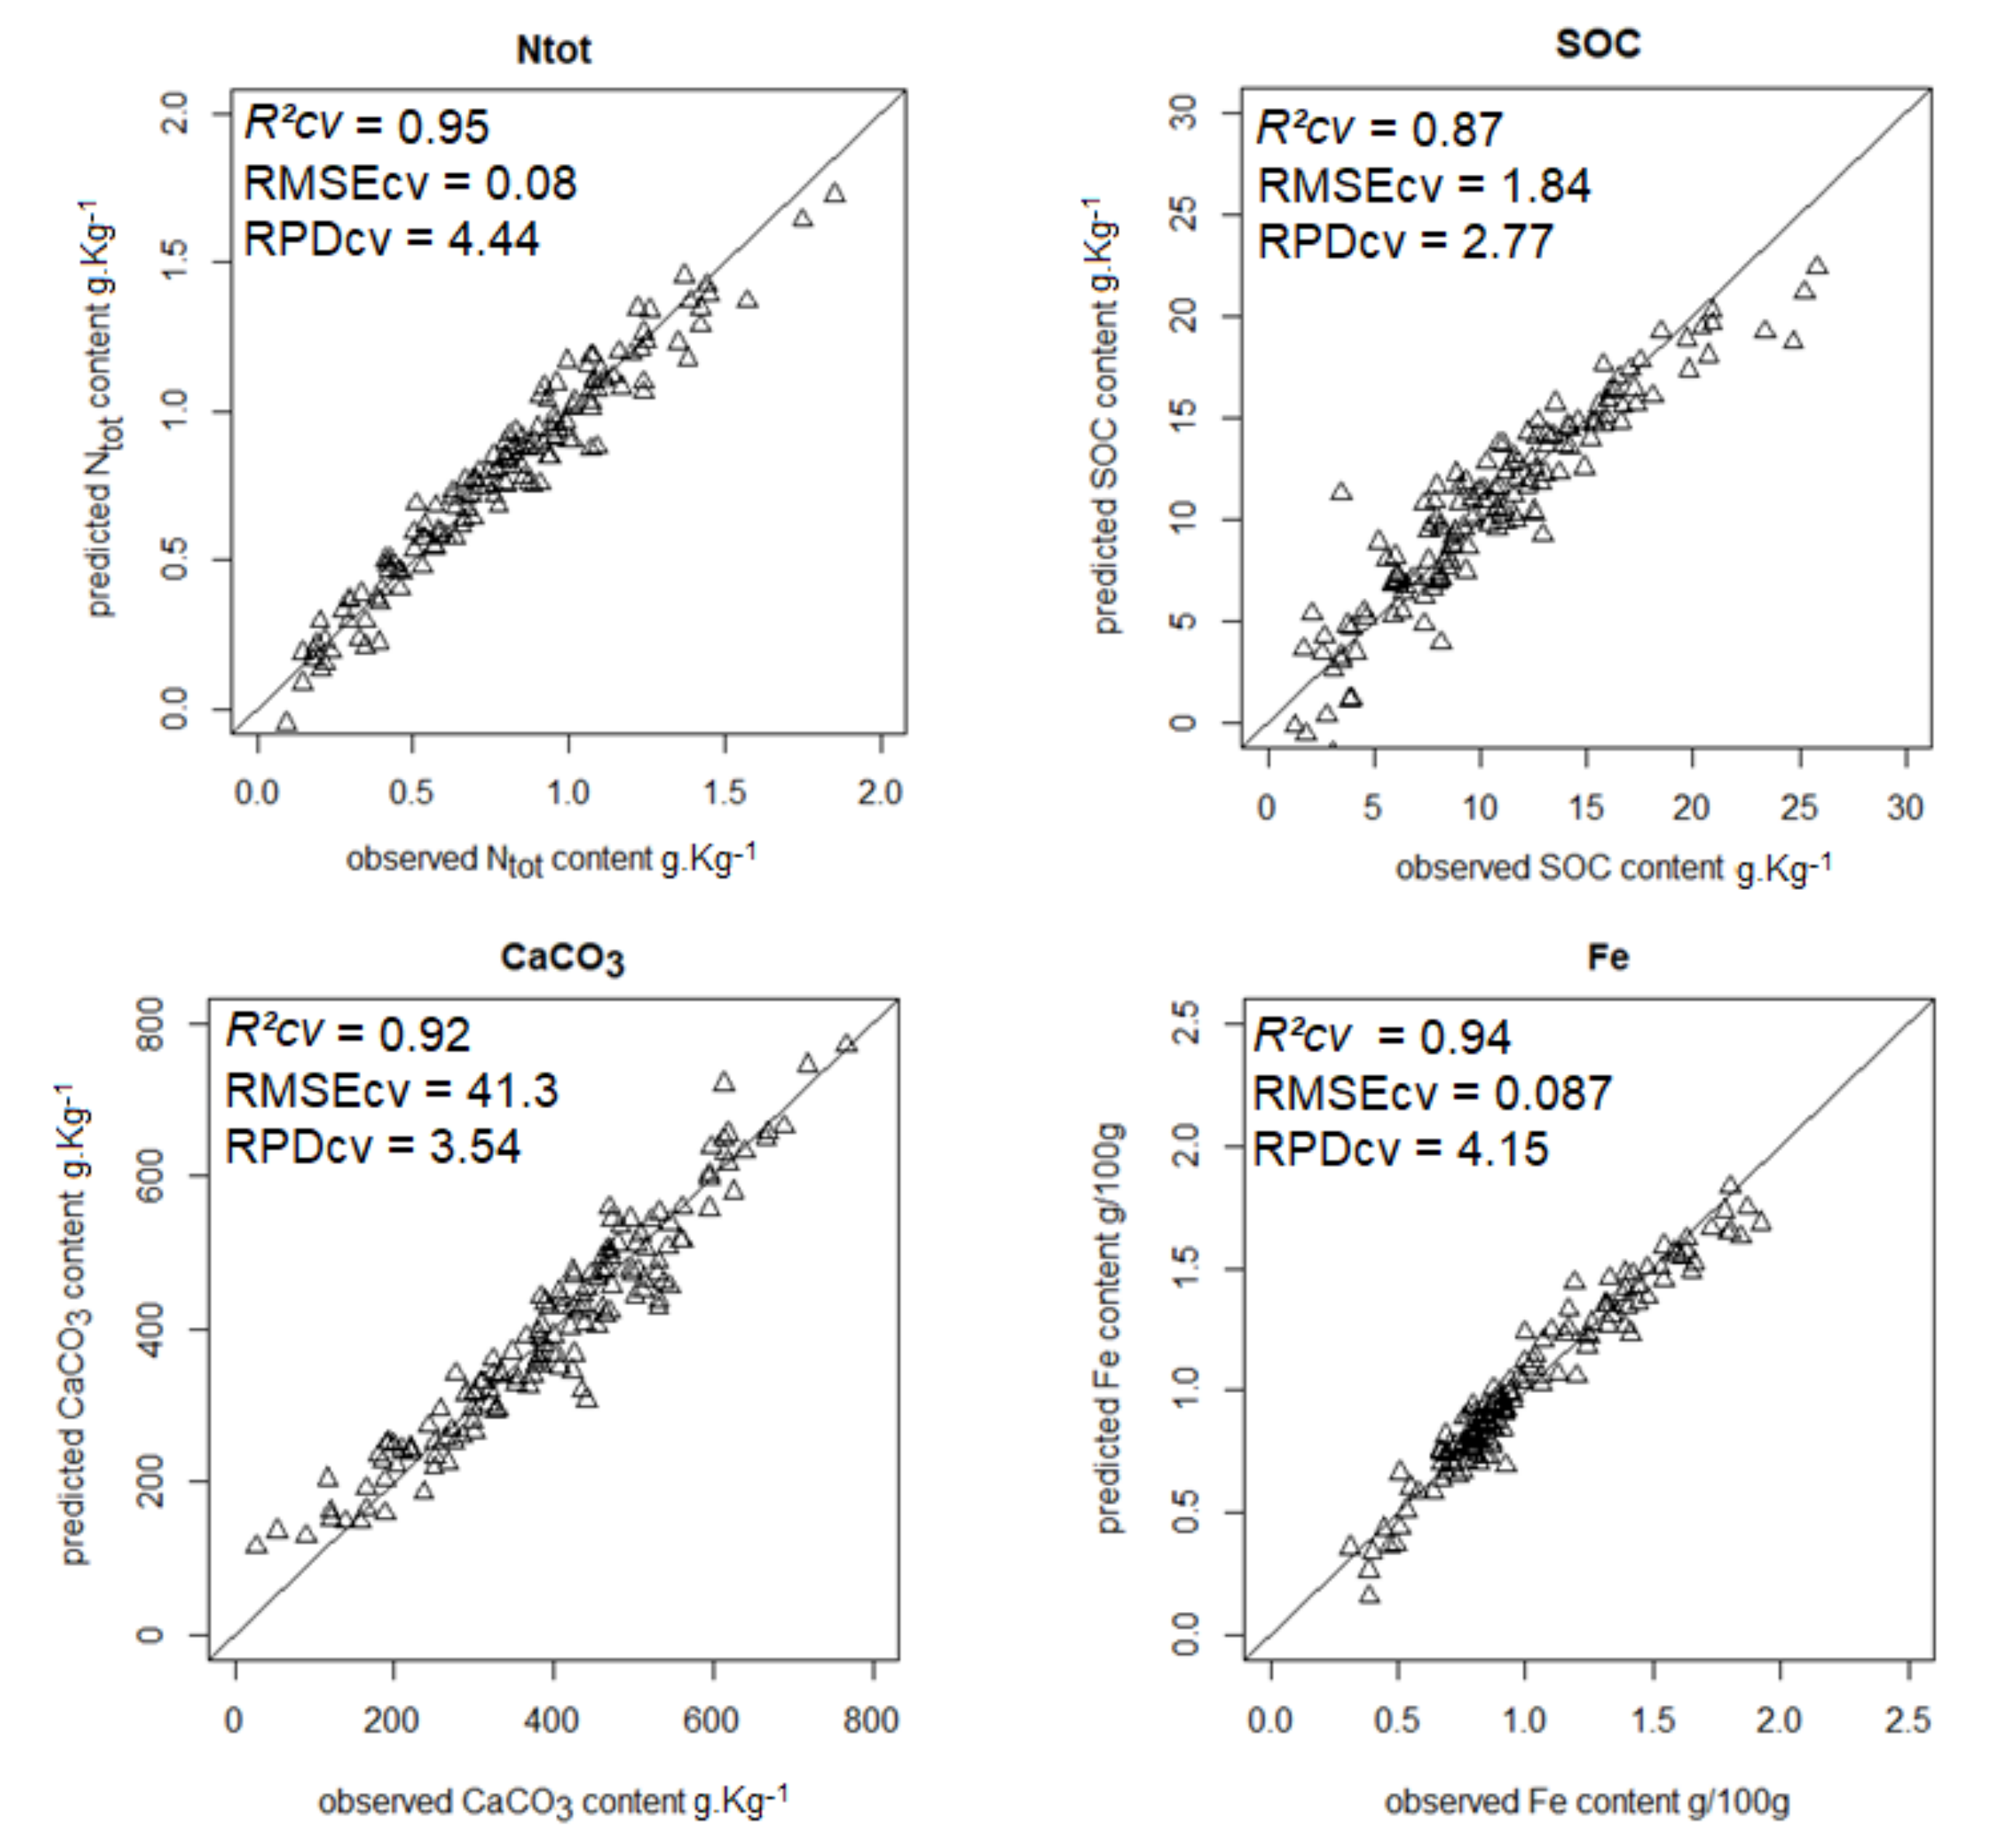
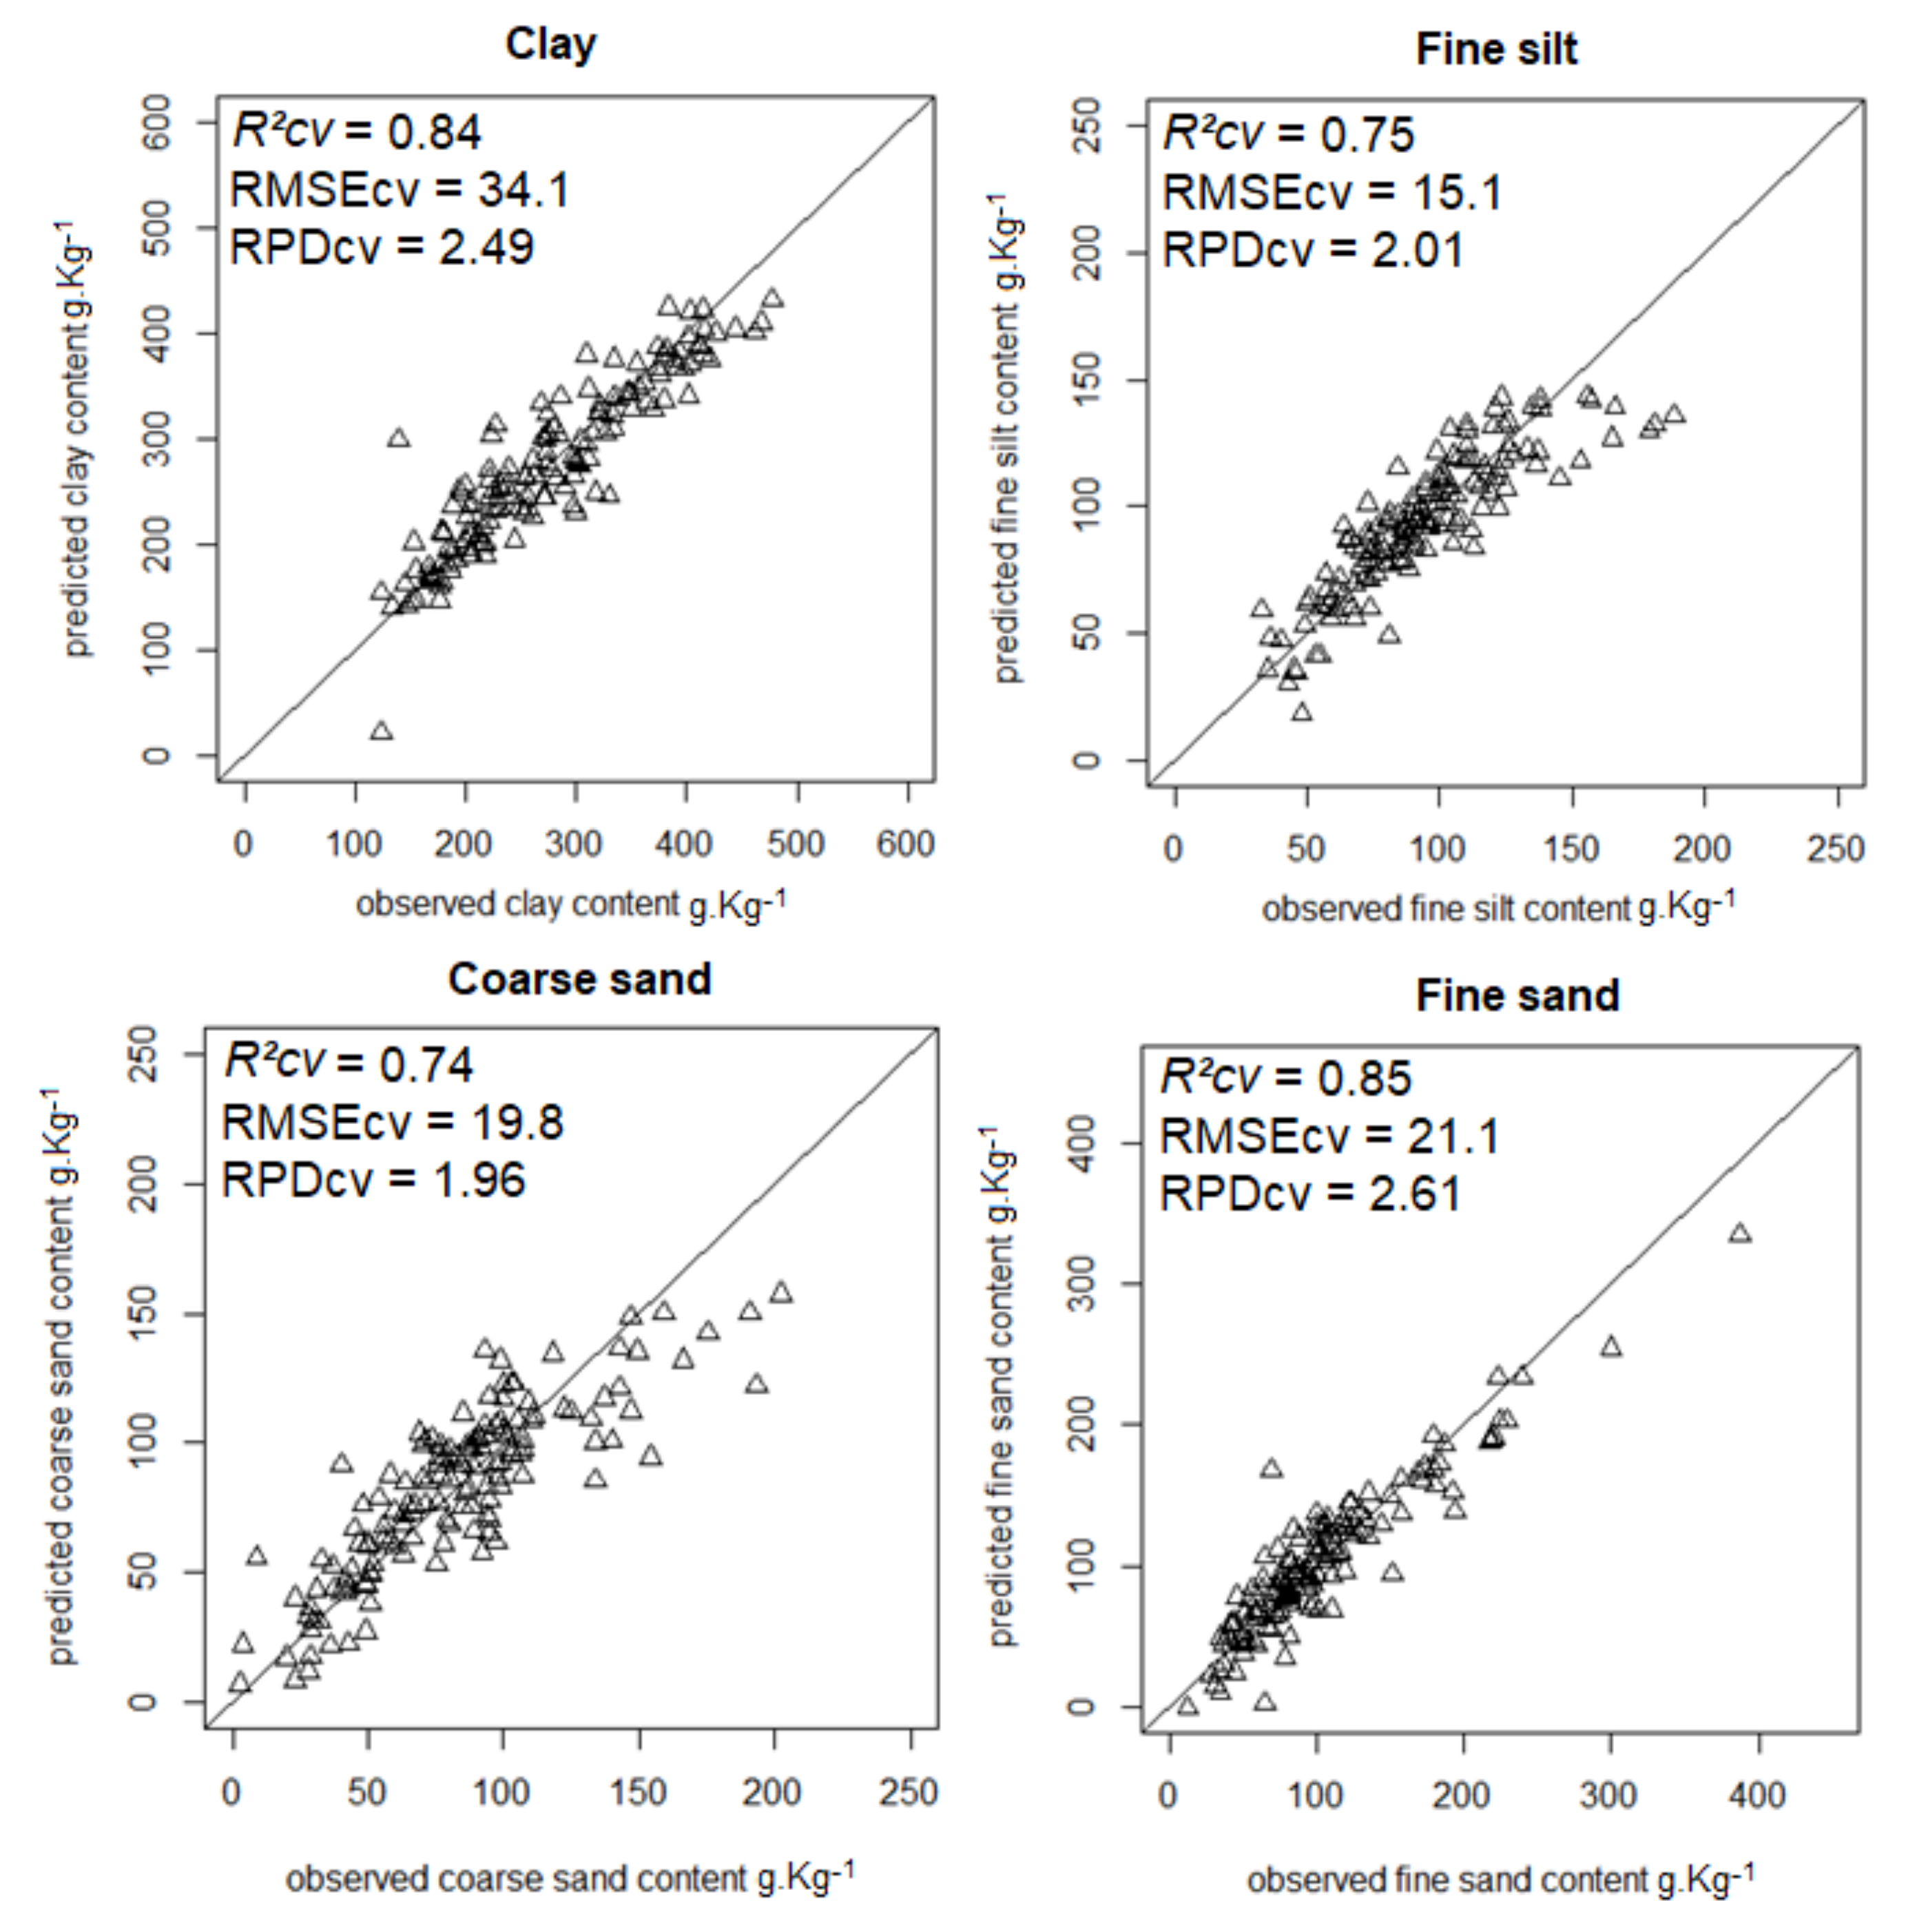
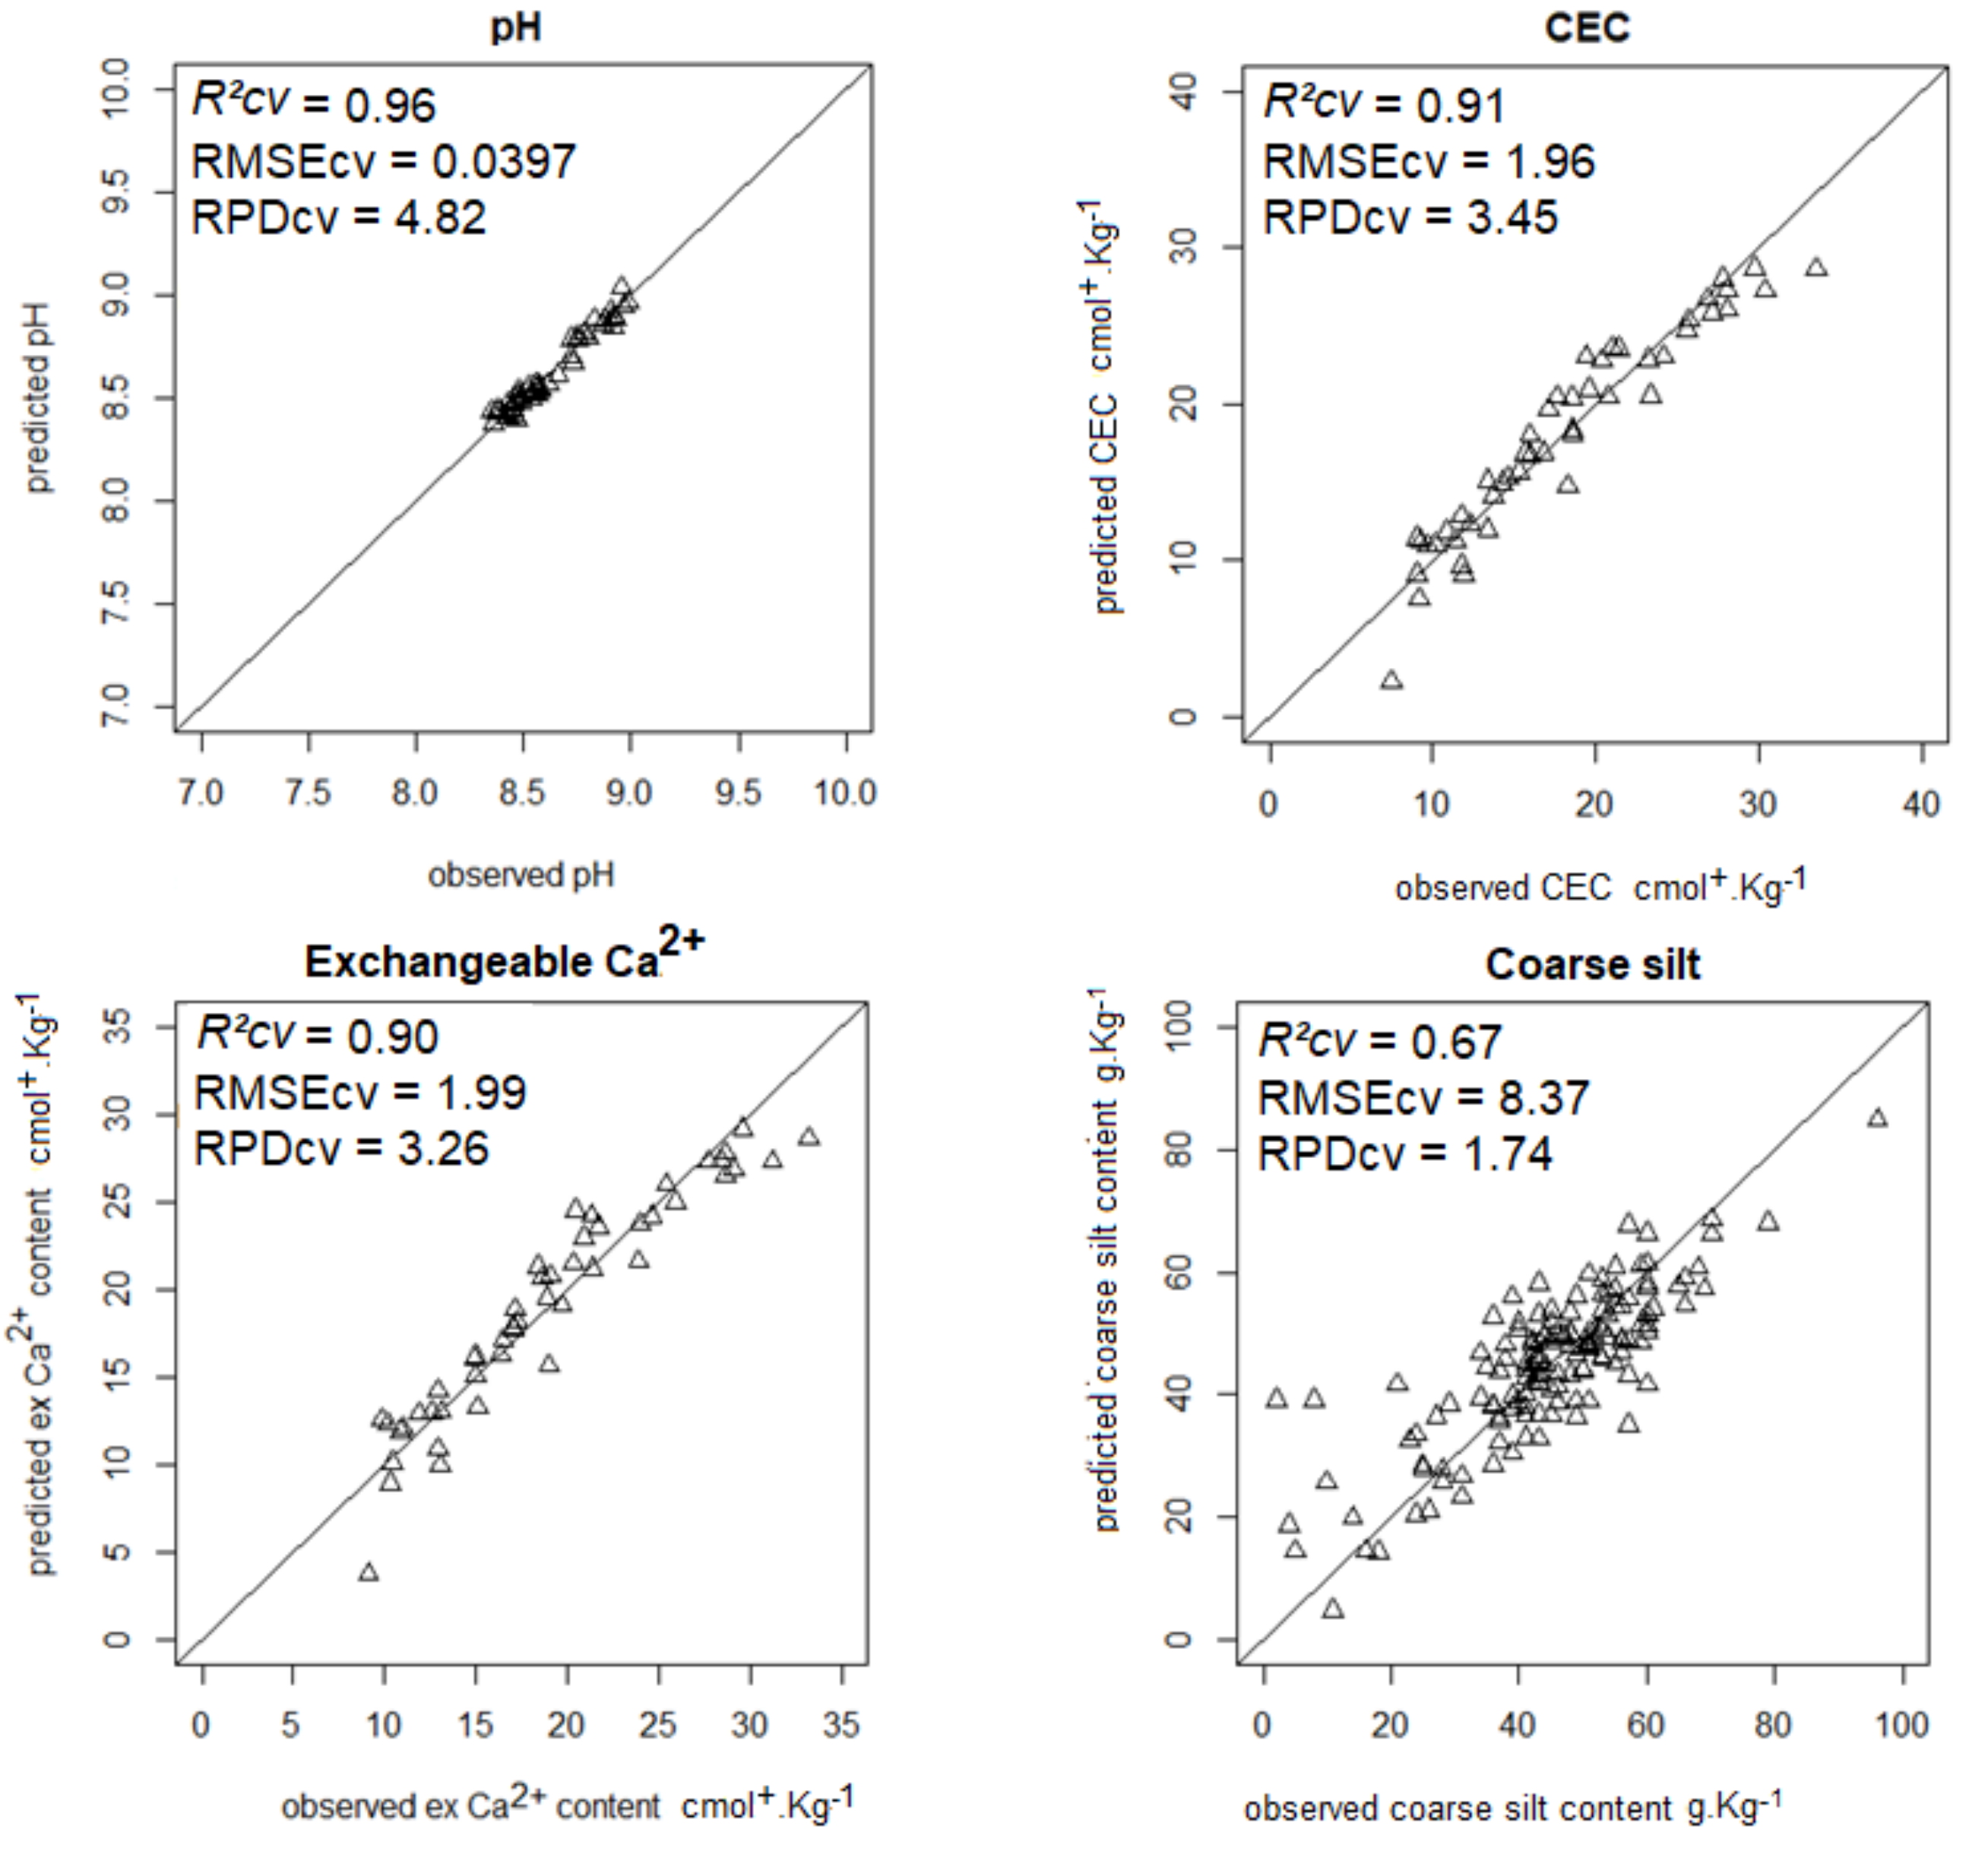
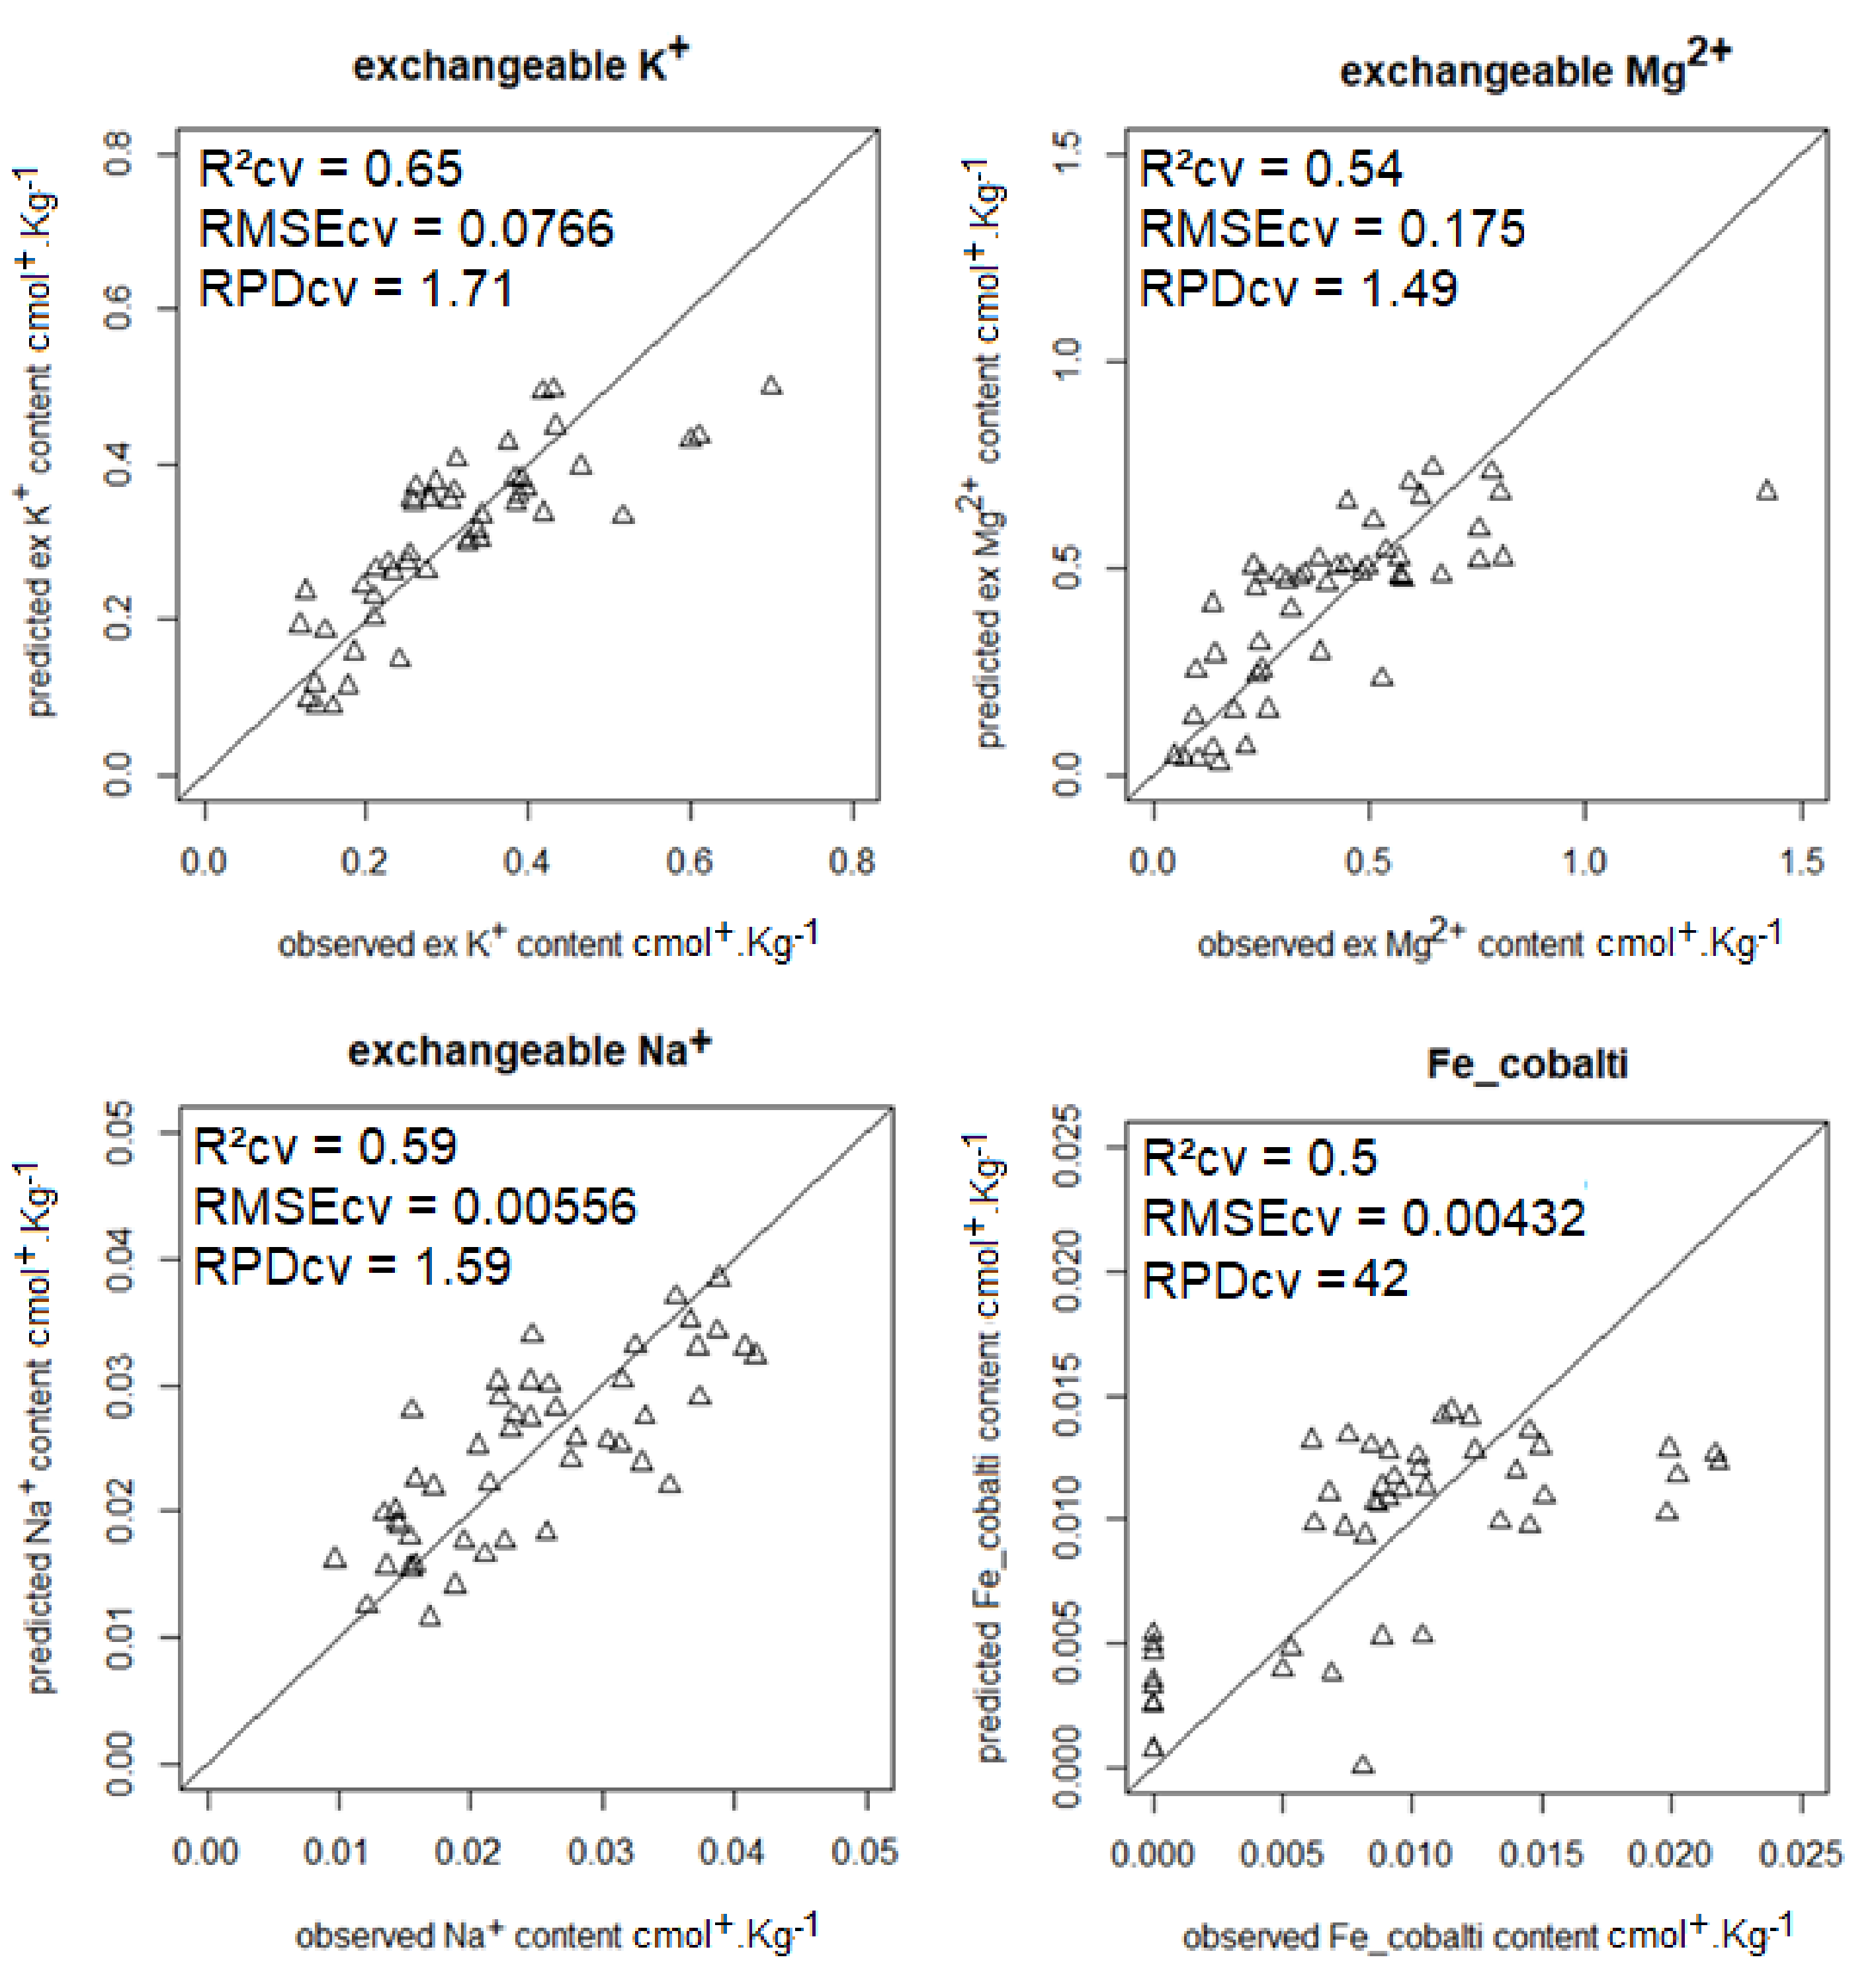
| Soil Property | Performance Statistics | Weights Assigned to Reflectance (Wrefl) and Fluorescence (Wfluo) in Model Averaging | % Relative Improvement of RMSE Compared to Best Model from Either Reflectance or Fluorescence | |||
|---|---|---|---|---|---|---|
| R²cv | RMSEcv | RPD | Wrefl | Wfluo | ||
| CN | 0.21 | 2.17 | 1.13 | 0.96 | 0.14 | 10.3 |
| Ntot | 0.95 | 0.08 | 4.44 | 0.83 | 0.08 | 19.2 |
| SOC | 0.87 | 1.84 | 2.77 | 0.94 | 0.06 | 16.7 |
| CaCO3 | 0.92 | 41.3 | 3.54 | 0.68 | 0.35 | 17.4 |
| Iron | 0.94 | 0.087 | 4.15 | 0.76 | 0.27 | 23.7 |
| Clay | 0.84 | 34.1 | 2.49 | 0.75 | 0.32 | 14.8 |
| Fine silt | 0.75 | 15.1 | 2.01 | 0.97 | 0.04 | 10.1 |
| Coarse silt | 0.67 | 8.37 | 1.74 | 0.58 | 0.52 | 19.5 |
| Fine sand | 0.85 | 21.1 | 2.61 | 0.73 | 0.41 | 33.9 |
| Coarse sand | 0.74 | 19.8 | 1.96 | 0.76 | 0.35 | 25.6 |
| pH | 0.96 | 0.04 | 4.82 | 0.73 | 0.28 | 35.5 |
| CEC | 0.91 | 1.96 | 3.45 | 0.76 | 0.26 | 35.5 |
| Fe–cobalt | 0.50 | 0.0043 | 1.42 | 0.43 | 0.59 | 14.0 |
| Ca | 0.90 | 1.99 | 3.26 | 0.84 | 1.18 | 33.2 |
| Mg | 0.54 | 0.0175 | 1.49 | 0.49 | 0.66 | 17.8 |
| Na | 0.59 | 0.0056 | 1.59 | 0.57 | 0.51 | 6.7 |
| Al | 0.46 | 0.0207 | 1.38 | 0.31 | 0.71 | 1.9 |
| P | 0.14 | 0.0105 | 1.09 | 0.79 | 0.32 | 4.5 |
| K | 0.65 | 0.0766 | 1.71 | 1.06 | –0.11 | 21.8 |
| Soil Property | Single Multiplex Signal or Index | |||
|---|---|---|---|---|
| R²cv | RMSEcv | RPD | Band | |
| CN | 0.02 | 2.42 | 1.01 | VBF_UV_flp |
| Ntot | 0.60 | 0.221 | 1.60 | SFR_R_mx |
| SOC content | 0.62 | 3.15 | 1.62 | SFR_R_mx |
| CaCO3 content | 0.73 | 75.3 | 1.94 | RR_R_mx |
| Iron content | 0.64 | 0.216 | 1.67 | GR_G_mx |
| Clay content | 0.36 | 62.1 | 1.37 | GR_G_mx |
| Fine silt content | 0.50 | 21.7 | 1.40 | RR_R_mx |
| Coarse silt content | 0.41 | 11.3 | 1.29 | FERARI_mx |
| Fine sand content | 0.15 | 52.1 | 1.06 | FRF_R_mx |
| Coarse sand | 0.24 | 34.2 | 1.13 | GF_B_flp |
| pH | 0.85 | 0.0766 | 2.50 | FERARI_mx |
| CEC | 0.64 | 4.22 | 1.60 | RR_R_mx |
| Fe–cobalti | 0.52 | 0.0040 | 1.40 | RF_R_mx |
| Ca | 0.64 | 4.01 | 1.62 | RR_R_mx |
| Mg | 0.37 | 0.213 | 1.23 | GR_G_mx |
| Na | 0.14 | 0.008 | 1.05 | RF_R_mx |
| Al | 0.49 | 0.0208 | 1.37 | RF_R_mx |
| P | 0.02 | 0.0116 | 0.99 | RF_R_mx |
| K | 0.35 | 0.108 | 1.21 | RF_G_mx |
| Soil Property | Single Fluorescence Signal or Index | |||
|---|---|---|---|---|
| R²cv | RMSEcv | RPD | Band | |
| CN | 0.12 | 2.12 | 0.96 | VBF_UV_flp |
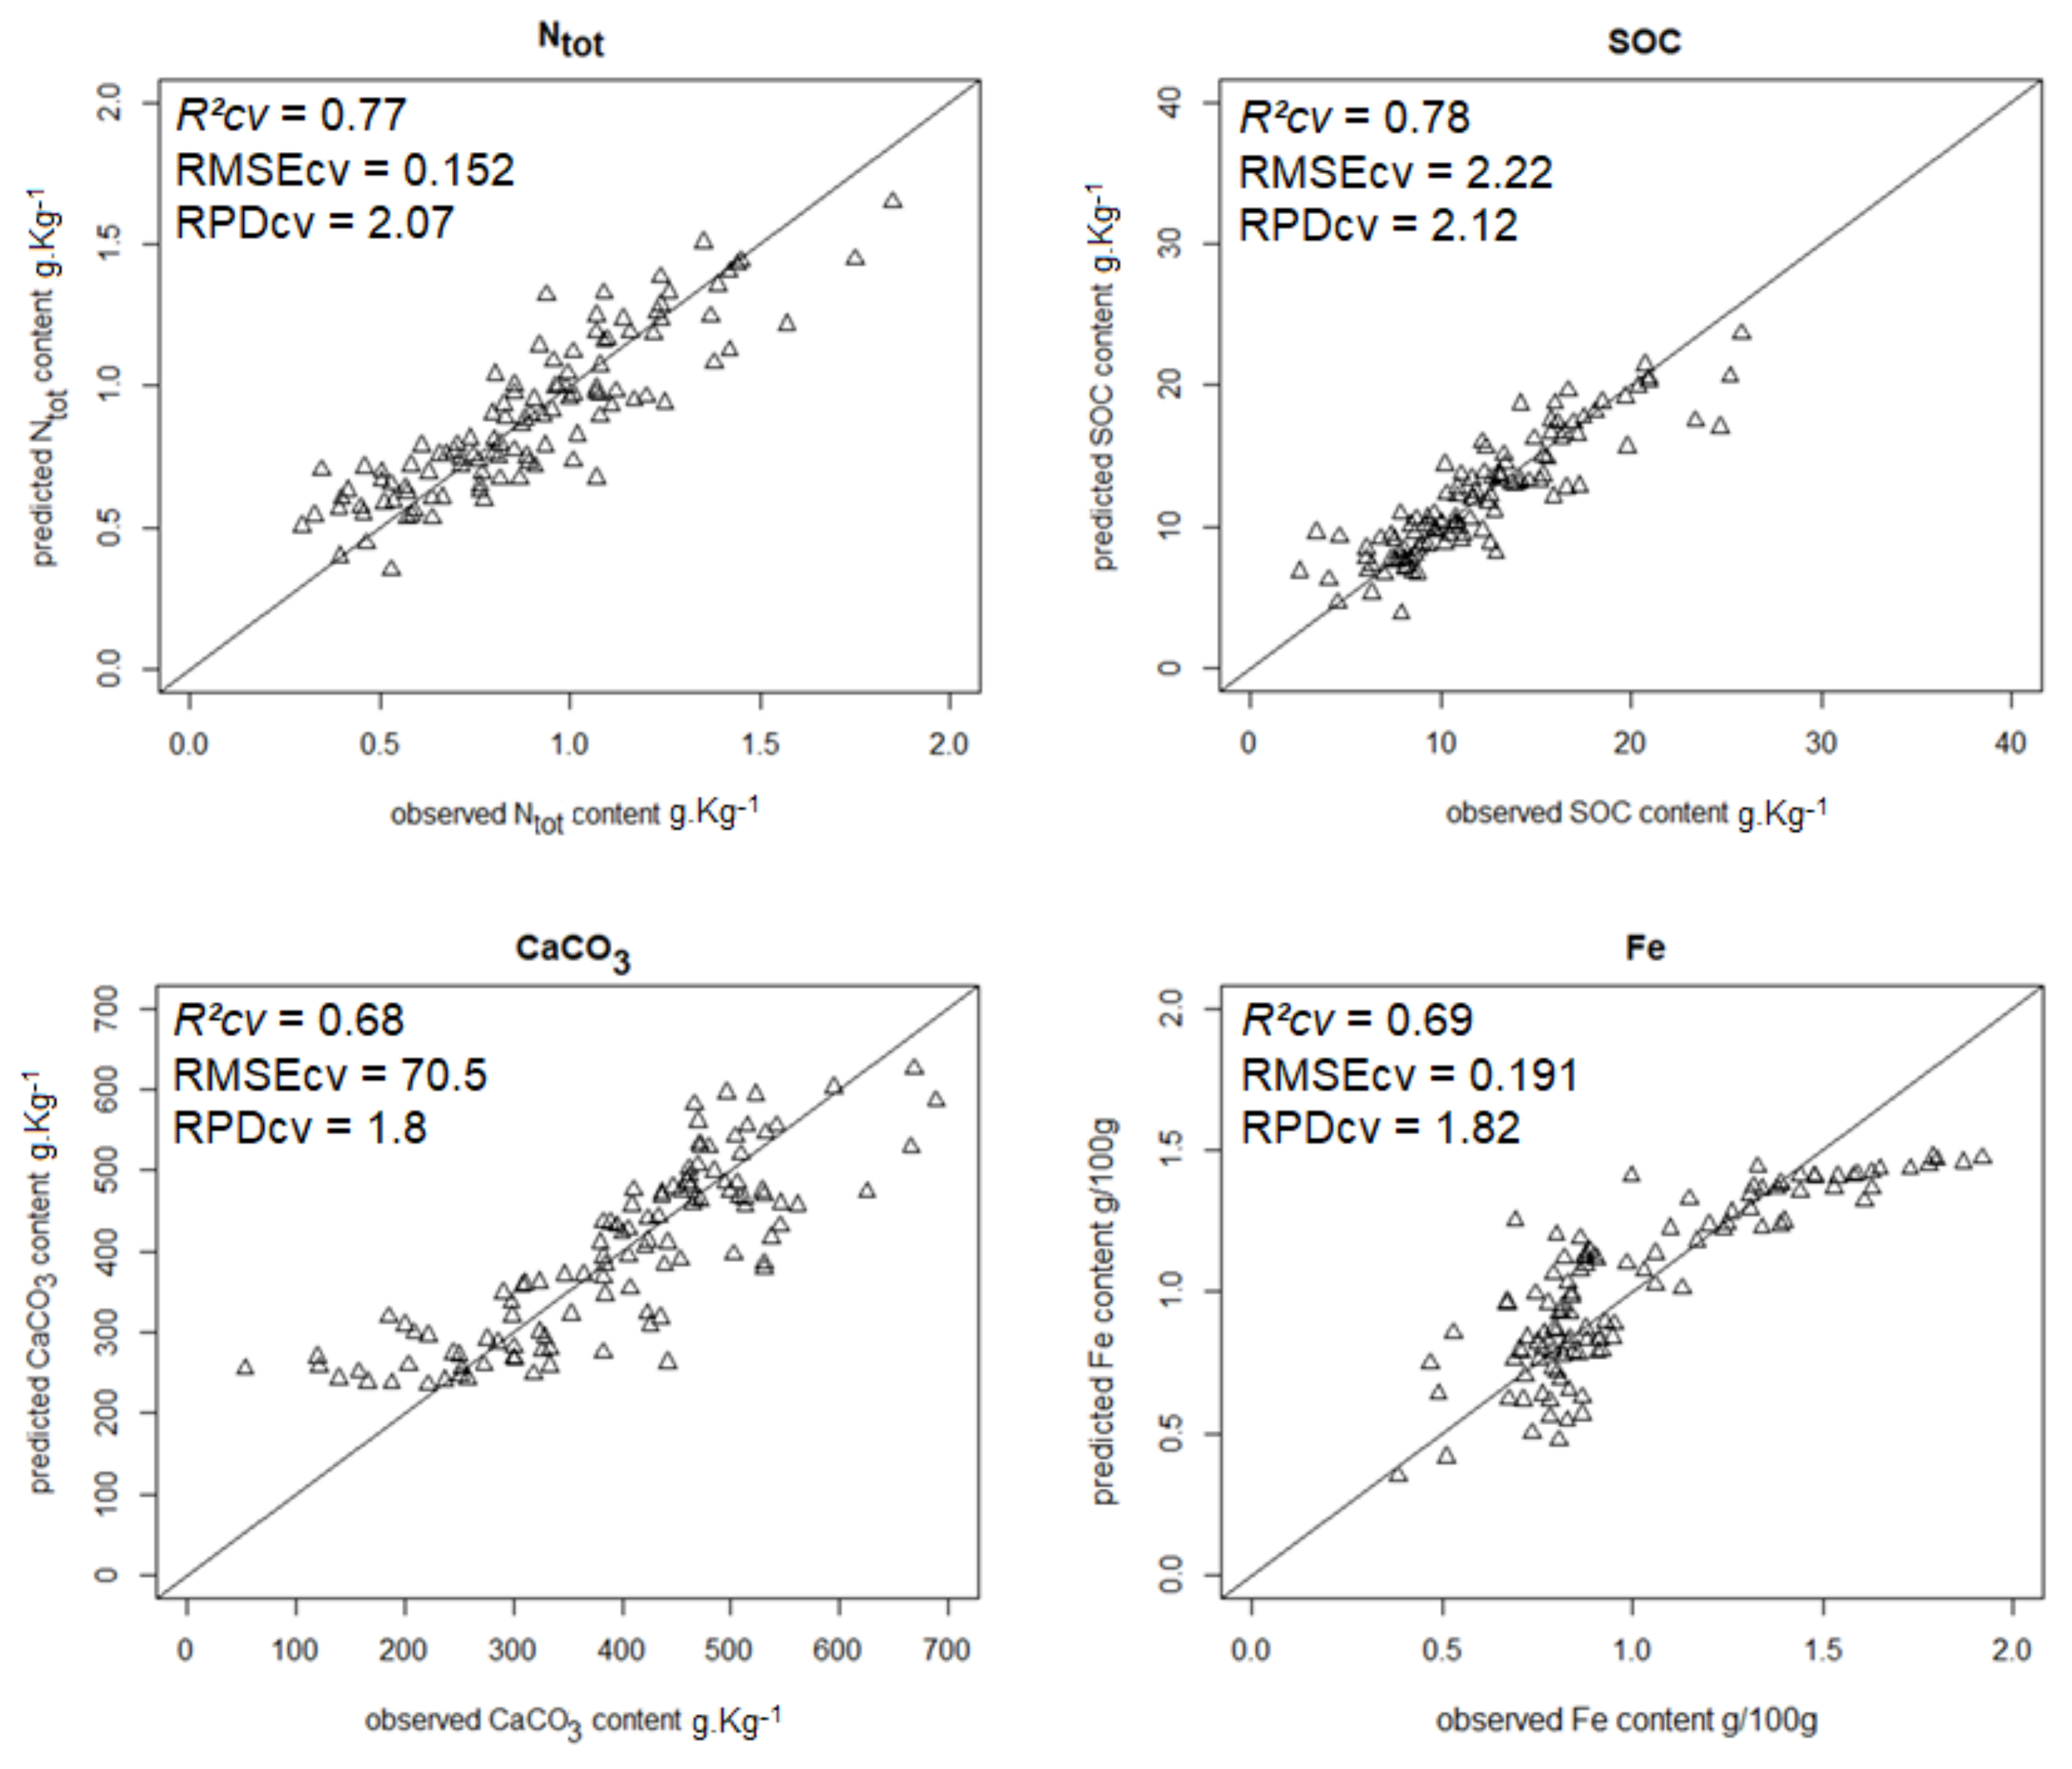
| Ntot | 0.76 | 0.152 | 2.07 | SFR_R_mx |
| SOC content | 0.78 | 2.22 | 2.12 | SFR_R_mx |
| CaCO3 content | 0.68 | 70.5 | 1.80 | RR_R_mx |
| Iron content | 0.71 | 0.191 | 1.82 | GR_G_mx |
| Clay content | 0.50 | 56.4 | 1.39 | GR_G_mx |
| Fine silt content | 0.47 | 20.3 | 1.35 | RR_R_mx |
| Coarse silt content | 0.24 | 9.98 | 1.13 | FERARI_mx |
| Fine sand content | 0.13 | 41.0 | 1.06 | FRF_R_mx |
| Coarse sand | 0.51 | 23.4 | 1.40 | GF_B_flp |
© 2018 by the authors. Licensee MDPI, Basel, Switzerland. This article is an open access article distributed under the terms and conditions of the Creative Commons Attribution (CC BY) license (http://creativecommons.org/licenses/by/4.0/).
Share and Cite
Vaudour, E.; Cerovic, Z.G.; Ebengo, D.M.; Latouche, G. Predicting Key Agronomic Soil Properties with UV-Vis Fluorescence Measurements Combined with Vis-NIR-SWIR Reflectance Spectroscopy: A Farm-Scale Study in a Mediterranean Viticultural Agroecosystem. Sensors 2018, 18, 1157. https://doi.org/10.3390/s18041157
Vaudour E, Cerovic ZG, Ebengo DM, Latouche G. Predicting Key Agronomic Soil Properties with UV-Vis Fluorescence Measurements Combined with Vis-NIR-SWIR Reflectance Spectroscopy: A Farm-Scale Study in a Mediterranean Viticultural Agroecosystem. Sensors. 2018; 18(4):1157. https://doi.org/10.3390/s18041157
Chicago/Turabian StyleVaudour, Emmanuelle, Zoran G. Cerovic, Dav M. Ebengo, and Gwendal Latouche. 2018. "Predicting Key Agronomic Soil Properties with UV-Vis Fluorescence Measurements Combined with Vis-NIR-SWIR Reflectance Spectroscopy: A Farm-Scale Study in a Mediterranean Viticultural Agroecosystem" Sensors 18, no. 4: 1157. https://doi.org/10.3390/s18041157