Highly Sensitive Room-Temperature Sensor Based on Nanostructured K2W7O22 for Application in the Non-Invasive Diagnosis of Diabetes


1
Department of Electrical and Computer Engineering, North Dakota State University, Fargo, ND 58102, USA
2
Materials and Nanotechnology Program, North Dakota State University, Fargo, ND 58102, USA
*
Author to whom correspondence should be addressed.
Sensors 2018, 18(11), 3703; https://doi.org/10.3390/s18113703
Submission received: 21 September 2018
/
Revised: 26 October 2018
/
Accepted: 29 October 2018
/
Published: 31 October 2018
(This article belongs to the Special Issue Non-Invasive Biomedical Sensors)
Abstract
:Diabetes is one of the most rapidly-growing chronic diseases in the world. Acetone, a volatile organic compound in exhaled breath, shows a positive correlation with blood glucose and has proven to be a biomarker for type-1 diabetes. Measuring the level of acetone in exhaled breath can provide a non-invasive, low risk of infection, low cost, and convenient way to monitor the health condition of diabetics. There has been continuous demand for the improvement of this non-invasive, sensitive sensor system to provide a fast and real-time electronic readout of blood glucose levels. A novel nanostructured K2W7O22 has been recently used to test acetone with concentration from 0 parts-per-million (ppm) to 50 ppm at room temperature. The results revealed that a K2W7O22 sensor shows a sensitive response to acetone, but the detection limit is not ideal due to the limitations of the detection system of the device. In this paper, we report a K2W7O22 sensor with an improved sensitivity and detection limit by using an optimized circuit to minimize the electronic noise and increase the signal to noise ratio for the purpose of weak signal detection while the concentration of acetone is very low.
1. Introduction
Diabetes, the seventh leading cause of death in the United States, is a precursor to a heterogeneous group of disorders and is indicated by high blood glucose levels [1,2]. Based 2017 statistics, about 30.3 million people in the U.S. have diabetes, or about 9.4% of the U.S. population [3]. There are many ways to diagnose type 1 diabetes [4], such as the A1C test (a blood test that indicates blood glucose levels) [5], fasting plasma glucose test (FPG), or oral glucose tolerance test (OGTT) [6]. However, these diagnosing methods are inconvenient, costly, and painful. Also, if we can have a device which can be a tool to screen or diagnose diabetes at a very early stage, it can particularly prevent the population with prediabetes to develop full-scale diabetes.
Volatile organic compounds (VOCs) [7] in human breath, identified in the early 1970’s [8], act as noninvasive indicators of human health. Some VOCs are known biomarkers for specific human diseases [9]. For instance, toluene can be used to trace lung cancer [10] and acetone can be used to monitor blood glucose level for diabetes [11,12]. The advantages of using VOCs as diagnostic tools include being harmless to the body, convenient to carry, low cost, and non-invasive. If a VOC can be used as a biomarker for diabetes mellitus and becomes a method to diagnose disease at an early stage with a convenient, much cheaper, and non-invasive way, most patients could be benefit from this technique and get their diseases controlled in time. In fact, researchers have proven that in general there is a positive correlation between blood glucose and breath acetone [13,14,15,16,17,18,19,20,21,22,23]. Therefore, it is reasonable to develop a device for the detection of breath acetone as an effective tool of diabetes diagnosis and screening.
There are many ways to detect acetone from exhaled breath, such as: gas chromatography-mass spectrometry (GC-MS) [24,25]; selected ion flow tube mass spectrometry (SIFT-MS) [26]; proton transfer reaction-mass spectrometry (PTR-MS) [27]; high-performance liquid chromatography (HPLC) [28]; ion mobility spectrometry (IMS) [29,30]; laser spectroscopic techniques, including tunable diode laser absorption spectroscopy (TDLAS) [31], and cavity ringdown spectroscopy (CRDS) [32]. These techniques are complicated in operation, expensive, and unavailable in small clinic or home settings [33]. In addition to techniques for acetone detection, there are many materials developed to detect acetone in various sensor devices, such as Pt-InN [34], Polypyrrole (PPy)-WO3 [35], Ni/InGaN/GaN [36], and Pd/TiO2/Si [37]. Compared to these materials, nanostructured K2W7O22 (KWO) shows the highest sensitivity to acetone even at room temperature. Our recent investigation of the sensing mechanism of KWO for acetone detection reveals that excellent room-temperature ferroelectric properties and porous nanostructure of KWO provide an effective chemiresistive reaction between high polar acetone and KWO [38]. This makes KWO a promising material to detect acetone for the application of non-invasive diabetes diagnosis.
Generally, in exhaled breath, the acetone concentration is usually in the range of 0.3–0.9 ppm (parts per million) for a healthy person and above 1.8 ppm for a diabetic patient [13]. People with breath acetone concentration between 0.9 ppm and 1.8 ppm can be considered prediabetes, who have a high risk to become diabetes. The parts-per-million concentration is just in a trace level, which is indeed quite challenge to be sensitively detected. Therefore, increasing the sensitivity and detection limit is the key while designing a sensor device to detect trace level acetone in the purpose of diabetes diagnosis. Usually, there are two major factors that can affect the sensor performance: one is electrical circuits for signal collection; the other is the sensing material properties. The preliminary results exhibited that KWO can sensitively detect acetone with a good detection limit around 1.2 ppm [17,38]. While considering its potential application in diabetes, such a detection limit of ≈1.2 ppm is not good enough to detect the breath acetone level in many people who are pre-diabetic. To solve the issue of weak signal detection and improve the sensor detection limit, we designed and modified the circuit system of sensor detection by: (1) introducing an operational amplifier (op-amp) [39] in the circuit to magnify the weak signal, and (2) employed a Wheatstone bridge [40] technique to balance the circuit and accurately measure the change of resistance caused by the interaction between KWO and trace level acetone.
In this paper, we report a breath sensor based on a novel nanostructured material, K2W7O22, to work as a chemiresistive sensor for the detection of acetone at room temperature. An advanced circuit system has been developed and described in detail regarding the improvement of the signal to noise ratio and the weak signal pick-up while considering the concentration of breath acetone is very low in the range of parts-per-billion (ppb) to parts-per-million (ppm). The sensing performance based on the improved circuits has been presented.
2. Circuit Design
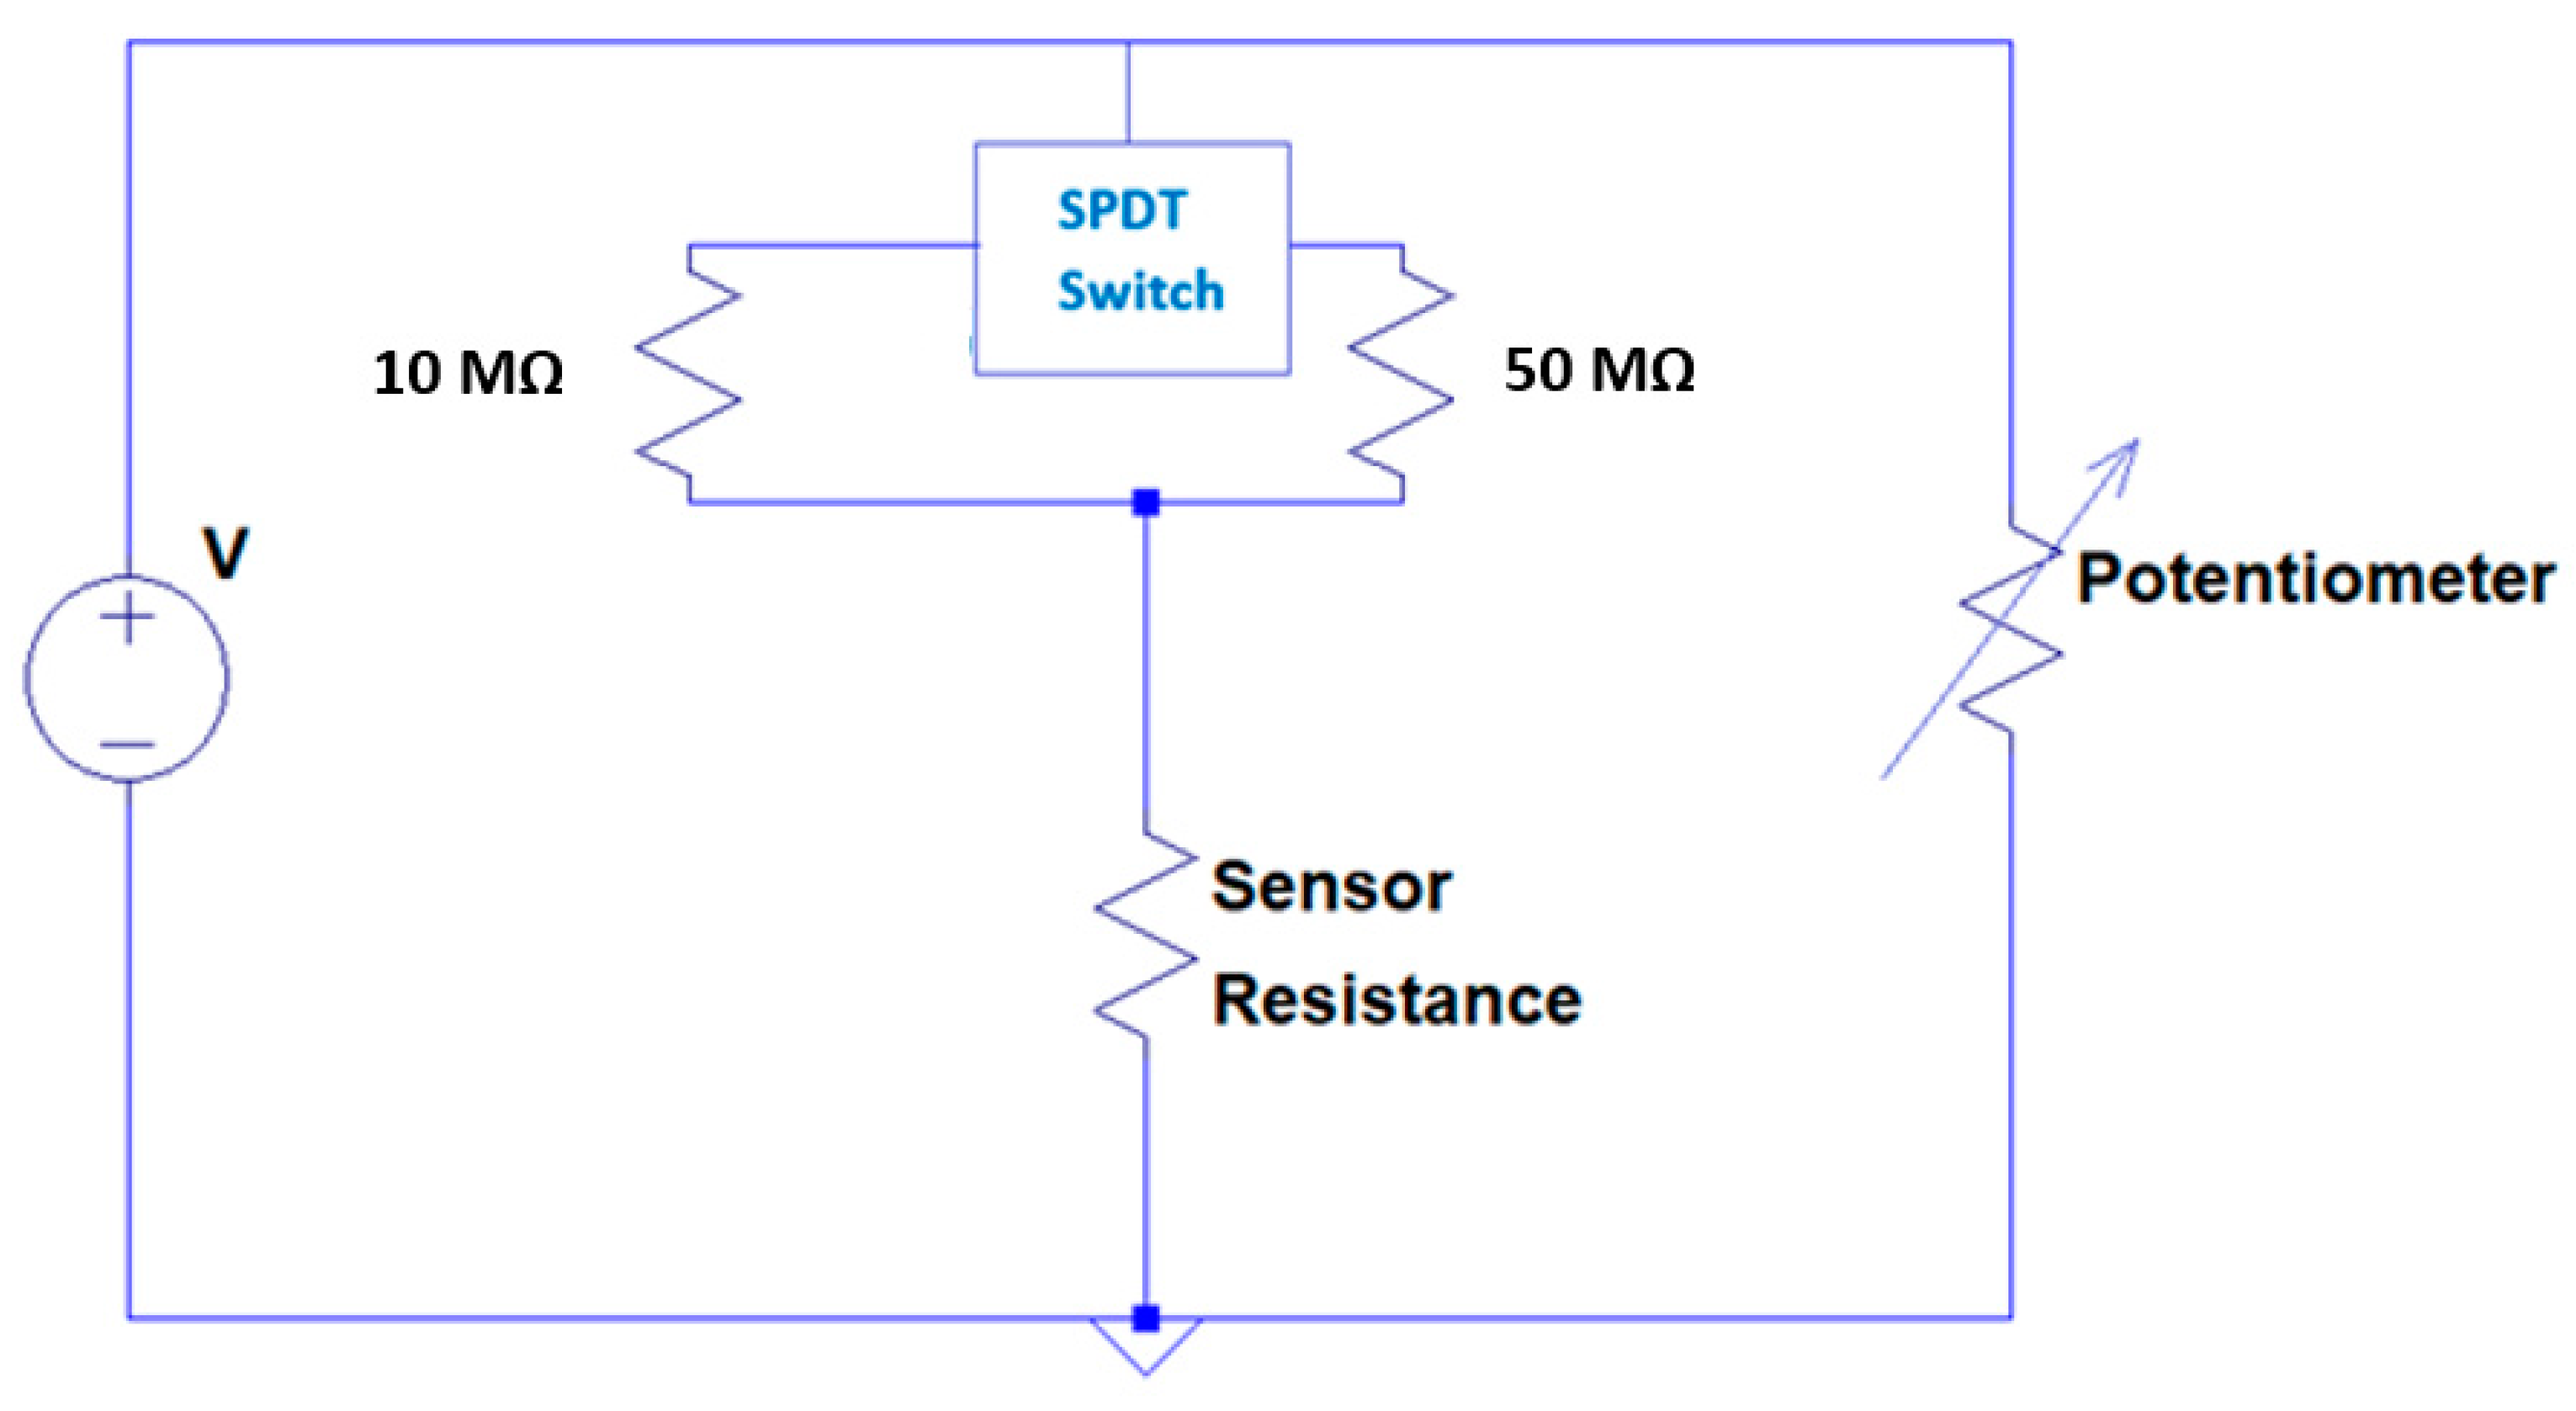
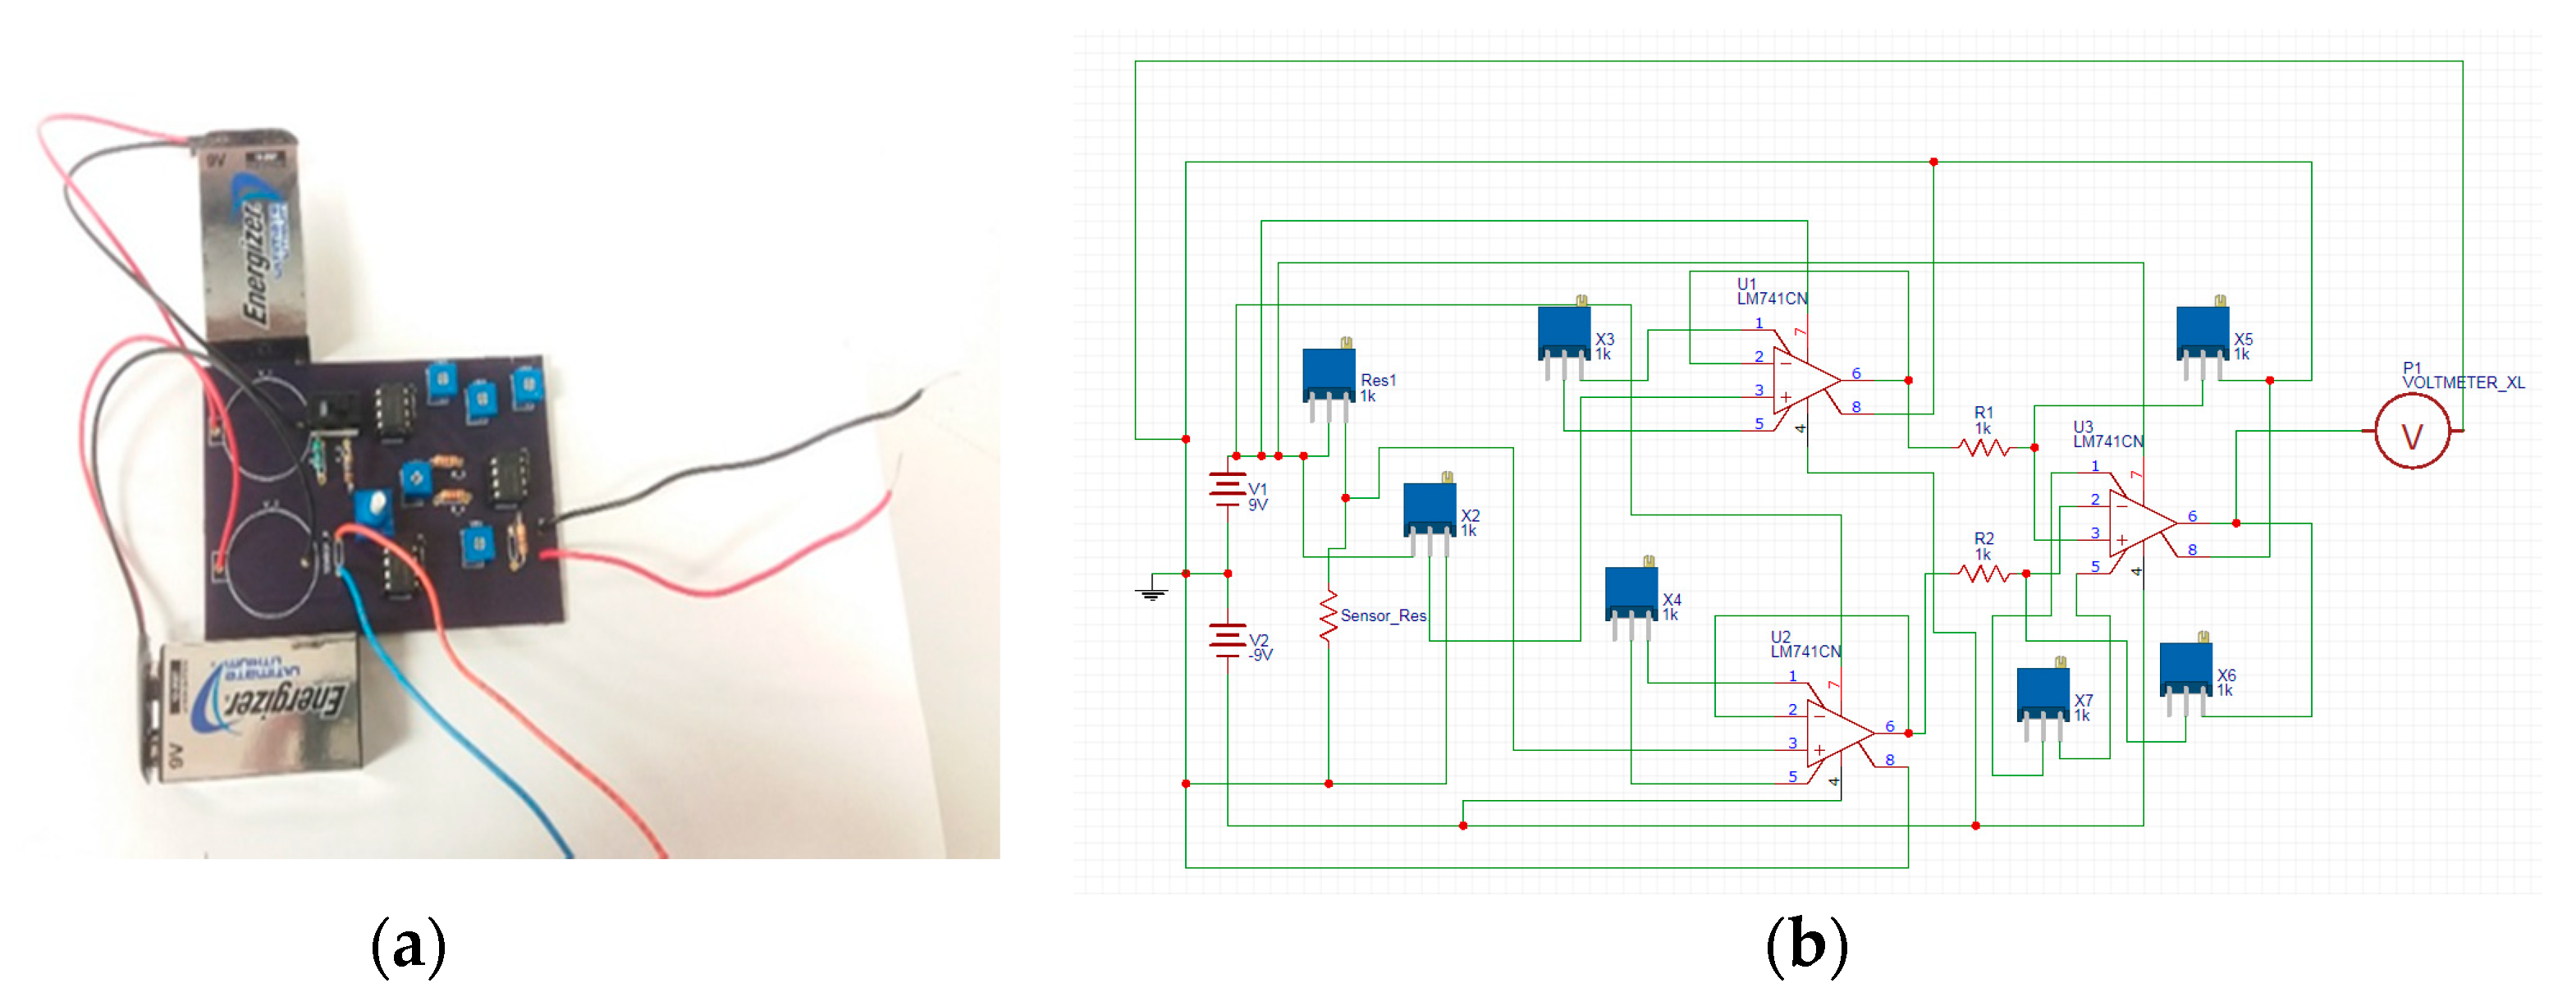
To detect the signal, we made a cost-efficient circuit with components such as resistors, potentiometers, op-amp (model name: LM741 CNNS) [41], and 9 V battery. The printed circuit board (PCB) was designed by OSHPARK (a PCB fabrication company, Portland, OR, USA) [42]. As shown in Figure 1, we used 10 MΩ and 50 MΩ resistors connected with a single pole double through (SPDT) switch [43] for compatible adjustment with the sensor resistance while testing different ranges of acetone concentration. A 10 MΩ resistor was used to calibrate the sensing response for lower concentrations of acetone from 0 to 6.25 ppm and a 50 MΩ resistor was chosen to calibrate the sensing response for a broad range of acetone from 0–50 ppm. The other branch of the Wheatstone bridge was introduced with a potentiometer to make zero correction of the circuit. Also, we introduced buffer amplifiers [44] in the circuit to avoid the impedance problem and to get unity gain. Because the signal from sensor detection is weak, we used a differential amplifier to amplify the signal. The voltages were taken from the two branches of the Wheatstone bridge. The amplification ratio was set up in accordance with the range of acetone detection. For instance, to detect a low concentration of acetone (0–6.25) ppm, we needed to amplify the signal 10-fold. Figure 2a shows our PCB circuit board and Figure 2b shows the schematic diagram of the circuit. We used two 9 V batteries to make +9 V and −9 V potential differences. The amplification of the signal was set in between the range of −9 V to +9 V and the output was clipped beyond that range. The output from the circuit was measured on an electrometer.
3. Experimental Setup
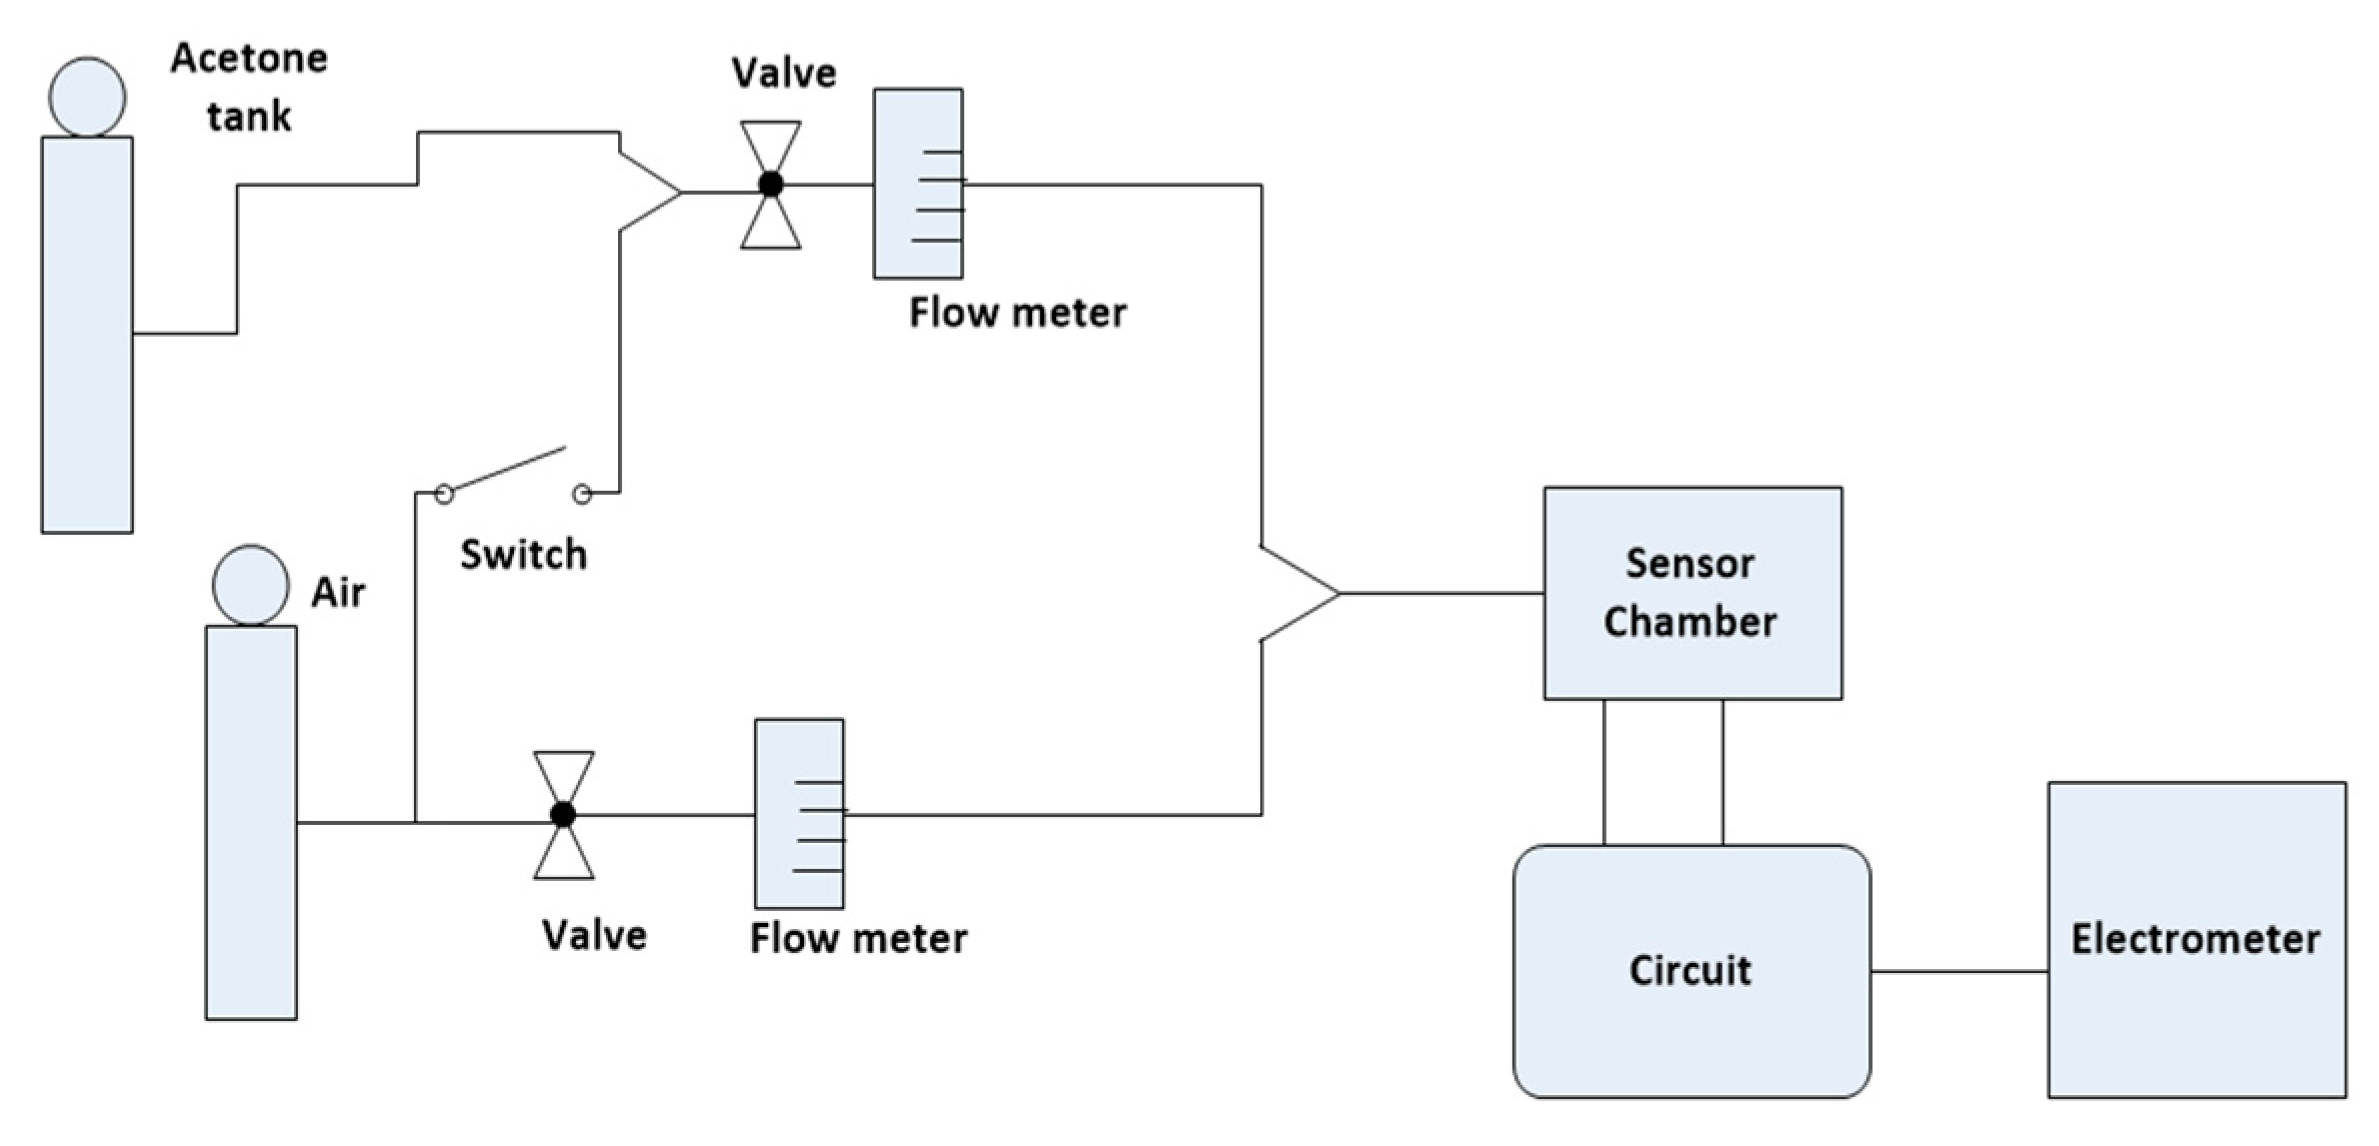
We tested the sensor with 0–6.25 ppm and 0–50 ppm concentrations of acetone. Our primary goal was to check the sensitivity of the KWO sensor to acetone with the improved circuit while the concentration of acetone was low (0–6.25 ppm). The other goal was to make sure that the circuit could functionally work nicely in a broad range of acetone concentration from 0 to 50 ppm. Figure 3 shows the sketch of the whole testing system. Acetone gas, supplied from the tank, was at the concentration of 50 ppm. The concentration of acetone could be diluted via mixing 50 ppm acetone with air and quantified through mass flow controllers. The sensor was put in a chamber and connected to the circuit for signal detection and collection. The circuit output was monitored from the electrometer and collected via computers.
4. Sensing Mechanism
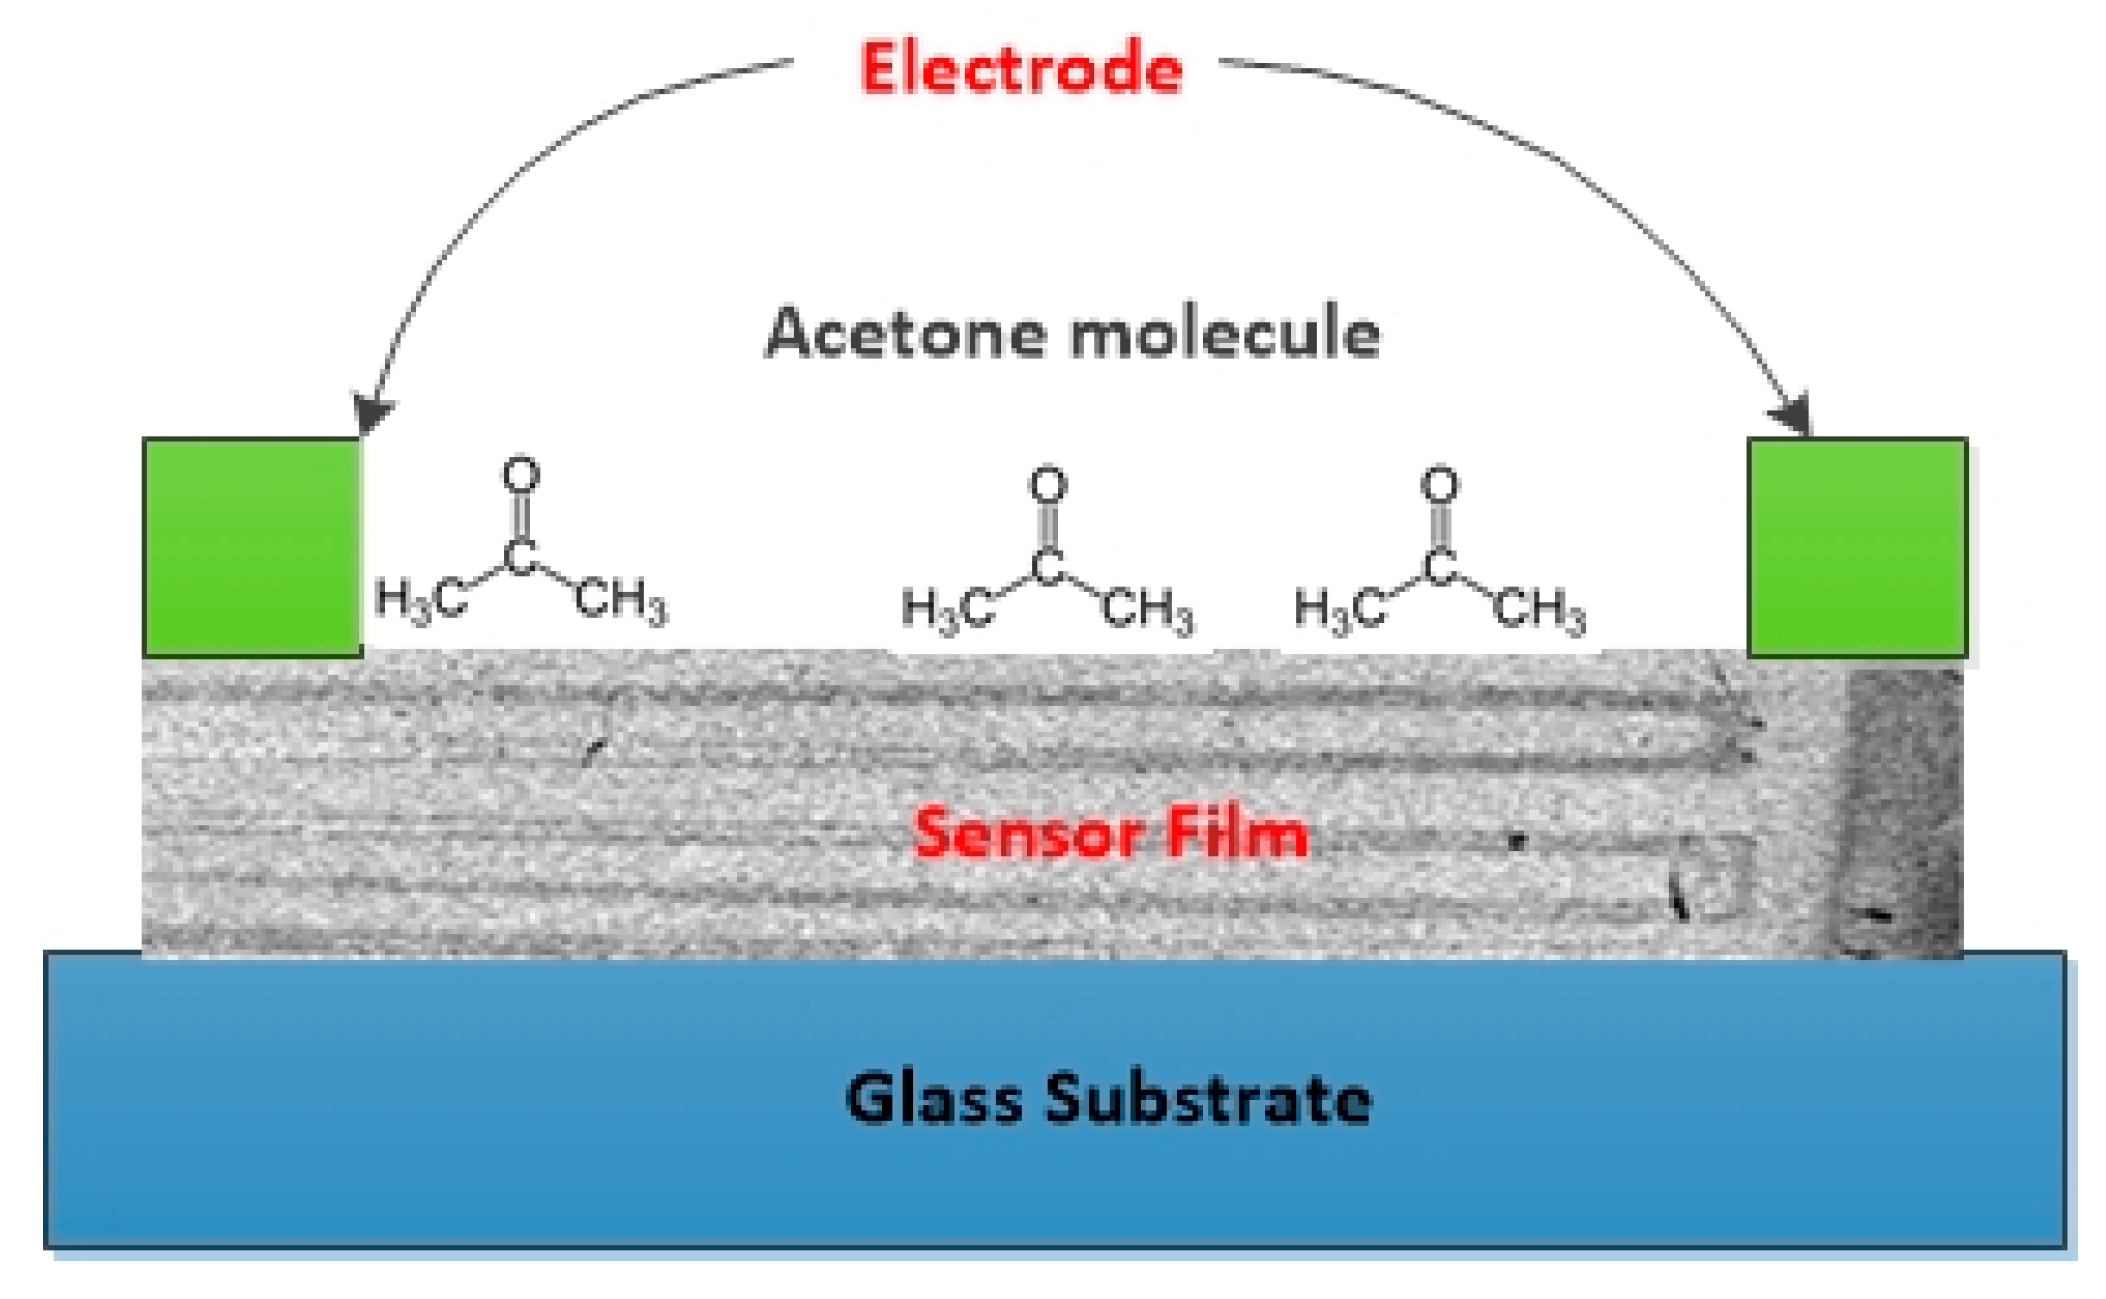
In the earlier section, we mentioned that the KWO sensor is sensitive to the acetone gas. Figure 4 shows the sensing interaction between the acetone molecule and the KWO sensor. Nanostructured KWO was measured to be a p-type semiconductor via a Hall effect measurement (Ecopia HMS-3000). Also, it showed good room-temperature ferroelectric properties [38]. All these unique properties of KWO can make it effectively attract high polar acetone molecules and result in an increase of the resistance [38,45,46]. Therefore, a KWO sensor can also be called chemiresistive sensor.
Theoretically, chemiresistive-based sensors can detect even tiny amounts of change of charges, e.g., electrons or holes. This can be reflected via a small change of resistance of sensing material, e.g., KWO, when it is exposed to a very low concentration of acetone. Generally, due to the limitations of the detecting circuit, device structure, etc., it is not easy to observe such a small change of resistance while the acetone concentration is too low. Considering the practical application of KWO sensor in diabetes, it is necessary to sensitively detect a concentration of acetone less than 0.9 ppm. The circuit mentioned above was designed to optimize the signal to noise ratio and realize a weak signal detection while a tiny resistance change is introduced by a small amount of acetone.
5. Results and Discussion
Sensitivity is the most important parameters for evaluating the sensing performance of sensors [47]. Sensitivity is defined as the variation in current ratio for specific gas concentration. If Igas and Iair are the current values of the sensor, then the sensitivity, S [34] is:
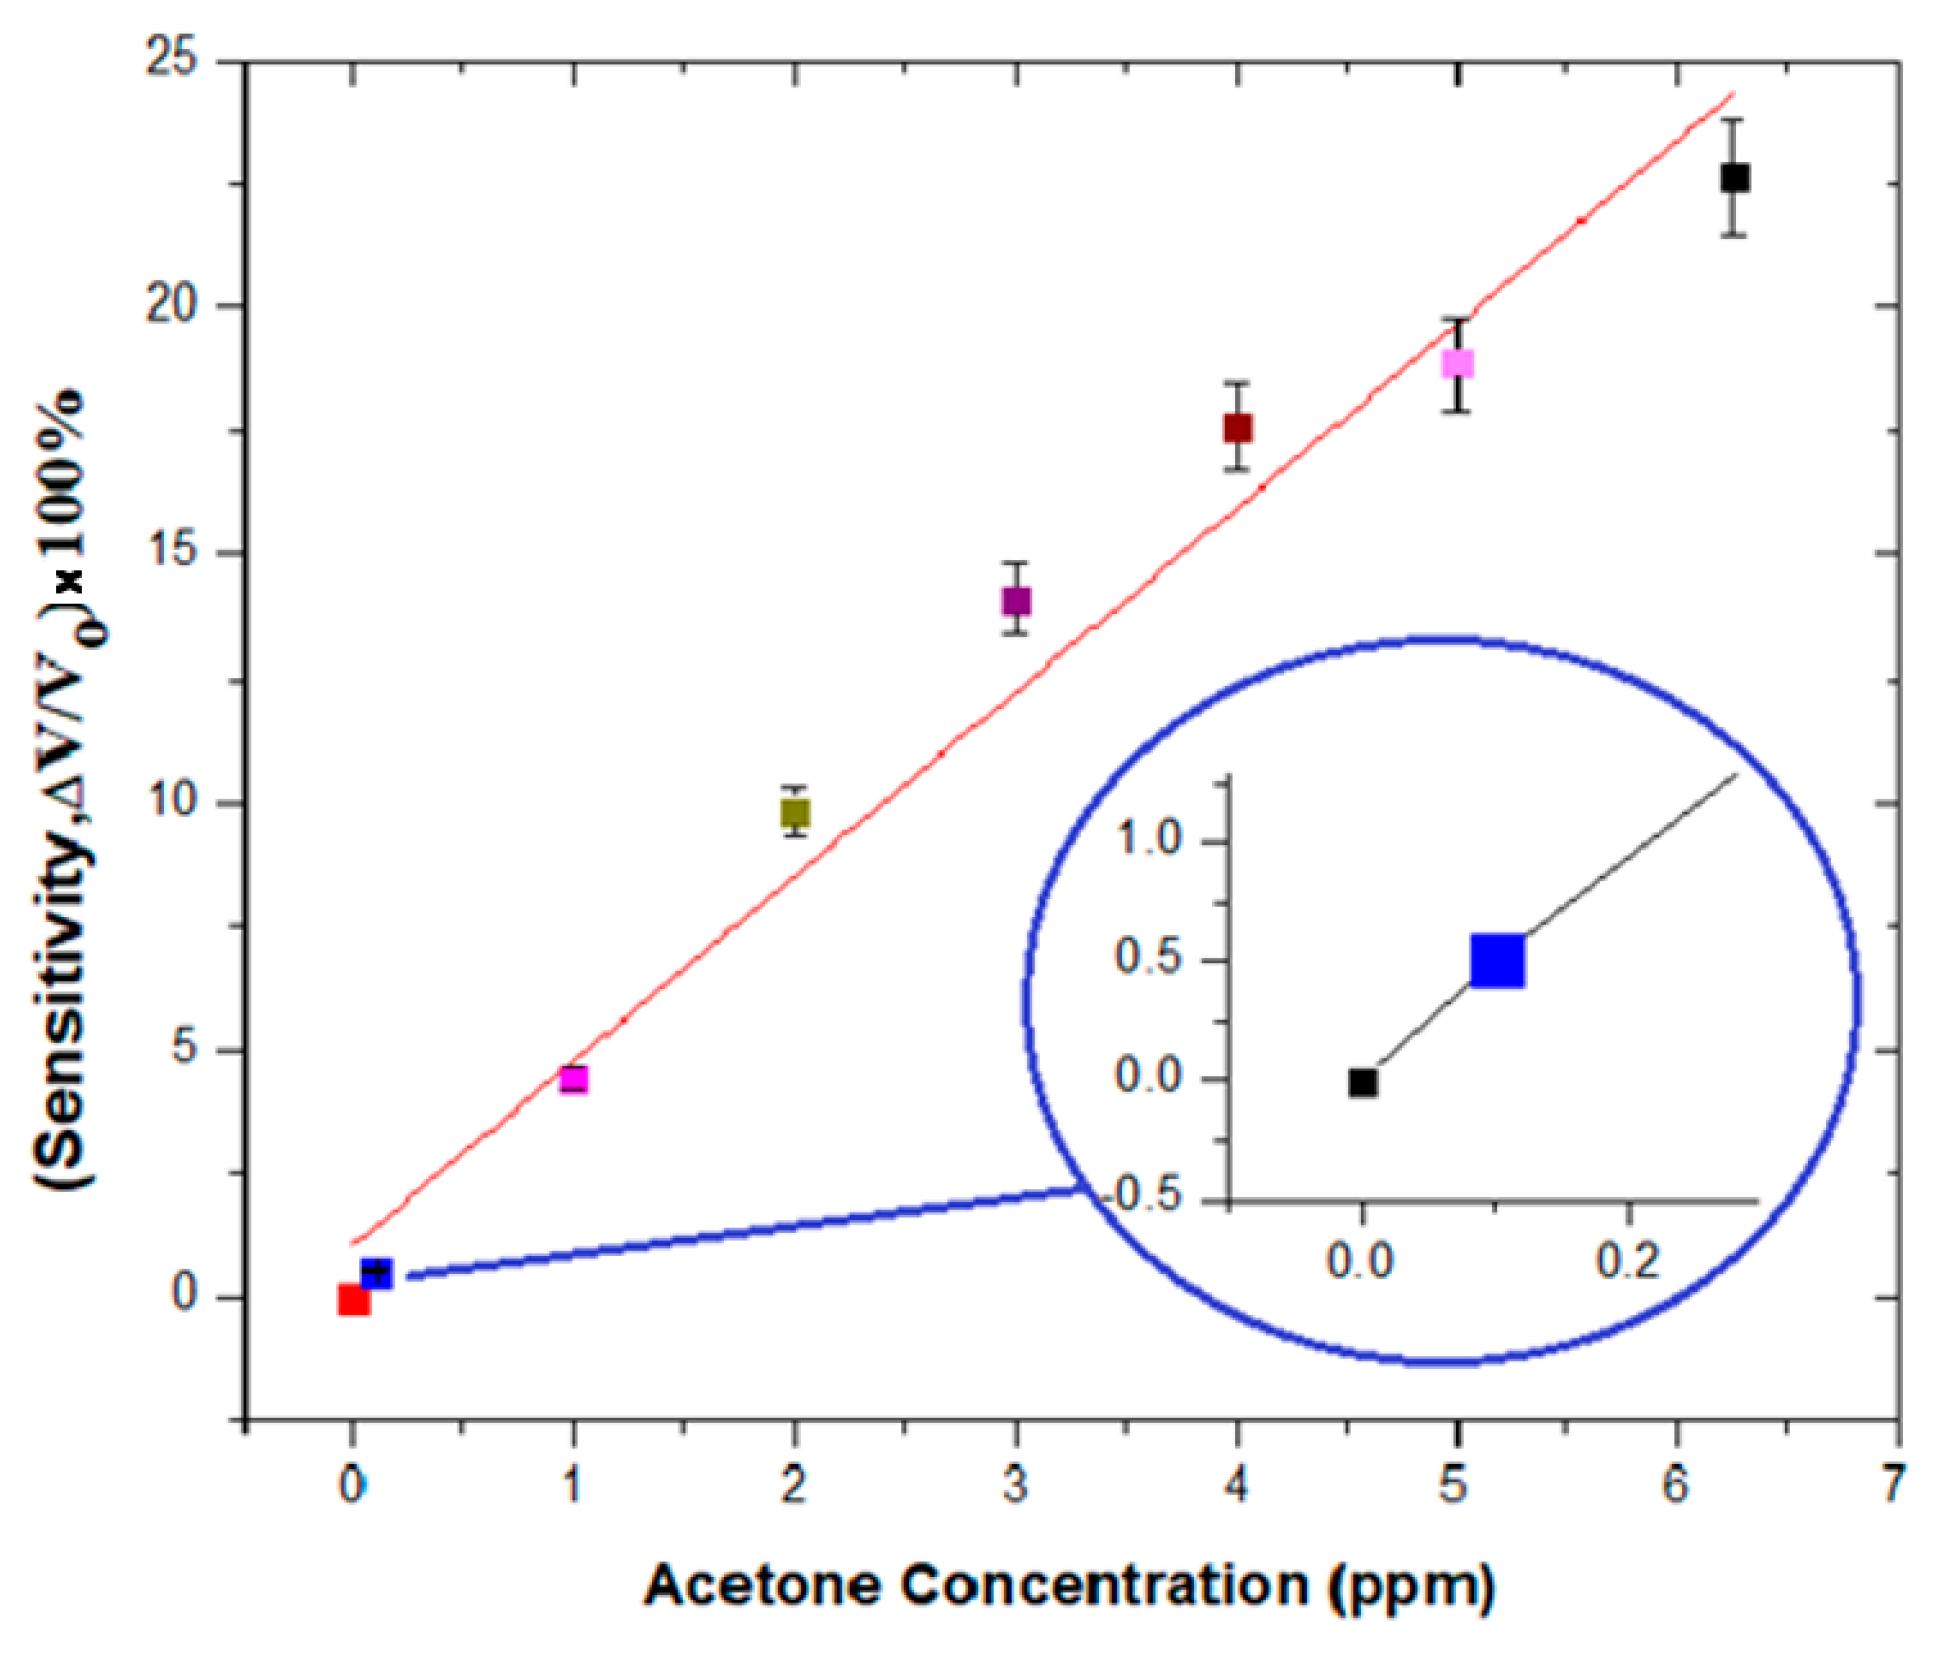
We collected two sets of data from our testing system. Figure 5 shows the sensitivity in terms of voltage that was found for the acetone concentration from 0 to 6.25 ppm. From the curve, we see that the sensitivity shows a linear relationship between the detected signal to the acetone from 0 to 6.25 ppm. Also, Figure 5 reveals an improvement of the sensitivity of KWO sensor when detecting acetone. The sensitivity was about 50.75% even when the concentration of acetone was only about 0.1 ppm.
We compared the sensing performance of the KWO sensor to low concentrations of acetone, 0–6.25 ppm, with and without using improved circuits as the signal collection. Table 1 shows the detection limit and sensitivity while the KWO sensor system employed the optimized detecting circuit. For example, the sensitivity of 1.0 ppm of acetone with the improved circuit was 441.1%, while the sensitivity without the improved circuit at 1.0 ppm of acetone was only 10%. The results indicated that the improved circuit significantly improved the sensitivity and detection limit of the KWO sensor. This is a very important improvement, in particular, considering the KWO sensor in application for the purpose of early stage type-1 diabetes diagnosis.
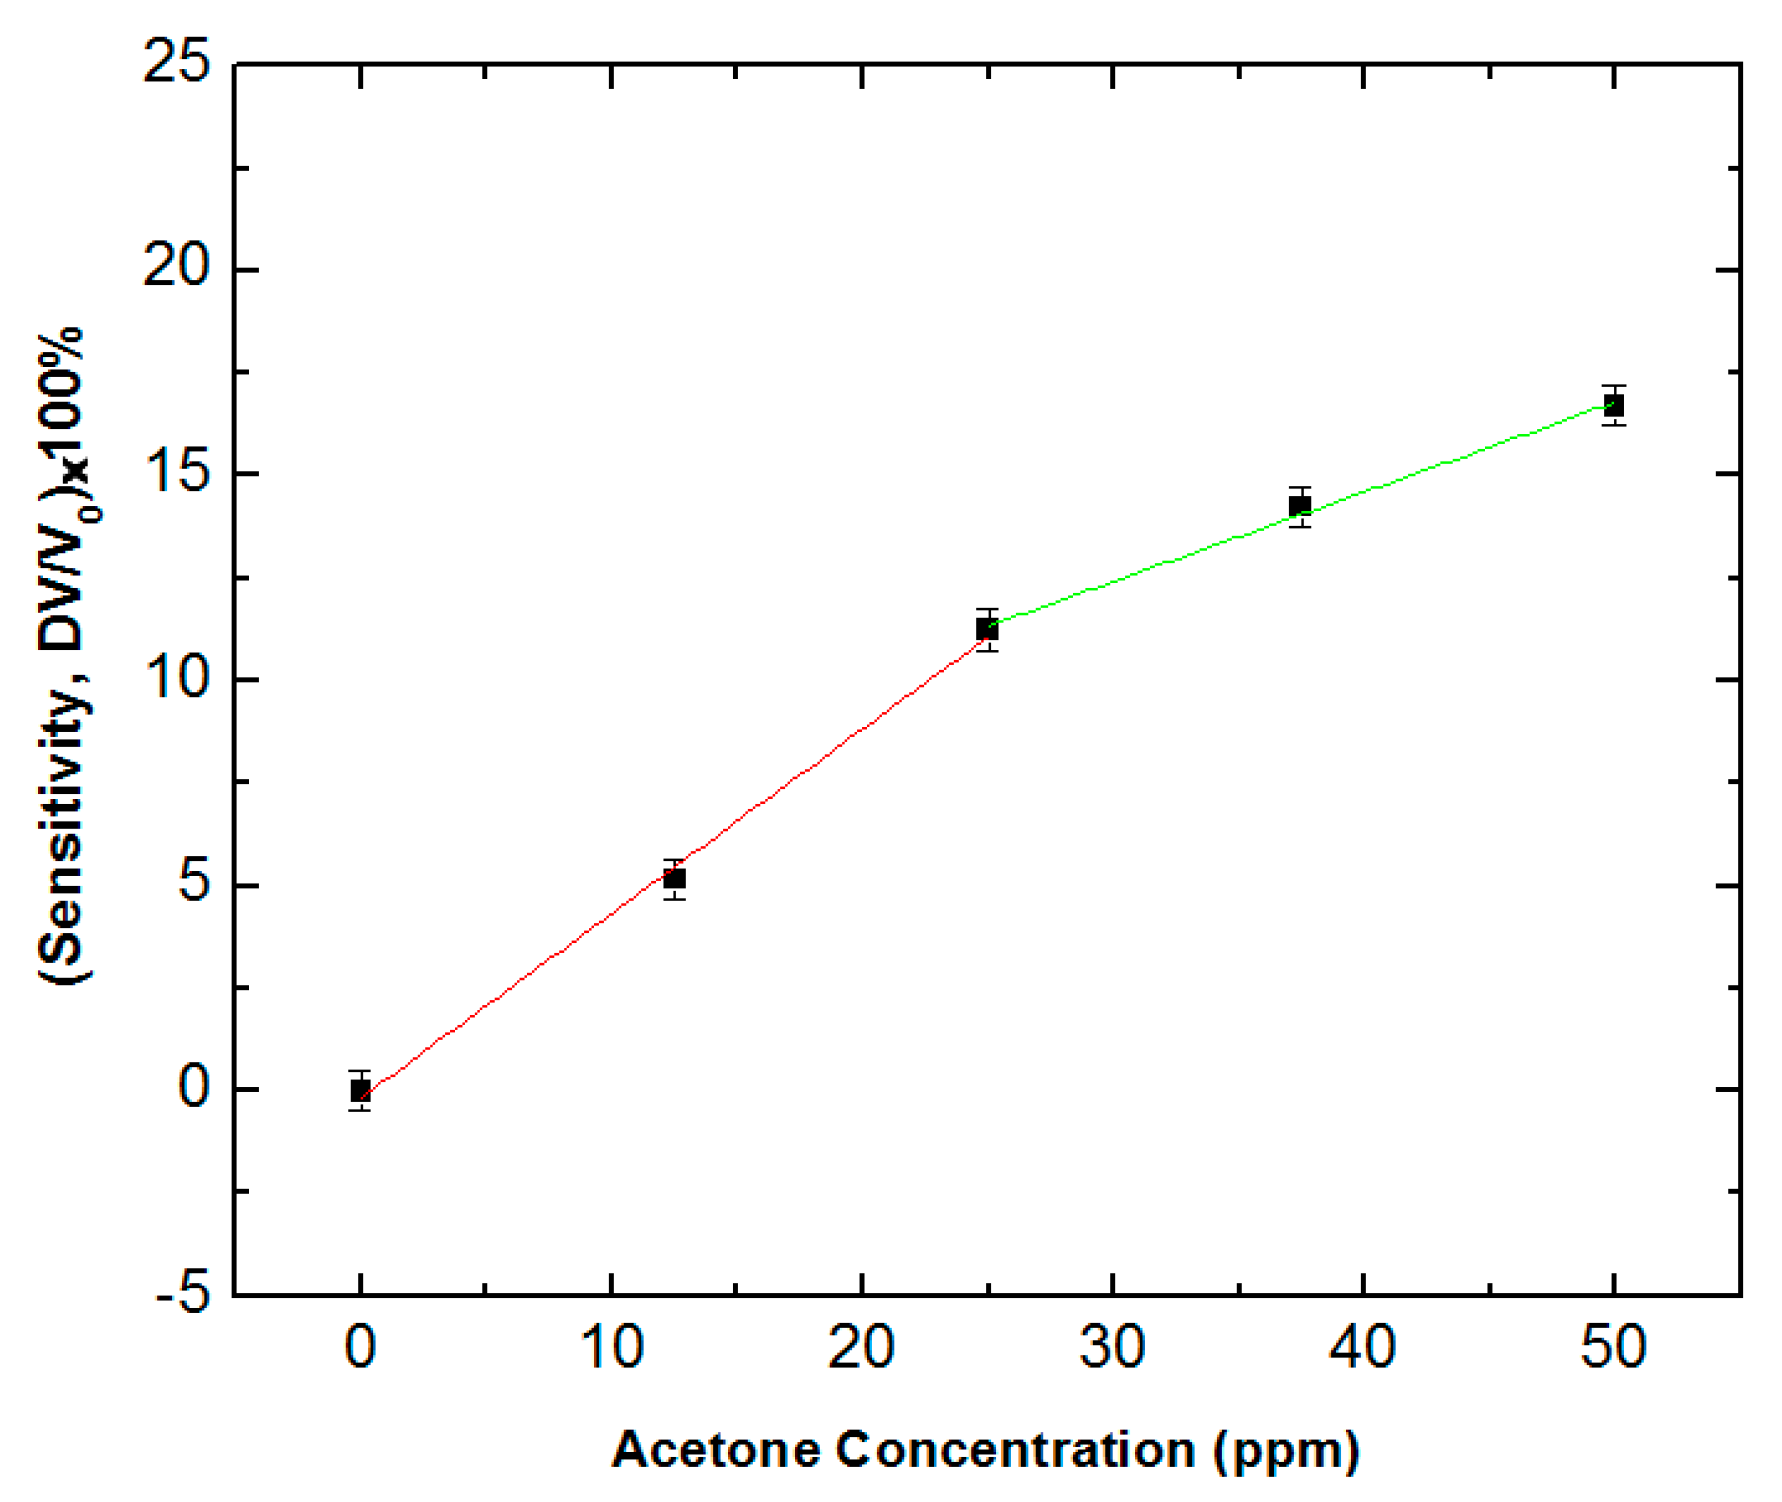
We also measured the voltage change for the acetone concentration from 0 to 50 ppm. Figure 6 shows the sensitivity for the acetone concentration from 0 to 50 ppm. The results indicated a quite linear relationship between the sensitivity and the concentration of acetone from 0 to 25 ppm for the KWO sensor to detect acetone. However, when the concentration of acetone was higher than 25 ppm, the increase of sensitivity was a little bit offset with the increase of acetone concentration. This was because the resistance of the KWO sensor was higher than 50 MΩ while it was exposed with a higher concentration of acetone such as more than 25 ppm. Such a high resistance made the output voltage from the voltage divider branch unable to make a proportional change for the corresponding acetone concentration. Therefore, it was difficult for the circuit to show a broader linear response with the change of acetone concentration from 0 to 50 ppm. This is one limitation of this improved circuit, which we need to further optimize in order to make this circuit be compatible with a broad range of acetone concentrations.
6. Conclusions
To conclude, a modified signal detection system with new circuits was specifically designed for weak signal detection. The results show a significant improvement of the sensitivity of the KWO sensor device has been reached, which is very helpful for early stage detection of diabetic. For future work, our plan is to develop a circuit that can read the value linearly with the change of acetone concentration from 0 to 50 ppm or even higher (good dynamic range). Also, we will try to digitize the relationship between this voltage readings and the blood glucose level. Therefore, the patient can read their blood glucose level directly from the readings. Furthermore, we will plan to use the as-designed breath sensor to do in vivo breath testing from patients.
Author Contributions
D.W. conceived and designed the experiments, Q.Z. helped the KWO fabrication, M.J. has contributed to the material synthesis and characterization section, and D.W. and M.R.H. have conducted sensor testing and also wrote the paper.
Funding
This research is supported by Sanford Health—NDSU Research Seed Grant (Grant No. FAR0028165), Offerdahl Seed Grant (gift funds), NDSU Centennial Endowment award (Grant No. FAR0029296), and ND NASA EPSCoR grant (Grant No. FAR0030154). The authors would like to thank for them for their financial support. Also, the authors would like to acknowledge the NDSU Core Research Facilities for providing access to microfabrication tools and materials characterization instruments.
Conflicts of Interest
The authors declare no conflict of interest.
References
- Wang, C.; Mbi, A.; Shepherd, M. A Study on Breath Acetone in Diabetic Patients Using a Cavity Ringdown Breath Analyzer: Exploring Correlations of Breath Acetone with Blood Glucose and Glycohemoglobin A1C. IEEE Sens. J. 2010, 10, 54–63. [Google Scholar] [CrossRef]
- Harris, M.I. Classification, Diagnostic Criteria, and Screening for Diabetes, Diabetes in America, 2nd ed.; National Diabetes Data Group, National Institutes of Health, and National Institute of Diabetes and Digestive and Kidney Diseases, NIH Publication 95–1468; The National Diabetes Information Clearinghouse (NDIC): Bethesda, MD, USA, 1995; Chapter II; pp. 15–36.
- National Diabetes Statistics Report, Atlanta, GA, USA. 2017. Available online: https://www.cdc.gov/diabetes /data/statistics/statistics-report.html (accessed on 1 September 2018).
- Mayo Clinic Staff. Type 1 Diabetes. 2017. Available online: https://www.mayoclinic.org/diseases-conditions/type-1-diabetes/symptoms-causes/syc-20353011 (accessed on 1 September 2018).
- National Institute of Diabetes and Digestive and Kidney Diseases (NIDDK). The A1C Test & Diabetes. Available online: https://www.niddk.nih.gov/healthinformation/diabetes/overview/tests-diagnosis/a1c-test (accessed on 1 September 2018).
- American Diabetes Association. Diagnosing Diabetes and Learning about Prediabetes. Arlington, VA, USA. Available online: http://www.diabetes.org/diabetes-basics/diagnosis/ (accessed on 1 September 2018).
- Fenske, J.D.; Paulson, S.E. Human Breath Emissions of VOCs. J. Air Waste Manag. Assoc. 2011, 49, 594–598. [Google Scholar] [CrossRef]
- Chen, S.; Zieve, L.; Mahadevan, V. Mercaptans and dimethyl sulfide in the breath of patients with cirrhosis of the liver. Effect of feeding methionine. J. Lab. Clin. Med. 1970, 75, 628–635. [Google Scholar] [PubMed]
- Hossain, M.R.; Zhang, Q.; Johnson, M.; Wang, D. Investigation of humidity cross-interference effect on acetone breath sensor based on nanostructured K2W7O22. Eng. Press. 2017, 1, 30–34. [Google Scholar]
- Peng, G.; Tisch, U.; Adams, O.; Hakim, M.; Shehada, N.; Broza, Y.Y.; Billan, S.; Abdah-Bortnyak, R.; Kuten, A.; Haick, H. Diagnosing lung cancer in exhaled breath using gold nanoparticles. Nat. Nanotechnol. 2009, 4, 669–673. [Google Scholar] [CrossRef] [PubMed]
- King, J.; Unterkofler, K.; Teschl, G.; Teschl, S.; Koc, H.; Hinterhuber, H.; Amann, A. A mathematical model for breath gas analysis of volatile organic compounds with special emphasis on acetone. J. Math. Biol. 2011, 63, 959–999. [Google Scholar] [CrossRef] [PubMed] [Green Version]
- Owen, O.E.; Trapp, V.E.; Skutches, C.L.; Mozzoli, M.A.; Hoeldtke, R.D.; Boden, G.; Reichard, G.A., Jr. Acetone metabolism during diabetic ketoacidosis. Diabetes 1982, 31, 242–247. [Google Scholar] [CrossRef] [PubMed]
- Rydosz, A. A Negative Correlation Between Blood Glucose and Acetone Measured in Healthy and Type 1 Diabetes Mellitus Patient Breath. J. Diabetes Sci. Technol. 2015, 9, 881–884. [Google Scholar] [CrossRef] [PubMed] [Green Version]
- Turner, C.; Walton, C.; Hoashi, S.; Evans, M. Breath acetone concentration decreases with blood glucose concentration in type I diabetes mellitus patients during hypoglycaemic clamps. J. Breath Res. 2009, 3. [Google Scholar] [CrossRef] [PubMed]
- Sun, M.; Wang, Z.; Yuan, Y.; Chen, Z.; Zhao, X.; Li, Y.; Wang, C. Continuous Monitoring of Breath Acetone, Blood Glucose and Blood Ketone in 20 Type 1 Diabetic Outpatients Over 30 Days. J. Anal. Bioanal. Tech. 2017, 8. [Google Scholar] [CrossRef]
- Tassopou, C.; Barnett, D.; Fraser, T.R. Breath-Acetone and Blood-Sugar Measurements in Diabetes. Lancet 1969, 293, 1282–1286. [Google Scholar] [CrossRef]
- Wang, D.; Zhang, Q. Room temperature acetone sensor based on nanostructured K2W7O22. In Proceedings of the IEEE Sensors, Orlando, FL, USA, 30 October–2 November 2016. [Google Scholar]
- Wang, Z.; Wang, C. Is breath acetone a biomarker of diabetes? A historical review on breath acetone measurements. J. Breath Res. 2013, 7, 037109. [Google Scholar] [CrossRef] [PubMed]
- Lee, J.; Ngo, J.; Blake, D.; Meinardi, S.; Pontello, A.M.; Newcomb, R.; Galassetti, P.R. Improved predictive models for plasma glucose estimation from multi-linear regression analysis of exhaled volatile organic compounds. J. Appl. Physiol. 2009, 107, 155–160. [Google Scholar] [CrossRef] [PubMed] [Green Version]
- Turner, C.; Parekh, B.; Walton, C.; Spanel, P.; Smith, D.; Evans, M. An exploratory comparative study of volatile compounds in exhaled breath and emitted by skin using selected ion flow tube mass spectrometry. Rapid Commun. Mass Spectrom. 2008, 22, 526–532. [Google Scholar] [CrossRef] [PubMed]
- Minh, T.D.; Oliver, S.R.; Ngo, J.; Flores, R.; Midyett, J.; Meinardi, S.; Carlson, M.K.; Rowland, F.S.; Blake, D.R.; Galassetti, P.R. Noninvasive measurement of plasma glucose from exhaled breath in healthy and type 1 diabetic subjects. Am. J. Physiol. Endocrinol. Metab. 2011, 300, 1166–1175. [Google Scholar] [CrossRef] [PubMed]
- Sun, M.; Zhao, X.; Yin, H.; Wang, Z.; Jiang, C.; Liu, W.; Chen, Z.; Yuan, Y.; Li, Y.; Wang, C. Study of breath acetone and its correlations with blood glucose and blood beta-hydroxybutyrate using an animal model with lab-developed type 1 diabetic rats. RSC Adv. 2015, 5, 71002–71010. [Google Scholar] [CrossRef]
- Righettoni, M.; Schmid, A.; Amann, A.; Pratsinis, S.E. Correlations between blood glucose and breath components from portable gas sensors and PTR-TOF-MS. J. Breath Res. 2013, 7, 037110. [Google Scholar] [CrossRef] [PubMed]
- Deng, C.H.; Zhang, J.; Yu, X.; Zhang, W.; Zhang, X. Determination of acetone in human breath by gas chromatography-mass spectrometry and solid-phase micro extraction with on-fiber derivatization. J. Chromatogr. B 2004, 810, 269–275. [Google Scholar] [CrossRef]
- Jansson, B.O.; Larsson, B.T. Analysis of organic compounds in human breath by gas chromatography-Mass Spectrometry. J. Lab. Clin. Med. 1969, 74, 961–966. [Google Scholar] [PubMed]
- Smith, D.; Spanel, P. Selected ion flow tube mass spectrometry (SIFT-MS) for on-line trace gas analysis. Mass Spectrom. Rev. 2005, 24, 661–700. [Google Scholar] [CrossRef] [PubMed]
- Blake, R.S.; Monks, P.S.; Ellis, A.M. Proton-Transfer Reaction Mass Spectrometry. Chem. Rev. 2009, 109, 861–896. [Google Scholar] [CrossRef] [PubMed]
- Lindsay, S. High Performance Liquid Chromatography, 2nd ed.; Barnes, J., Ed.; John Wiley & Sons: Chichester, UK, 1992; ISBN 978-0-471-93115-7. [Google Scholar]
- Creaser, S.C.; Griffiths, J.R.; Bramwell, C.J.; Noreen, S.; Hillb, C.A.; Paul, T.C.L. Ion mobility spectrometry: A review. Part 1. Structural analysis by mobility measurement. Analyst 2004, 129, 984–994. [Google Scholar] [CrossRef]
- Ewing, R.G.; Atkinson, D.A.; Eiceman, G.A.; Ewing, G.J. A critical review of ion mobility spectrometry for the detection of explosives and explosive related compounds. Talanta 2001, 54, 515–529. [Google Scholar] [CrossRef]
- Wang, C.; Sahay, P. Breath Analysis Using Laser Spectroscopic Techniques: Breath Biomarkers, Spectral Fingerprints, and Detection Limits. Sensors 2009, 9, 8230–8262. [Google Scholar] [CrossRef] [PubMed] [Green Version]
- Wang, C.; Scherrer, S.T.; Hossain, D. Measurements of cavity ringdown spectroscopy of acetone in the ultraviolet and near-infrared spectral regions: Potential for development of a breath analyzer. Appl. Spectrosc. 2004, 58, 784–791. [Google Scholar] [CrossRef] [PubMed]
- Lourenco, C.; Turner, C. Breath analysis in disease diagnosis: Methodological considerations and applications. Metabolites 2014, 4, 465–498. [Google Scholar] [CrossRef] [PubMed]
- Kao, K.W.; Hsu, M.C.; Chang, Y.H.; Gwo, S.; Yeh, J.A. A Sub-Ppm Acetone Gas Sensor for Diabetes Detection Using 10 nm Thick Ultrathin InN FETs. Sensors 2012, 12, 7157–7168. [Google Scholar] [CrossRef] [PubMed]
- Jamalabadi, H.; Alizadeh, N. Enhanced low-temperature response of PPy-WO3 hybrid nanocomposite based gas sensor deposited by electrospinning method for selective and sensitive acetone detection. IEEE Sens. J. 2017, 17, 2322–2328. [Google Scholar] [CrossRef]
- Das, S.; Bag, A.; Kumar, R.; Biswas, D. Fast Response (7.6s) Acetone Sensing by InGaN/GaN on Si (111) at 373 K. IEEE Electron Device Lett. 2017, 38, 383–386. [Google Scholar] [CrossRef]
- Hazra, A.; Bhowmik, B.; Dutta, K.; Bhattacharyya, P. Low Temperature Low ppm Acetone Detection by Pd/TiO2/p-Si Metal-Insulator-Semiconductor Devices. In Proceedings of the 2013 Seventh International Conference on Sensing Technology (ICST), Wellington, New Zealand, 3–5 December 2013. [Google Scholar]
- Wang, D.; Zhang, Q.; Hossain, M.R.; Johnson, M. High Sensitive Breath Sensor Based on Nanostructured K2W7O22 for Detection of Type 1 Diabetes. IEEE Sens. J. 2018, 18, 4399–4404. [Google Scholar] [CrossRef]
- Operational Amplifier. Available online: https://en.wikipedia.org/wiki/Operational_amplifier (accessed on 1 September 2018).
- Wheatstone Bridge. Available online: https://en.wikipedia.org/wiki/Wheatstone_bridge (accessed on 1 September 2018).
- LM741CN-NOPB. Available online: https://www.digikey.com/product-detail/en/texas-instruments/LM741CN NOPB/LM741CNNS-NOPB-ND/6322 (accessed on 1 September 2018).
- Oshpark. Available online: https://oshpark.com/ (accessed on 1 September 2018).
- SPDT Switch. Available online: http://www.learningaboutelectronics.com/Articles/What-is-a-single-pole-double-throw-switch-SPDT (accessed on 1 September 2018).
- Op-Amp Buffer. Available online: https://www.eecs.tufts.edu/~dsculley/tutorial/opamps/opamps5.html (accessed on 1 September 2018).
- Electrostatic Interactions. Available online: https://www.sciencedirect.com/topics/chemistry/electrostatic-interactions (accessed on 1 September 2018).
- Fine, G.F.; Cavanagh, L.M.; Afonja, A.; Binions, R. Metal Oxide Semi-Conductor Gas Sensors in Environmental Monitoring. Sensors 2010, 10, 5469–5502. [Google Scholar] [CrossRef] [PubMed] [Green Version]
- Chemical Sensors. Available online: https://www.nap.edu/read/4782/chapter/10#74 (accessed on 15 October 2018).
- Sensor. Available online: https://en.wikipedia.org/wiki/Sensor (accessed on 15 October 2018).
- Kargar, A. Sensitivity Analysis of Silicon Nanowire Chemical Sensor. In Proceedings of the 8th IEEE Conference on Nanotechnology, Arlington, TX, USA, 18–21 August 2008. [Google Scholar]
Figure 1.
Schematic diagram of Wheatstone bridge.

Figure 2.
(a) PCB layout of the gas detection circuit; (b) Schematic diagram of the amplified circuit.
Figure 2.
(a) PCB layout of the gas detection circuit; (b) Schematic diagram of the amplified circuit.

Figure 3.
Block diagram of the testing system.

Figure 4.
Electrostatic attraction between acetone molecules and the KWO sensor.

Figure 5.
Sensitivity readings due to change in concentration of acetone for 0–6.25 ppm.

Figure 6.
Sensitivity readings due to changes in concentration of acetone for 0–50 ppm.


Table 1.
Sensitivity comparison between improved circuit measurement system (sample 1) and previous resistance measurement system (sample 2) for acetone concentrations of 0–6.25 ppm.
Table 1.
Sensitivity comparison between improved circuit measurement system (sample 1) and previous resistance measurement system (sample 2) for acetone concentrations of 0–6.25 ppm.
| Acetone Concentration (ppm) | Sample 1 (Sensitivity, ΔV/Vo) × 100% | Sample 2 (Sensitivity, ΔR/Ro) × 100% |
|---|---|---|
| 0 | 0 | 0 |
| 1 | 4.411 | 0.1 |
| 2 | 9.823 | 0.2 |
| 3 | 14.117 | 0.225 |
| 4 | 17.588 | 0.245 |
| 5 | 18.882 | 0.28 |
| 6.25 | 22.647 | 0.29 |
© 2018 by the authors. Licensee MDPI, Basel, Switzerland. This article is an open access article distributed under the terms and conditions of the Creative Commons Attribution (CC BY) license (http://creativecommons.org/licenses/by/4.0/).
Share and Cite
MDPI and ACS Style
Hossain, M.R.; Zhang, Q.; Johnson, M.; Wang, D. Highly Sensitive Room-Temperature Sensor Based on Nanostructured K2W7O22 for Application in the Non-Invasive Diagnosis of Diabetes. Sensors 2018, 18, 3703. https://doi.org/10.3390/s18113703
AMA Style
Hossain MR, Zhang Q, Johnson M, Wang D. Highly Sensitive Room-Temperature Sensor Based on Nanostructured K2W7O22 for Application in the Non-Invasive Diagnosis of Diabetes. Sensors. 2018; 18(11):3703. https://doi.org/10.3390/s18113703
Chicago/Turabian StyleHossain, Md Razuan, Qifeng Zhang, Michael Johnson, and Danling Wang. 2018. "Highly Sensitive Room-Temperature Sensor Based on Nanostructured K2W7O22 for Application in the Non-Invasive Diagnosis of Diabetes" Sensors 18, no. 11: 3703. https://doi.org/10.3390/s18113703
Note that from the first issue of 2016, this journal uses article numbers instead of page numbers. See further details here.