Enhanced Infrared Image Processing for Impacted Carbon/Glass Fiber-Reinforced Composite Evaluation

 ,
, 
 , ,
, ,  ,
,
Abstract
:
1. Introduction
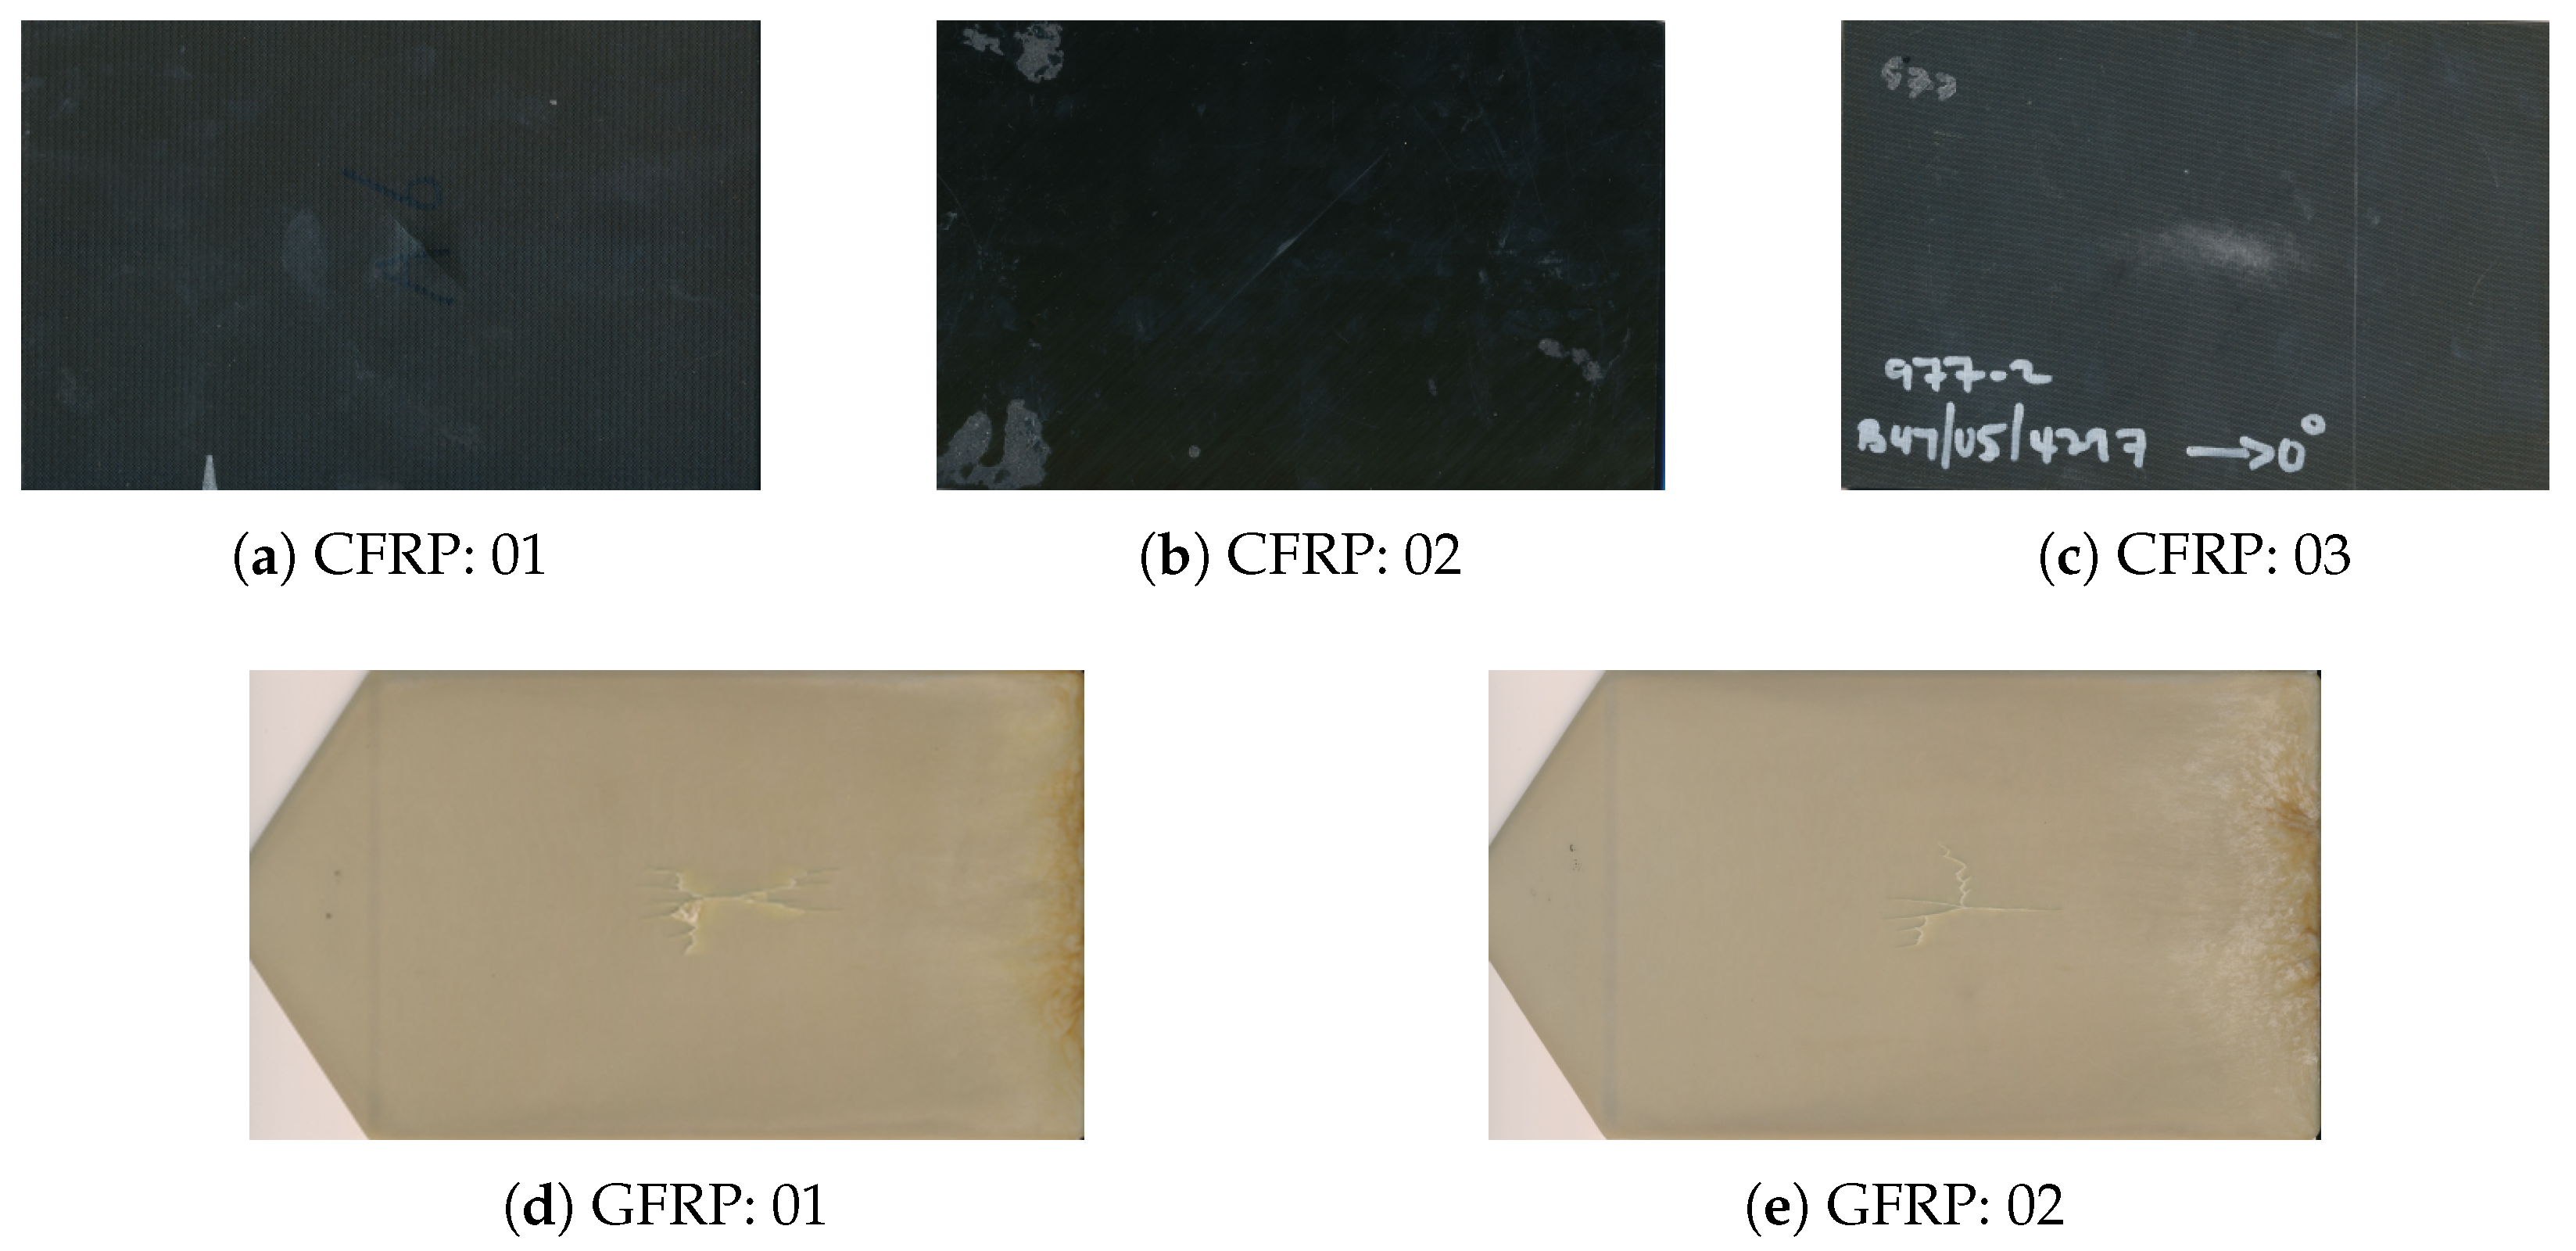
2. Materials
3. Methodology
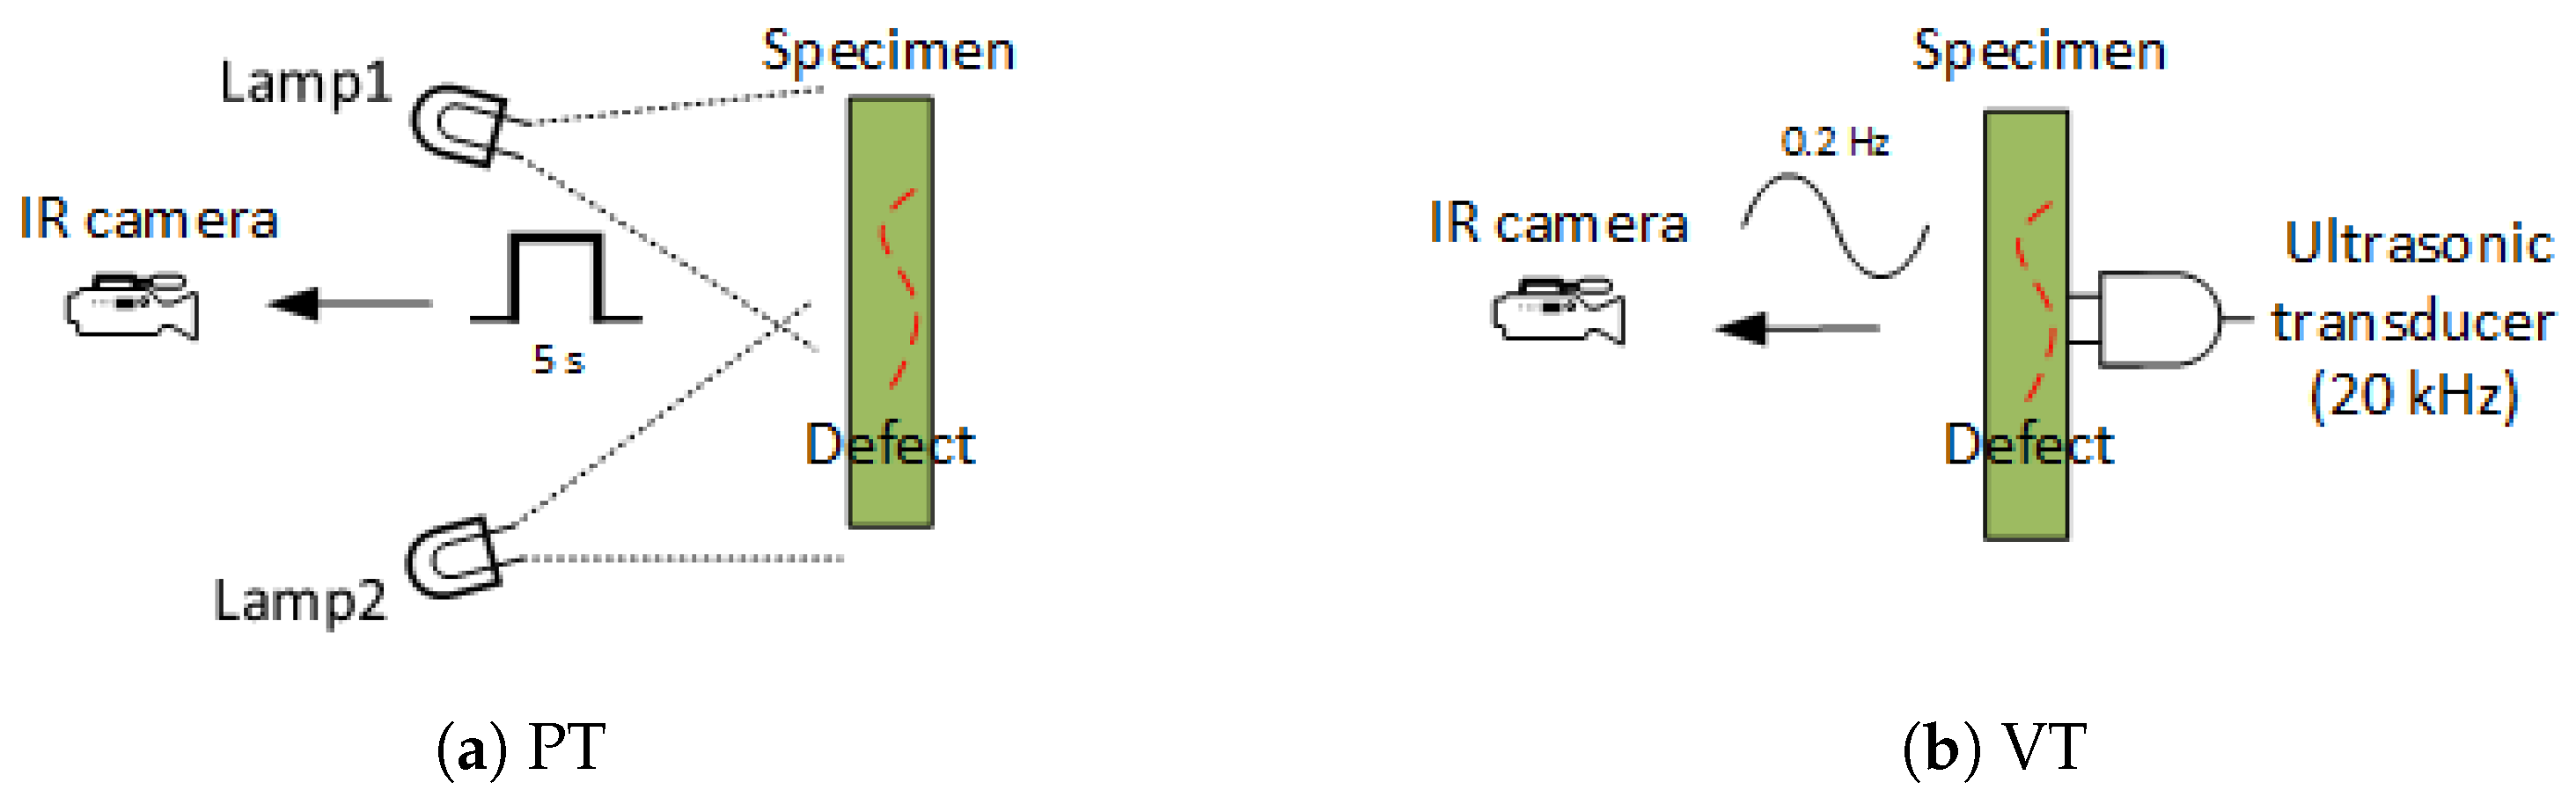
3.1. Experimental Configurations
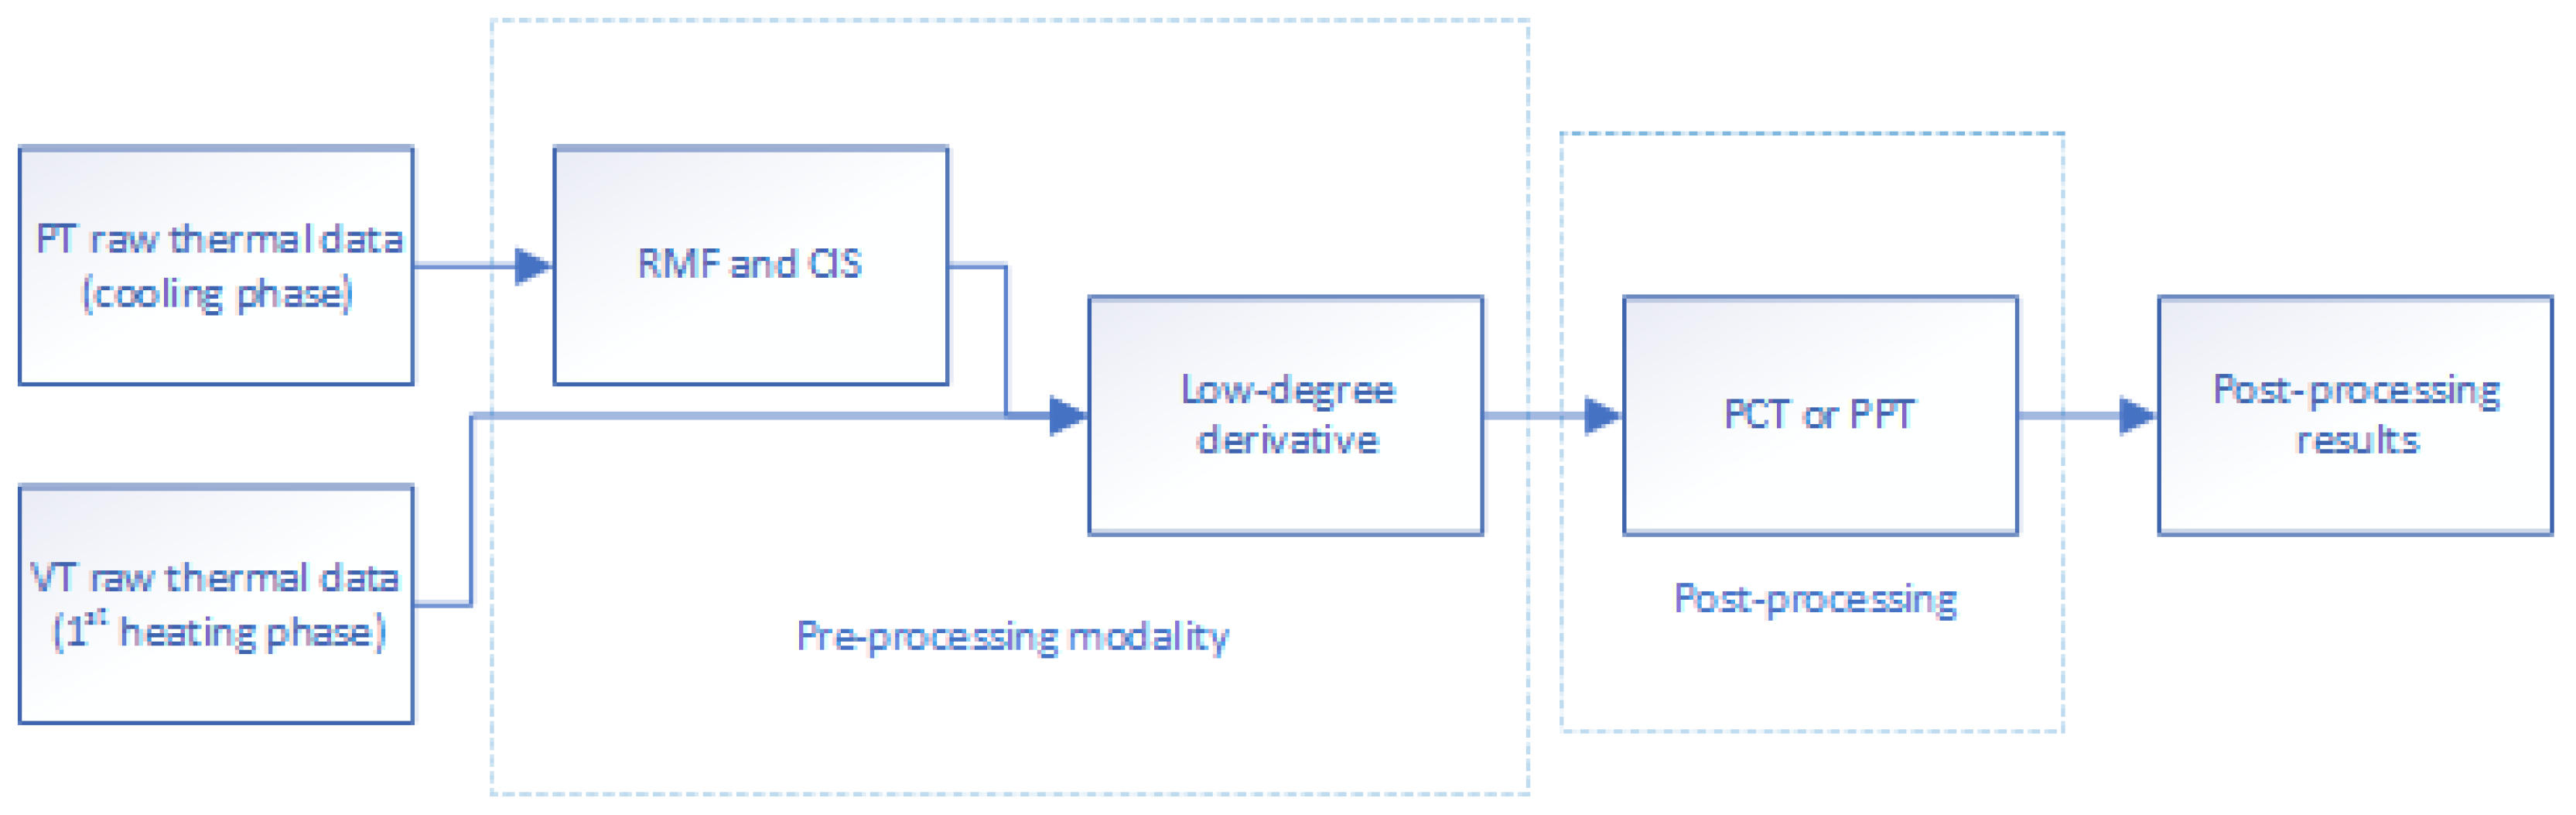
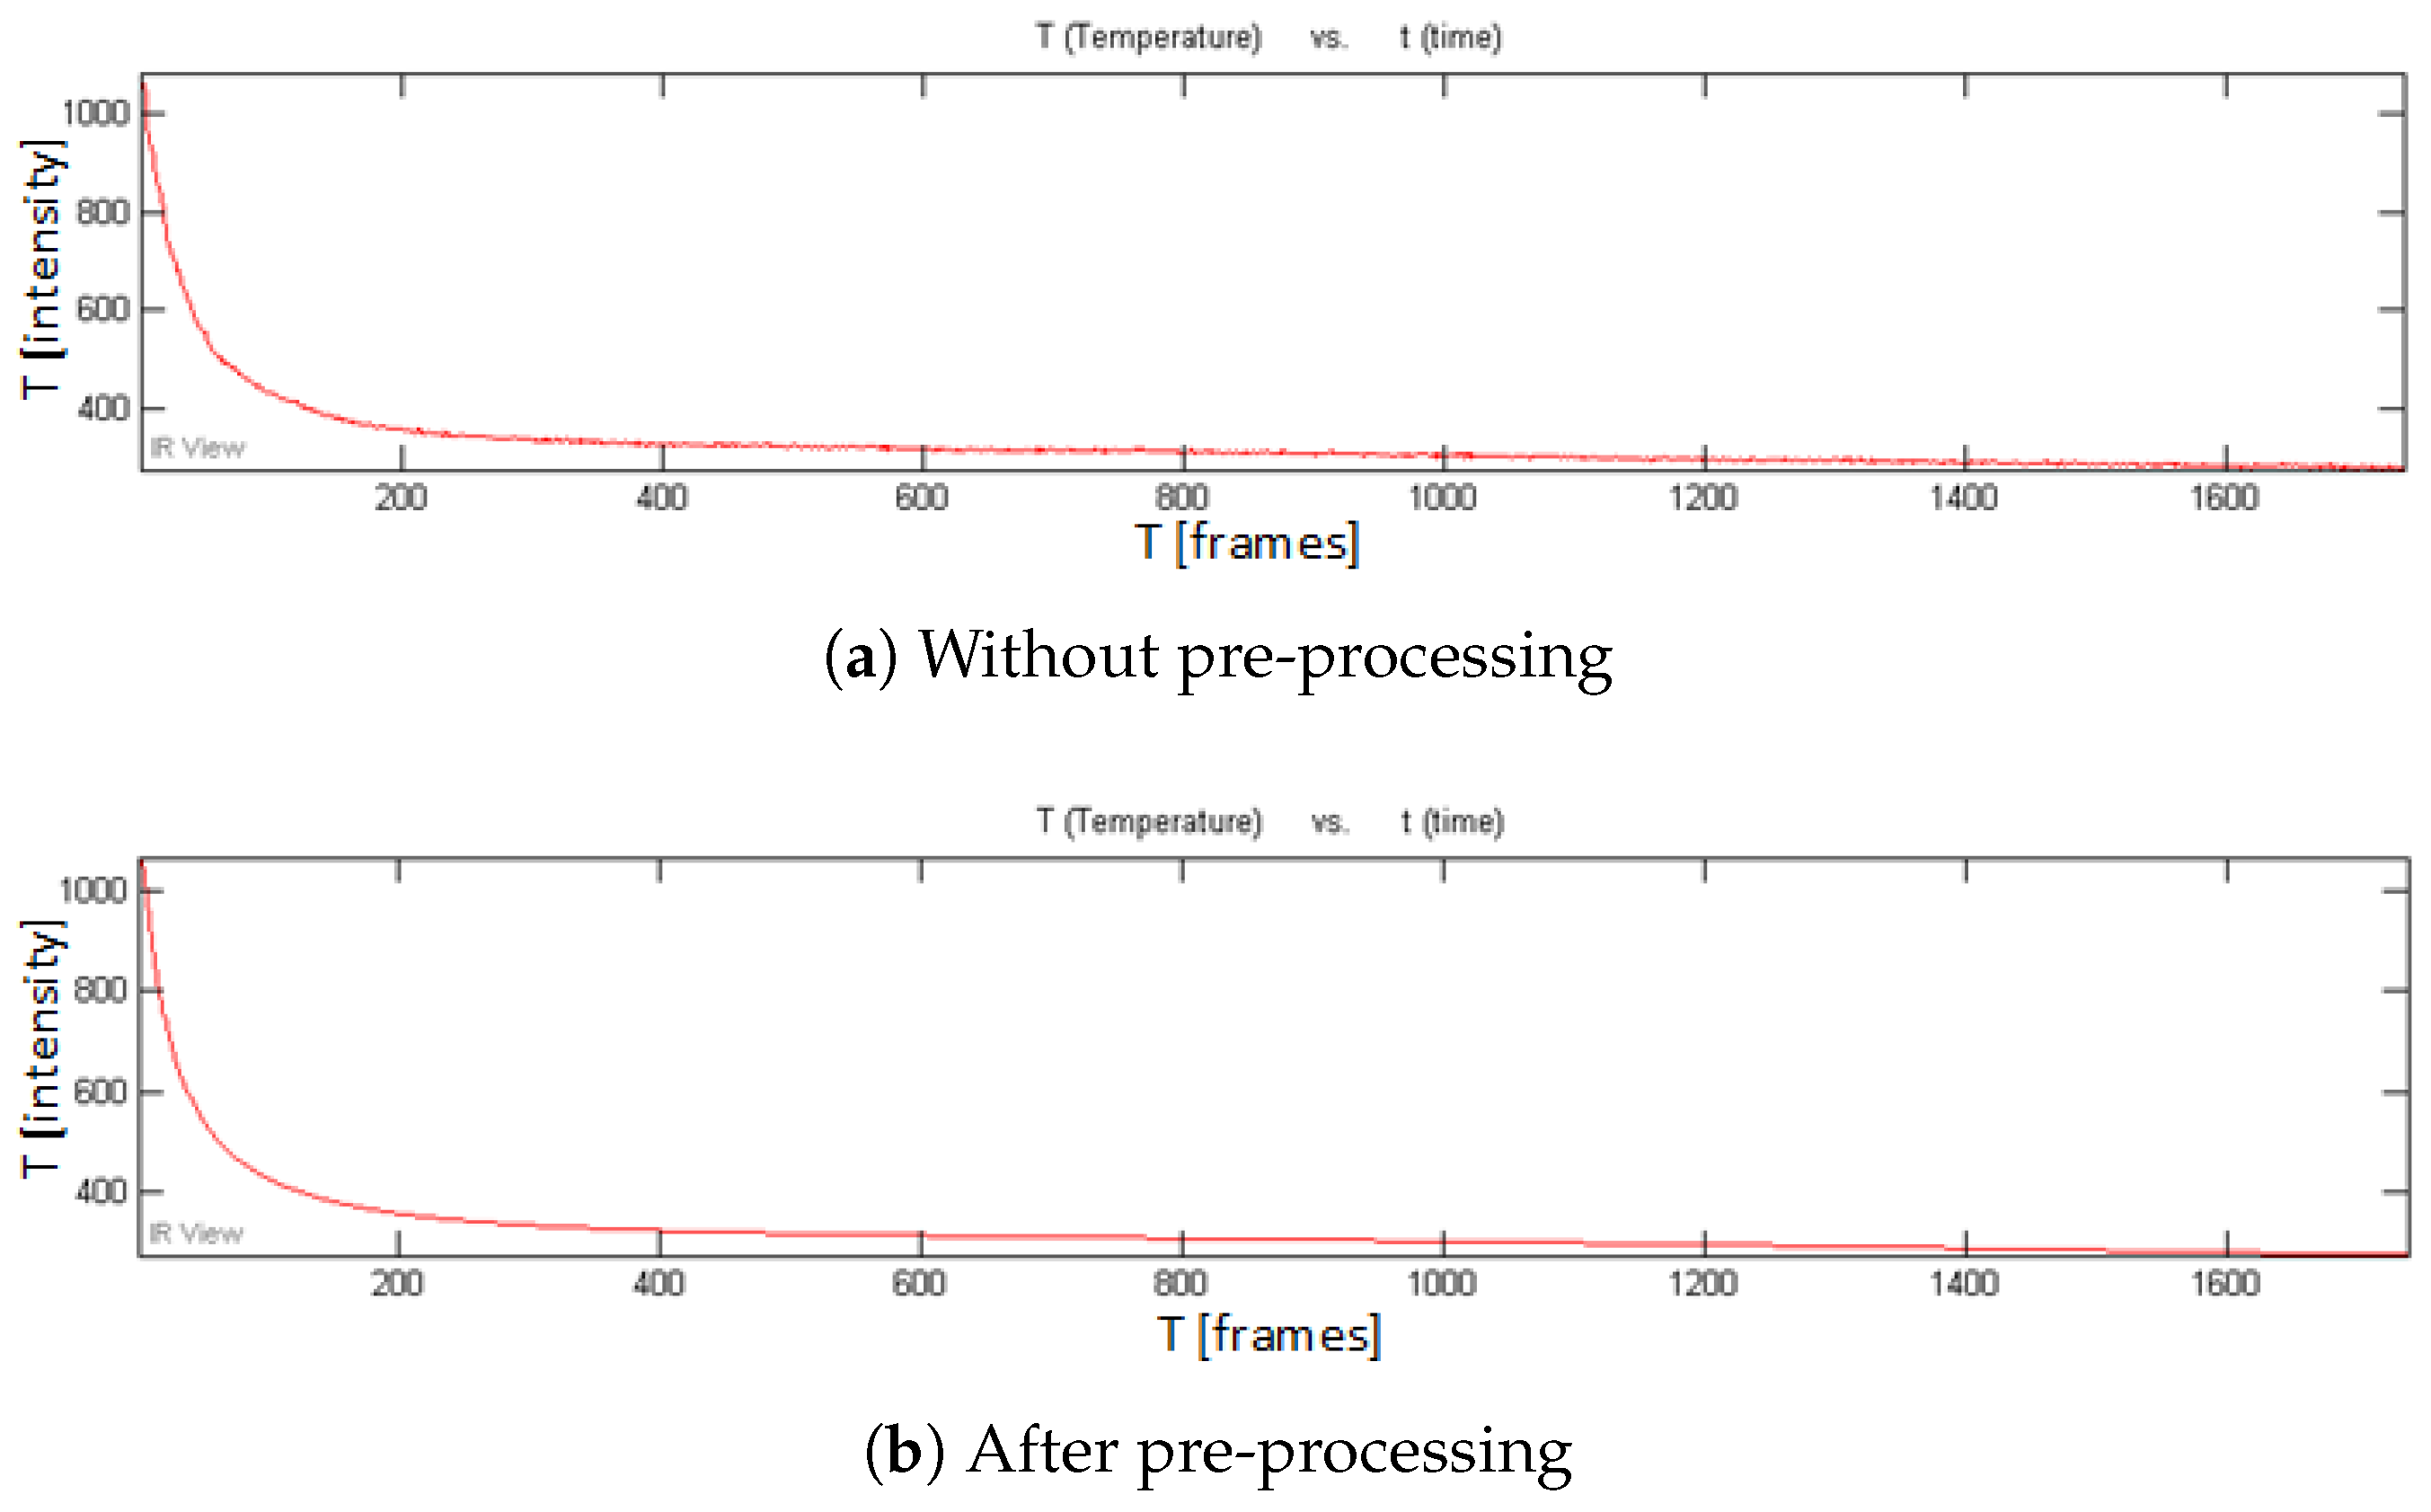
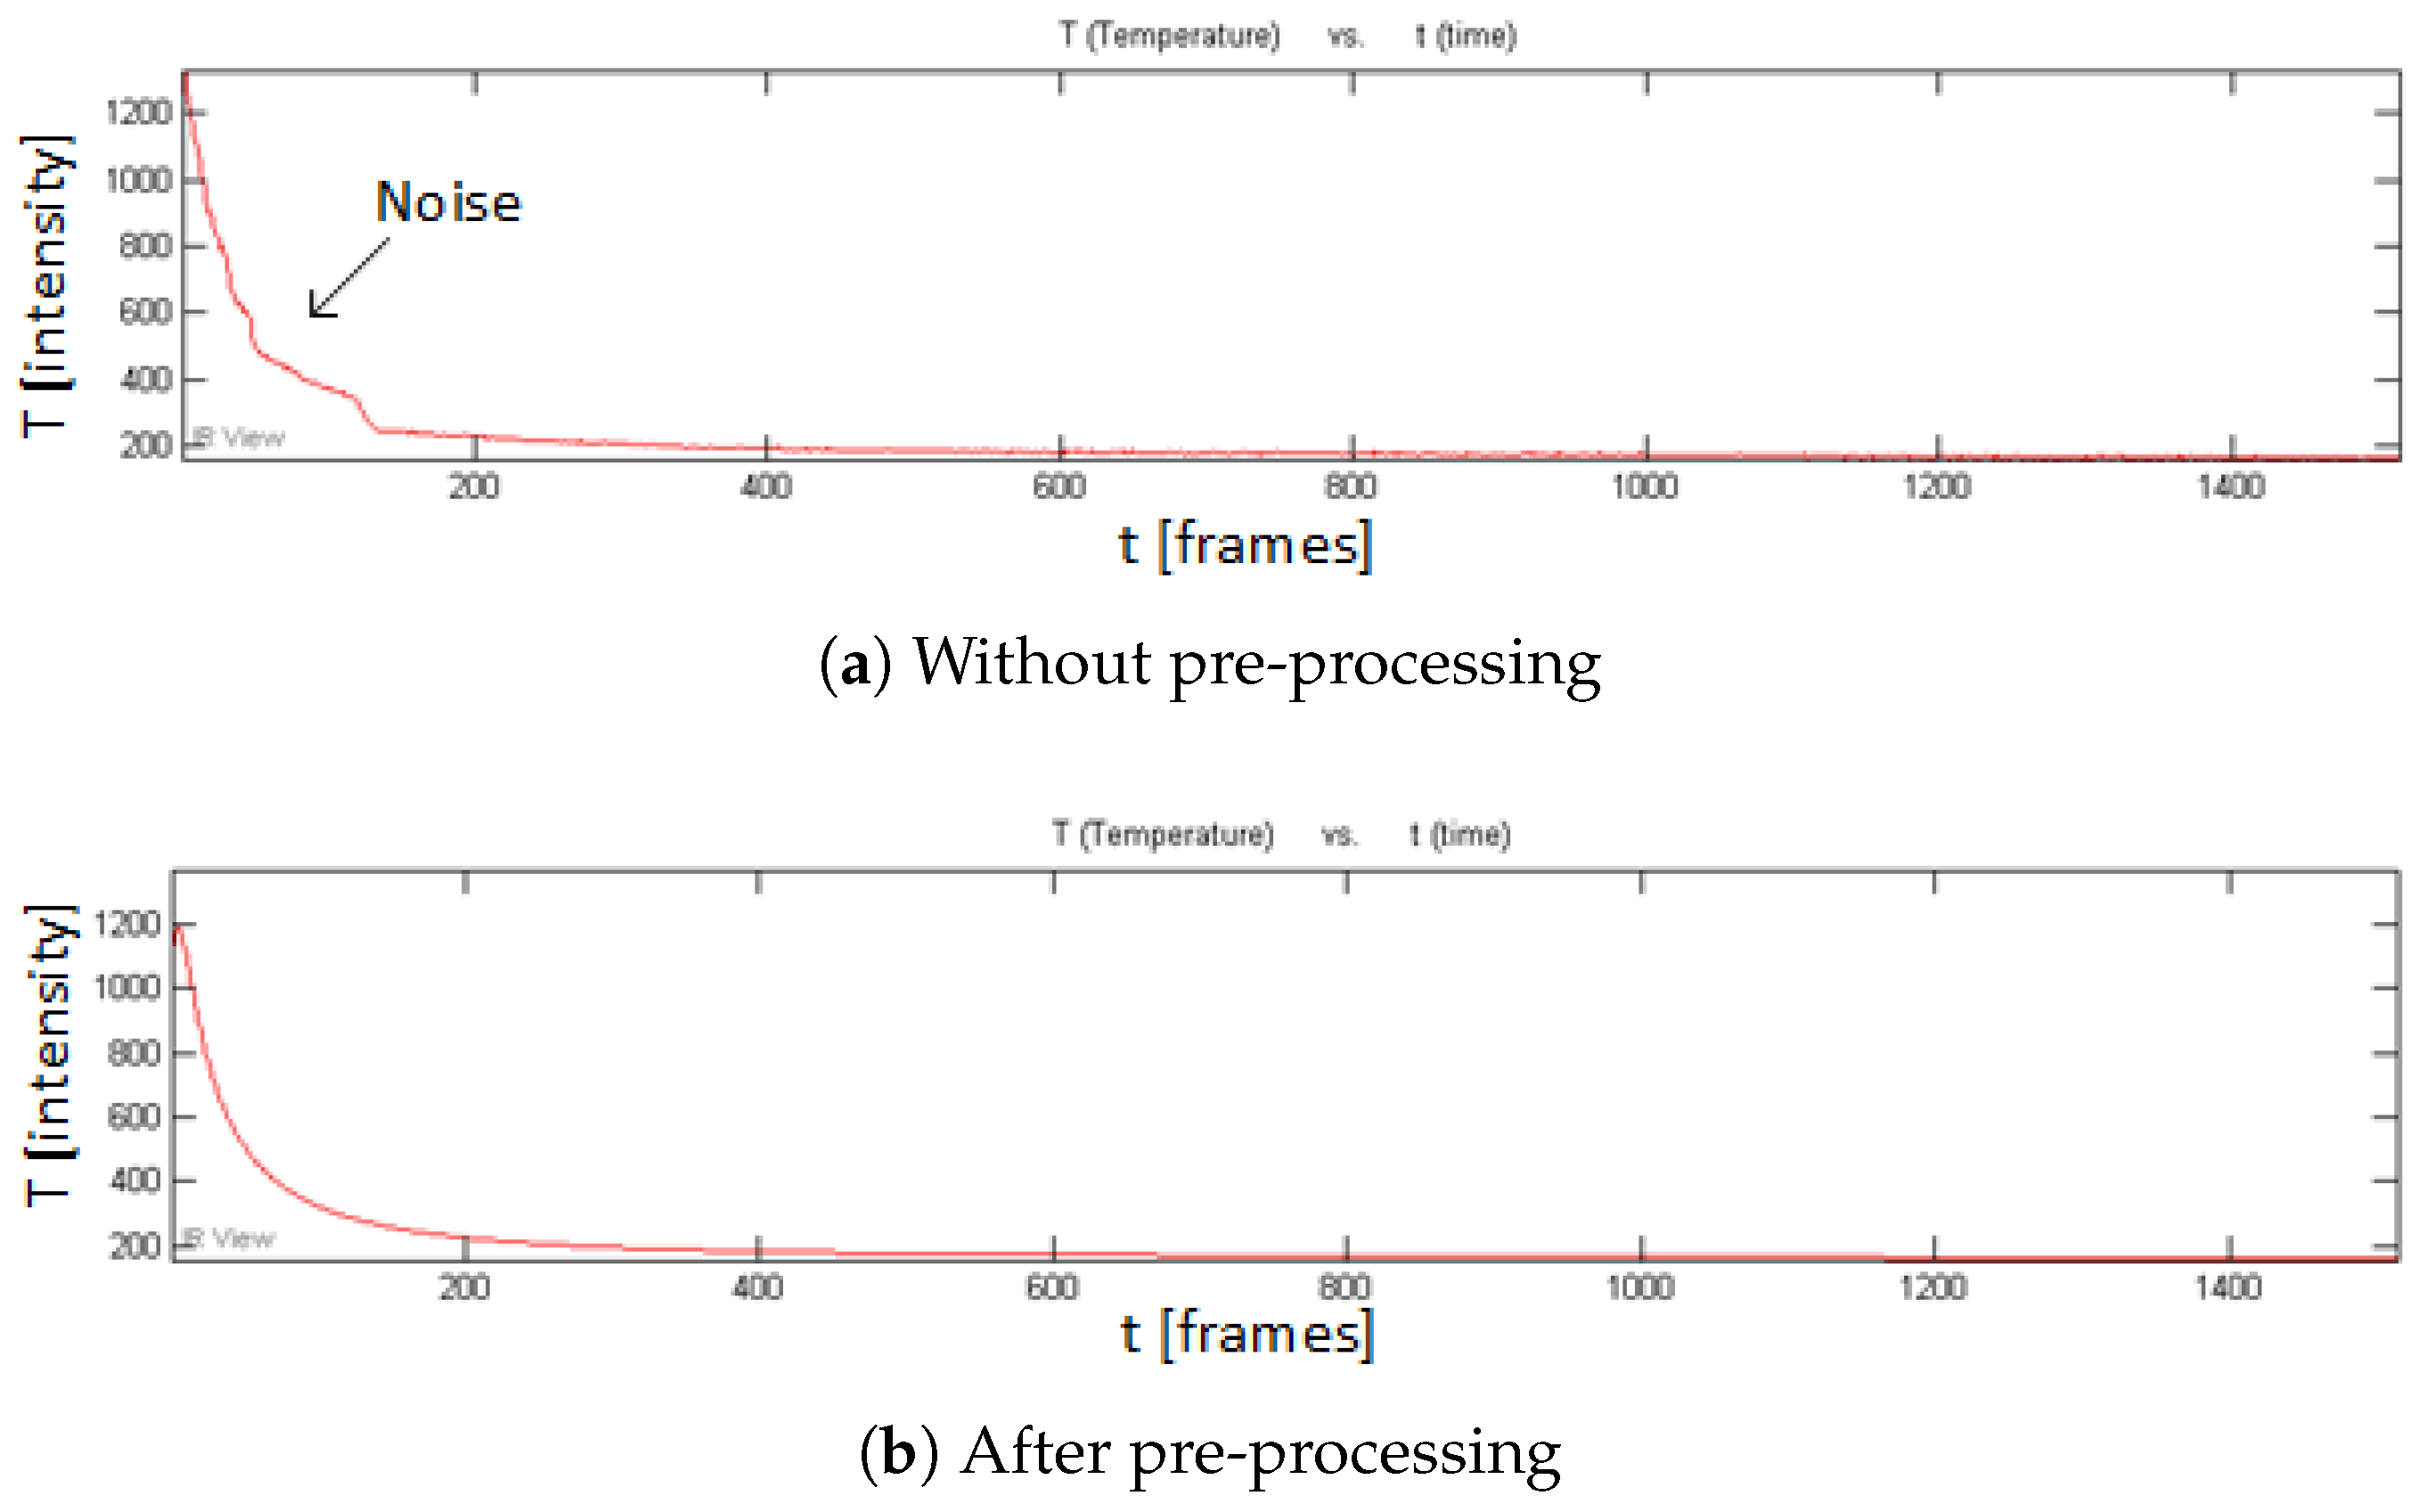
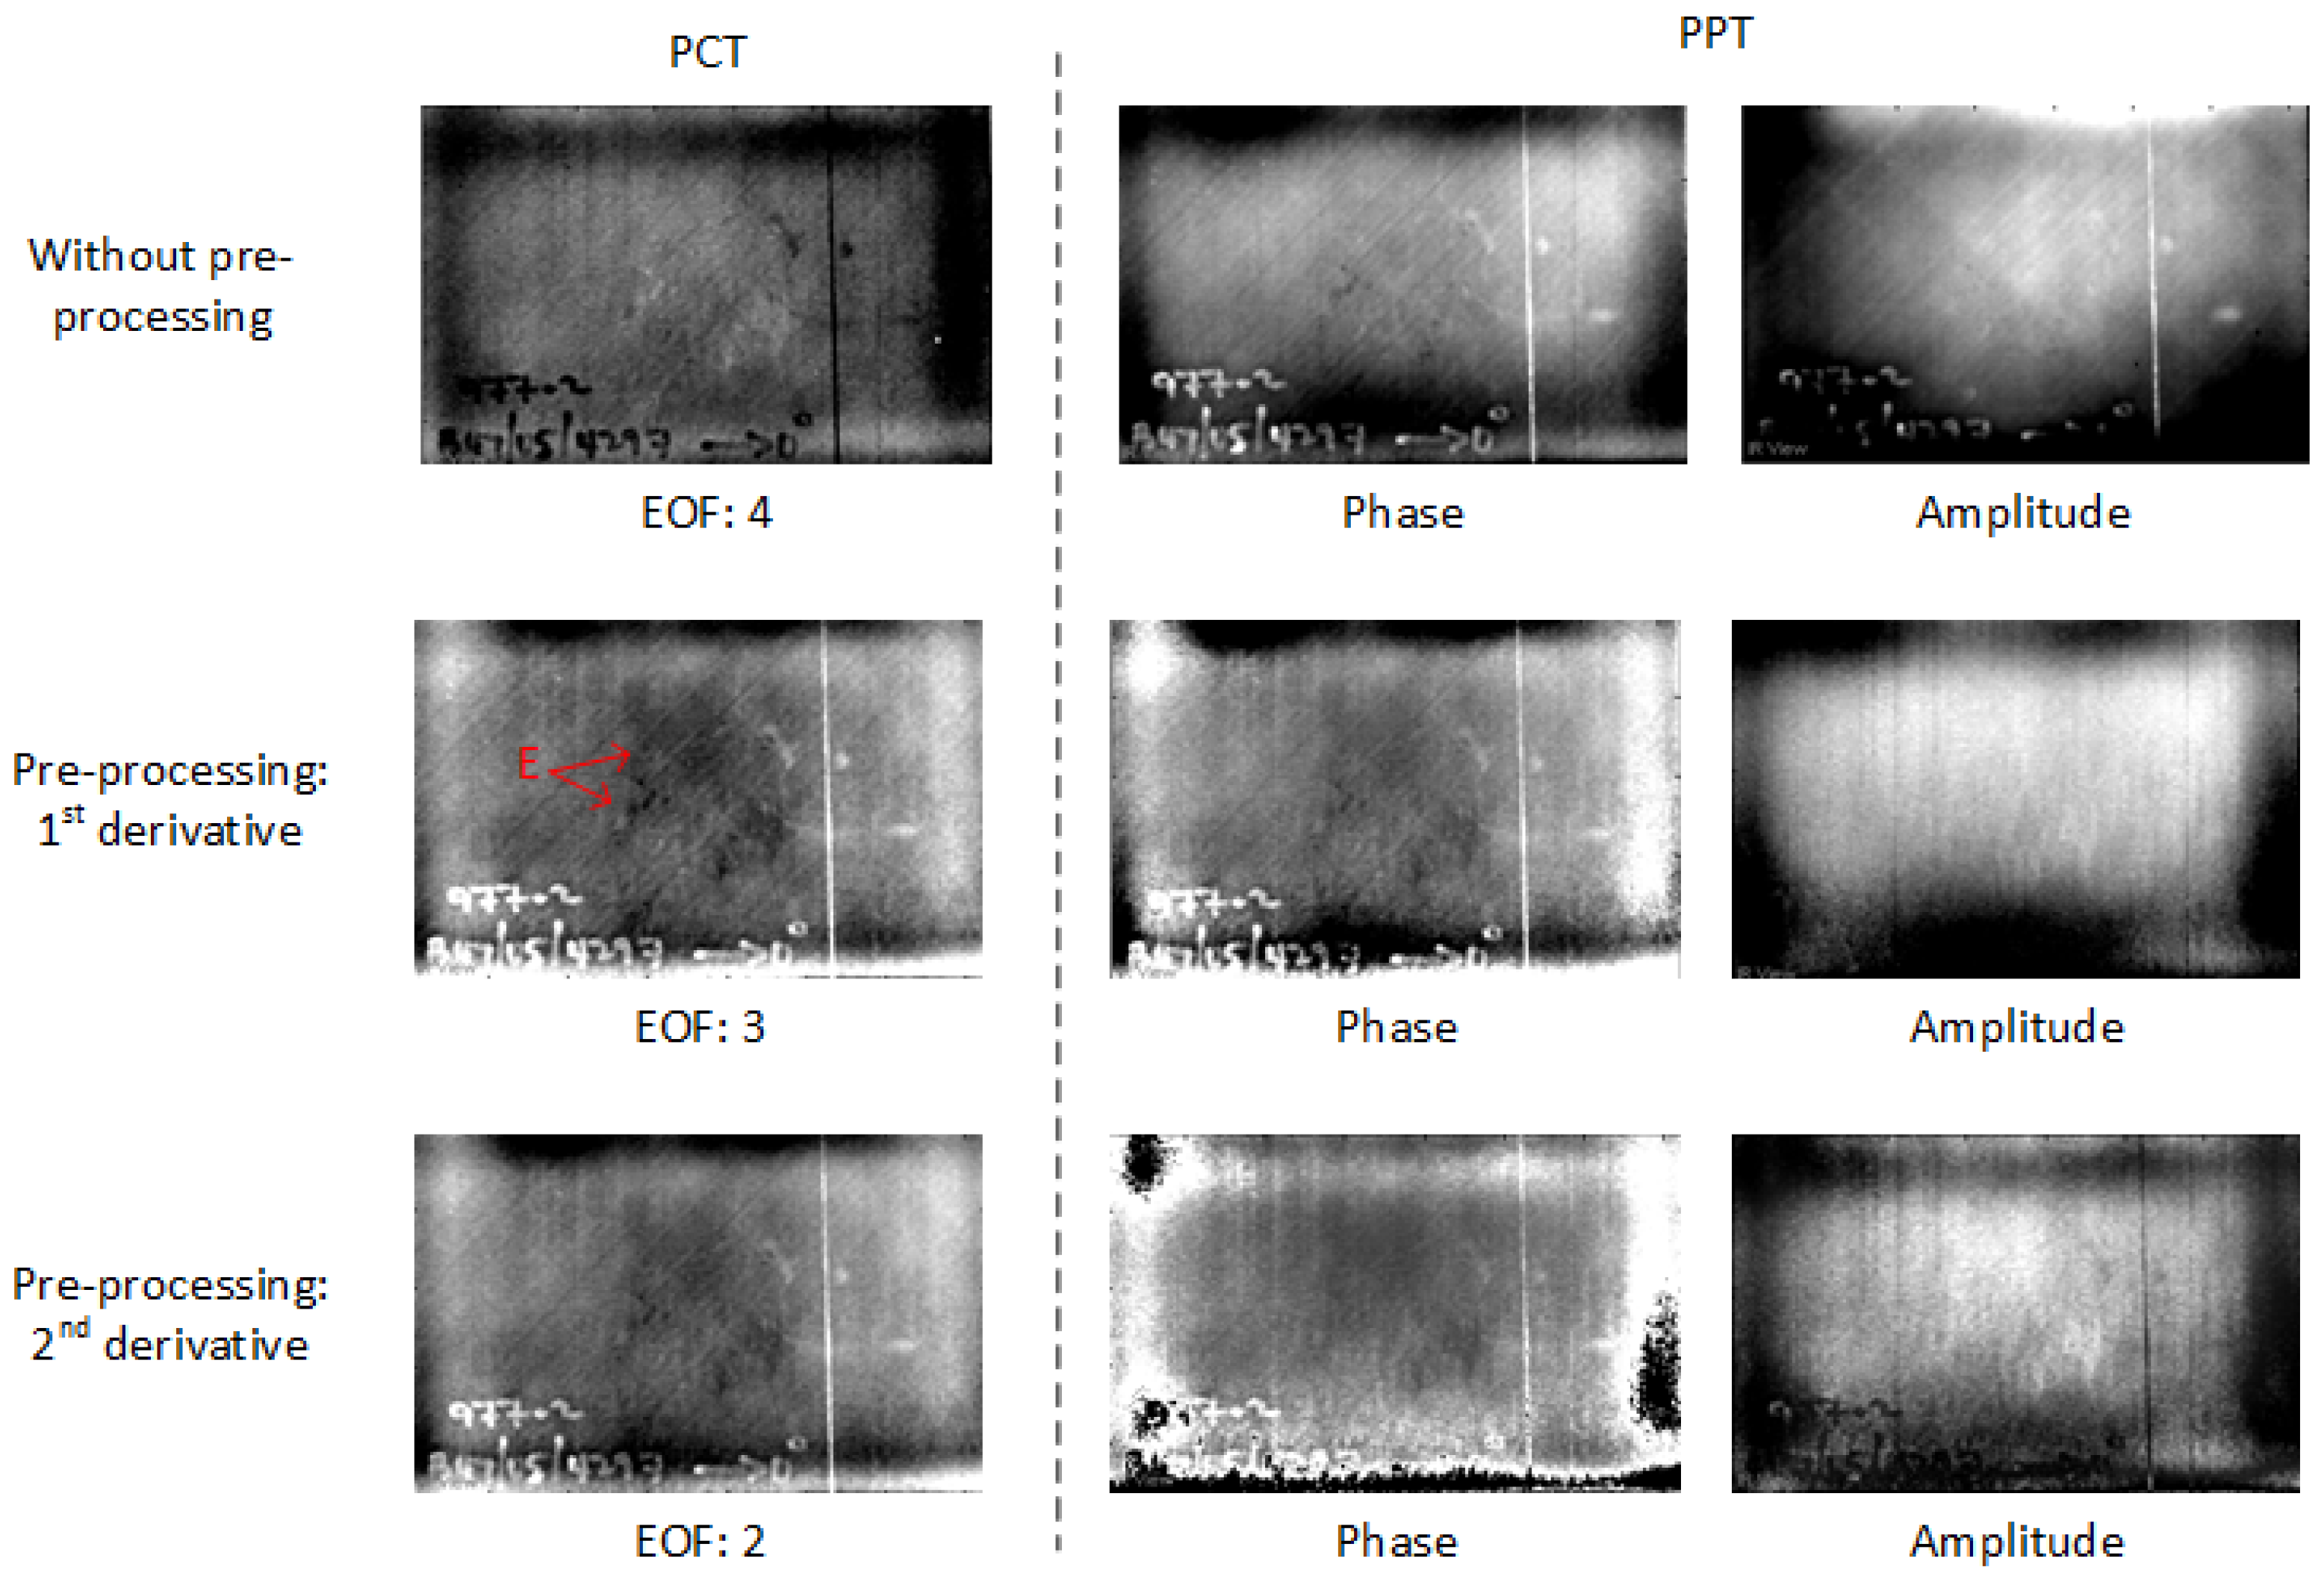
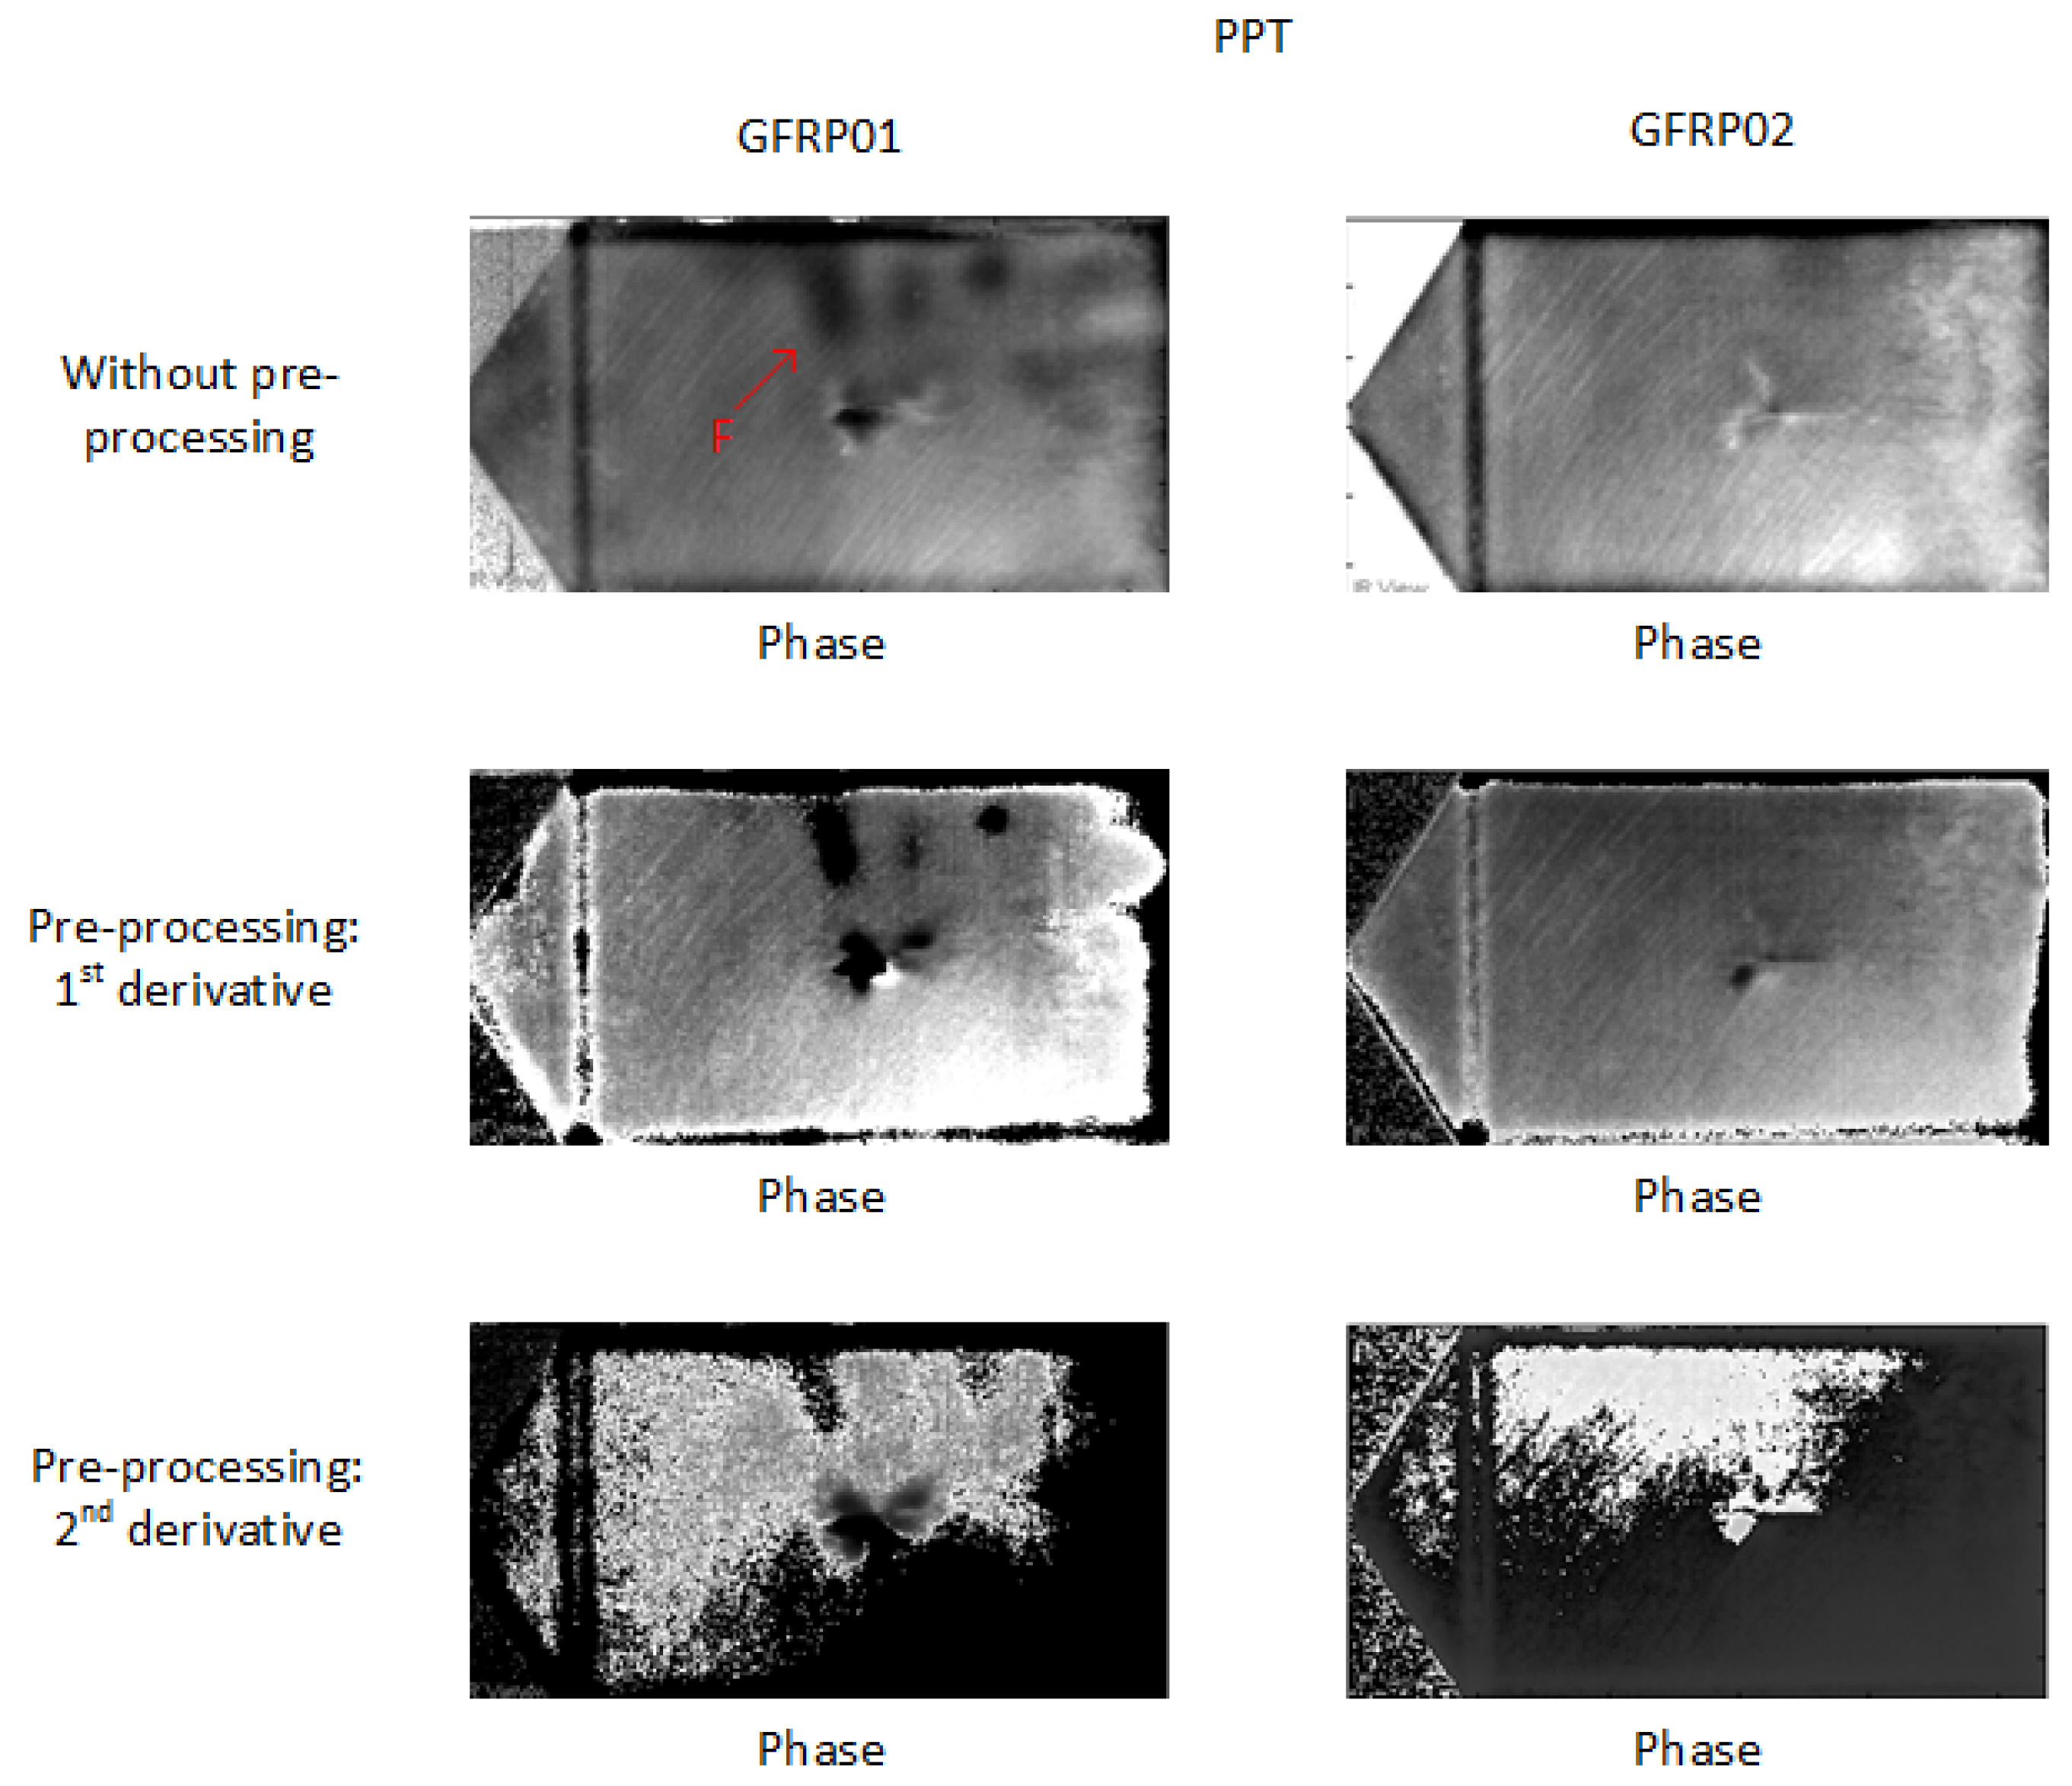
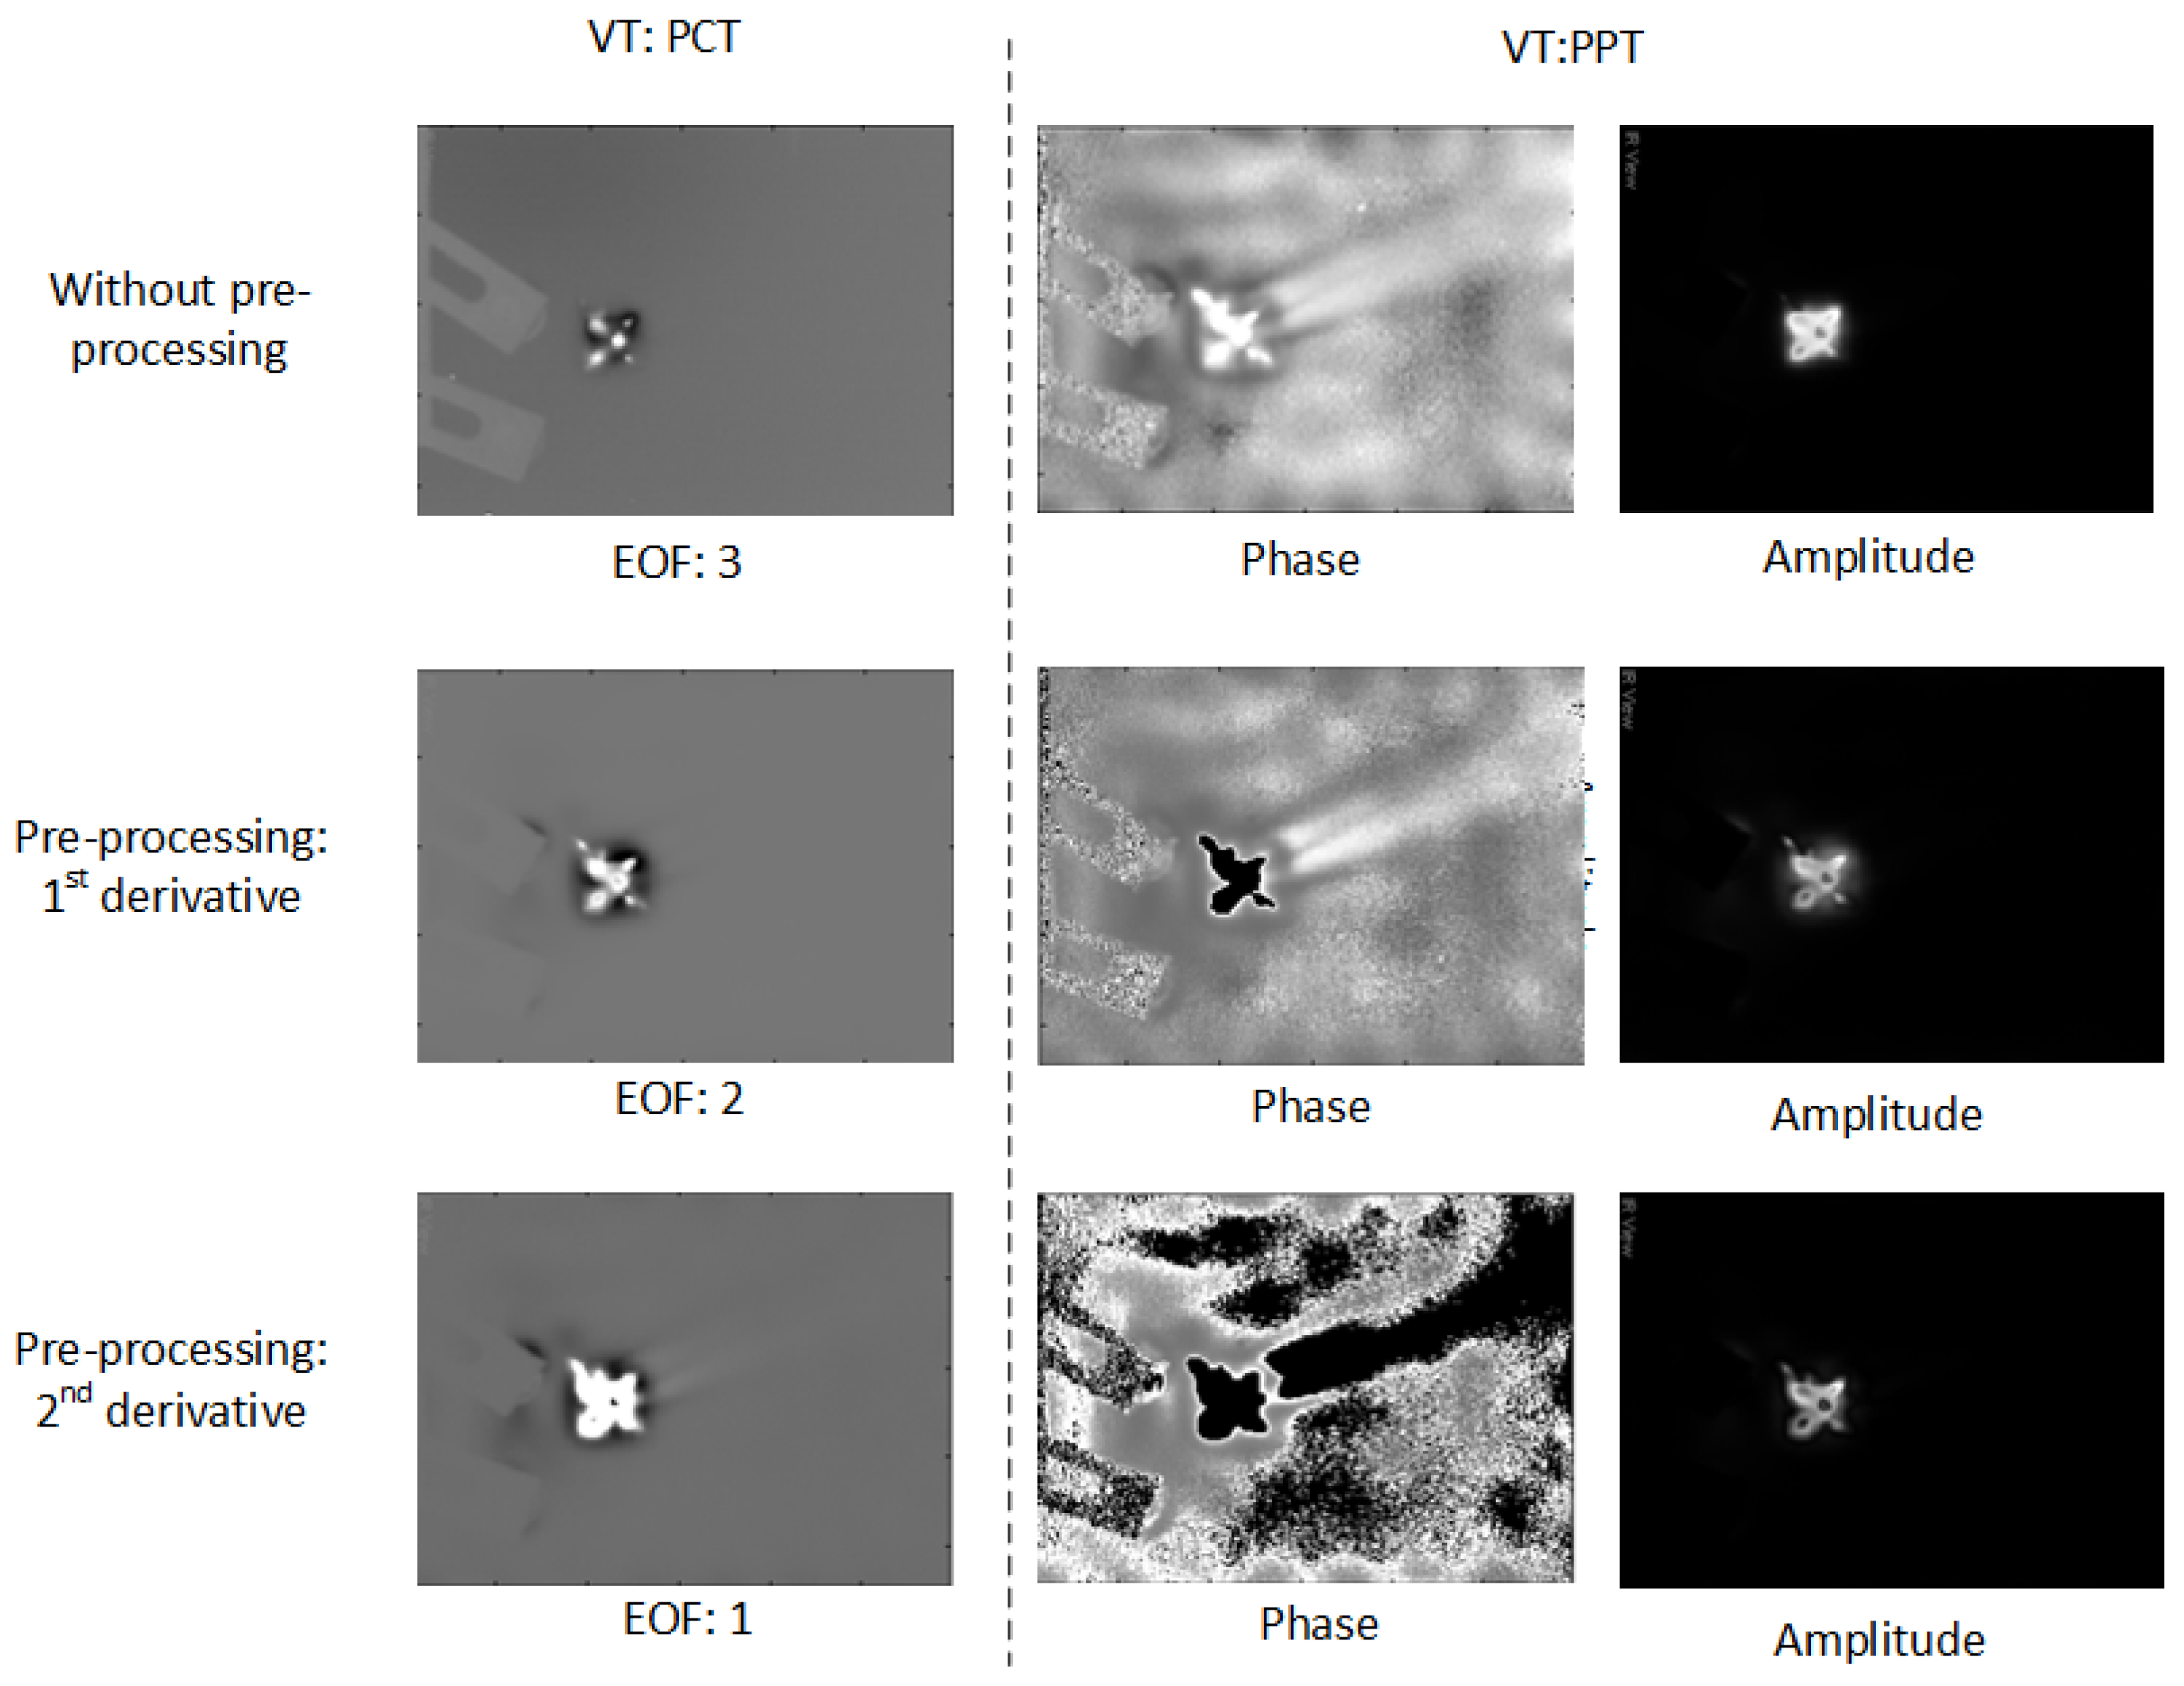
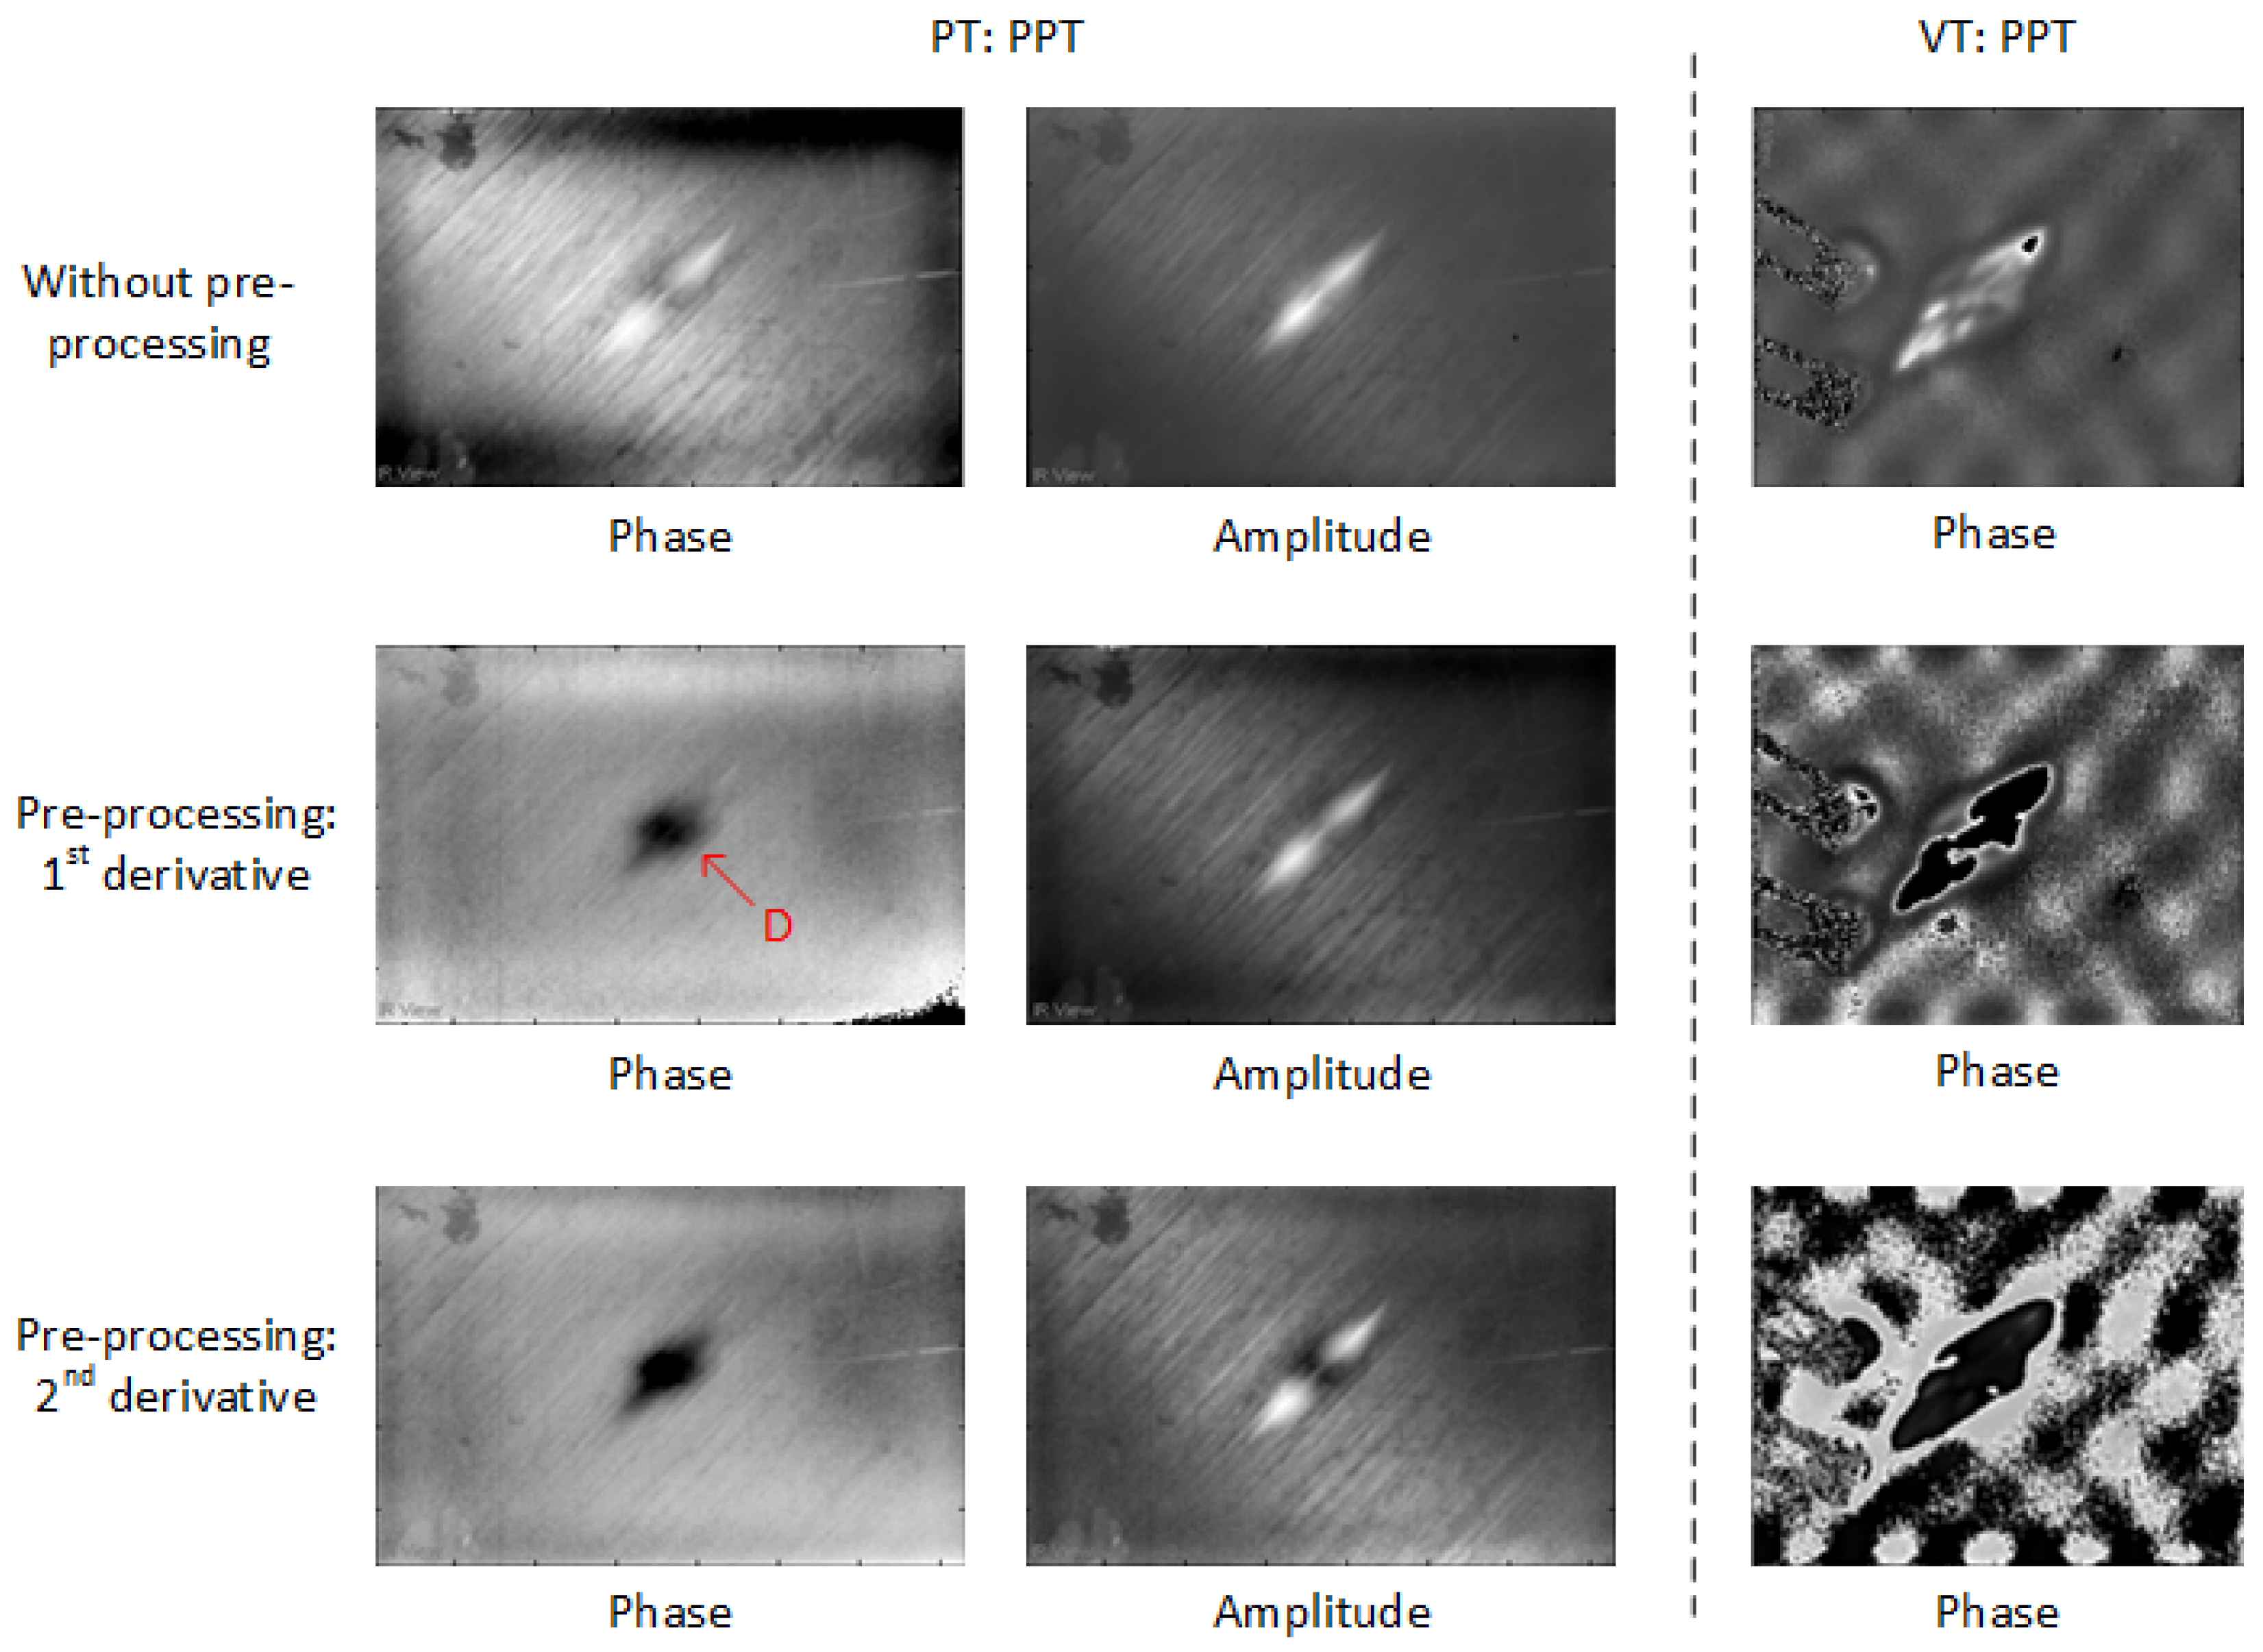
3.2. Pre-Processing Modality
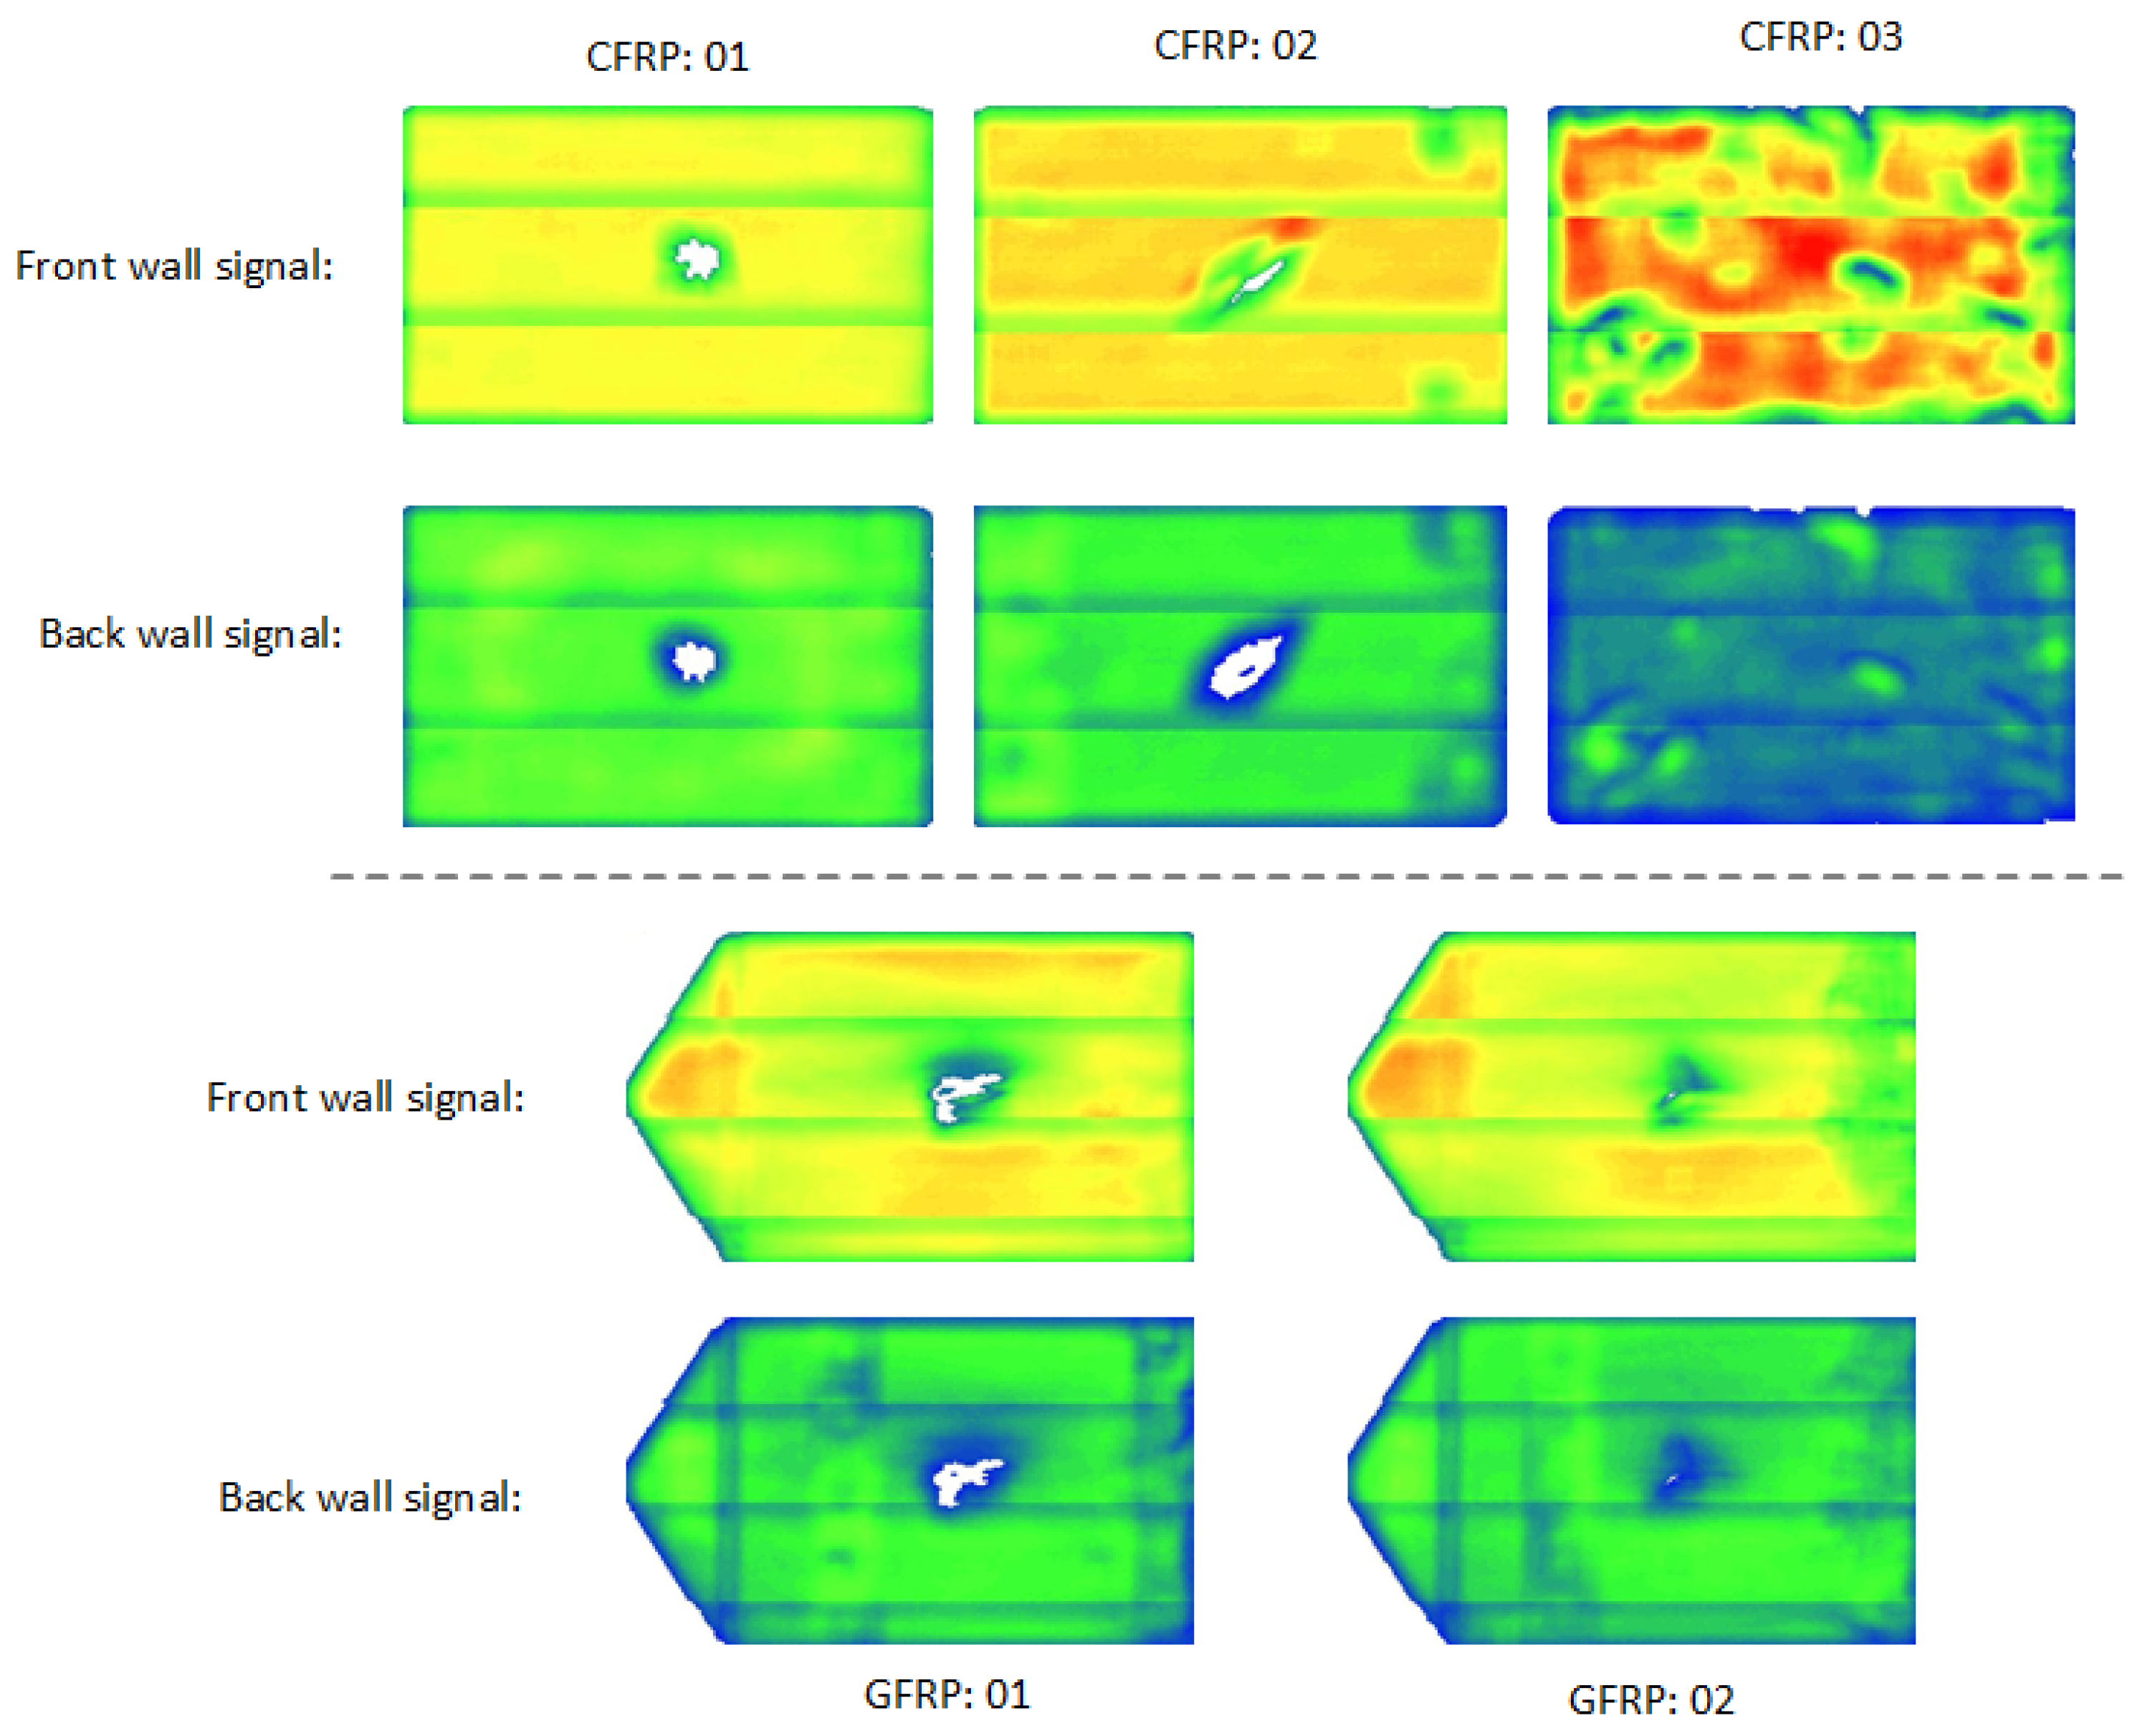
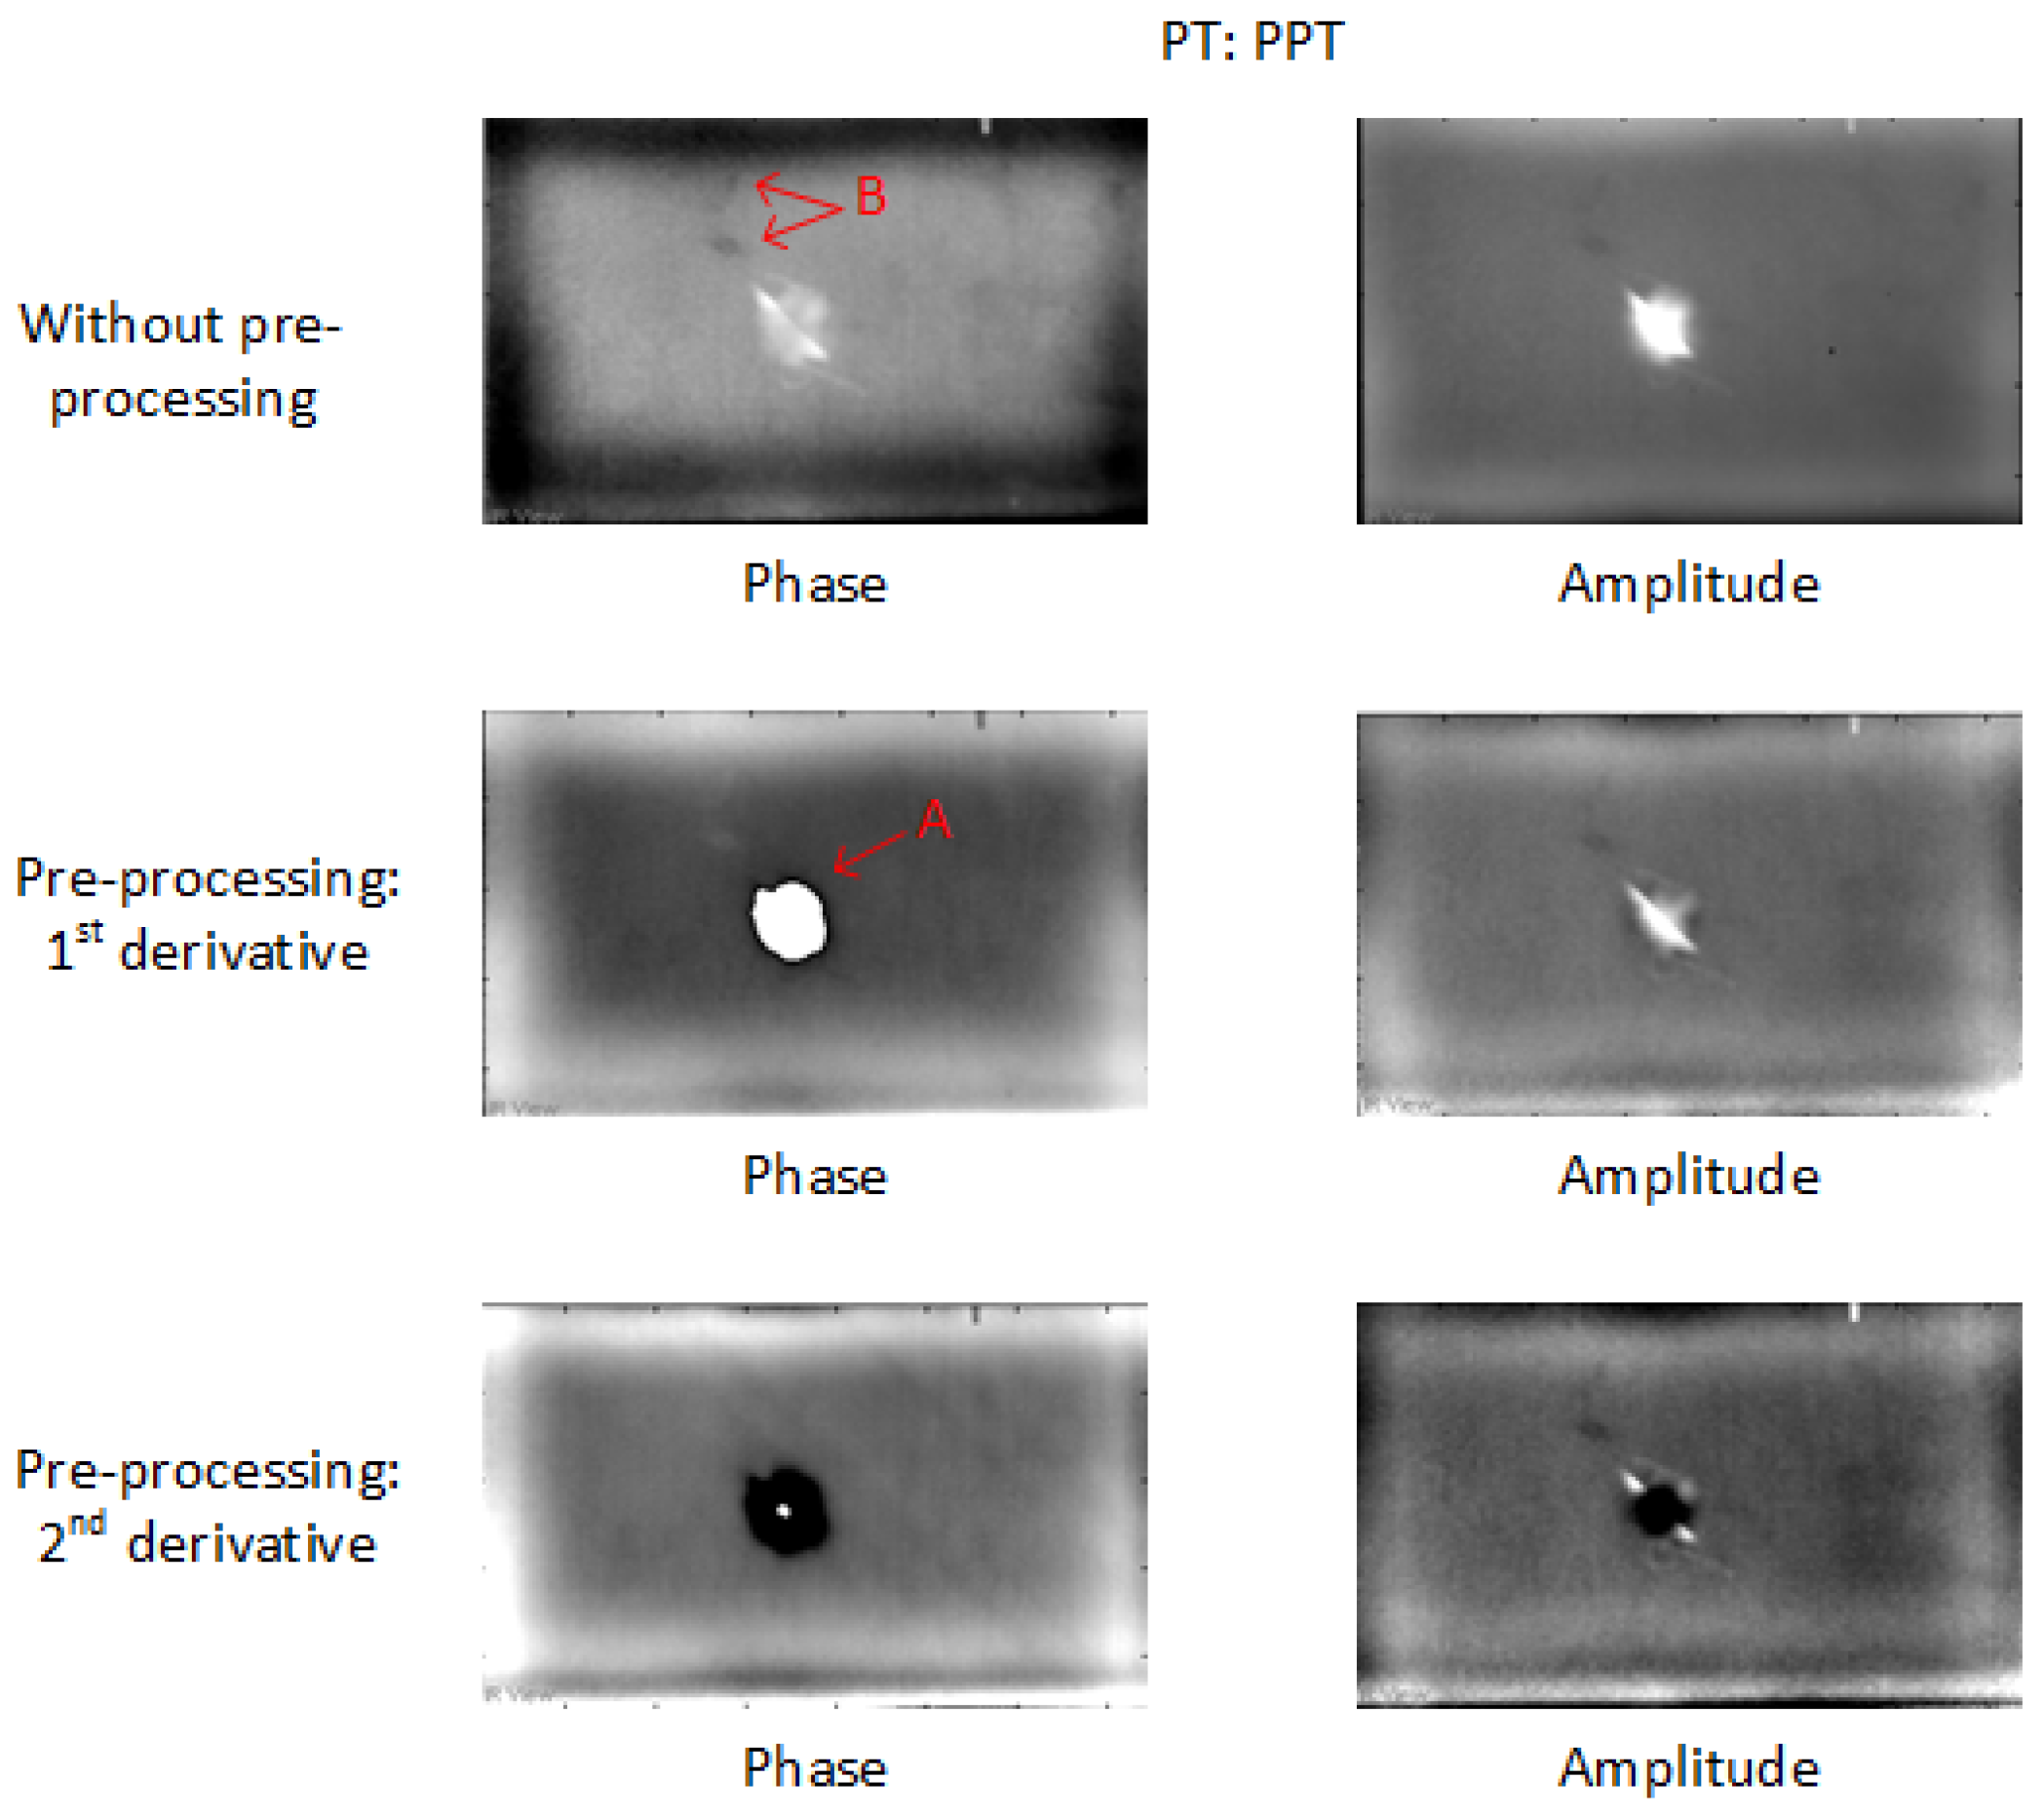
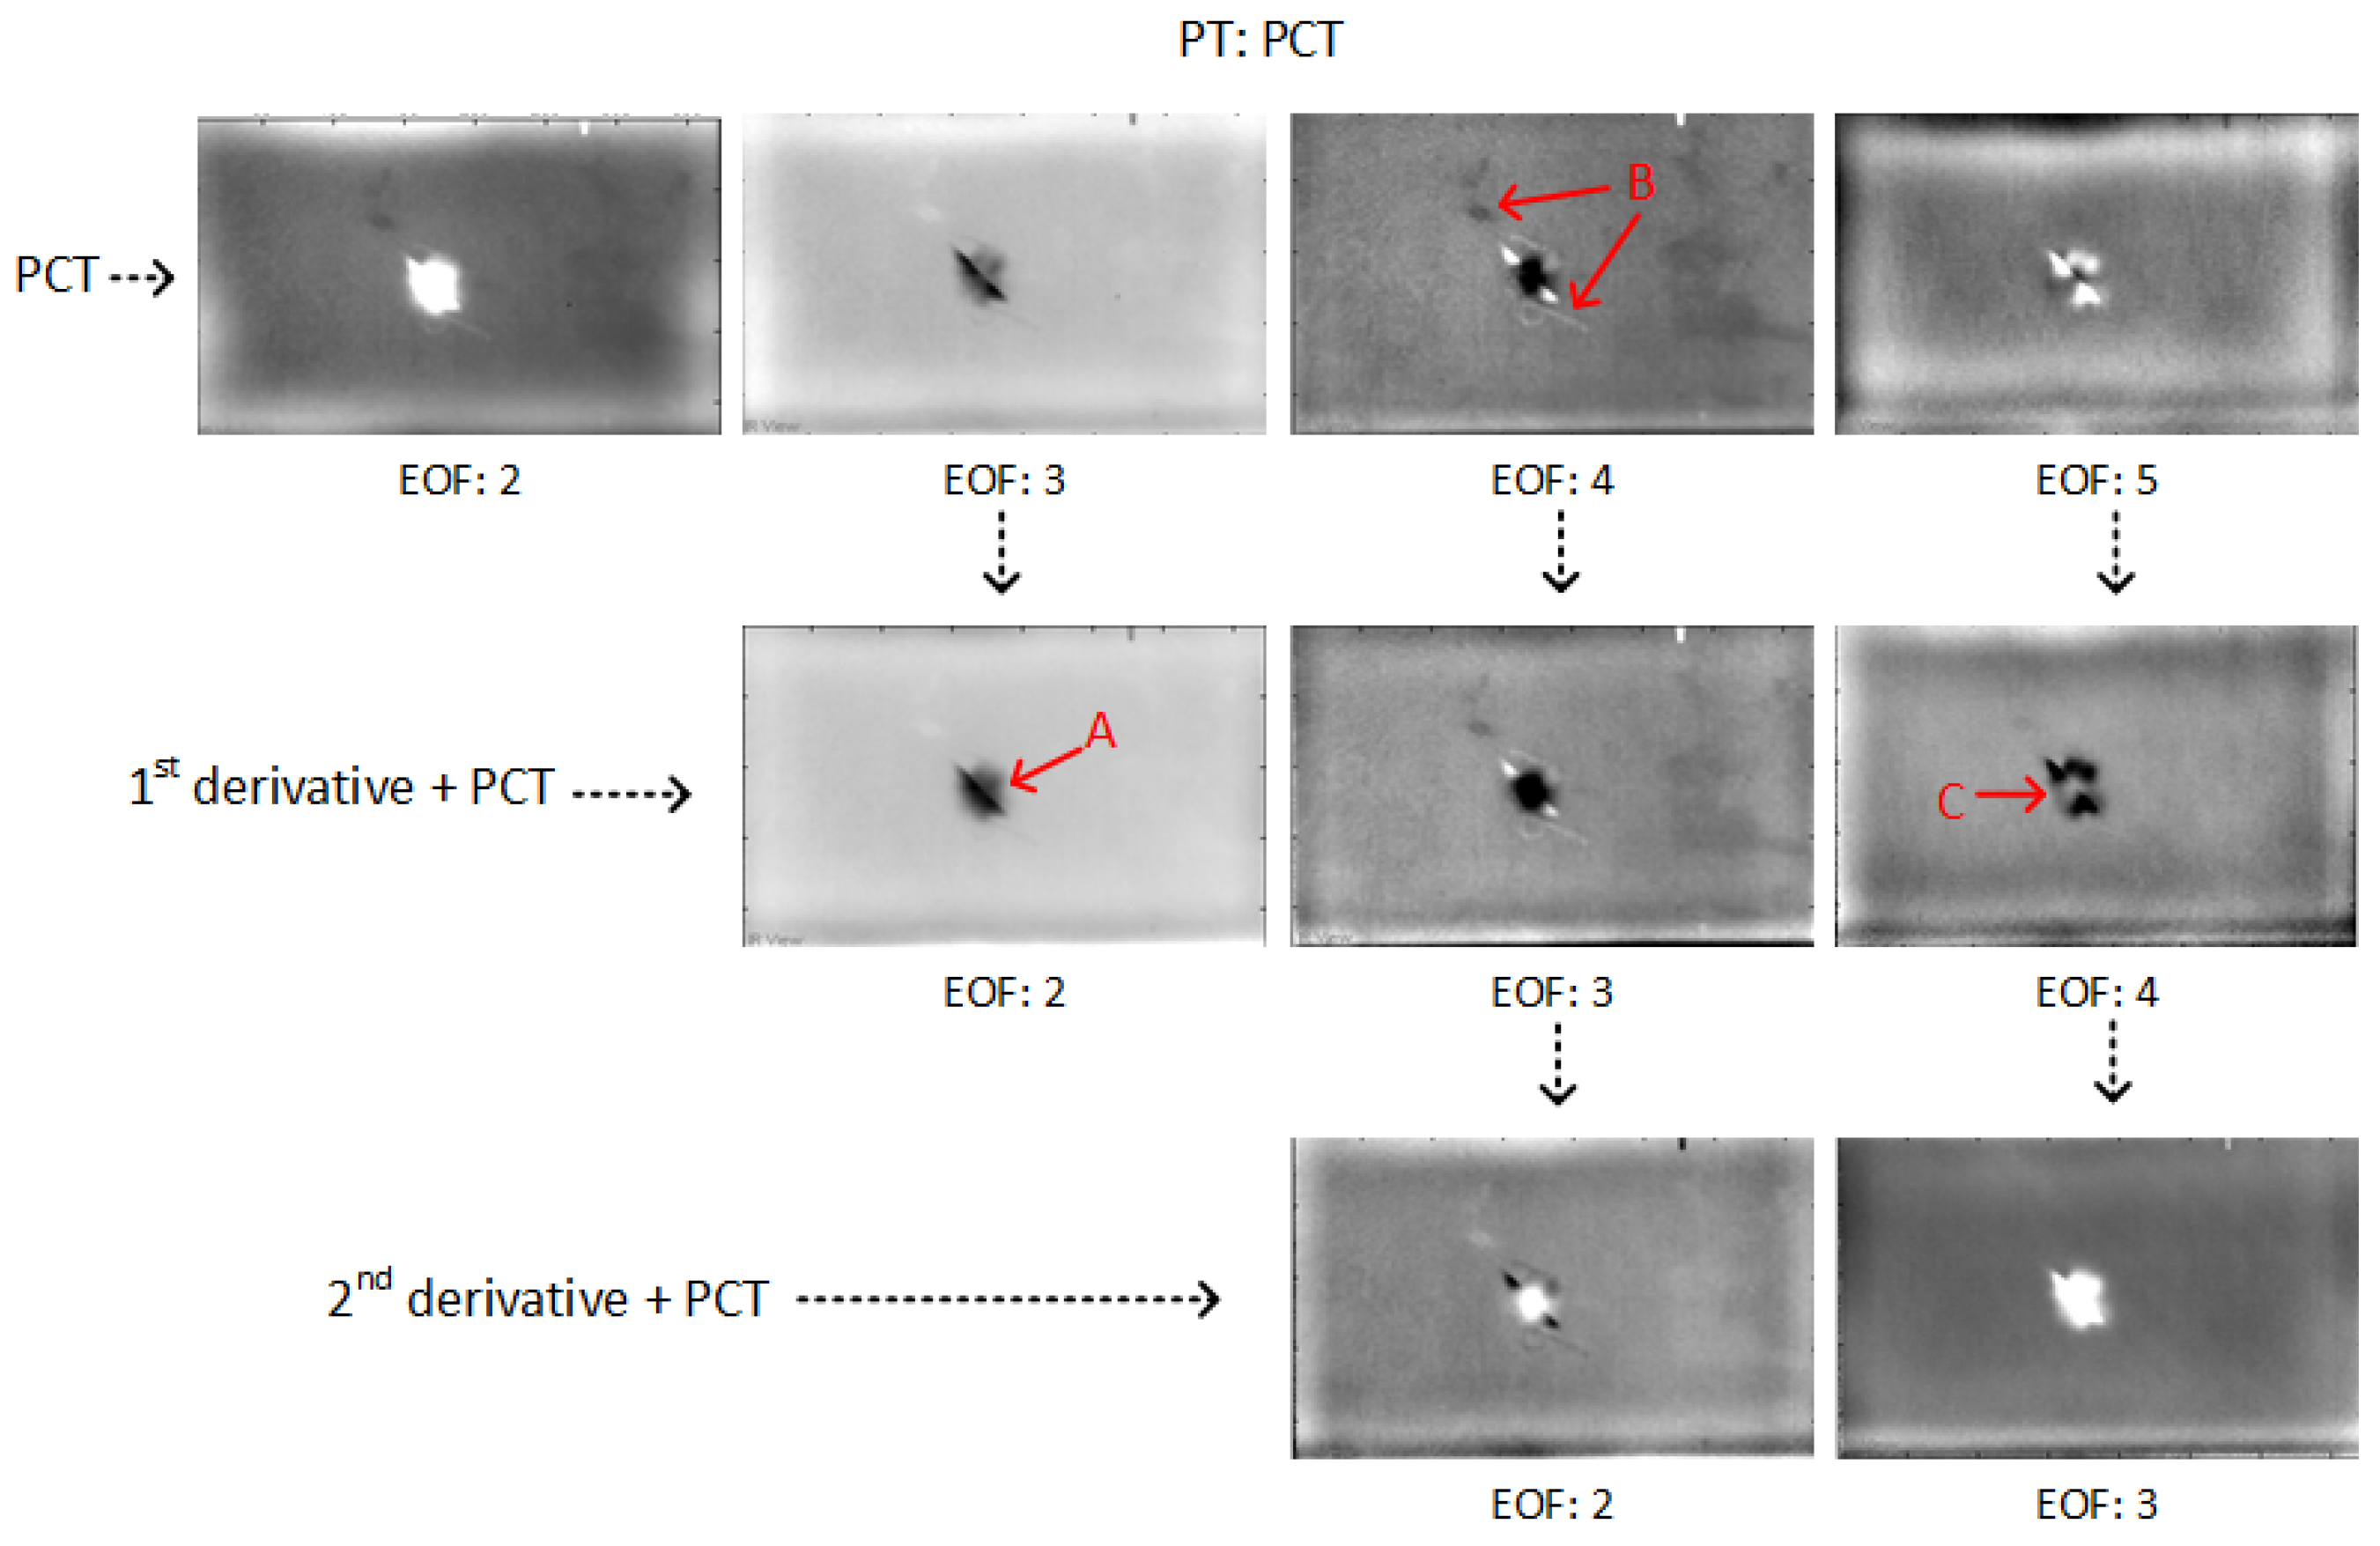
3.3. Post-Processing Techniques
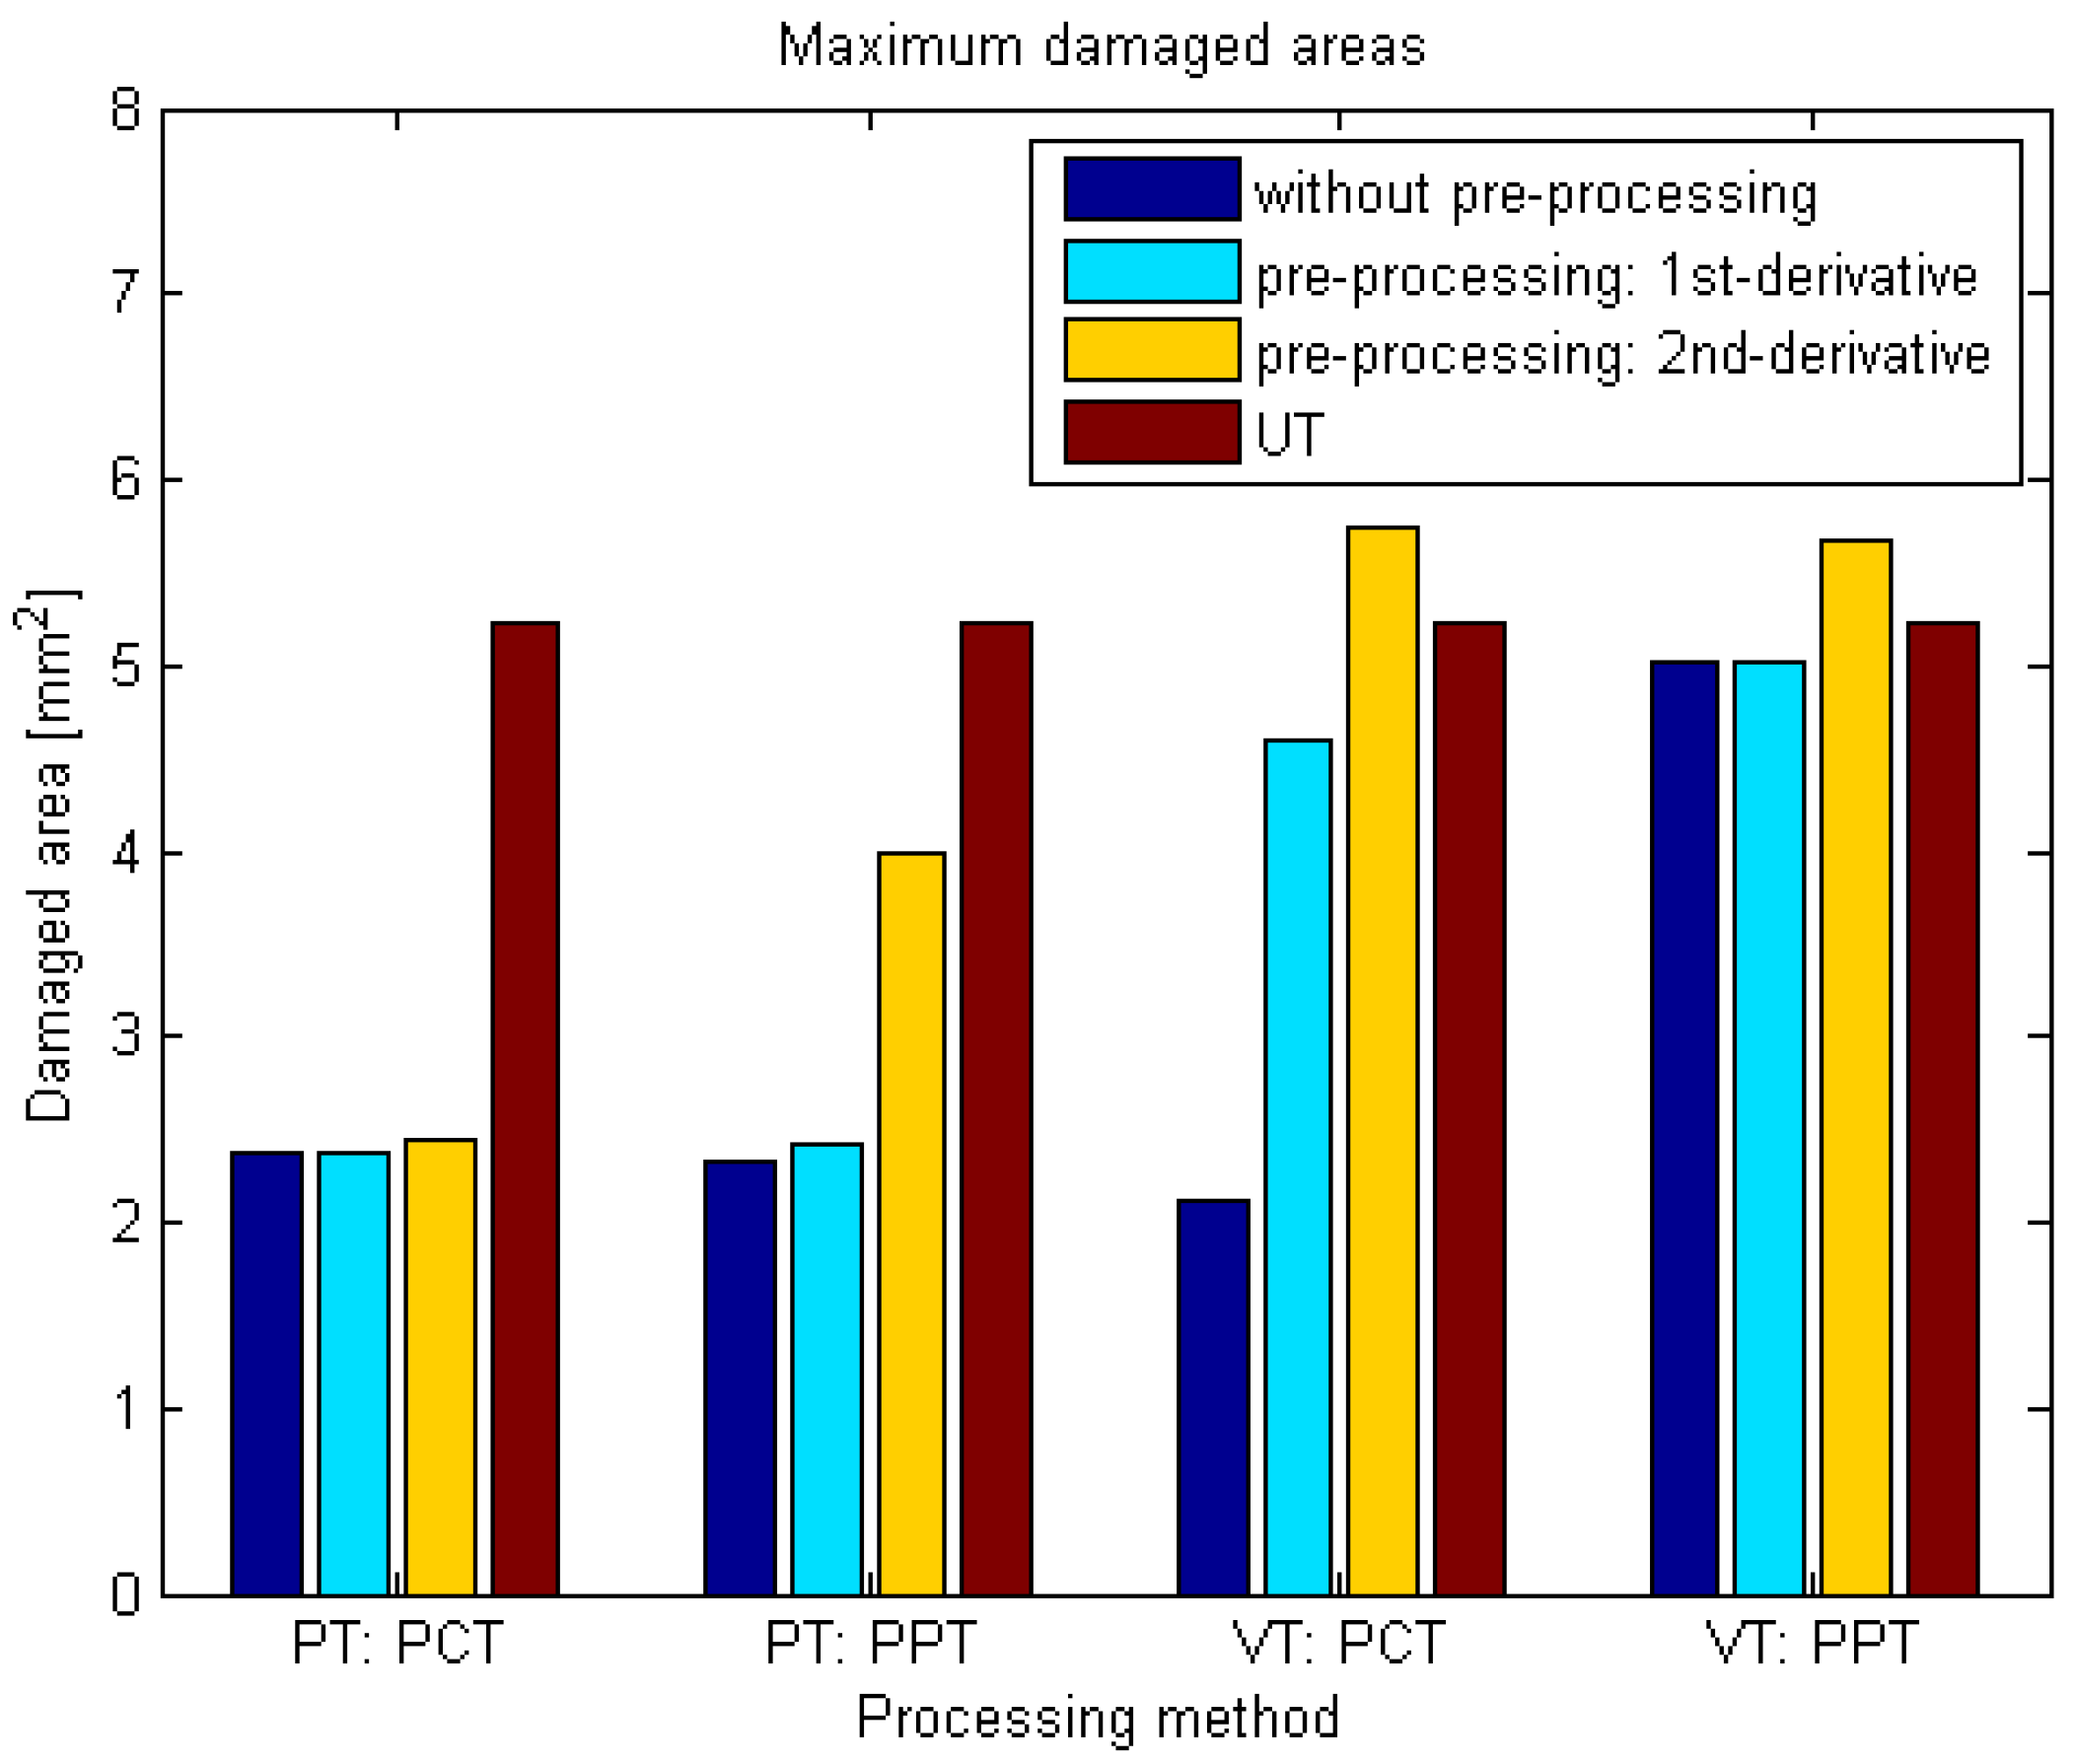
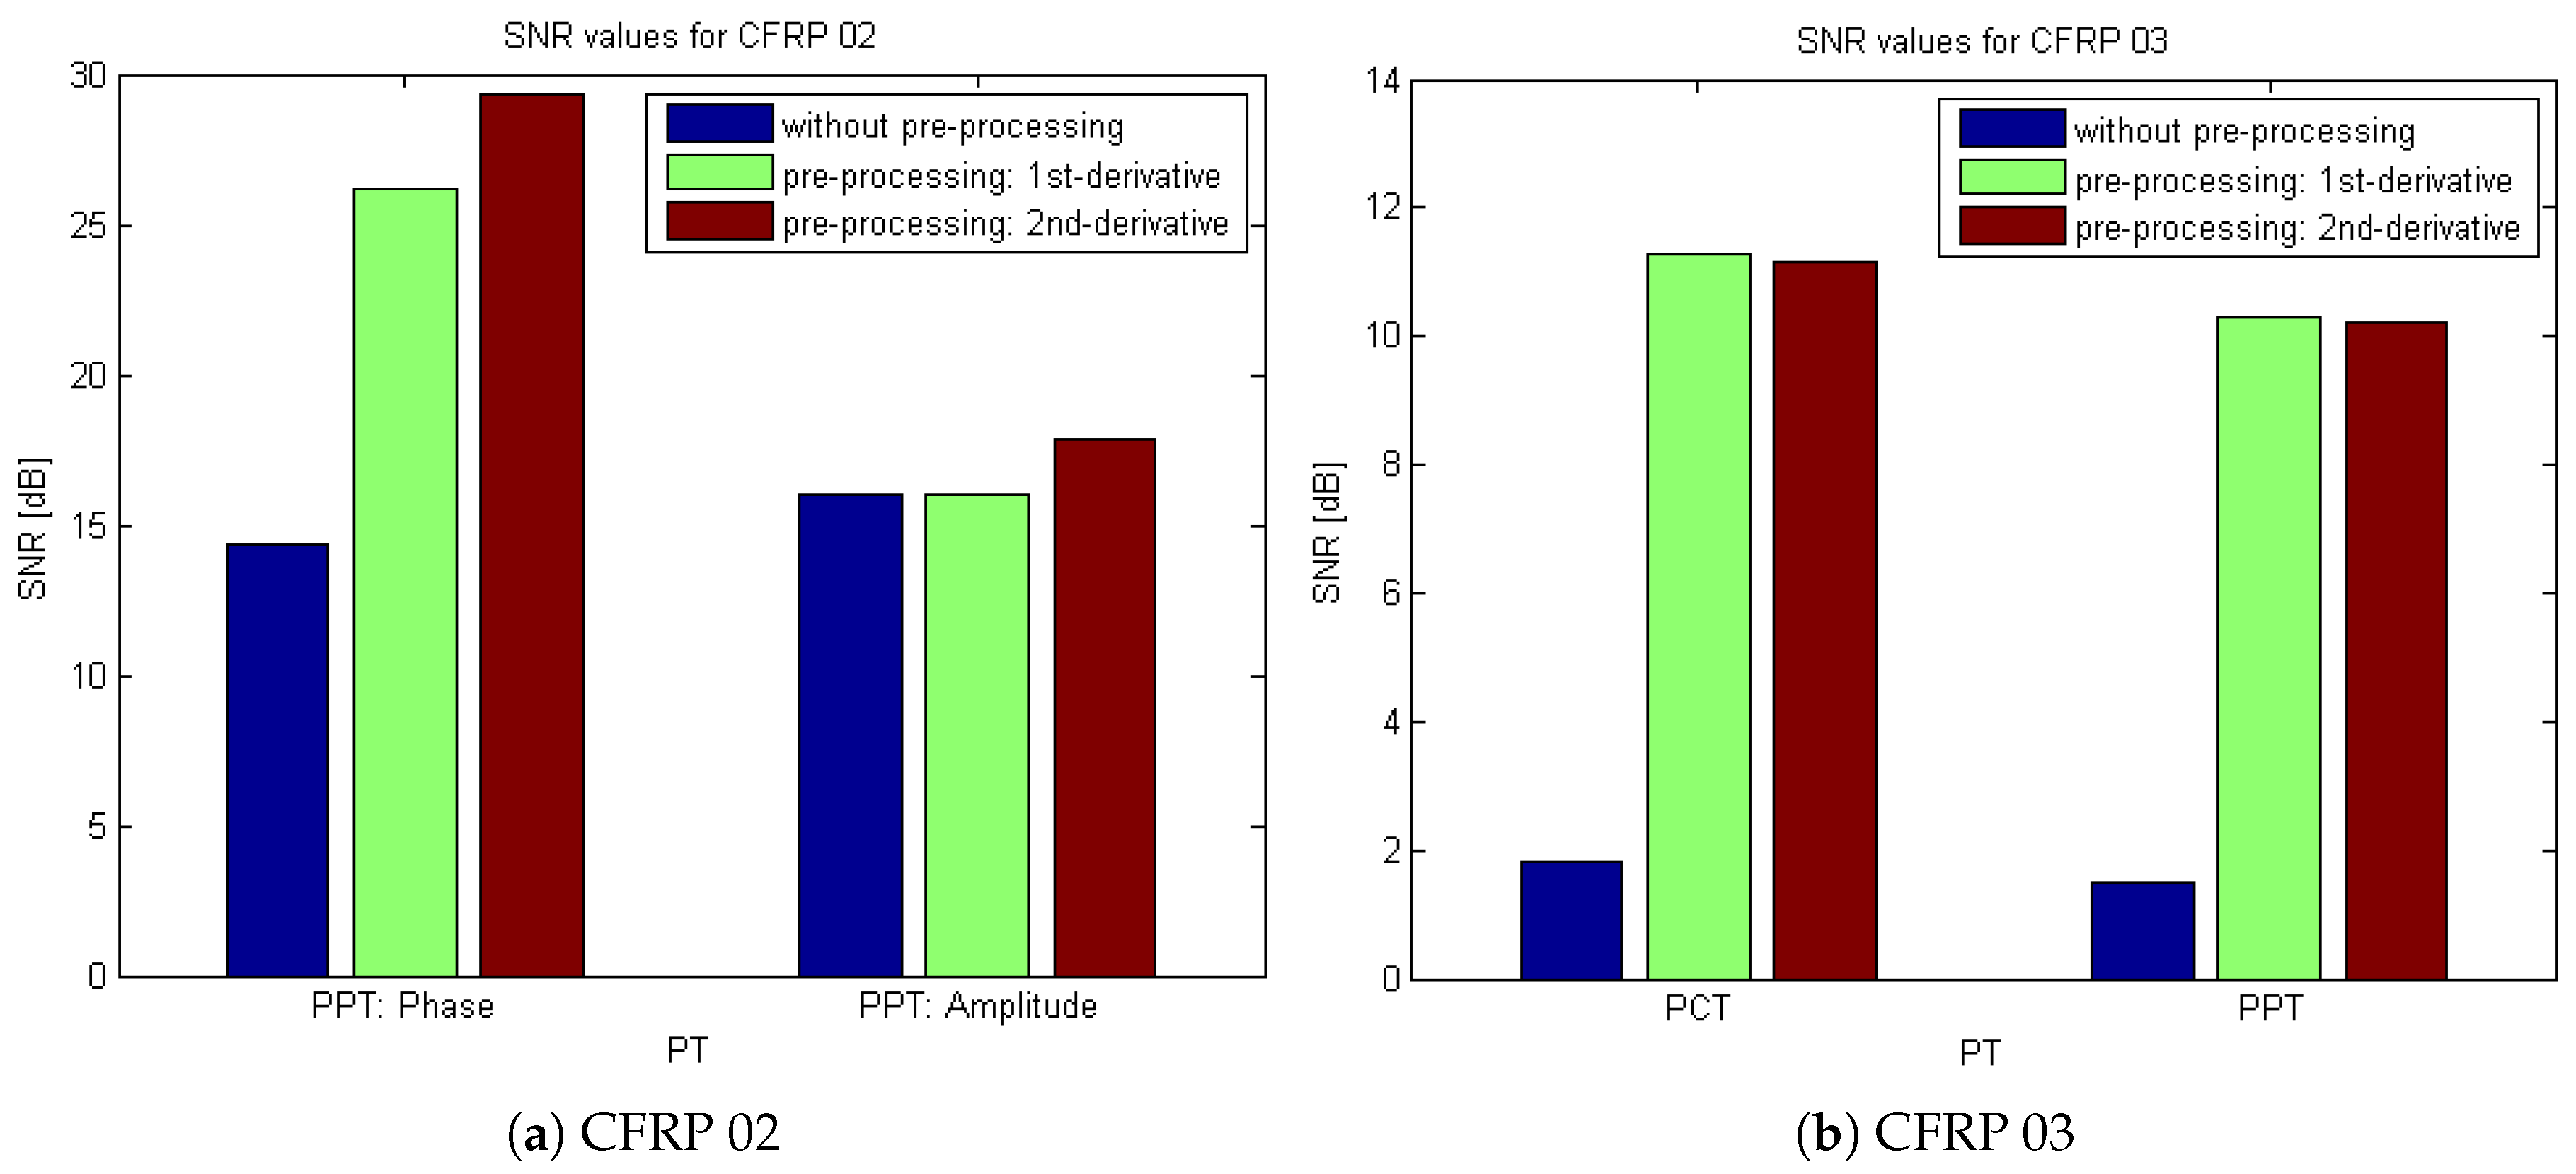
4. Results Analysis
5. Conclusions
Acknowledgments
Author Contributions
Conflicts of Interest
Abbreviations
| CFRP | Carbon fiber-reinforced polymer |
| GFRP | Glass fiber-reinforced polymer |
| NDT | Non-destructive testing |
| IRT | Infrared thermography |
| UT | Ultrasonic testing |
| PT | Pulsed thermography |
| VT | Vibrothermography |
| PCT | Principal component thermography |
| PPT | Pulsed phase thermography |
| CIS | Cold image subtraction |
| EOF | Empirical orthogonal function |
| SNR | Signal-to-noise ratio |
References
- Zhang, H.; Hassler, U.; Genest, M.; Fernandes, H.; Robitaille, F.; Ibarra-Castanedo, C.; Joncas, S.; Maldague, X. Comparative study on submillimeter flaws in stitched T-joint carbon fiber reinforced polymer by infrared thermography, microcomputed tomography, ultrasonic c-scan and microscopic inspection. Opt. Eng. 2015, 54, 104109. [Google Scholar] [CrossRef]
- Lowe, P.S.; Duan, W.; Kanfoud, J.; Gan, T.H. Structural Health Monitoring of Above-Ground Storage Tank Floors by Ultrasonic Guided Wave Excitation on the Tank Wall. Sensors 2017, 17, 2542. [Google Scholar] [CrossRef] [PubMed]
- Liu, B.; Cao, Y.; Zhang, H.; Lin, Y.; Sun, W.; Xu, B. Weak magnetic flux leakage: A possible method for studying pipeline defects located either inside or outside the structures. NDT E Int. 2015, 74, 81–86. [Google Scholar] [CrossRef]
- Eldib, M.E.; Hegazy, M.; Mun, Y.J.; Cho, M.H.; Cho, M.H.; Lee, S.Y. A Ring Artifact Correction Method: Validation by Micro-CT Imaging with Flat-Panel Detectors and a 2D Photon-Counting Detector. Sensors 2017, 17, 269. [Google Scholar] [CrossRef] [PubMed]
- Zhang, H.; Yu, L.; Hassler, U.; Fernandes, H.; Genest, M.; Robitaille, F.; Joncas, S.; Holub, W.; Sheng, Y.; Maldague, X. An experimental and analytical study of micro-laser line thermography on micro-sized flaws in stitched carbon fiber reinforced polymer composites. Compos. Sci. Technol. 2016, 126, 17–26. [Google Scholar] [CrossRef]
- Zhang, H.; Sfarra, S.; Sarasini, F.; Ibarra-Castanedo, C.; Perilli, S.; Fernandes, H.; Duan, Y.; Peeters, J.; Avelidis, N.P.; Maldague, X. Optical and Mechanical Excitation Thermography for Impact Response in Basalt-Carbon Hybrid Fiber-Reinforced Composite Laminates. IEEE Trans. Ind. Inform. 2017. [Google Scholar] [CrossRef]
- Zhang, H.; Fernandes, H.; Hassler, U.; Ibarra-Castanedo, C.; Genest, M.; Robitaille, F.; Joncas, S.; Maldague, X. Comparative study of microlaser excitation thermography and microultrasonic excitation thermography on submillimeter porosity in carbon fiber reinforced polymer composites. Opt. Eng. 2017, 56, 041304. [Google Scholar] [CrossRef]
- Tian, G.Y.; Gao, Y.; Li, K.; Wang, Y.; Gao, B.; He, Y. Eddy current pulsed thermography with different excitation configurations for metallic material and defect characterization. Sensors 2016, 16, 843. [Google Scholar] [CrossRef] [PubMed]
- Maldague, X. Theory and Practice of Infrared Technology for Nondestructive Testing; Wiley: New York, NY, USA, 2001. [Google Scholar]
- Ibarra-Castanedo, C.; Maldague, X.P. Infrared thermography. In Handbook of Technical Diagnostics; Czichos, H., Ed.; Springer: Berlin/Heidelberg, Germany, 2013; pp. 175–220. [Google Scholar]
- Thomas, R.L.; Favro, L.D.; Han, X.; Ouyang, Z.; Sui, H.; Sun, G. Infrared Imaging of Ultrasonically Excited Subsurface Defects in Materials. U.S. Patent 6,236,049, 22 May 2001. [Google Scholar]
- Shepard, S.M.; Lhota, J.R.; Rubadeux, B.A.; Wang, D.; Ahmed, T. Reconstruction and enhancement of active thermographic image sequences. Opt. Eng. 2003, 42, 1337–1342. [Google Scholar] [CrossRef]
- Liu, B.; Zhang, H.; Fernandes, H.; Maldague, X. Experimental Evaluation of Pulsed Thermography, Lock-in Thermography and Vibrothermography on Foreign Object Defect (FOD) in CFRP. Sensors 2016, 16, 743. [Google Scholar] [CrossRef] [PubMed]
- Khodayar, F.; Lopez, F.; Ibarra-Castanedo, C.; Maldague, X. Optimization of the Inspection of Large Composite Materials Using Robotized Line Scan Thermography. J. Nondestr. Eval. 2017, 36, 32. [Google Scholar] [CrossRef]
- Shepard, S.M. Flash thermography of aerospace composites. In Proceedings of the IV Conferencia Panamericana de END, Buenos Aires, Argentina, 22–26 October 2007; Volume 7. [Google Scholar]
- Zhang, H.; Fernandes, H.; Dizeu, F.B.D.; Hassler, U.; Fleuret, J.; Genest, M.; Ibarra-Castanedo, C.; Robitaille, F.; Joncas, S.; Maldague, X. Pulsed micro-laser line thermography on submillimeter porosity in carbon fiber reinforced polymer composites: Experimental and numerical analyses for the capability of detection. Appl. Opt. 2016, 55, D1–D10. [Google Scholar] [CrossRef] [PubMed]
- Rajic, N. Principal component thermography for flaw contrast enhancement and flaw depth characterisation in composite structures. Compos. Struct. 2002, 58, 521–528. [Google Scholar] [CrossRef]
- Fernandes, H.; Zhang, H.; Ibarra-Castanedo, C.; Maldague, X. Fiber orientation assessment on randomly-oriented strand composites by means of infrared thermography. Compos. Sci. Technol. 2015, 121, 25–33. [Google Scholar] [CrossRef]
- Yousefi, B.; Sfarra, S.; Castanedo, C.I.; Maldague, X.P. Comparative analysis on thermal non-destructive testing imagery applying Candid Covariance-Free Incremental Principal Component Thermography (CCIPCT). Infrared Phys. Technol. 2017, 85, 163–169. [Google Scholar] [CrossRef]
- Yousefi, B.; Sfarra, S.; Castanedo, C.I.; Maldague, X.P. Thermal ndt applying candid covariance-free incremental principal component thermography (ccipct). In Proceedings of the Thermosense: Thermal Infrared Applications XXXIX International Society for Optics and Photonics, Anaheim, CA, USA, 9–13 April 2017; Volume 10214, p. 102141I. [Google Scholar]
- Yousefi, B.; Sharifipour, H.M.; Castanedo, C.I.; Maldague, X.P. Automatic IRNDT inspection applying sparse PCA-based clustering. In Proceedings of the 2017 IEEE 30th Canadian Conference on Electrical and Computer Engineering (CCECE), Windsor, ON, Canada, 30 April–3 May 2017; pp. 1–4. [Google Scholar]
- Maldague, X.; Marinetti, S. Pulse phase infrared thermography. J. Appl. Phys. 1996, 79, 2694–2698. [Google Scholar] [CrossRef]
- Sfarra, S.; Ibarra-Castanedo, C.; Santulli, C.; Paoletti, A.; Paoletti, D.; Sarasini, F.; Bendada, A.; Maldague, X. Falling weight impacted glass and basalt fibre woven composites inspected using non-destructive techniques. Compos. Part B Eng. 2013, 45, 601–608. [Google Scholar] [CrossRef]
- Zhang, H.; Sfarra, S.; Saluja, K.; Peeters, J.; Fleuret, J.; Duan, Y.; Fernandes, H.; Avdelidis, N.; Ibarra-Castanedo, C.; Maldague, X. Non-destructive Investigation of Paintings on Canvas by Continuous Wave Terahertz Imaging and Flash Thermography. J. Nondestr. Eval. 2017, 36, 34. [Google Scholar] [CrossRef]
- Ahi, K.; Shahbazmohamadi, S.; Asadizanjani, N. Quality control and authentication of packaged integrated circuits using enhanced-spatial-resolution terahertz time-domain spectroscopy and imaging. Opt. Lasers Eng. 2017. [Google Scholar] [CrossRef]
- Ahi, K. Review of GaN-based devices for terahertz operation. Opt. Eng. 2017, 56, 090901. [Google Scholar] [CrossRef]
- Ahi, K. Mathematical modeling of THz point spread function and simulation of THz imaging systems. IEEE Trans. Terahertz Sci. Technol. 2017, 7, 747–754. [Google Scholar] [CrossRef]


| Specimen | CFRP 01 | CFRP 02 | GFRP 01 | GFRP 02 |
| Damaged area (cm) | 5.224 | 7.850 | 9.112 | 8.323 |
© 2017 by the authors. Licensee MDPI, Basel, Switzerland. This article is an open access article distributed under the terms and conditions of the Creative Commons Attribution (CC BY) license (http://creativecommons.org/licenses/by/4.0/).
Share and Cite
Zhang, H.; Avdelidis, N.P.; Osman, A.; Ibarra-Castanedo, C.; Sfarra, S.; Fernandes, H.; Matikas, T.E.; Maldague, X.P.V. Enhanced Infrared Image Processing for Impacted Carbon/Glass Fiber-Reinforced Composite Evaluation. Sensors 2018, 18, 45. https://doi.org/10.3390/s18010045
Zhang H, Avdelidis NP, Osman A, Ibarra-Castanedo C, Sfarra S, Fernandes H, Matikas TE, Maldague XPV. Enhanced Infrared Image Processing for Impacted Carbon/Glass Fiber-Reinforced Composite Evaluation. Sensors. 2018; 18(1):45. https://doi.org/10.3390/s18010045
Chicago/Turabian StyleZhang, Hai, Nicolas P. Avdelidis, Ahmad Osman, Clemente Ibarra-Castanedo, Stefano Sfarra, Henrique Fernandes, Theodore E. Matikas, and Xavier P. V. Maldague. 2018. "Enhanced Infrared Image Processing for Impacted Carbon/Glass Fiber-Reinforced Composite Evaluation" Sensors 18, no. 1: 45. https://doi.org/10.3390/s18010045