Fatigue Reliability Assessment for Orthotropic Steel Decks Based on Long-Term Strain Monitoring


1
Beijing Advanced Innovation Center for Future Urban Design, Beijing University of Civil Engineering and Architecture, Beijing 100044, China
2
Weidlinger Transportation Practice, Thornton Tomasetti, Inc., New York, NY 10005, USA
*
Author to whom correspondence should be addressed.
Sensors 2018, 18(1), 181; https://doi.org/10.3390/s18010181
Submission received: 7 December 2017
/
Revised: 3 January 2018
/
Accepted: 6 January 2018
/
Published: 10 January 2018
(This article belongs to the Special Issue Novel Methodologies to Interpret Non-Destructive Testing and Structural Health Monitoring Data)
Abstract
:A time-dependent fatigue reliability assessment approach is proposed for welded details of orthotropic steel decks (OSDs) using long-term strain monitoring data. The fatigue reliability limit function of the welded details is established based on the Eurocode specifications. Depending on the distribution characteristics of the measured daily equivalent stress range, either the lognormal distribution or Gaussian mixture model (GMM) is selected to quantify its uncertainty. Subsequently, the fatigue reliability can be calculated using either an explicit formula or the Monte Carlo method. This proposed approach is applied for the fatigue reliability evaluation of two rib-to-deck and two rib-to-rib welded fatigue details of an in-service suspension bridge. The results show that the reliability indices decrease significantly with bridge’s service life. Except for a rib-to-deck detail, all other three welded details cannot meet the target fatigue reliability during this bridge’s 100-year service life. The proposed approach can help bridge owners and operators make informed decisions regarding maintenance and repair of potential fatigue cracks.
1. Introduction
Orthotropic steel decks (OSDs) have been widely adopted for long-span bridges due to their notable advantages, such as light weight, high strength and durability, and rapid construction [1,2,3]. However, various types of cracking in the OSDs have been reported owing to lack of knowledge in its fatigue characteristics, design defects, and harsh loading conditions such as heavy-duty vehicles and high-density traffic volumes [1,4,5]. In the past few decades, significant efforts have been made on the design of S–N curves and development of fatigue life prediction approaches [6,7,8,9].
Fatigue reliability evaluation for the in-service OSD bridges requires accurate measurement of fatigue stress spectra, which can be obtained using the structural health monitoring system (SHMS) [2,10,11,12]. Existing SHMS-based fatigue evaluation approaches for the OSDs can be classified into two categories. The first type is to develop fatigue stress spectra using the finite element (FE) analysis based on measured operational vehicle flows by weigh-in-motion systems [12,13,14]. Because of complex structural behaviors and randomness in the actual traffic loadings, this type method relies on the accuracy of reconstructed vehicle loading models and developed FE models [12]. The second type is directly based on the strain measurements collected by strain sensors [10,11]. For example, Guo et al. [10] investigated effects of ambient temperature and traffic volume on fatigue damage of welded steel deck details using long-term strain monitoring data. Teixeira de Freitas et al. [11] applied strain measurements from controlled load tests and one-year of field monitoring to investigate the fatigue performance of an OSD strengthened by bonding a second steel plate to the existing deck. The above strain monitoring-based studies mainly focused on deterministic analyses.
In this study, to consider uncertainties in fatigue analysis, a reliability-based fatigue evaluation approach for welded details of orthotropic steel decks is proposed using both the fatigue strength curves from existing specification and the long-term monitoring strain data.
2. Formulation of the Proposed Fatigue Reliability Analysis
2.1. Fatigue Limit State Function
Eurocode 3 provides the fatigue detail categories of welded orthotropic decks with either closed ribs or open ribs [7]. The S–N curves in Eurocode 3 adopt double slopes to consider the low-level stress cycles. As shown in Figure 1, when stress range is above the constant amplitude fatigue limit (CAFL) ΔσD, the slope of the curves is −1/3; when stress range is below the CAFL, the slope of the curves is −1/5; and when stress range is below the variable amplitude fatigue limit (VAFL) ΔσL, the curves become horizontal straight lines. ΔσC is the detail category. Two types of weld details for OSDs, referring to rib-to-deck and the rib-to-rib details, respectively, will be investigated in this study. The S–N curve parameters for these welds are listed in Table 1.
For the nominal stress range spectrum, the fatigue strength curves are expressed as
where ΔσR is the stress range; NR is the corresponding life in terms of number of cycles. In this study, the fatigue strength coefficient is defined as KC when ΔσR is larger than ΔσD, and KD when ΔσR is smaller than ΔσD. According to Equation (1a,b), the fatigue damage D induced by stress range S is
where n is the number of S in the stress range spectrum, N is the fatigue life corresponding to stress range S. According to the Palmgren-Miner rule [15], the fatigue damage under variable amplitude loading can be calculated as
where ni is the number of stress range Si (larger than ΔσD) and nj is the number of stress range Sj (between ΔσD and ΔσL). Based on the equivalence principle, the variable amplitude stress range can be equivalent to a constant amplitude stress range, namely, the equivalent stress range. The expression of equivalent stress range Seq and corresponding number of cycles Nc is [16]
Thus, the fatigue damage induced from Seq and Nc can be written into
For the fatigue reliability analysis based on monitoring data, the limit state function can be established as [13,16]
where Δ, the critical damage, represents the fatigue resistance, e is an error coefficient for field measurements [17,18]. The accumulated number of stress cycles Nc is often treated as a deterministic variable and in the service years of Y it can be estimated by
where ADSC is the average daily stress cycles, which can be determined using monitoring data. The parameters in Equation (7) can be treated as random variables to account for the uncertainties in both monitoring data and S–N curves. From existing literature [17,18,19,20], the lognormal distribution can be used to quantify the uncertainties in the error coefficient e [17,18], the critical damage Δ [19], and the fatigue strength coefficient KD [20]. The statistics of these variables are summarized in Table 2.
2.2. Probabilistic Model for the Equivalent Stress Range
Most studies indicated that the distribution of the Seq from monitoring data by SHMS are unimodal [21,22,23]. However, the authors’ most recent studies based on field measurements demonstrated that the Seq for certain OSD fatigue details is distributed multimodally. Hence, both the lognormal model and Gaussian mixture model (GMM) are employed to account for the actual distribution characteristics of the measured equivalent stress ranges.
GMM is one of the finite mixture distributions (FMD). The FMD has been used to quantify the uncertainty of the measured stress ranges in fatigue analysis of steel bridges [24,25]. For example, Ni et al. [24] fitted the FMDs to the measured stress range histograms of the Tsing Ma Bridge, in which several peaks are available which can be attributed to the highway traffic, the railway traffic, and the wind excitations [25]. In this study, the GMM is used to quantify the uncertainty of the measured daily equivalent stress ranges rather than the measured stress range histograms.
The probability density distribution of the GMM, which contains M Gaussian components, can be expressed as [26]
where is the ith Gaussian component, of which the mean value and the variance are μi and , respectively. wi denotes the weight of the ith component. The unknown parameter vector is usually estimated by using the expectation maximization (EM) algorithm [27].
The Gaussian component number M should be priori information before estimating the unknown parameter vector θ with the EM algorithm. Although more Gaussian components can enable more accurate fitting results, subjective selections of the number of Gaussian component are inappropriate. Obviously, inadequate Gaussian components lead to inaccurate fitting results. On the other hand, excessive Gaussian components result in unnecessary complexity in the probability models. Hence, the Akaike information criterion (AIC) [28] and the Bayesian information criteria (BIC) [29] are employed to search the optimal Gaussian component number to achieve both accuracy and conciseness. The expressions of the AIC and BIC can be given as
where m is the number of the unknown parameters; l is the length of the observed data sample; L(x|M, θ) is the maximum value of the likelihood function of the fitted model. The Gaussian component number is the optimal number which produce lowest AIC or BIC.
2.3. Fatigue Reliability Estimation Methods
Based on the estimated probability distributions of Seq and the statistic information listed in Table 2, fatigue reliability can be obtained from either of the following two methods:
- (1)
- Method I. An explicit formula of the fatigue reliability index β can be derived when the lognormal distribution is adopted for the daily Seq. For a variable x that follows a lognormal distribution, the probability density function isThe mean value μlnX and the standard deviation σlnX of the variable lnX can be expressed aswhere δX = σX/μX. Assuming that all the variables in Equation (7) are independent, the fatigue reliability index β can be defined aswhere μlnX and σlnX denote the mean value and the standard deviation of lnX (herein, X = Δ, e, KD or Seq), respectively.
- (2)
- Method II. The fatigue failure probability can be calculated by using the Monte Carlo method due to the difficulty in developing an explicit formula for the fatigue reliability index with the fitted GMM of Seq. Instead, the fatigue reliability index can be derived from the fatigue failure probability pf, which is simulated by using the Monte Carlo method. Therefore, the fatigue reliability index β iswhere Φ−1(·) is the inverse CDF of standard normal distribution.
2.4. Proposed Outline for Fatigue Reliability Analysis
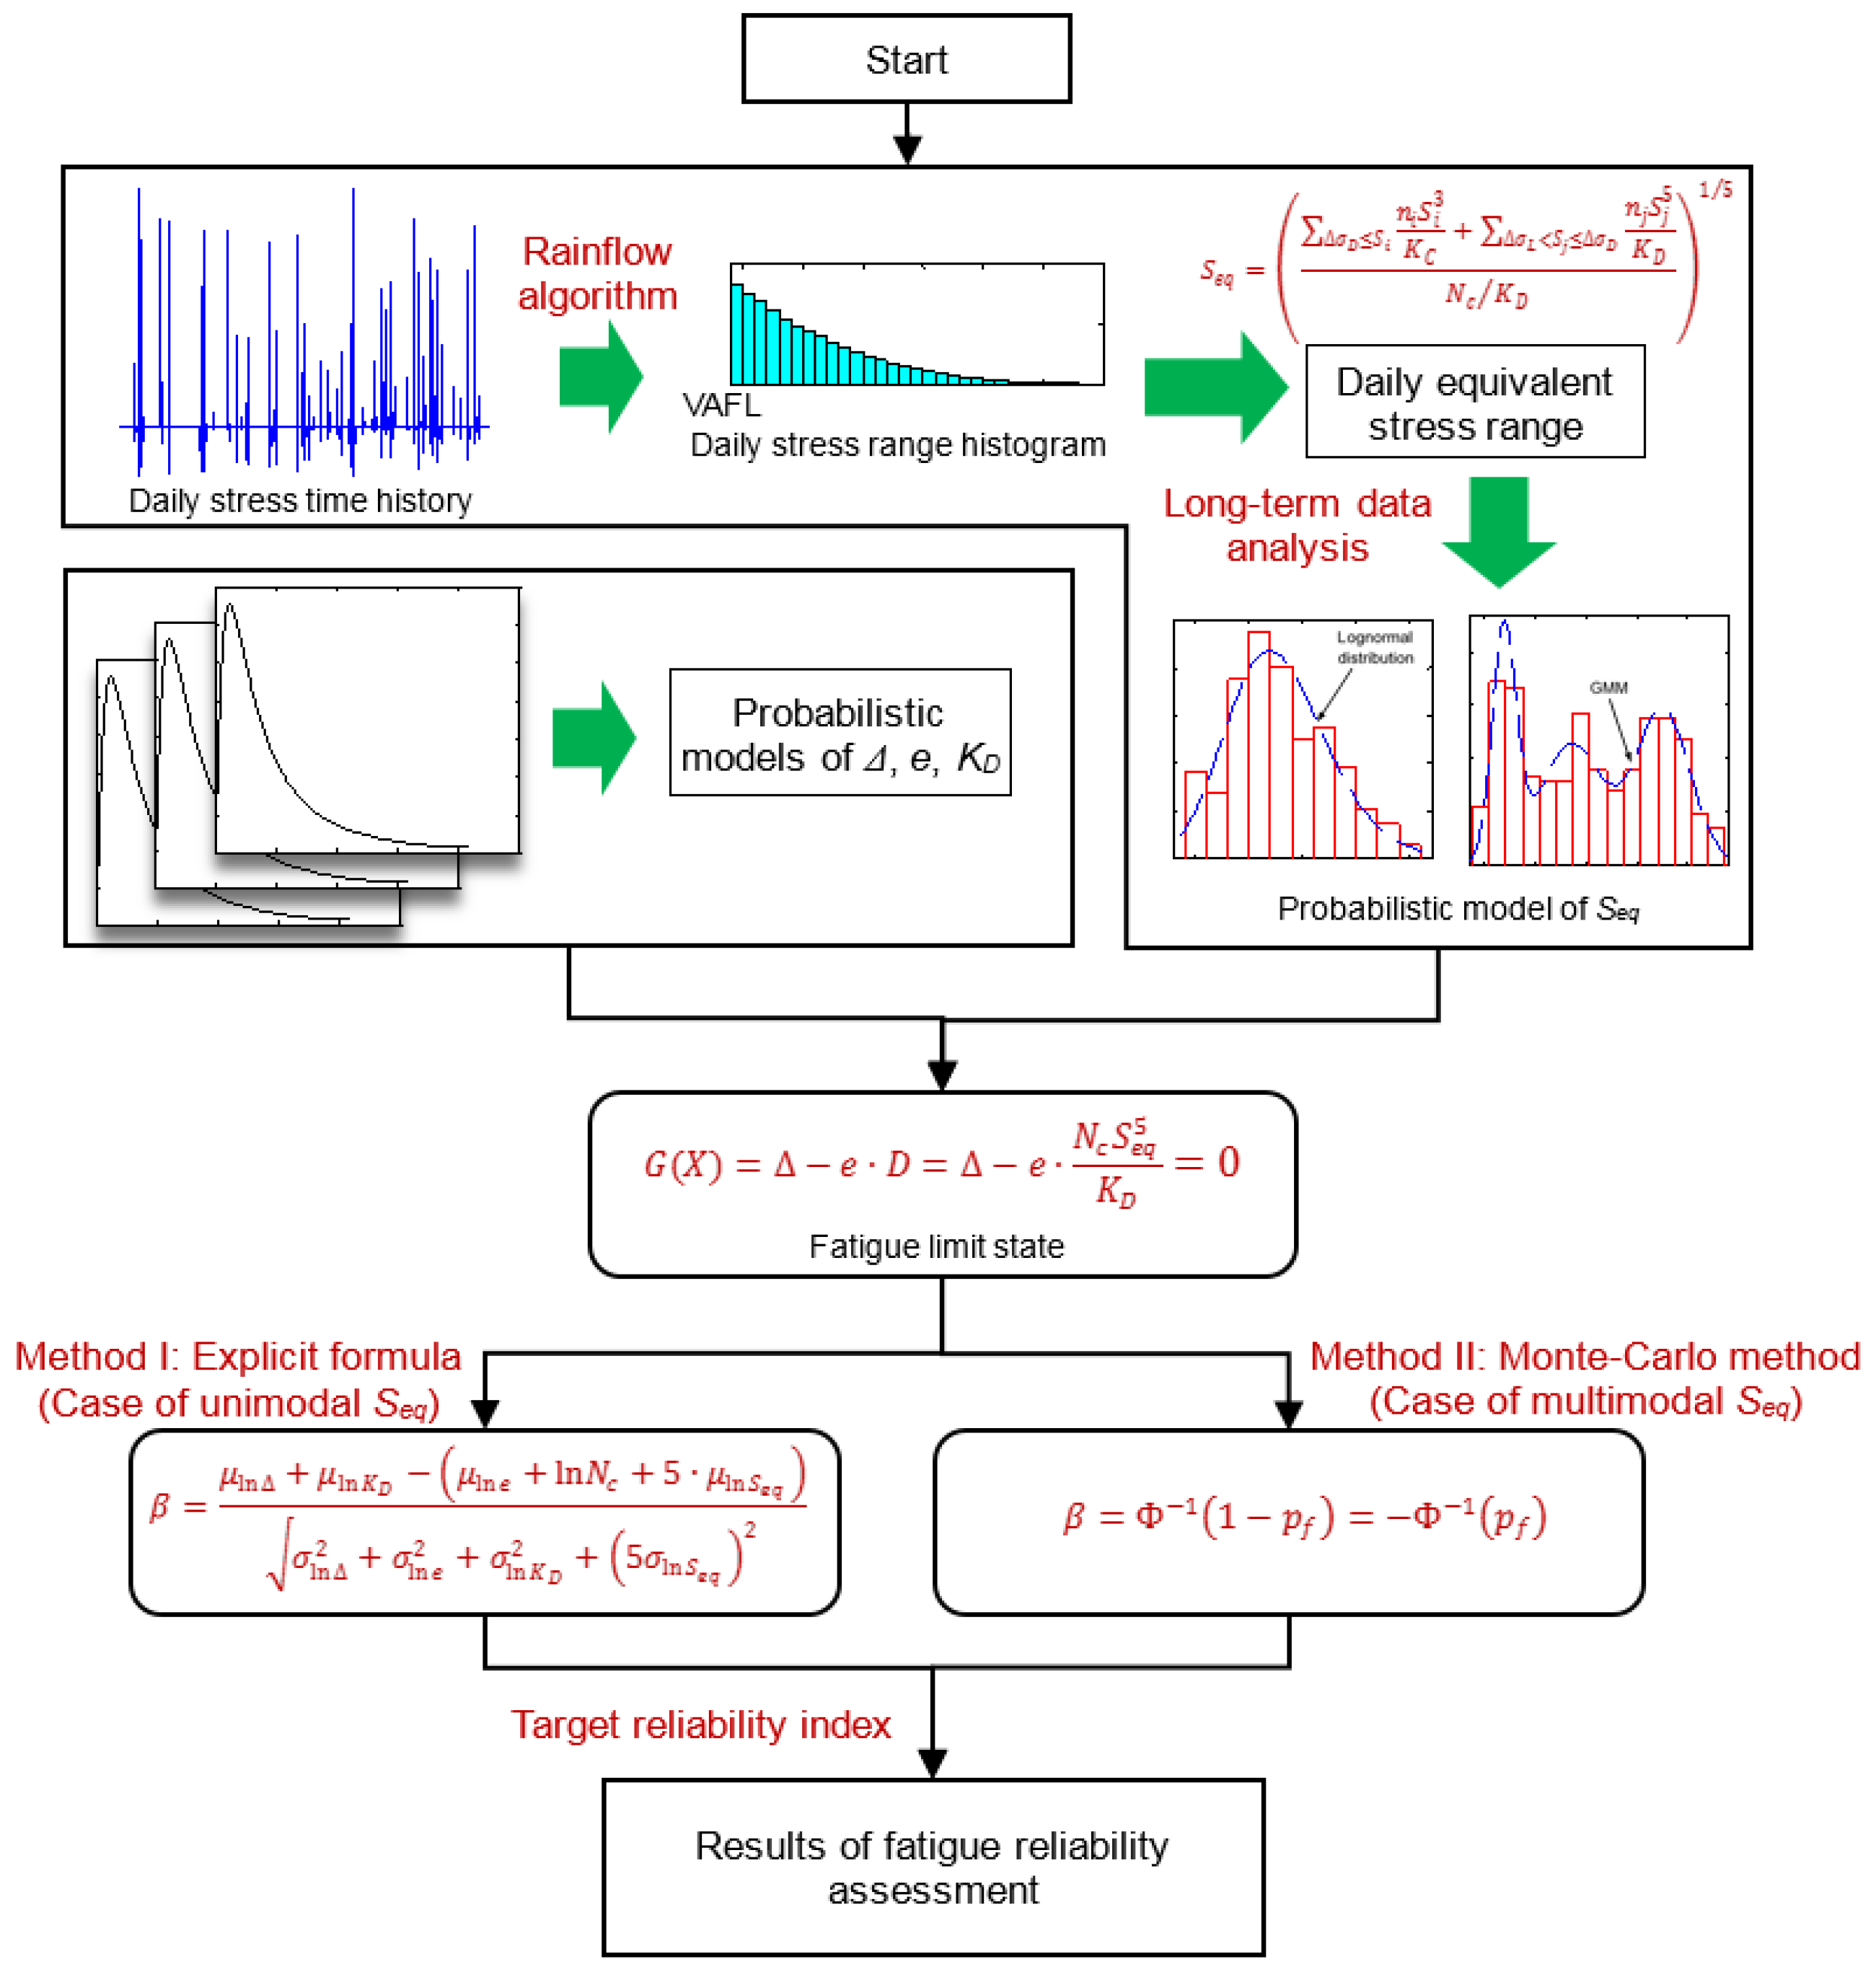
Based on the above formulation, the proposed outline for fatigue reliability assessment based on long-term strain monitoring is summarized and presented in Figure 2.
3. Application on Runyang Suspension Bridge Based on Monitoring Data
3.1. Description of the Bridge and Strain Monitoring
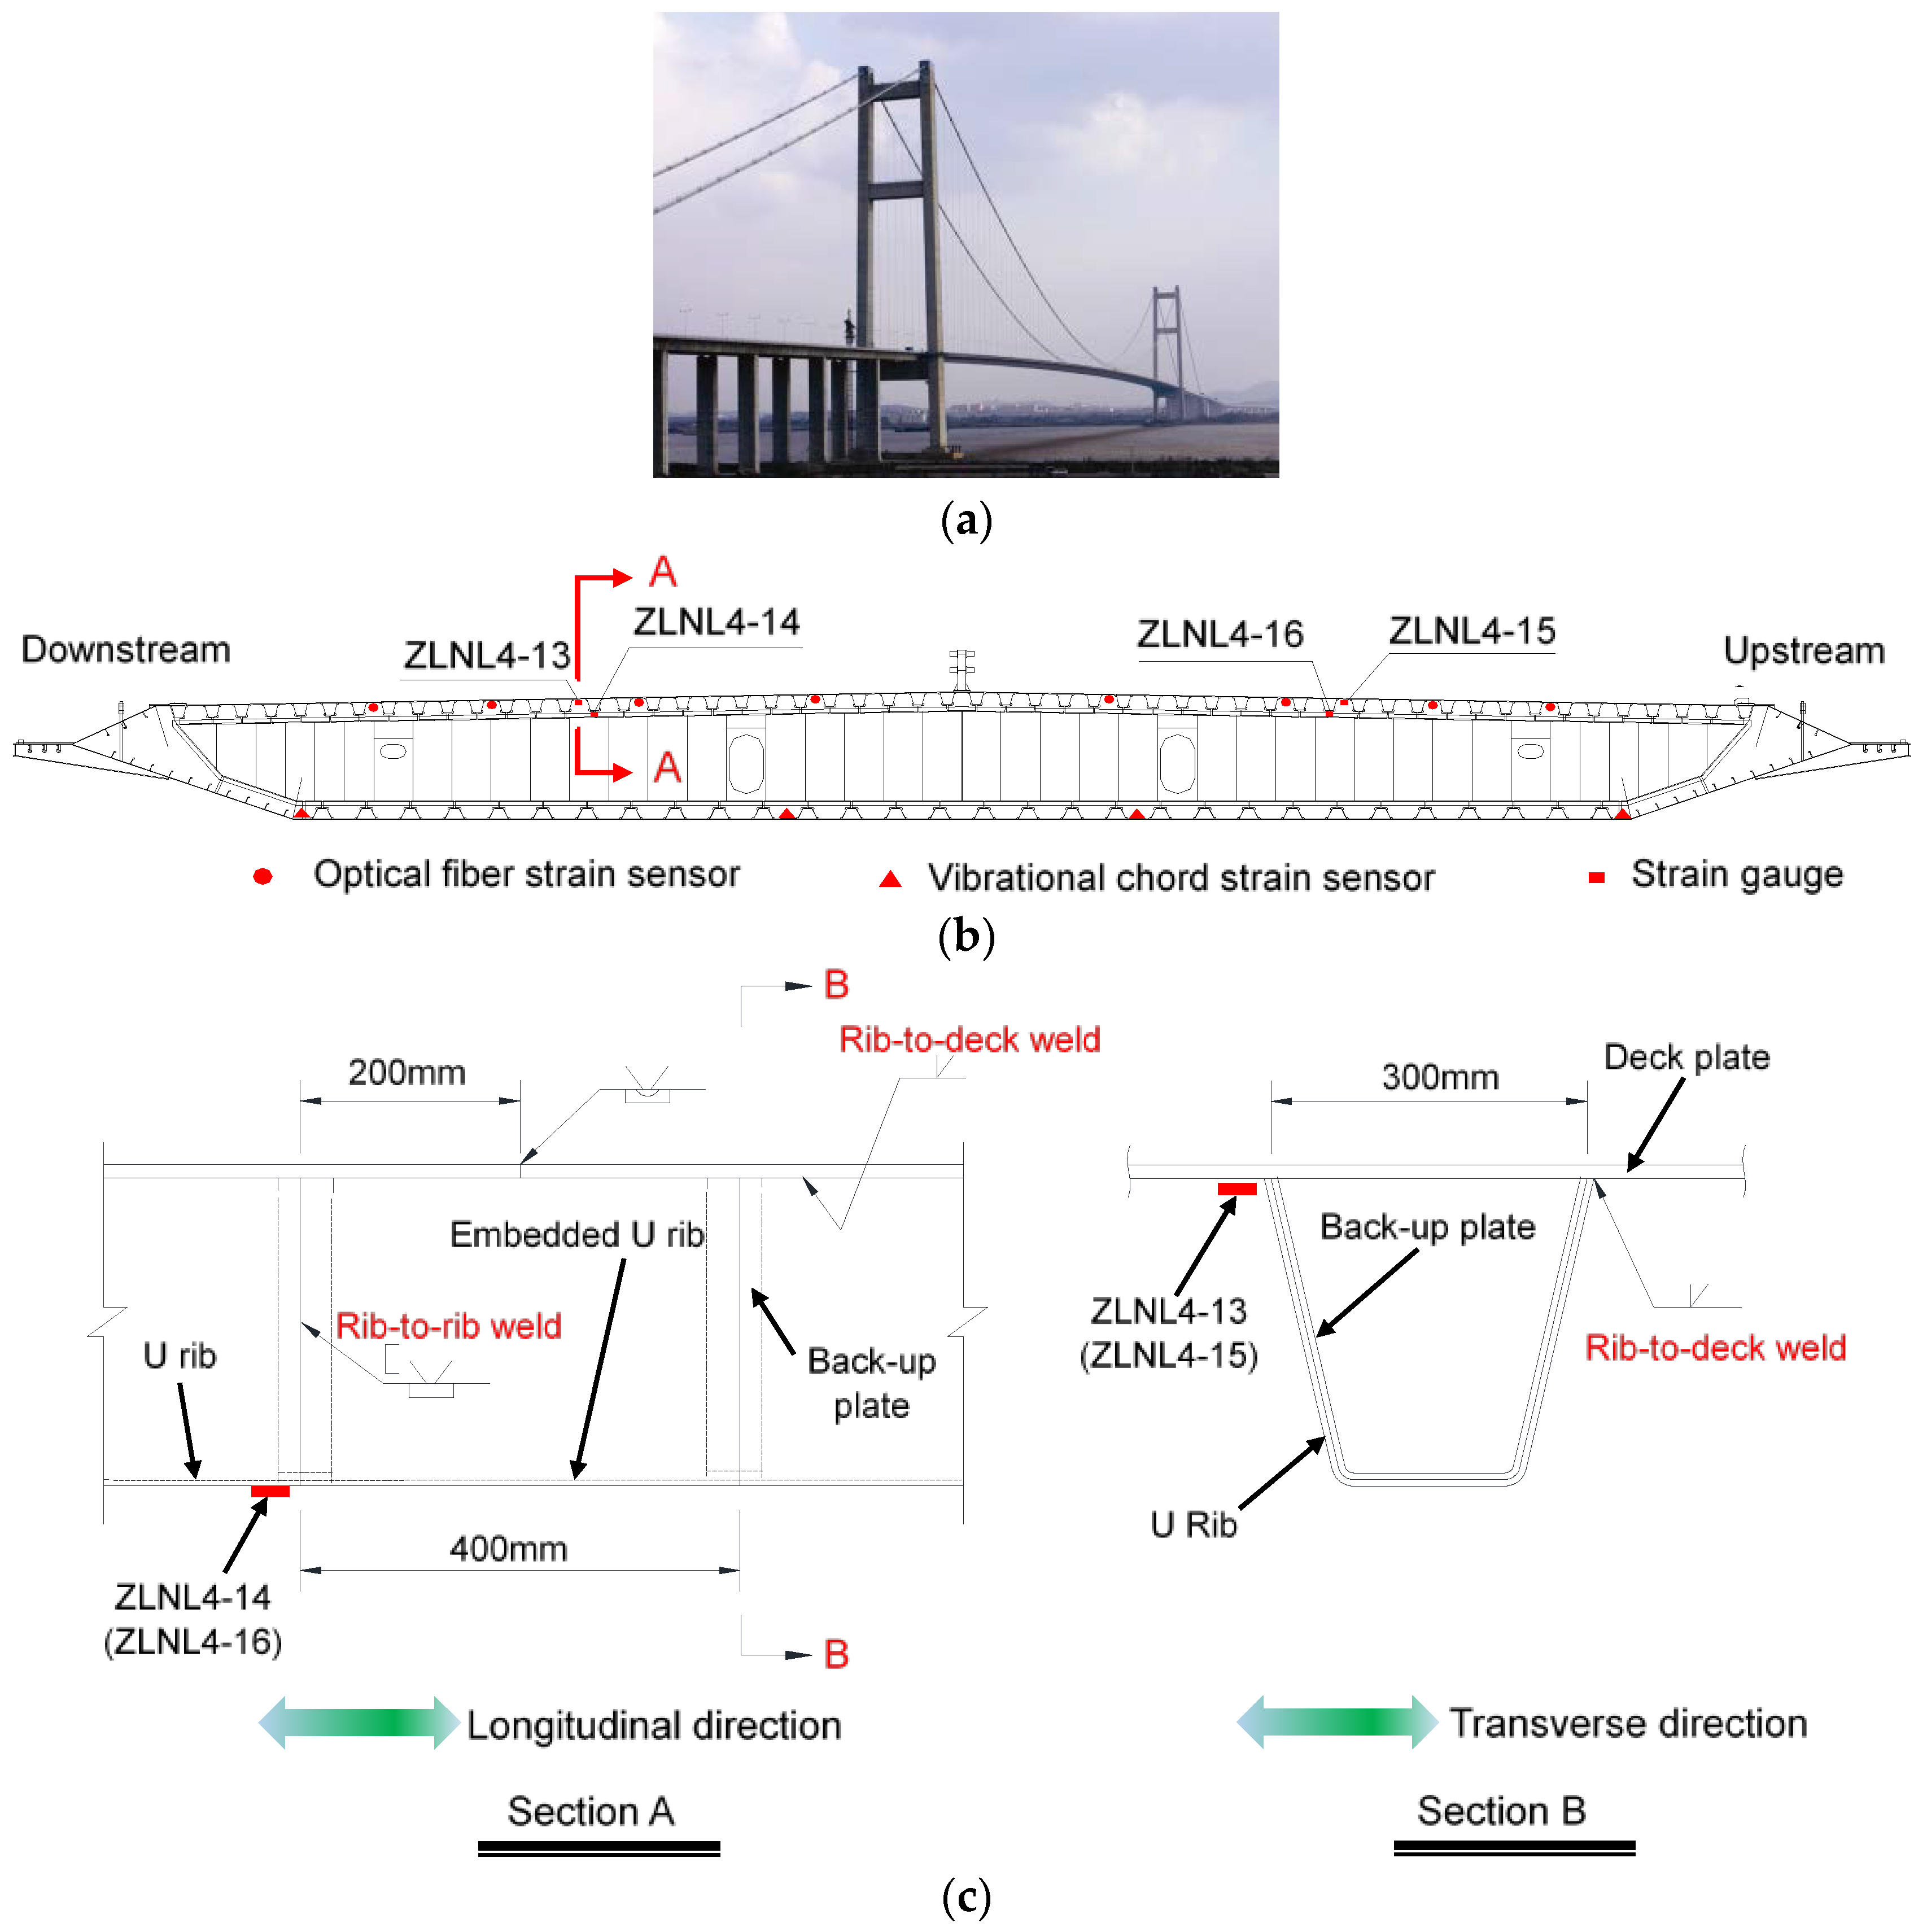
Runyang Suspension Bridge (RSB), open to traffic in April 2005, is a single-span steel suspension bridge, as shown in Figure 3a. It has a main span length of 1490 m. The aerodynamically shaped closed box steel girder is 36.3 m wide and 3.0 m high. The material of the box girder is Q345 steel, with a yield strength of 345 MPa. The health monitoring system for the RSB was developed and installed for real-time monitoring of bridge responses under various environment actions and traffic loads [10]. Three types of strain sensors—i.e., optical fiber strain sensors, vibration chord strain sensors, and strain gauges—were installed on the mid-span section of the RSB’s steel box girder, as shown in Figure 3b.
The dynamic strain measurements collected by the strain gauges are processed and analyzed in this study. As shown in Figure 3c, gauges ZLNL4-13 and ZLNL4-15 are used for longitudinal strain measurements of the rib-to-deck weld details, while ZLNL4-14 and ZLNL4-16 are measuring transverse strains of the rib-to-rib weld details. The thicknesses of the deck plate and the U-shape rib are 14 mm and 6 mm, respectively. The rib-to-deck fillet welds were shop welded to obtain 100% penetration. U ribs were field spliced by butt welding in conjunction with two back-up plates and an embedded U rib segment. The thicknesses of the back-up plates and the embedded U rib are both 6 mm.
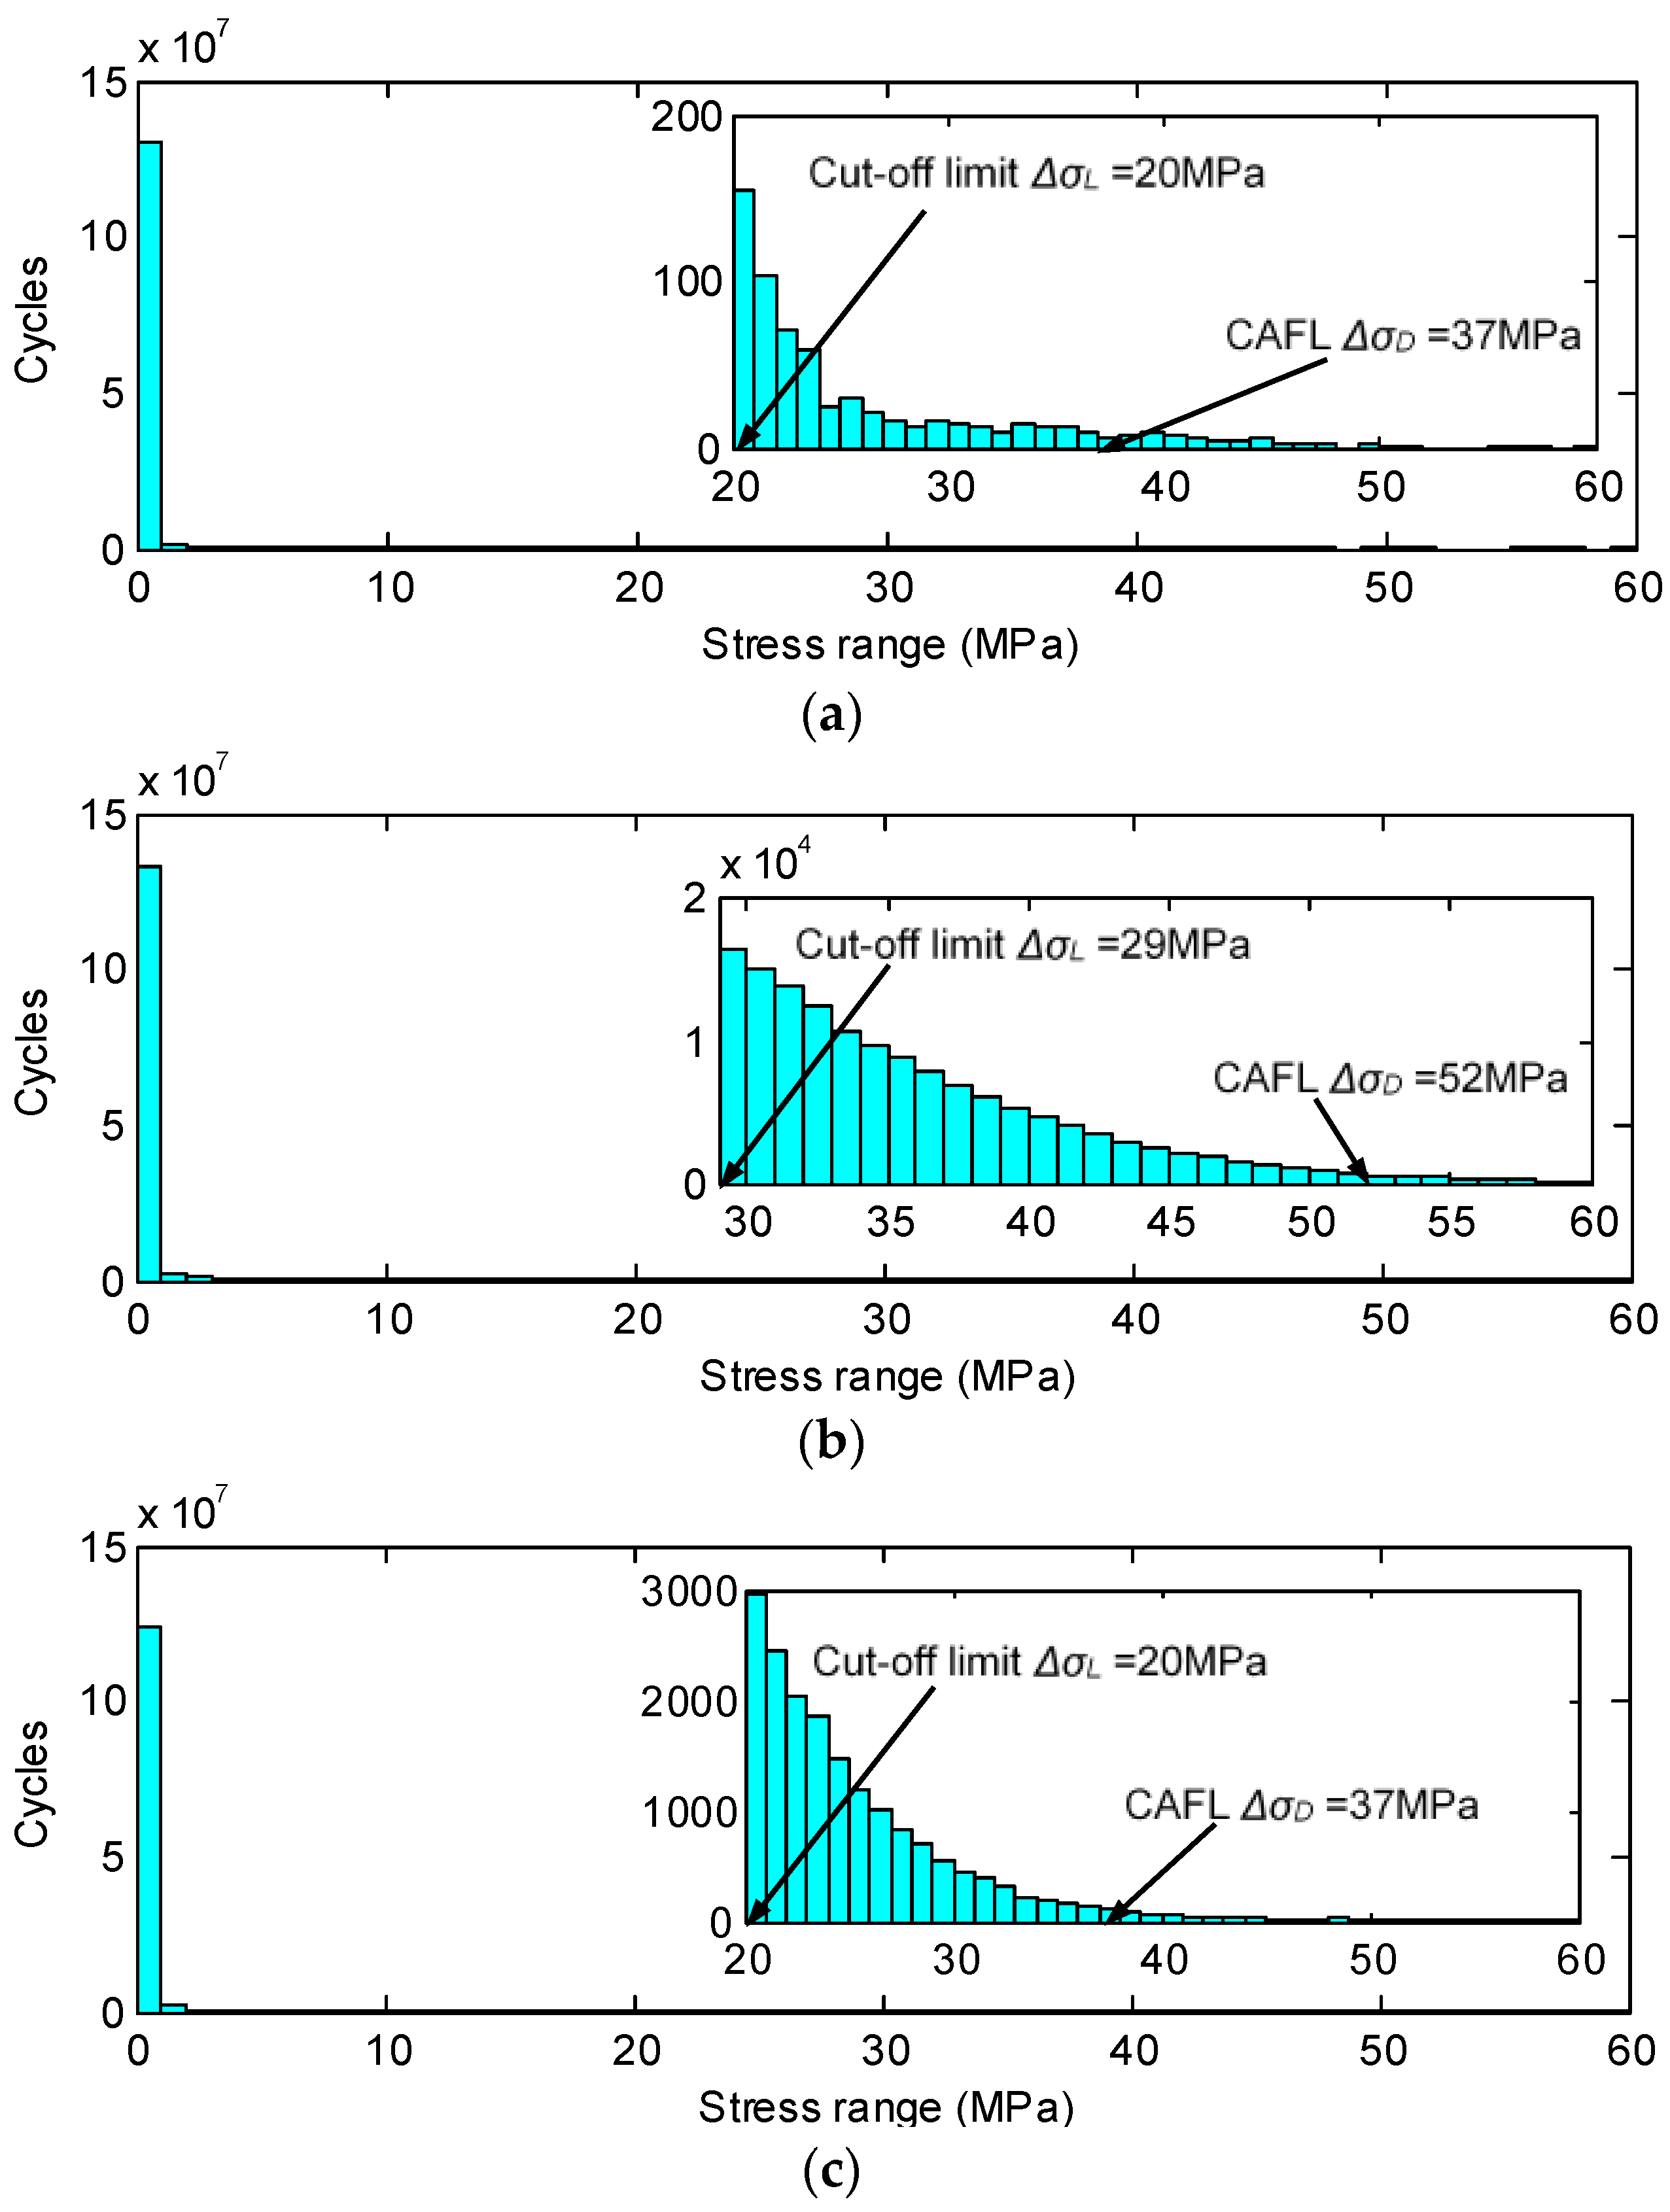
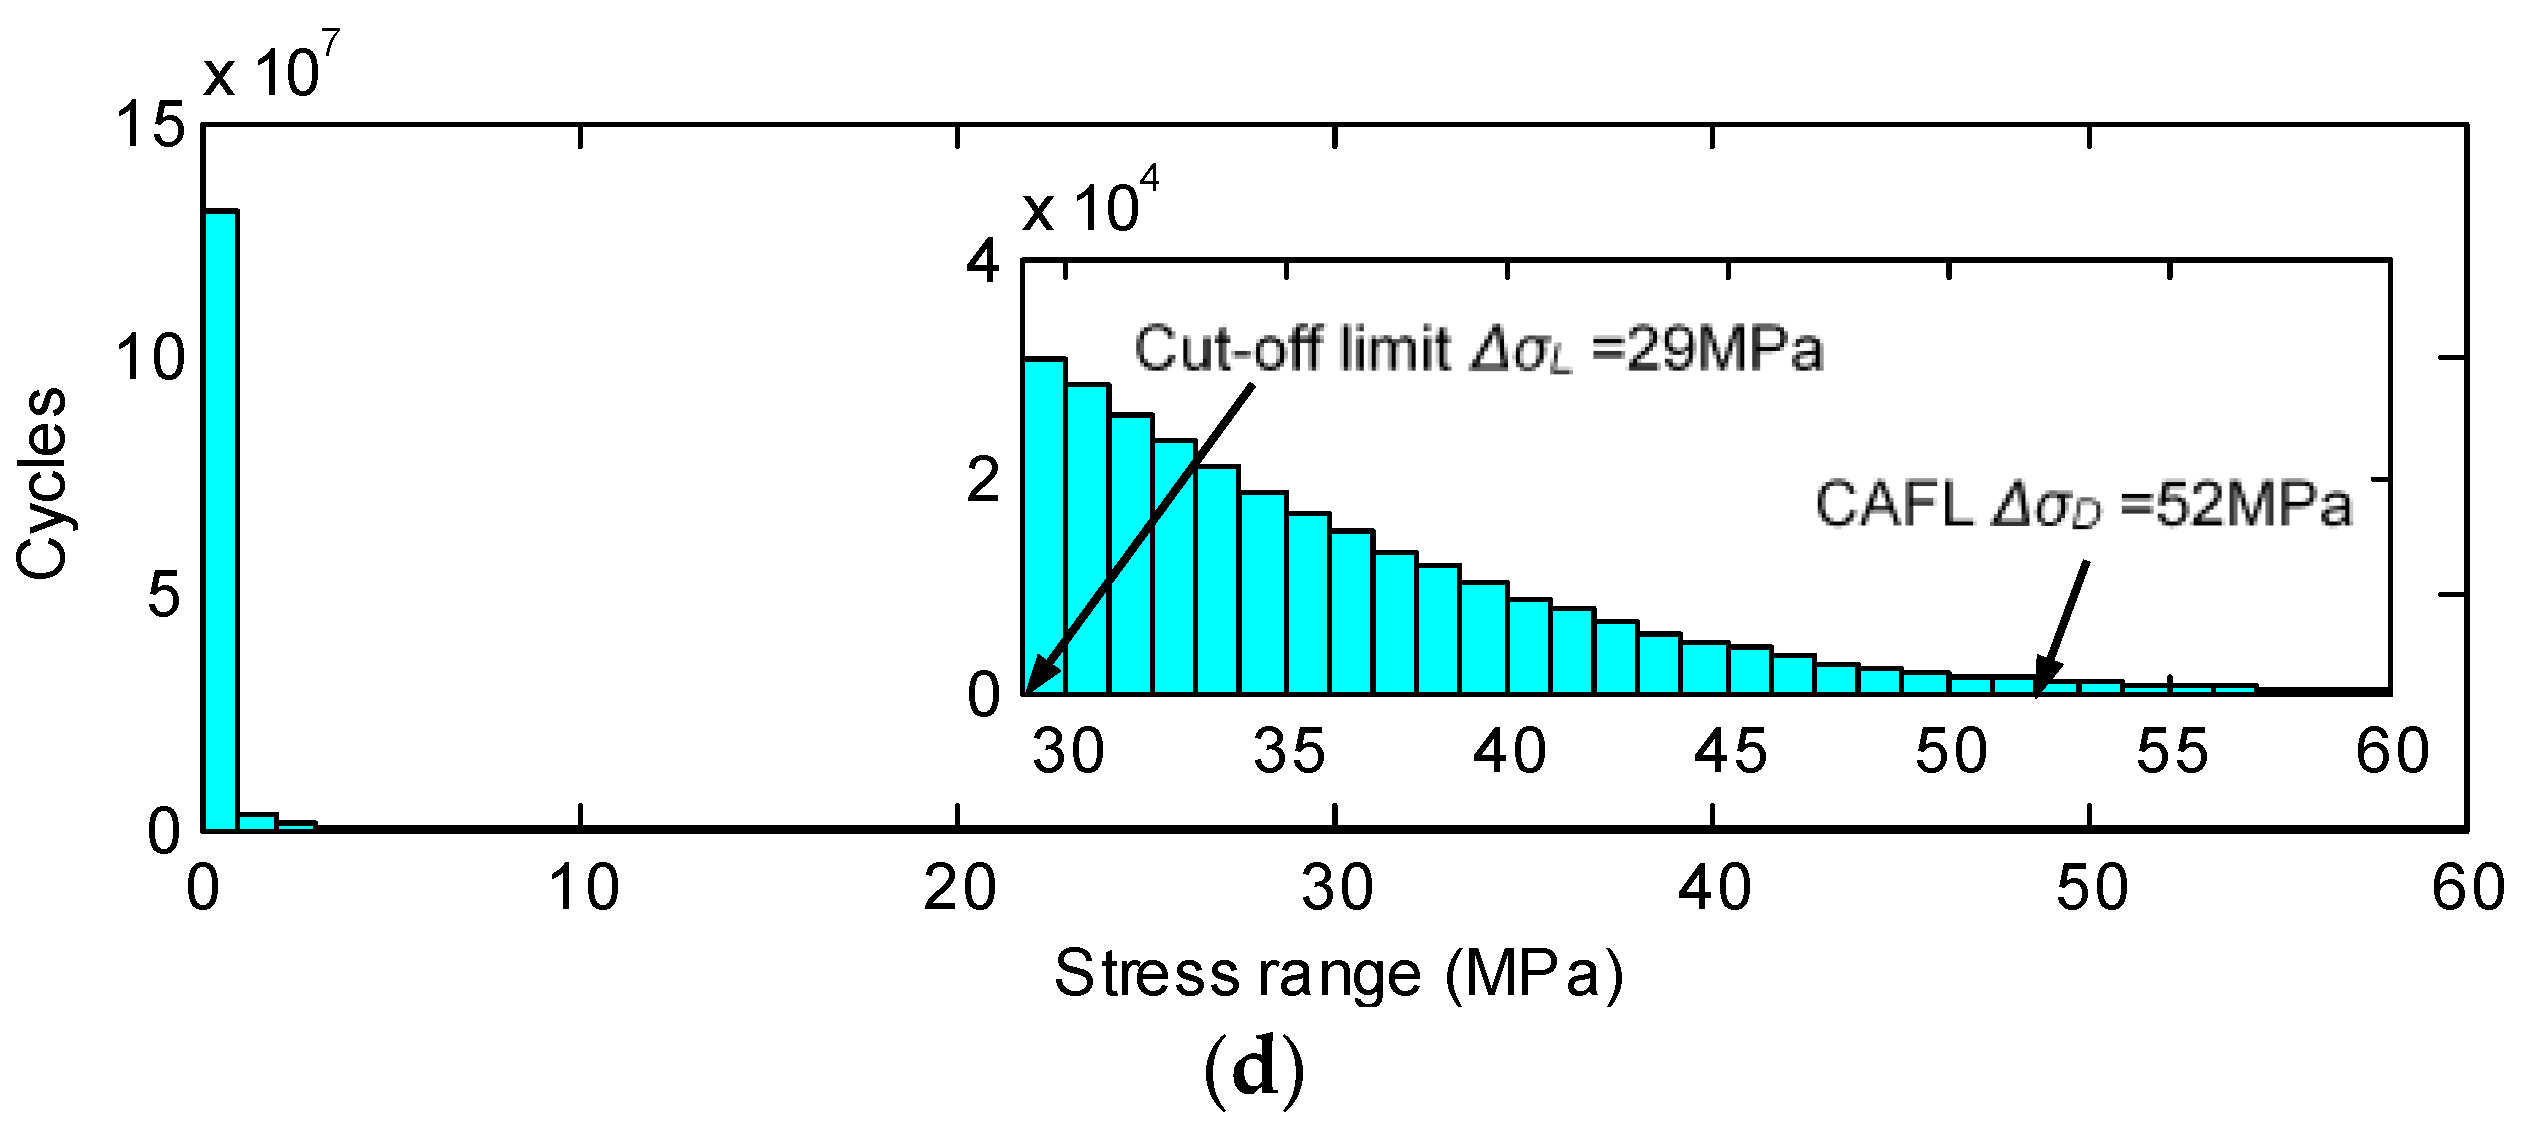
To evaluate the long-term fatigue performance of the rib-to-deck and rib-to-rib weld details subject to operational traffic loadings, monitoring data collected during a total of 327 days in 2009 are used. The stress range histograms from the 327-day monitoring data are obtained by using the rain flow algorithm [30], as presented in Figure 4. It can be observed that small-amplitude stress ranges of less than 3 MPa dominate the histograms, which is a typical finding for fatigue details of highway steel bridges [3,19,24]. Table 3 lists the number of stress cycles in the histograms, which indicates that these details have a similar number of total cycles. The numbers of stress cycles, which are larger than the cut-off limit or the VAFL, only account for a small portion of the total cycles. Furthermore, the cycle number of the welded details in the downstream is less than that of the welded details in the upstream. This phenomenon may be attributed to the differences in the traffic volumes between upstream and downstream directions.
3.2. Probability Density Functions of Seq
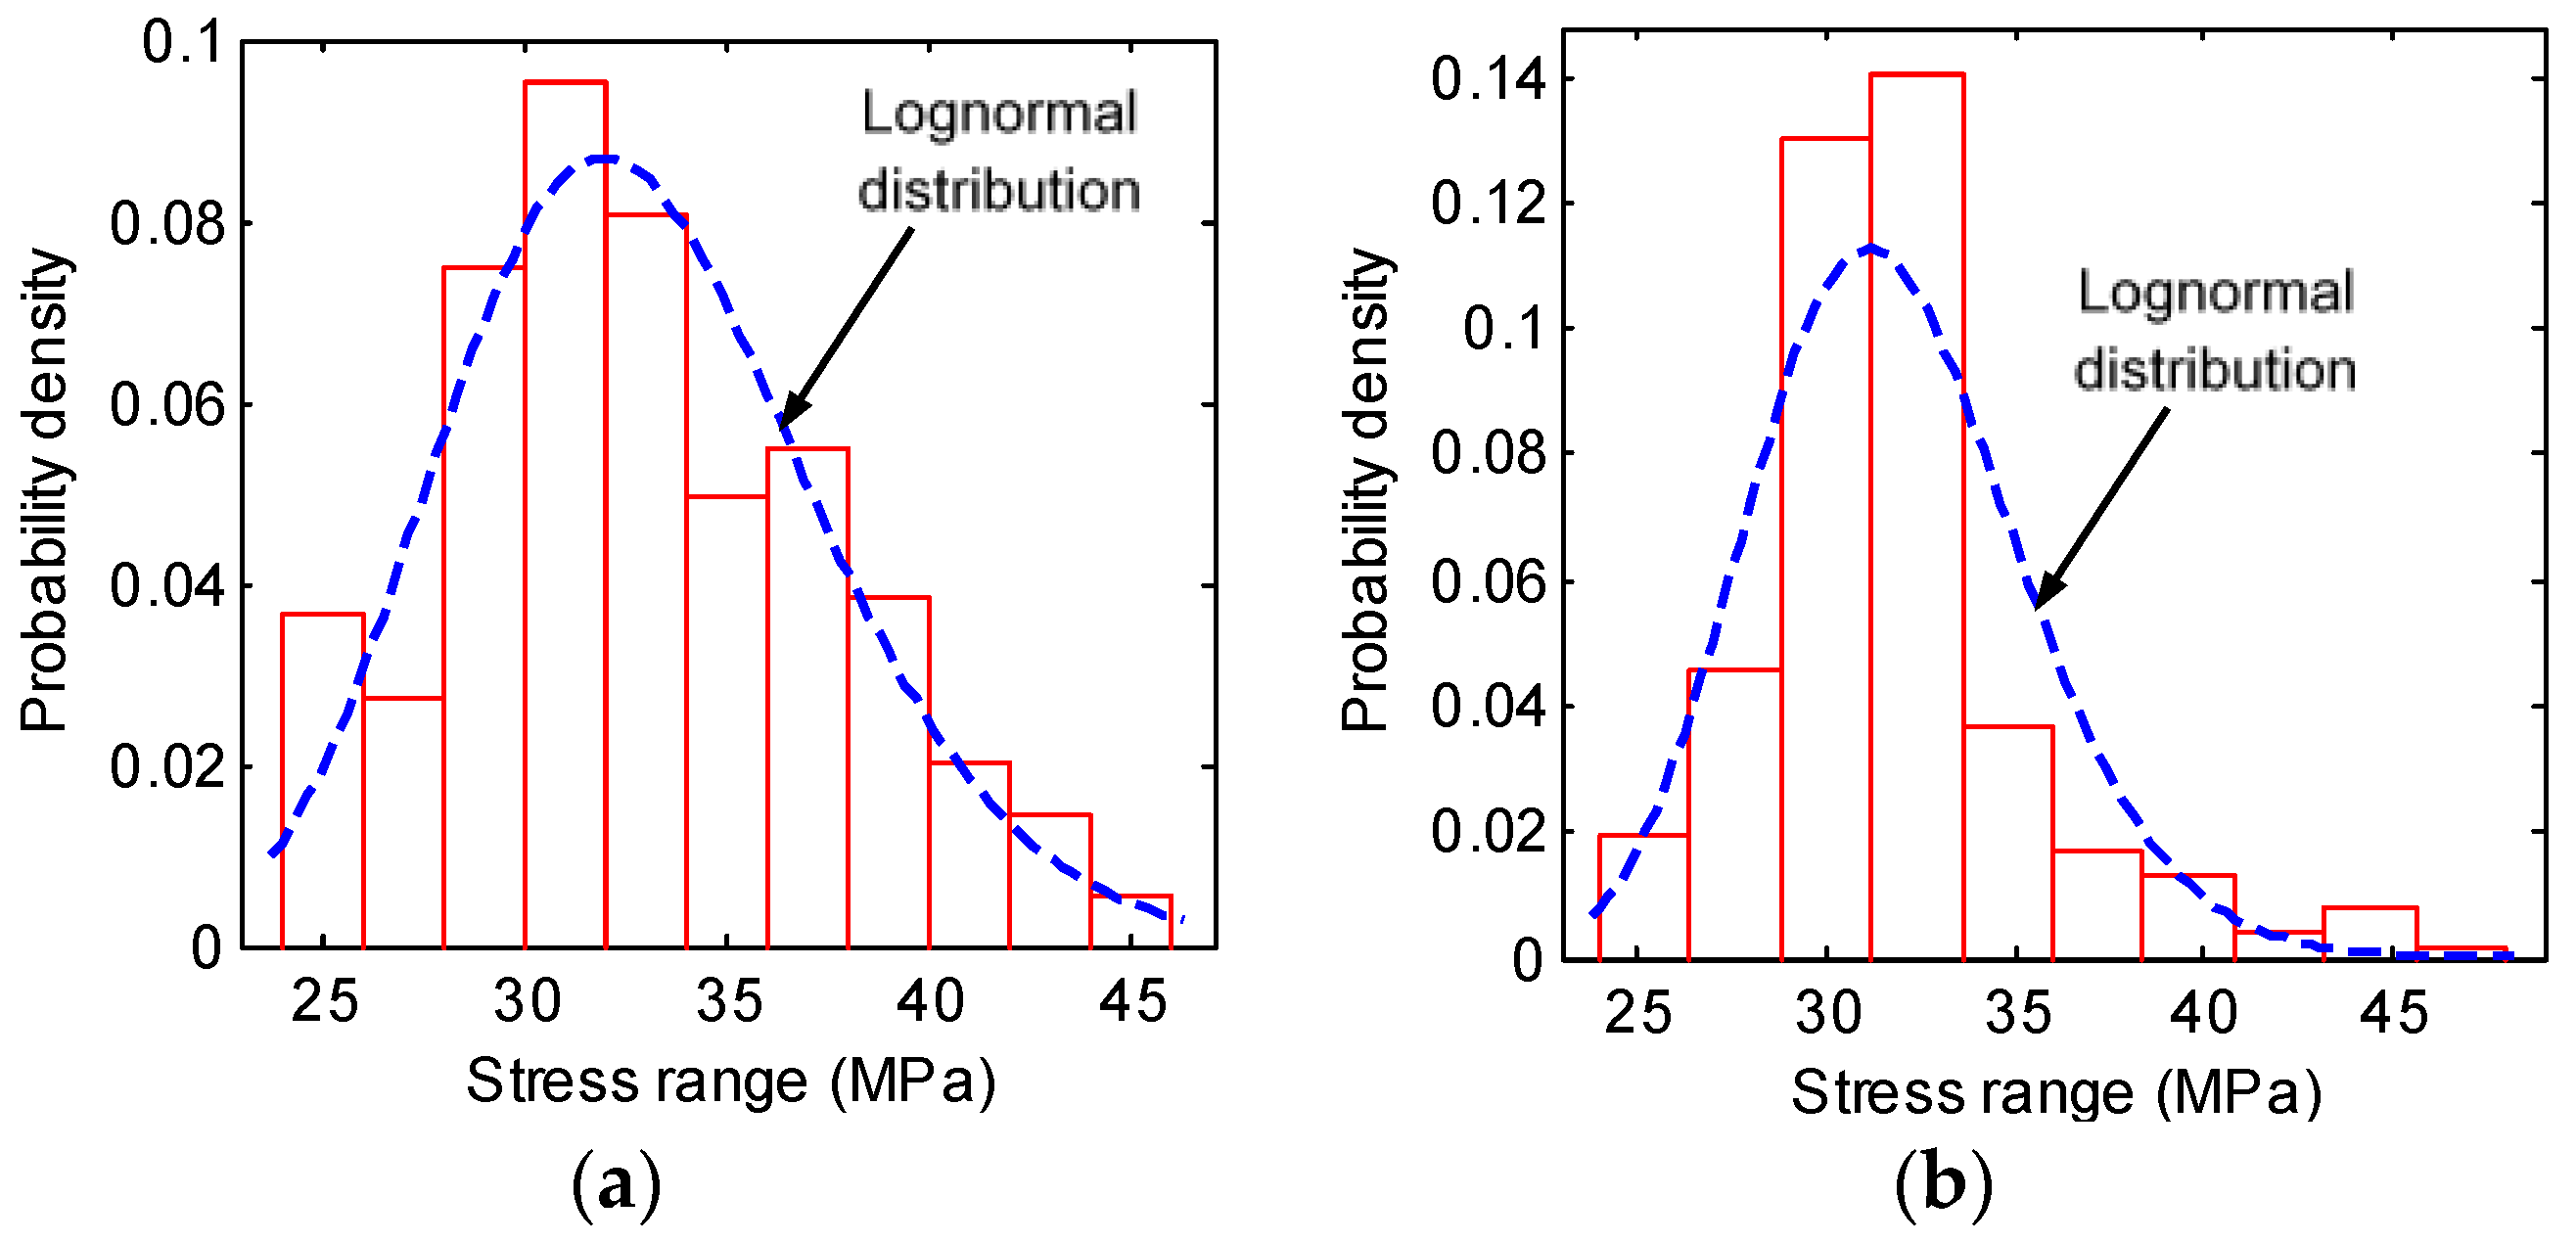
As introduced in Section 2.2, the probability density function of Seq for the four selected weld details can be obtained using the lognormal distribution and the GMM. Firstly, daily stress range histograms can be derived from recorded stress time histories by the rain-flow counting. Then the Seq can be obtained using Equation (4). A total of 327 data points of Seq are obtained from 327-day measurements, which are further used to develop the probability density function of Seq. Figure 5 and Figure 6 plot the statistical histograms of Seq for the four details. As can be seen, for the rib-to-deck details, there is only one dominant peak. Therefore, the lognormal distribution can be fitted to these data points using the maximum likelihood method. The fitted probability density functions of Seq for the two rib-to-deck details are presented in Equations (17) and (18).
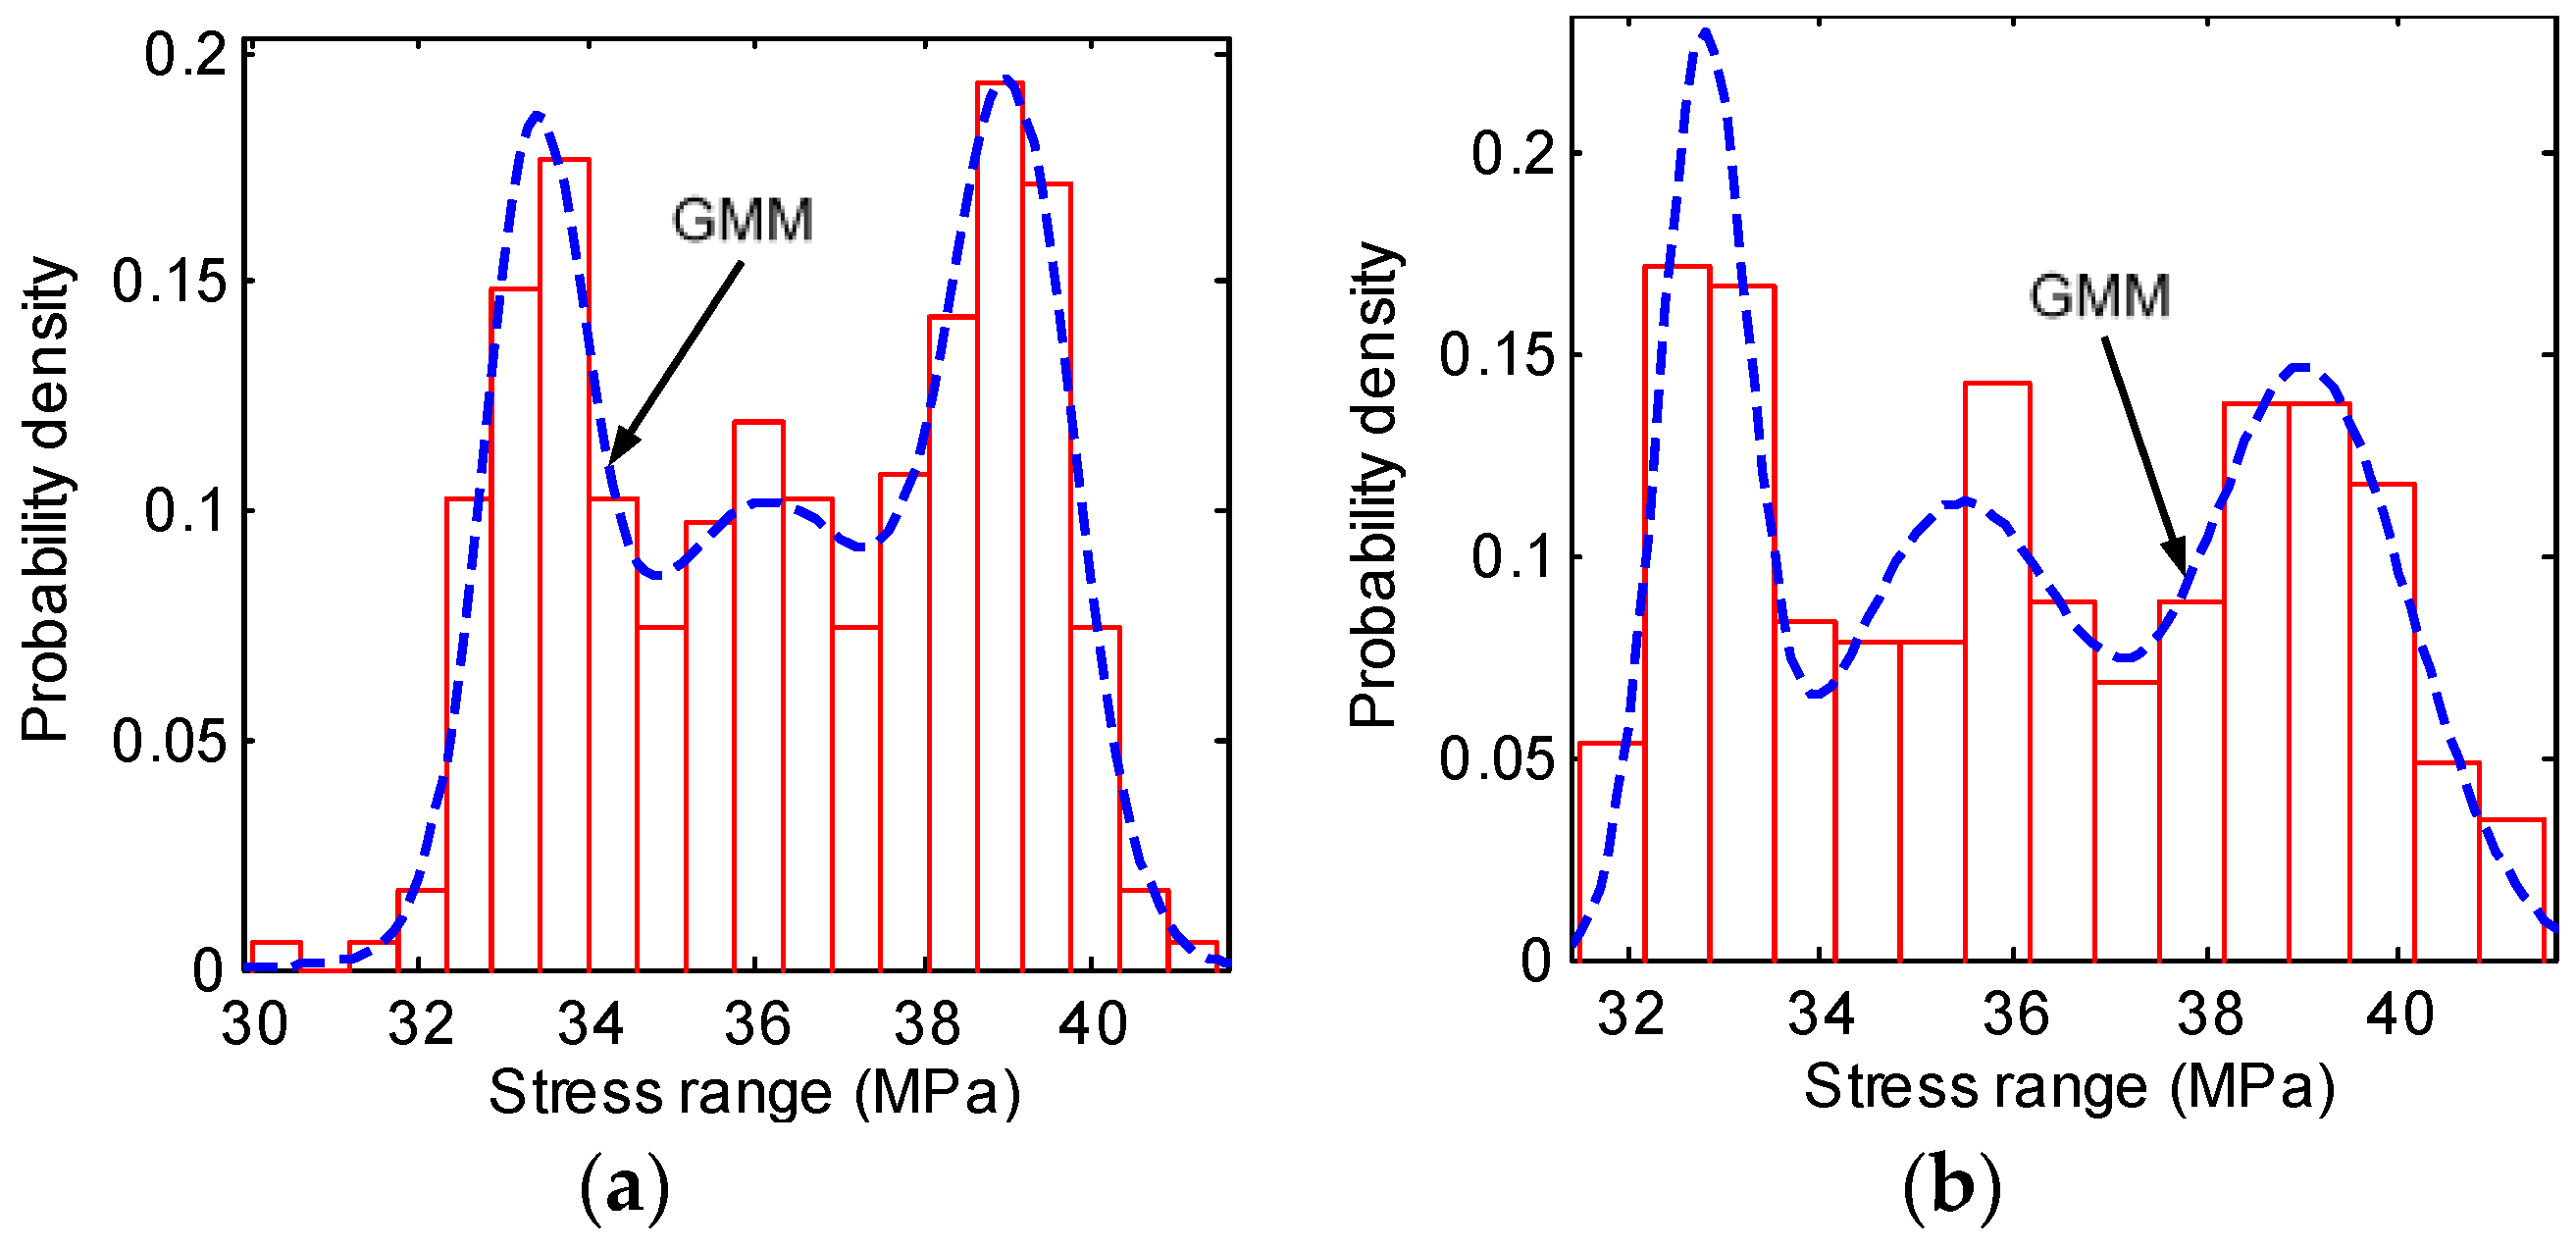
For the rib-to-rib details, there are multiple peaks in the Seq histograms, and thus the GMM is used. The optimal number of Gaussian components is firstly determined by using the information criterions introduced in Section 2.2. Figure 7 shows the values of AIC and BIC with the number of Gaussian components varying from 1 to 10. It is observed that both the AIC and BIC are minimized when the number of Gaussian components is 3, meaning that the optimal number of Gaussian components for both ZLNL4-14 and ZLNL4-16 is 3. The estimated parameters are shown in Table 4.
3.3. Results of the Fatigue Reliability Assessment
With the statistic information listed in Table 2 and the probability density functions of Seq presented in Section 3.2, the fatigue reliabilities of the rib-to-deck details (with unimodal Seq) and the rib-to-rib details (with multimodal Seq) can be respectively calculated using Method I and Method II. It is noted that the times of the Monte Carlo simulation for rib-to-rib details is set to be 2 × 10⁸.
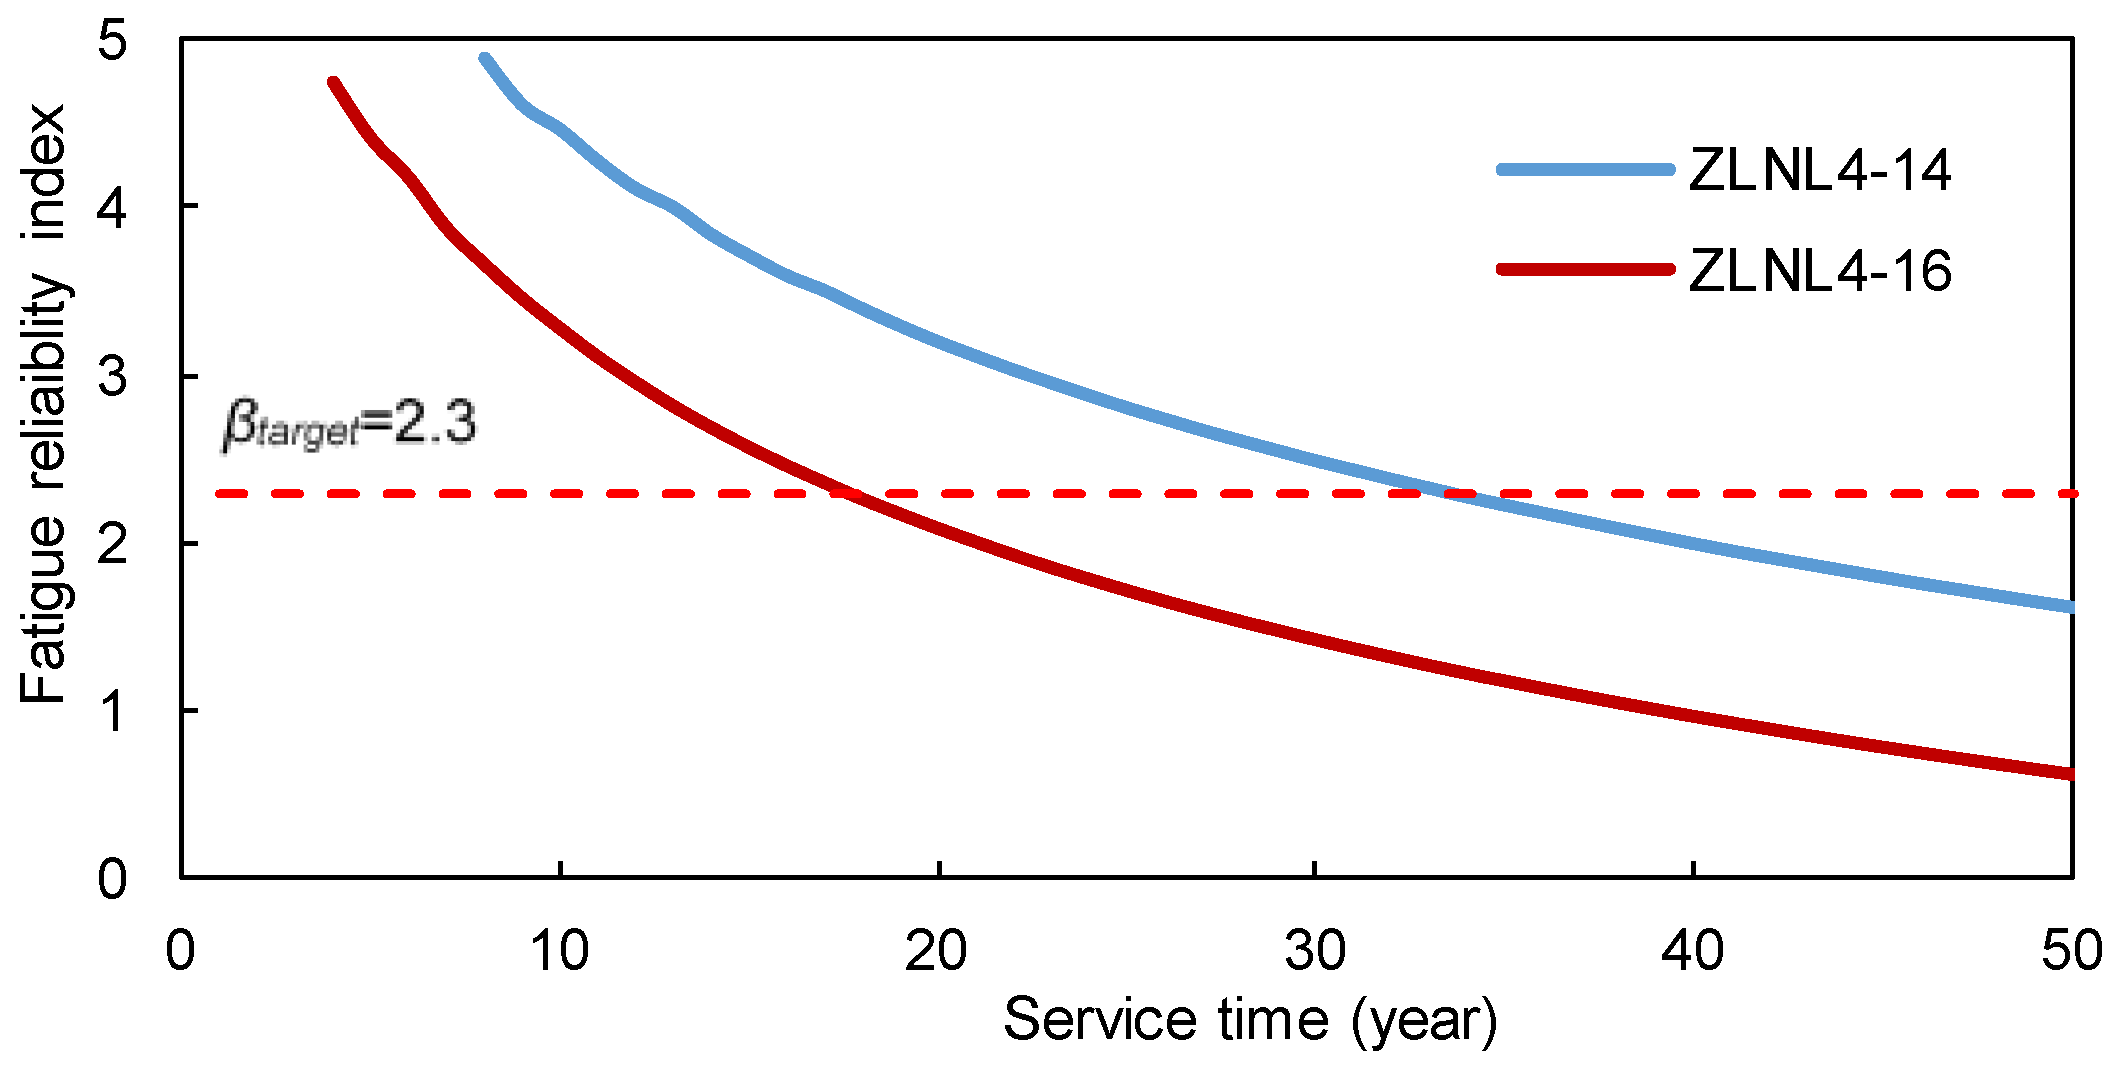
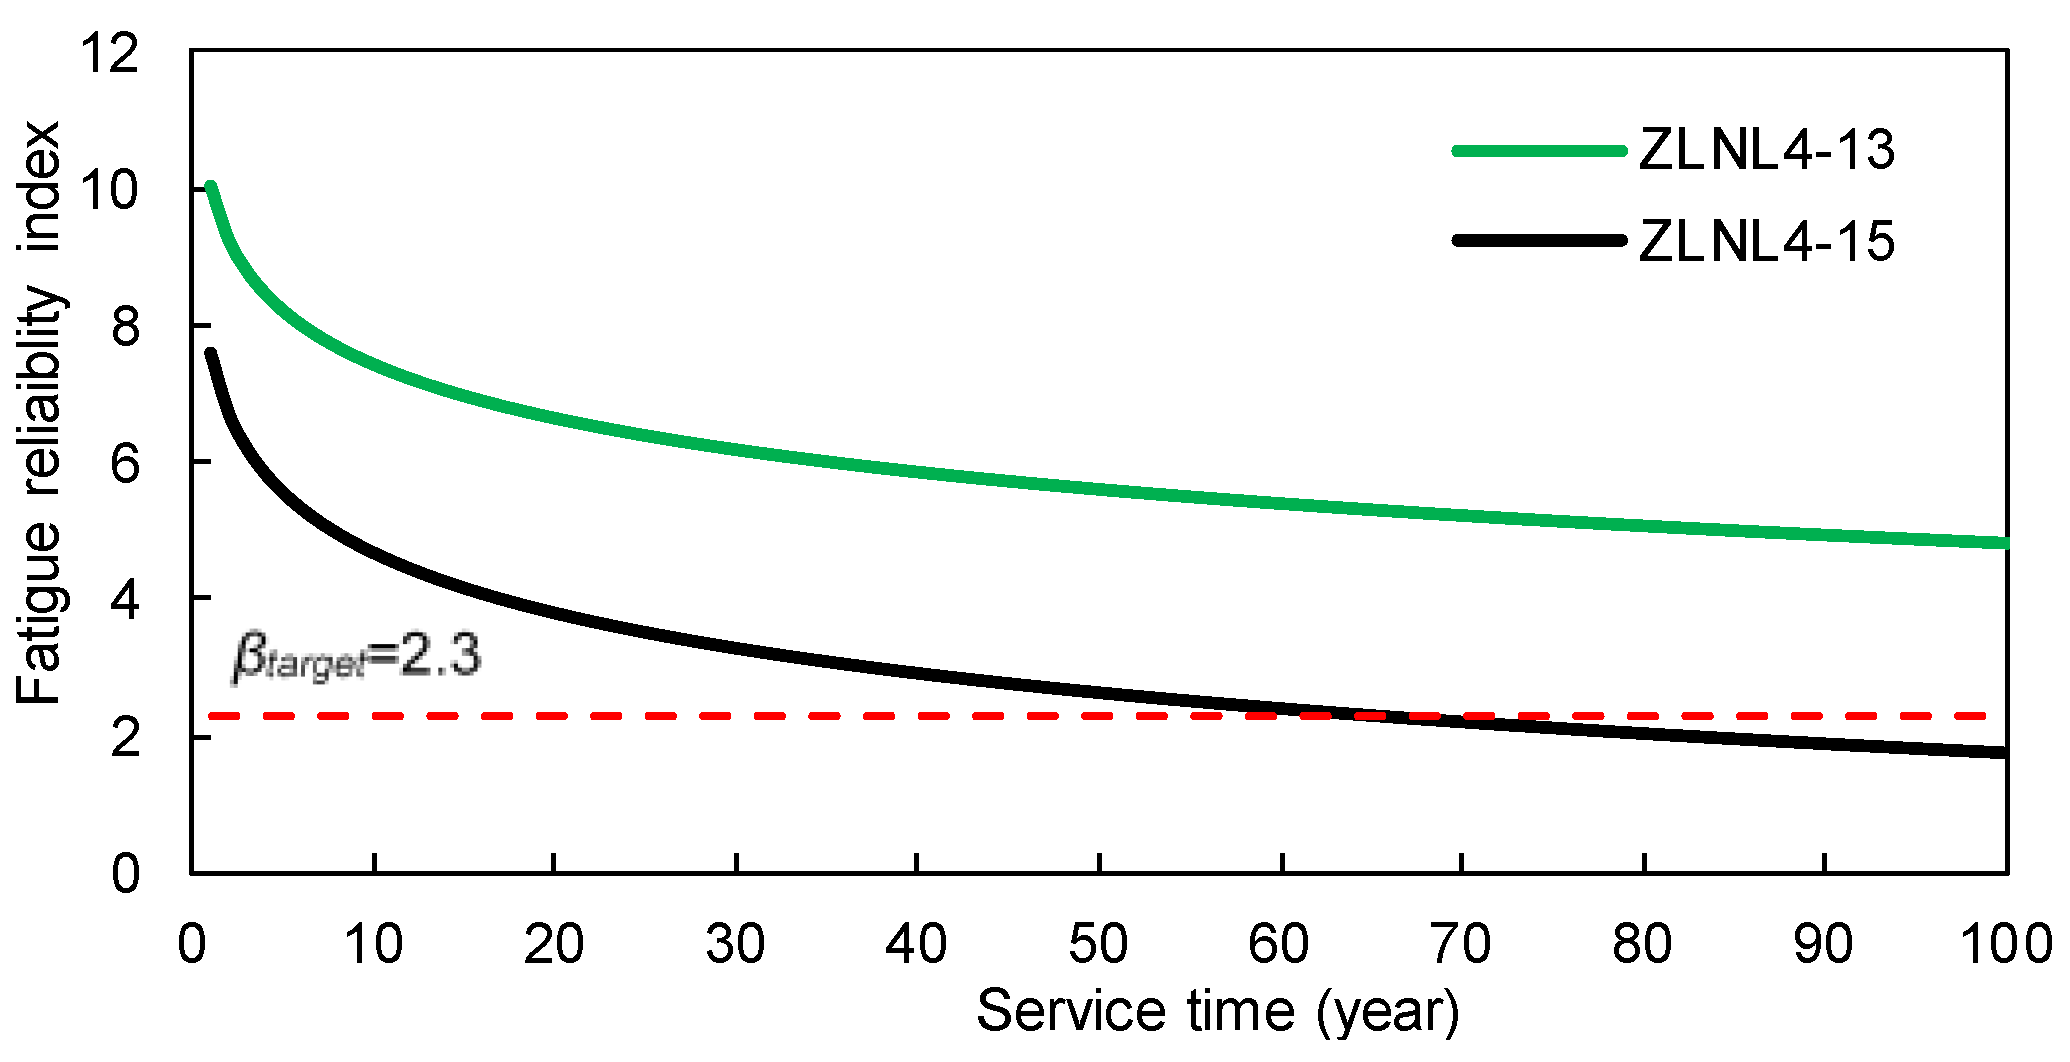
The time-dependent fatigue reliability indices are shown in Figure 8 and Figure 9. It is observed that the reliability indices are pretty high at the beginning of the service life of these welded details. However, as time goes on, the reliability indices decrease significantly. Figure 8 shows that during the first 10 years of the service life, the fatigue reliability indices of the rib-to-rib details cannot be obtained due to the extremely low failure possibility. According to the ISO 2394 [31], the target reliability index for a structural component with certain consequences of failure and moderate costs of safety measures is 2.3. As show in the figures, the service years for details of ZLNL4-14, ZLNL4-15 and ZLNL4-16 are 33, 65, and 18, respectively, when the fatigue reliability indices reach βtarget. Only the welded detail of ZLNL4-13 has fatigue reliability higher than βtarget during the entire 100-year service life. Results also indicate that for both the two types of weld details, the fatigue reliability index of the downstream detail is higher than that of the upstream detail. Besides, the reliability index of the rib-to-deck detail is higher than that of the rib-to-rib detail. The results suggest that during the service life the RSB, there are high levels of fatigue failure for welded details of the orthotropic deck. Hence, routine and in-depth field inspections are required to locate the potential fatigue cracks and make timely mitigation plans.
4. Conclusions
This study proposed a systematic time-dependent fatigue reliability assessment approach for welded details of OSDs using long-term strain monitoring data. Depending on whether the equivalent stress range is distributed unimodally or multimodally, the fatigue reliability can be calculated based on either an explicit formula or the Monte Carlo method. According to the proposed procedure, fatigue reliabilities of two types of welded details (i.e., rib-to-deck and rib-to-rib details) of an in-service long-span suspension bridge are investigated. The following conclusions can be made:
- (1)
- Two probabilistic models, namely, the lognormal distribution and the GMM, are adopted to quantify uncertainties of the daily Seq. The lognormal distribution is more suitable for the unimodal Seq for rib-to-deck details. By contrast, the daily Seq for the rib-to-rib details can be represented by the GMM, which is composed of three Gaussian components.
- (2)
- The results indicate that the reliability indices decrease significantly as the service life increases. During the 100-year service life, except for a rib-to-deck detail, other three welded details cannot meet the target fatigue reliability during the bridge’s 100-year service life.
- (3)
- This study also reveals that the fatigue reliability indices of the downstream details are higher than those of the upstream details, which is probably due to the difference in the traffic volumes between upstream and downstream directions. Besides, the rib-to-deck details for the RSB have higher fatigue reliabilities than those of the rib-to-rib details.
The proposed approach can help bridge owners and practitioners make informed decisions regarding maintenance and repair of potential fatigue cracks.
Acknowledgments
This work was supported by the National Natural Science Foundation of China (51438002, 51308073).
Author Contributions
Yang Deng analyzed the monitoring data and wrote this paper. Aiqun Li designed the monitoring system. Dongming Feng was involved in data analysis and paper writing.
Conflicts of Interest
The authors declare no conflict of interest.
References
- Wolchuk, R. Lessons from weld cracks in orthotropic decks on three European bridges. J. Struct. Eng. ASCE 1990, 116, 75–84. [Google Scholar] [CrossRef]
- Partov, D.; Dinev, D. Structure, Design and construction of a steel orthotropic bridge in Sofia. Adv. Steel Constr. 2007, 3, 752–764. [Google Scholar] [CrossRef]
- Deng, Y.; Liu, Y.; Feng, D.M.; Li, A.Q. Investigation of fatigue performance of welded details in long-span steel bridges using long-term monitoring strain data. Struct. Control Health Monit. 2015, 22, 1343–1358. [Google Scholar] [CrossRef]
- Xiao, Z.G.; Yamada, K.; Inoue, J.; Yamaguchi, K. Fatigue cracks in longitudinal ribs of steel orthotropic deck. Int. J. Fatigue 2006, 28, 409–416. [Google Scholar] [CrossRef]
- Fisher, J.W.; Barsom, J.M. Evaluation of cracking in the rib-to-deck welds of the Bronx–Whitestone Bridge. J. Bridge Eng. ASCE 2016, 21. [Google Scholar] [CrossRef]
- American Association of State Highway and Transportation Officials. Guide Specifications for Fatigue Evaluation of Existing Steel Bridges; American Association of State Highway and Transportation Officials: Washington, DC, USA, 1990. [Google Scholar]
- European Committee for Standardization. EN1993-1-9: Eurocode 3: Design of Steel Structures: Part 1-9: Fatigue; European Committee for Standardization: Brussels, Belgium, 2005. [Google Scholar]
- Zhang, Q.H.; Cui, C.; Bu, Y.Z.; Liu, Y.M.; Ye, H.W. Fatigue tests and fatigue assessment approaches for rib-to-diaphragm in steel orthotropic decks. J. Constr. Steel Res. 2015, 114, 110–118. [Google Scholar] [CrossRef]
- Kainuma, S.; Yanga, M.; Jeong, Y.S.; Inokuchi, S.; Kawabata, A.; Uchida, D. Experiment on fatigue behavior of rib-to-deck weld root in orthotropic steel decks. J. Constr. Steel Res. 2016, 119, 113–122. [Google Scholar] [CrossRef]
- Guo, T.; Li, A.Q.; Li, J.H. Fatigue life prediction of welded joints in orthotropic steel decks considering temperature effect and increasing traffic flow. Struct. Health Monit. 2008, 7, 189–202. [Google Scholar] [CrossRef]
- Teixeira de Freitas, S.; Kolstein, H.; Bijlaard, F. Structural monitoring of a strengthened orthotropic steel bridge deck using strain data. Struct. Health Monit. 2012, 11, 558–576. [Google Scholar] [CrossRef]
- Guo, T.; Liu, Z.X.; Zhu, J.S. Fatigue reliability assessment of orthotropic steel bridge decks based on probabilistic multi-scale finite element analysis. Adv. Steel Constr. 2015, 11, 334–346. [Google Scholar] [CrossRef]
- Liu, Y.; Xiao, X.; Lu, N.; Deng, Y. Fatigue reliability assessment of orthotropic bridge decks under stochastic truck loading. Shock Vib. 2016, 2016, 1–10. [Google Scholar] [CrossRef]
- Liu, Y.; Zhang, H.; Liu, Y.; Deng, Y.; Jiang, N.; Lu, N. Fatigue reliability assessment for orthotropic steel deck details under traffic flow and temperature loading. Eng. Fail. Anal. 2017, 71, 179–194. [Google Scholar] [CrossRef]
- Miner, M.A. Cumulative damage in fatigue. J. Appl. Mech. 1945, 12, 159–164. [Google Scholar]
- Deng, Y. Methodology and Application of Damage Alarming and Safety Assessment for Long-Span Bridge Structures Based on Long-Term Monitored Data. Ph.D. Thesis, Southeast University, Nanjing, China, 2011. [Google Scholar]
- Frangopol, D.M.; Strauss, A.; Kim, S. Bridge reliability assessment based on monitoring. J. Bridge Eng. ASCE 2008, 13, 258–270. [Google Scholar] [CrossRef]
- Liu, M.; Frangopol, D.M.; Kwon, K. Fatigue reliability assessment of retrofitted steel bridges integrating monitored data. Struct. Saf. 2010, 32, 77–89. [Google Scholar] [CrossRef]
- Wirsching, P.H. Fatigue reliability for offshore structures. J. Struct. Eng. ASCE 1984, 110, 2340–2356. [Google Scholar] [CrossRef]
- Zhao, Z.W.; Haldar, A.; Breen, F.L. Fatigue-reliability evaluation of steel bridges. J. Struct. Eng. ASCE 1994, 120, 1608–1623. [Google Scholar] [CrossRef]
- Kwon, K.; Frangopol, D.M. Bridge fatigue reliability assessment using probability density functions of equivalent stress range based on field monitoring data. Int. J. Fatigue 2010, 32, 1221–1232. [Google Scholar] [CrossRef]
- Guo, T.; Chen, Y.W. Field stress/displacement monitoring and fatigue reliability assessment of retrofitted steel bridge details. Eng. Fail. Anal. 2011, 18, 354–363. [Google Scholar] [CrossRef]
- Deng, Y.; Ding, Y.L.; Li, A.Q.; Zhou, G.D. Fatigue reliability assessment for bridge welded details using long-term monitoring data. Sci. China Technol. Sci. 2011, 54, 3371–3381. [Google Scholar] [CrossRef]
- Ni, Y.Q.; Ye, X.W.; Ko, J.M. Monitoring-based fatigue reliability assessment of steel bridges: Analytical model and application. J. Struct. Eng. ASCE 2010, 136, 1563–1573. [Google Scholar] [CrossRef]
- Xia, H.W.; Ni, Y.Q.; Wong, K.Y.; Ko, J.M. Reliability-based condition assessment of in-service bridges using mixture distribution models. Comput. Struct. 2012, 106–107, 204–213. [Google Scholar] [CrossRef]
- Titterington, D.M.; Smith, A.F.M.; Makov, H.E. Statistical Analysis of Finite Mixture Distributions; John Wiley & Sons: Chichester, UK, 1985. [Google Scholar]
- Dempster, A.P.; Laird, N.M.; Rubin, D.B. Maximum likelihood from incomplete data via the EM algorithm. J. R. Statist. Soc. B 1977, 39, 1–38. [Google Scholar]
- Akaike, H. A new look at the statistical model identification. IEEE Trans. Autom. Control 1974, 19, 716–723. [Google Scholar] [CrossRef]
- Schwarz, G. Estimating the dimension of a model. Ann. Stat. 1978, 6, 15–18. [Google Scholar] [CrossRef]
- Downing, S.D.; Socie, D.F. Simplified rainflow cycle counting algorithms. Int. J. Fatigue 1982, 4, 31–40. [Google Scholar] [CrossRef]
- International Organization for Standardization. ISO 2394: General Principles on Reliability for Structures; International Organization for Standardization: Geneva, Switzerland, 1996. [Google Scholar]
Figure 1.
Fatigue strength curves in Eurocode 3.
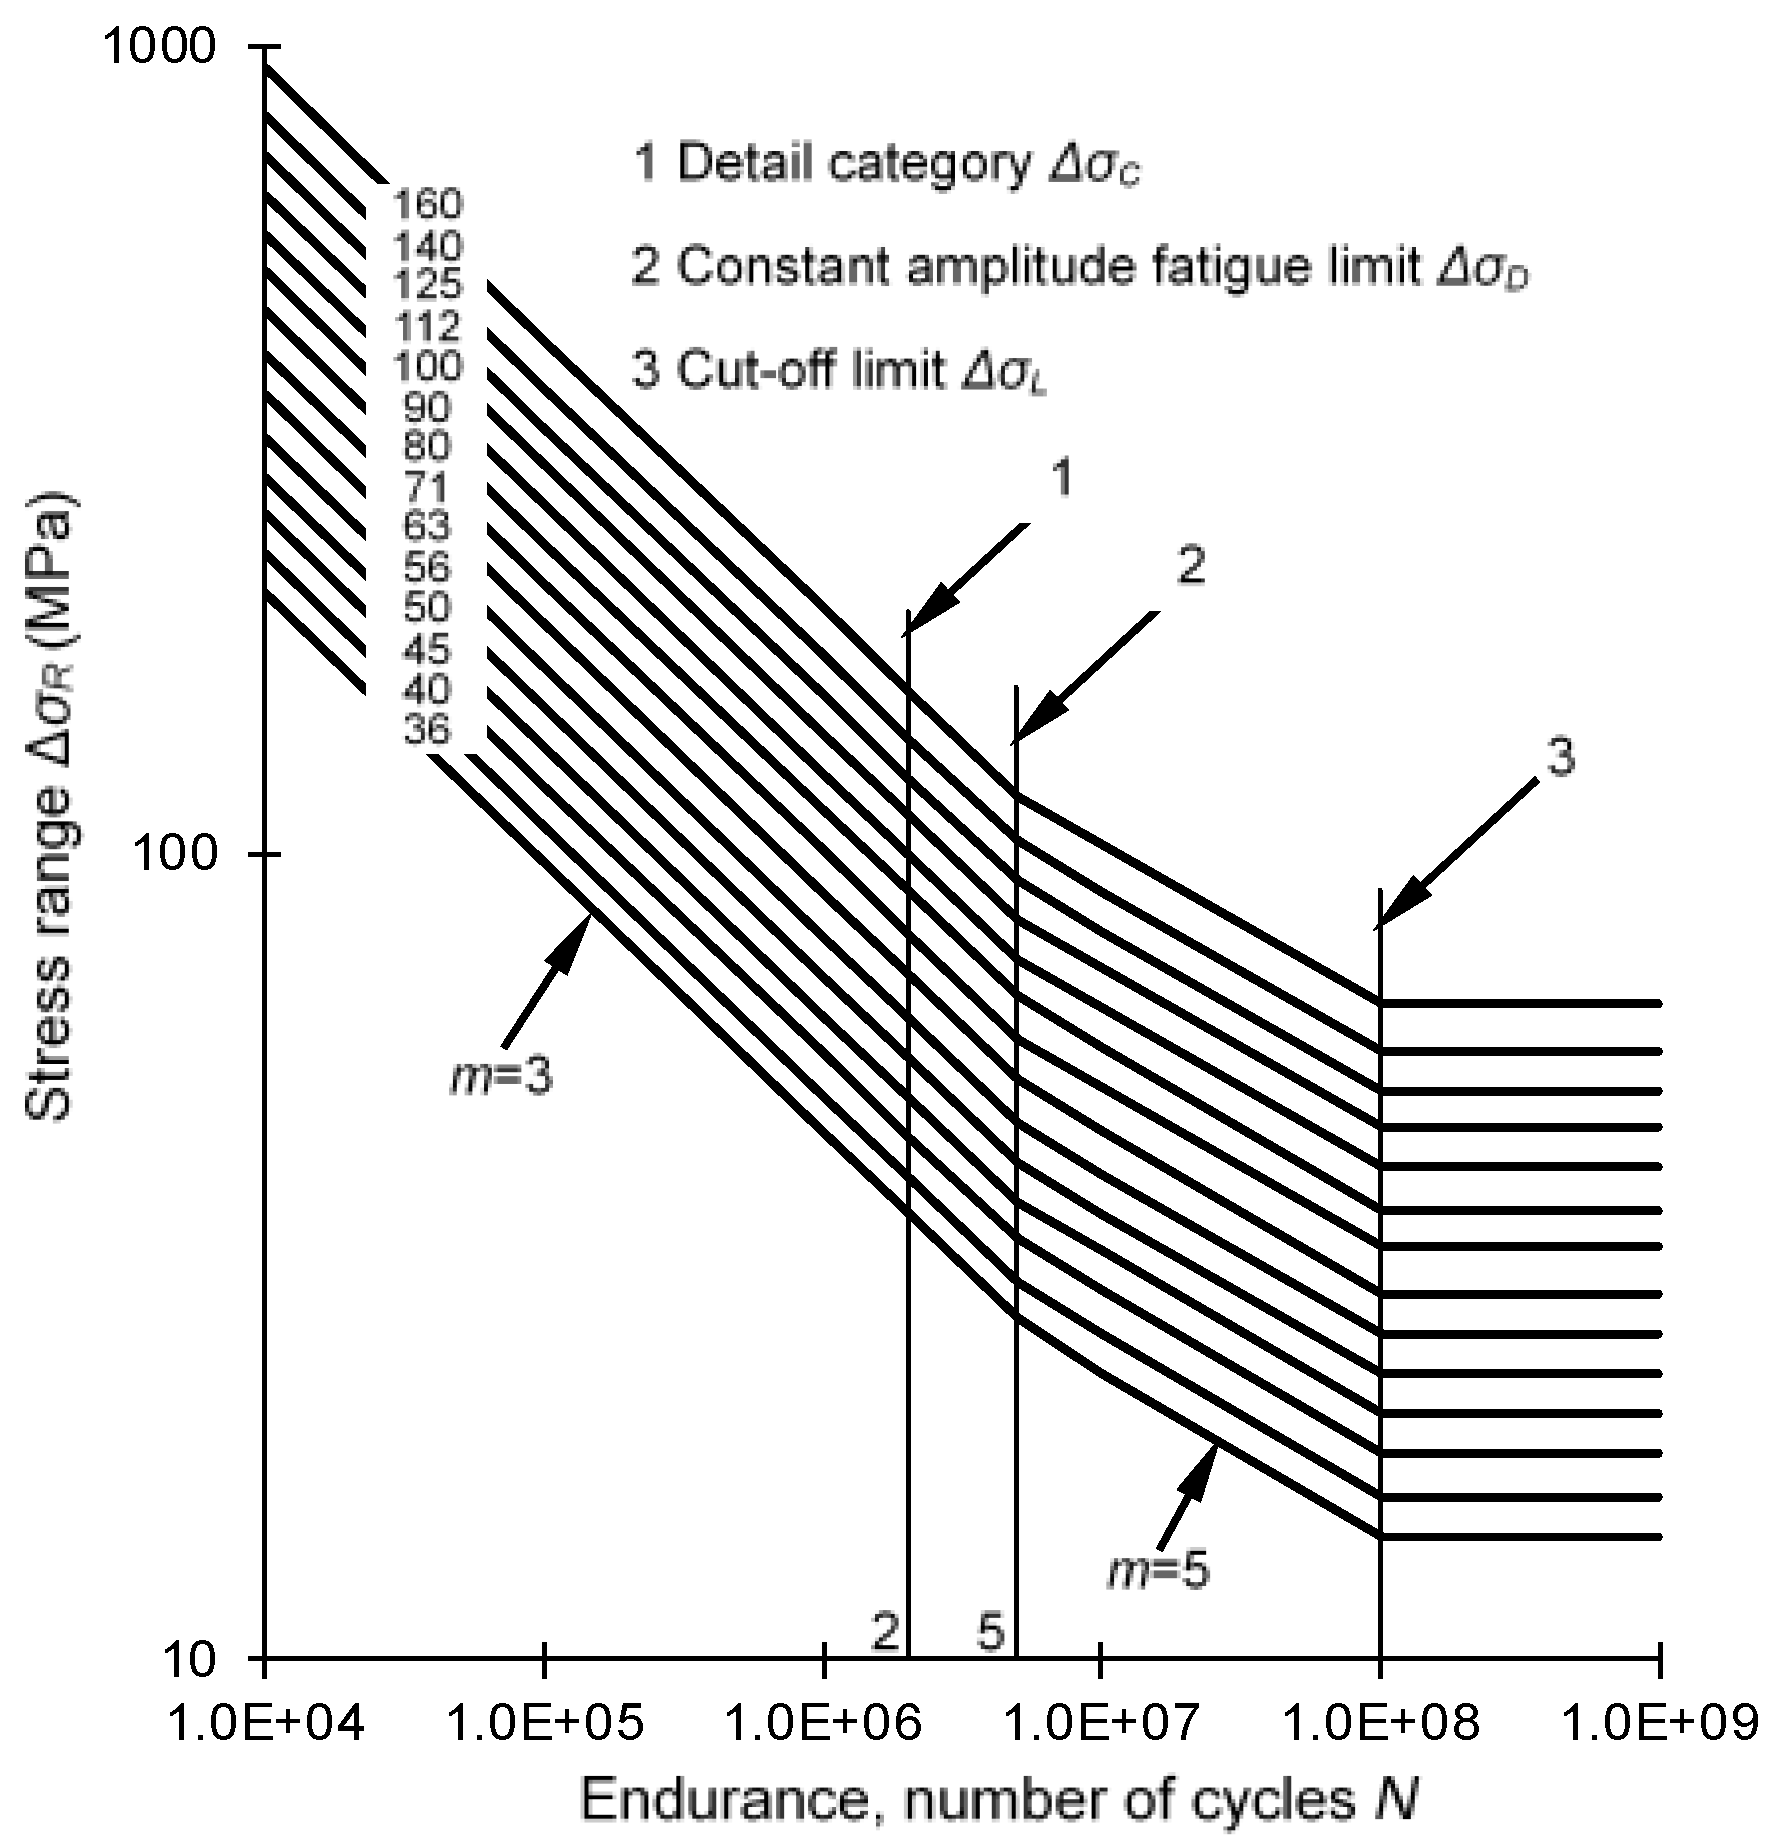
Figure 2.
Outline of fatigue reliability assessment based on long-term strain monitoring.

Figure 3.
Layout of strain sensors at the mid-span of the RSB: (a) Overview of the RSB Prototype suspension bridge; (b) Mid-span cross section; (c) Orthotropic deck configuration.
Figure 3.
Layout of strain sensors at the mid-span of the RSB: (a) Overview of the RSB Prototype suspension bridge; (b) Mid-span cross section; (c) Orthotropic deck configuration.

Figure 4.
Stress range histograms: (a) ZLNL4-13; (b) ZLNL4-14; (c) ZLNL4-15; (d) ZLNL4-16.


Figure 5.
Probability densities of Seq of the rib-to-deck details: (a) ZLNL4-13; (b) ZLNL4-15.

Figure 6.
Criterions for GMM component determination: (a) ZLNL4-14; (b) ZLNL4-16.
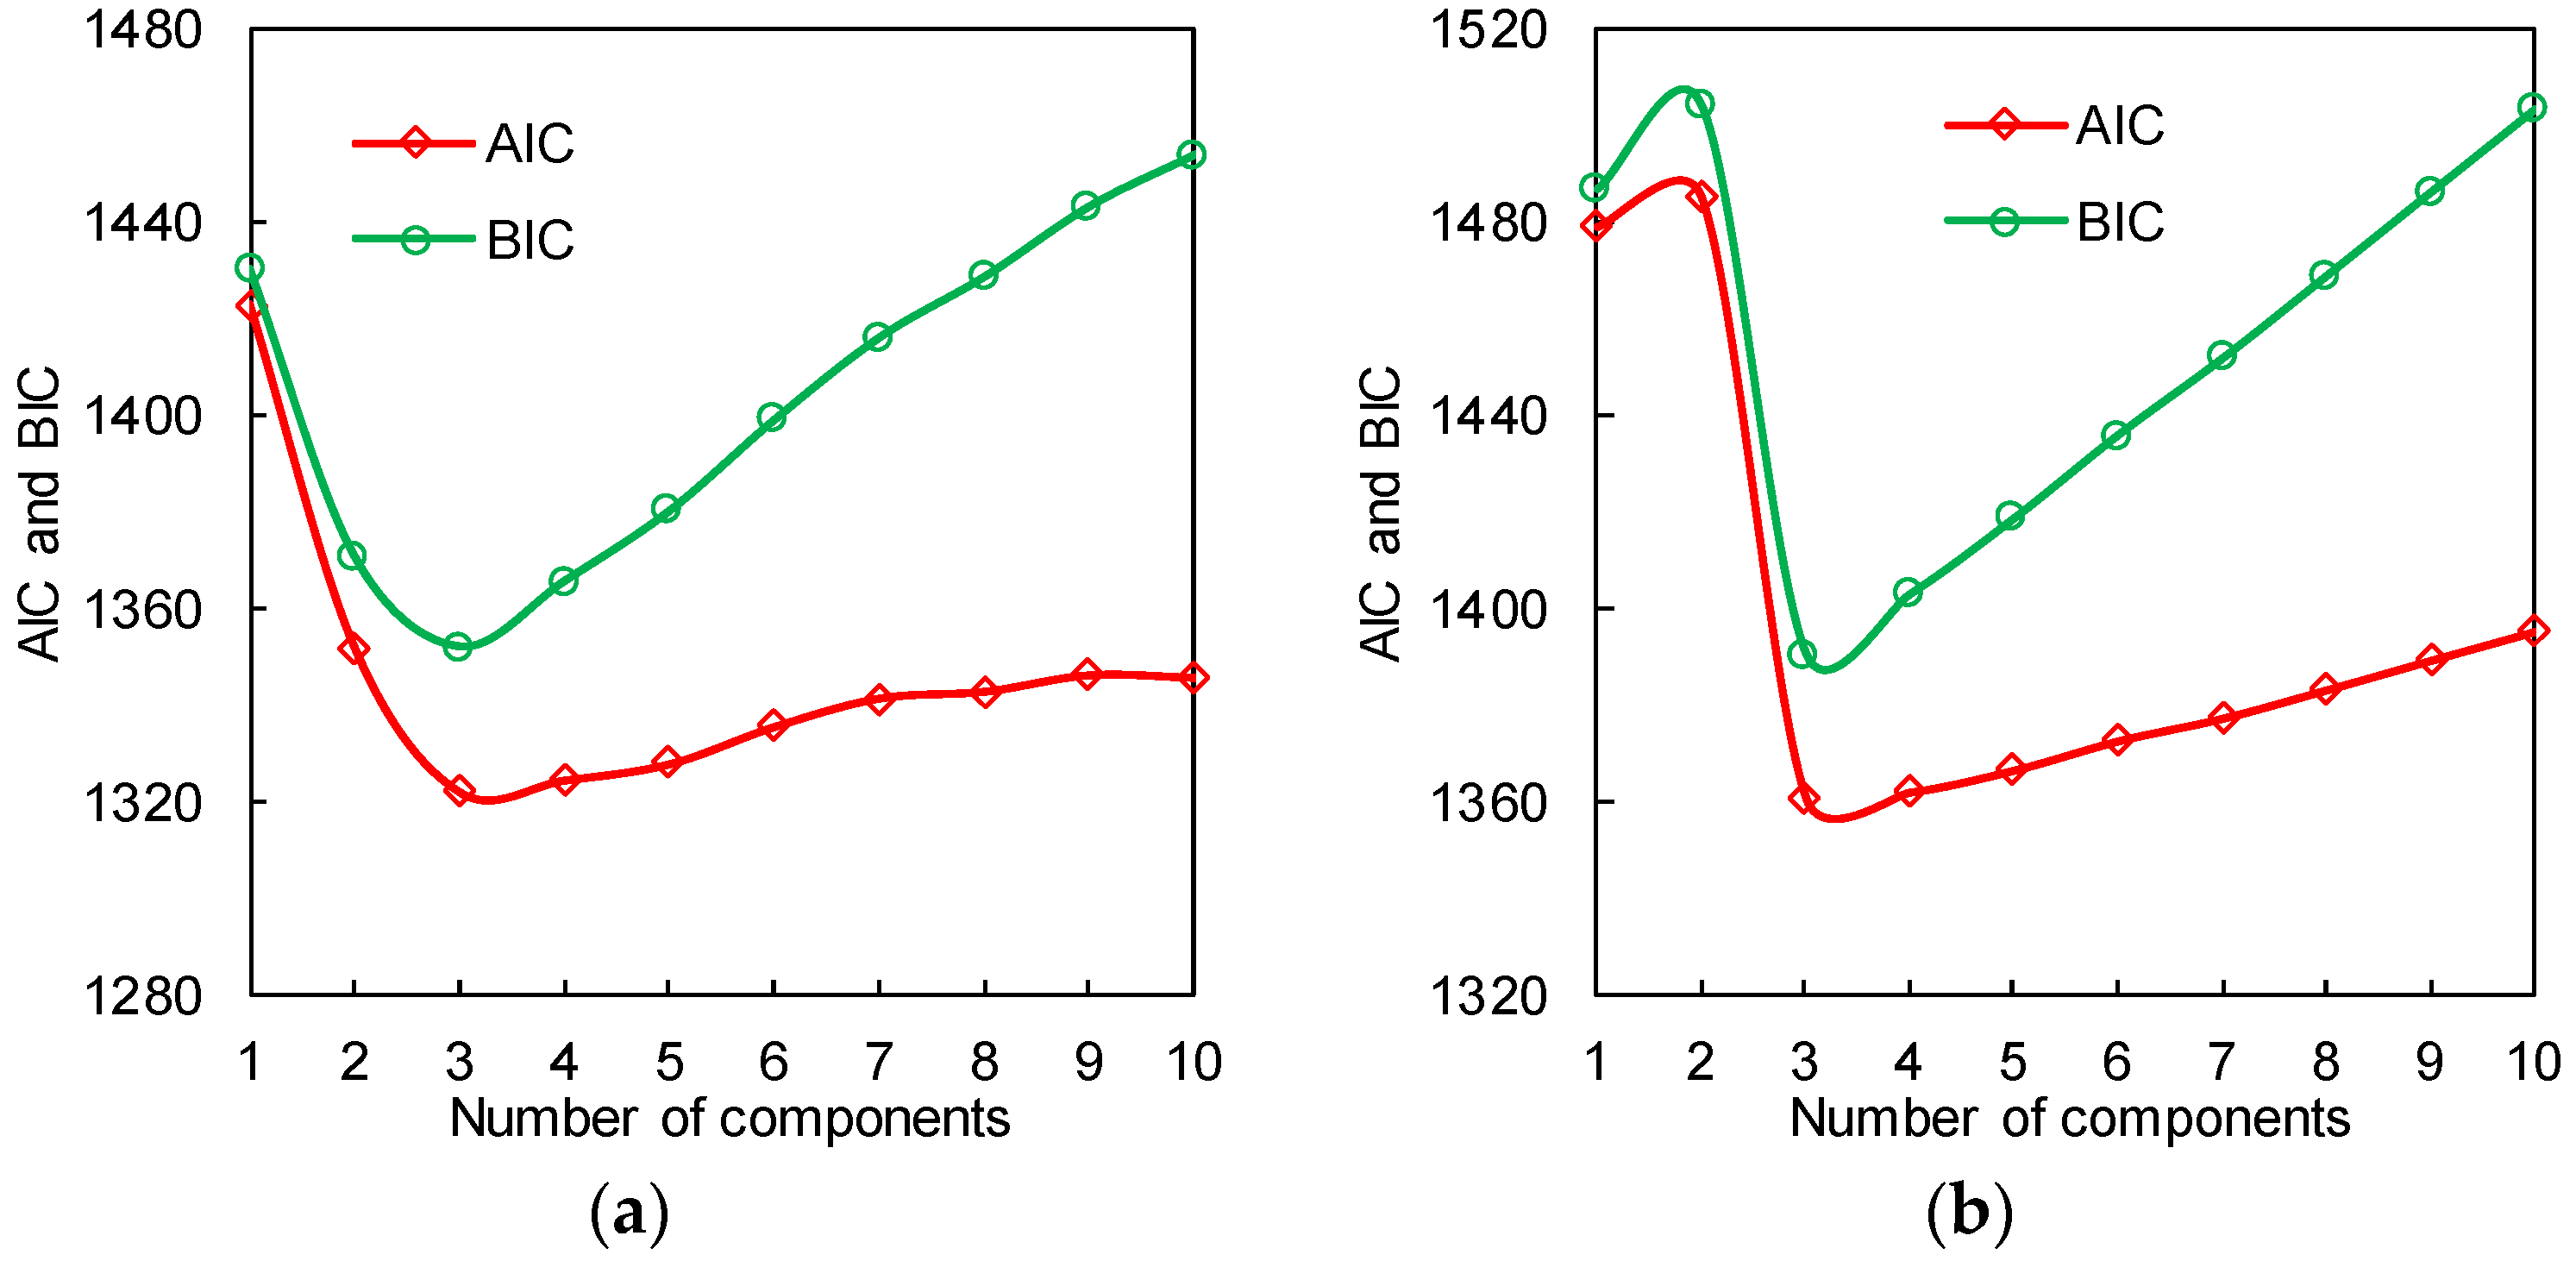
Figure 7.
Probability densities of Seq of the rib-to-rib details: (a) ZLNL4-14; (b) ZLNL4-16.

Figure 8.
Time-dependent fatigue reliability indices of the rib-to-deck welds.

Figure 9.
Time-dependent fatigue reliability indices of the rib-to-rib welds.

Table 1.
S–N curves of Eurocode 3.
| Description of Welds | Detail Category ΔσC (MPa) | CAFL ΔσD (MPa) | Cut-Off Limit ΔσL (MPa) | Fatigue Strength Coefficient KD |
|---|---|---|---|---|
| Rib-to-deck | 50 | 37 | 20 | 3.47 × 10¹⁴ |
| Rib-to-rib | 71 | 52 | 29 | 1.90 × 10¹⁵ |
Table 2.
Statistic information of parameters.
| Random Variable | Description | Distribution Type | Mean Value | COV | Source |
|---|---|---|---|---|---|
| KD | Rib-to-deck | Lognormal | 3.47 × 10¹⁴ | 0.45 | Zhao et al. [20], Eurocode 3 [7] |
| Rib-to-rib | Lognormal | 1.90 × 10¹⁵ | 0.45 | ||
| Δ | Critical damage | Lognormal | 1.0 | 0.3 | Wirsching [19] |
| e | Measurement error coefficient | Lognormal | 1.0 | 0.03 | Frangopol et al. [17,18] |
| Nc | Accumulated number of stress cycles | Deterministic | - | - | SHM data |
Δ and e are dimensionless. As defined in Equation (2), KD is related to the fatigue damage D, number of stress cycles n, and stress range S (unit: MPa). Therefore, the unit of KD is .
Table 3.
Cycles of stress ranges.
| Welded Details | Total Cycle Number | Cycle Number (Larger than ΔσL) | Cycle Number (Larger than ΔσD) |
|---|---|---|---|
| ZLNL4-13 | 1.319 × 10⁸ | 660.5 | 76.5 |
| ZLNL4-14 | 1.384 × 10⁸ | 143,039 | 2537.5 |
| ZLNL4-15 | 1.276 × 10⁸ | 17,620 | 826.5 |
| ZLNL4-16 | 1.379 × 10⁸ | 270,087 | 5468 |
Table 4.
GMM parameters for the equivalent stress range Seq.
| Component i | ZLNL4-14 | ZLNL4-16 | ||||
|---|---|---|---|---|---|---|
| wi | μi | σi2 | wi | μi | σi2 | |
| 1 | 0.306 | 39.0 | 0.54 | 0.262 | 32.8 | 0.23 |
| 2 | 0.236 | 33.3 | 0.37 | 0.346 | 35.4 | 1.48 |
| 3 | 0.458 | 36.1 | 3.23 | 0.392 | 39.0 | 1.15 |
© 2018 by the authors. Licensee MDPI, Basel, Switzerland. This article is an open access article distributed under the terms and conditions of the Creative Commons Attribution (CC BY) license (http://creativecommons.org/licenses/by/4.0/).
Share and Cite
MDPI and ACS Style
Deng, Y.; Li, A.; Feng, D. Fatigue Reliability Assessment for Orthotropic Steel Decks Based on Long-Term Strain Monitoring. Sensors 2018, 18, 181. https://doi.org/10.3390/s18010181
AMA Style
Deng Y, Li A, Feng D. Fatigue Reliability Assessment for Orthotropic Steel Decks Based on Long-Term Strain Monitoring. Sensors. 2018; 18(1):181. https://doi.org/10.3390/s18010181
Chicago/Turabian StyleDeng, Yang, Aiqun Li, and Dongming Feng. 2018. "Fatigue Reliability Assessment for Orthotropic Steel Decks Based on Long-Term Strain Monitoring" Sensors 18, no. 1: 181. https://doi.org/10.3390/s18010181
Note that from the first issue of 2016, this journal uses article numbers instead of page numbers. See further details here.