Article

Application of Near Infrared Reflectance Spectroscopy for Rapid and Non-Destructive Discrimination of Hulled Barley, Naked Barley, and Wheat Contaminated with Fusarium

1
Department of Agricultural Engineering, National Institute of Agricultural Sciences, Rural Development Administration, 310 Nongsaengmyeng-ro, Wansan-gu, Jeonju 54875, Korea
2
Microbial Safety Team, National Institute of Agricultural Sciences, Rural Development Administration, 166 Nongsaengmyeong-ro, Iseo-myeon, Wanju-gun 55365, Korea
3
Department of Bioindustrial Machinery Engineering, College of Agriculture & Life Sciences, Chonbuk National University, 567 Baekje-daero, deokjin-gu, Jeonju 54896, Korea
4
Environmental Microbial and Food Safety Laboratory, Agricultural Research Service, US Department of Agriculture, 10300 Baltimore Avenue, Beltsville 20705, MD, USA
*
Author to whom correspondence should be addressed.
Sensors 2018, 18(1), 113; https://doi.org/10.3390/s18010113
Submission received: 14 October 2017 / Revised: 27 December 2017 / Accepted: 28 December 2017 / Published: 2 January 2018
(This article belongs to the Special Issue Sensors in Agriculture)

Abstract

:
Fusarium is a common fungal disease in grains that reduces the yield of barley and wheat. In this study, a near infrared reflectance spectroscopic technique was used with a statistical prediction model to rapidly and non-destructively discriminate grain samples contaminated with Fusarium. Reflectance spectra were acquired from hulled barley, naked barley, and wheat samples contaminated with Fusarium using near infrared reflectance (NIR) spectroscopy with a wavelength range of 1175–2170 nm. After measurement, the samples were cultured in a medium to discriminate contaminated samples. A partial least square discrimination analysis (PLS-DA) prediction model was developed using the acquired reflectance spectra and the culture results. The correct classification rate (CCR) of Fusarium for the hulled barley, naked barley, and wheat samples developed using raw spectra was 98% or higher. The accuracy of discrimination prediction improved when second and third-order derivative pretreatments were applied. The grains contaminated with Fusarium could be rapidly discriminated using spectroscopy technology and a PLS-DA discrimination model, and the potential of the non-destructive discrimination method could be verified.

1. Introduction

Barley (Hordeum vulgare L.) is one of the four major grains, and is the next most important crop after rice in South Korea. It is now mainly used for mixed rice, barley tea for children, and various organic food materials [1]. Barley has many functional nutrients such as β-glucan, arabinoxylan, and hydrocyanic acid, which other general grains do not have, and has effects that aid in the prevention of adult diseases, such as heart disease (by lowering the blood cholesterols) and obesity (by inhibiting body fat accumulation) [2,3]. Barleys can be generally classified into hulled barley, which is not easily peeled and is used as a feed, and naked barley, which is easily peeled and can be used for food [4]. Recently, as consumers’ interest in health has increased, hulled barley has been actively developed into processed products such as barley tea, malt, and barley sprouts [5,6]. Wheat (Triticum aestivum L.) is second only to corn in world grain production, and is rich in nutrients such as saccharides, proteins, and vitamins. However, most of the wheats consumed in Korea depend on imports. The wheats produced domestically are used for producing bread, noodles, and pasta, and we are trying to increase the self-sufficiency of Korea’s wheat production [7,8].
Fusarium (particularly F. graminearum) occurs worldwide in Asia, Canada, Europe, and South America [9]. In Korea, Fusarium occurred on a large scale in the southern part of the country in 1963, and the production of barleys decreased by 40–80%, which became a big social issue [10]. Fusarium is one of the most destructive plant pathogens; it reduces crop yields through causing red rot fungus in barley and wheat, ear and stem-rotting disease in corn, and root-rotting disease in many other plants [11]. The grains contaminated with Fusarium turn into empty grains and decrease in weight, thus reducing yields and causing enormous economic losses [12]. In particular, the secondary metabolite mycotoxin, which is produced by such molds, is generated during the growing, storage, and distribution of contaminated agricultural products, since it is stable to heat and does not disappear, even when heated. Thus, when contaminated grains are ingested with normal grains by people and livestock, mycotoxins can accumulate in the body and cause serious acute and chronic disorders. Above all, mycotoxin is classified as a carcinogen in nature [13].
Quantification methods using high performance liquid chromatography are often used for the inspection of grain contamination by Fusarium and mycotoxin in research and official analysis methods. For the contamination of Fusarium, the main method involves cultivating the spores that appear as fungi growth and checking them with the naked eye. For the discrimination of mycotoxin, liquid chromatography [14], gas chromatography (GC) [15,16], GC with mass spectrometry [17], and enzyme-linked immunosorbent assay (ELISA) [18,19] are used. These culture and chemical analysis methods are highly sensitive and accurate. However, they require the destruction of the samples, experts who can handle expensive analysis equipment, and are limited in rapid discrimination because it takes a long time [20]. Meanwhile, near infrared reflectance spectroscopy is being used as a technique for quickly and non-destructively discriminate grains contaminated with Fusarium.
Near infrared reflectance spectroscopy (NIRS) is an analytical method that uses a 700–2500 nm wavelength band based on the absorption of near infrared rays by organic compounds and water. More than 60 years have passed since the first practical application of this technique. Karl Norris, the pioneer of NIRS, first attempted this technique in the 1960s to measure the water content of grains and seeds [21].
Since then, instrumentation, statistical methods, and software have improved, and application techniques have increased exponentially in many different fields. Now, the American Association of Cereal Chemists (AACC 39-00) and the American Oil Chemist Association (AOCS am 1–9) have approved NIRS as an analysis method for grains and seeds. The NIR techniques have several important advantages, such as short analysis time, minimal sampling process, and non-destructiveness with a performance comparable to chemistry analytical methods. There are many calibration algorithms for spectra acquired from NIRS, which share the same principles with and are similar to the methods that are widely used in quantitative analysis, such as multiple linear regression (MLR), principal component regression (PCR), and partial least squares (PLS) [22].
PLS and PCR show very similar results, and MLR is more advantageous when handling areas with short wavelengths or data points that have little correlations. In particular, PLS is used as a statistical modeling tool for obtaining correlations between multivariate input variables (independent variables) and output variables (dependent variables) using data acquired from experiments [23]. It is actively used to develop linear multivariate model in diverse industrial fields, including chemical process [24,25,26]. This method offers the advantage of a model with a higher prediction reliability than general multiple regression analysis, even if there is multicollinearity or a lot of noise in the data, because the input variables have high correlations with one another. The partial least square discrimination analysis (PLS-DA) is a supervised classification method used in NIRS, because it allows near infrared reflectance (NIR) variables (wavelengths) with high correlations.
This study was conducted to develop a technology to discriminate hulled barley, naked barley, and wheat contaminated with Fusarium using a near infrared spectroscopy measurement system. For this purpose, a PLS-DA model was developed by applying various mathematical pretreatments to a reflectance spectrum acquired from a spectrometer with a wavelength range of 1175–2170 nm, and its prediction performance was verified through correct classification rate (CCR).

2. Materials and Methods

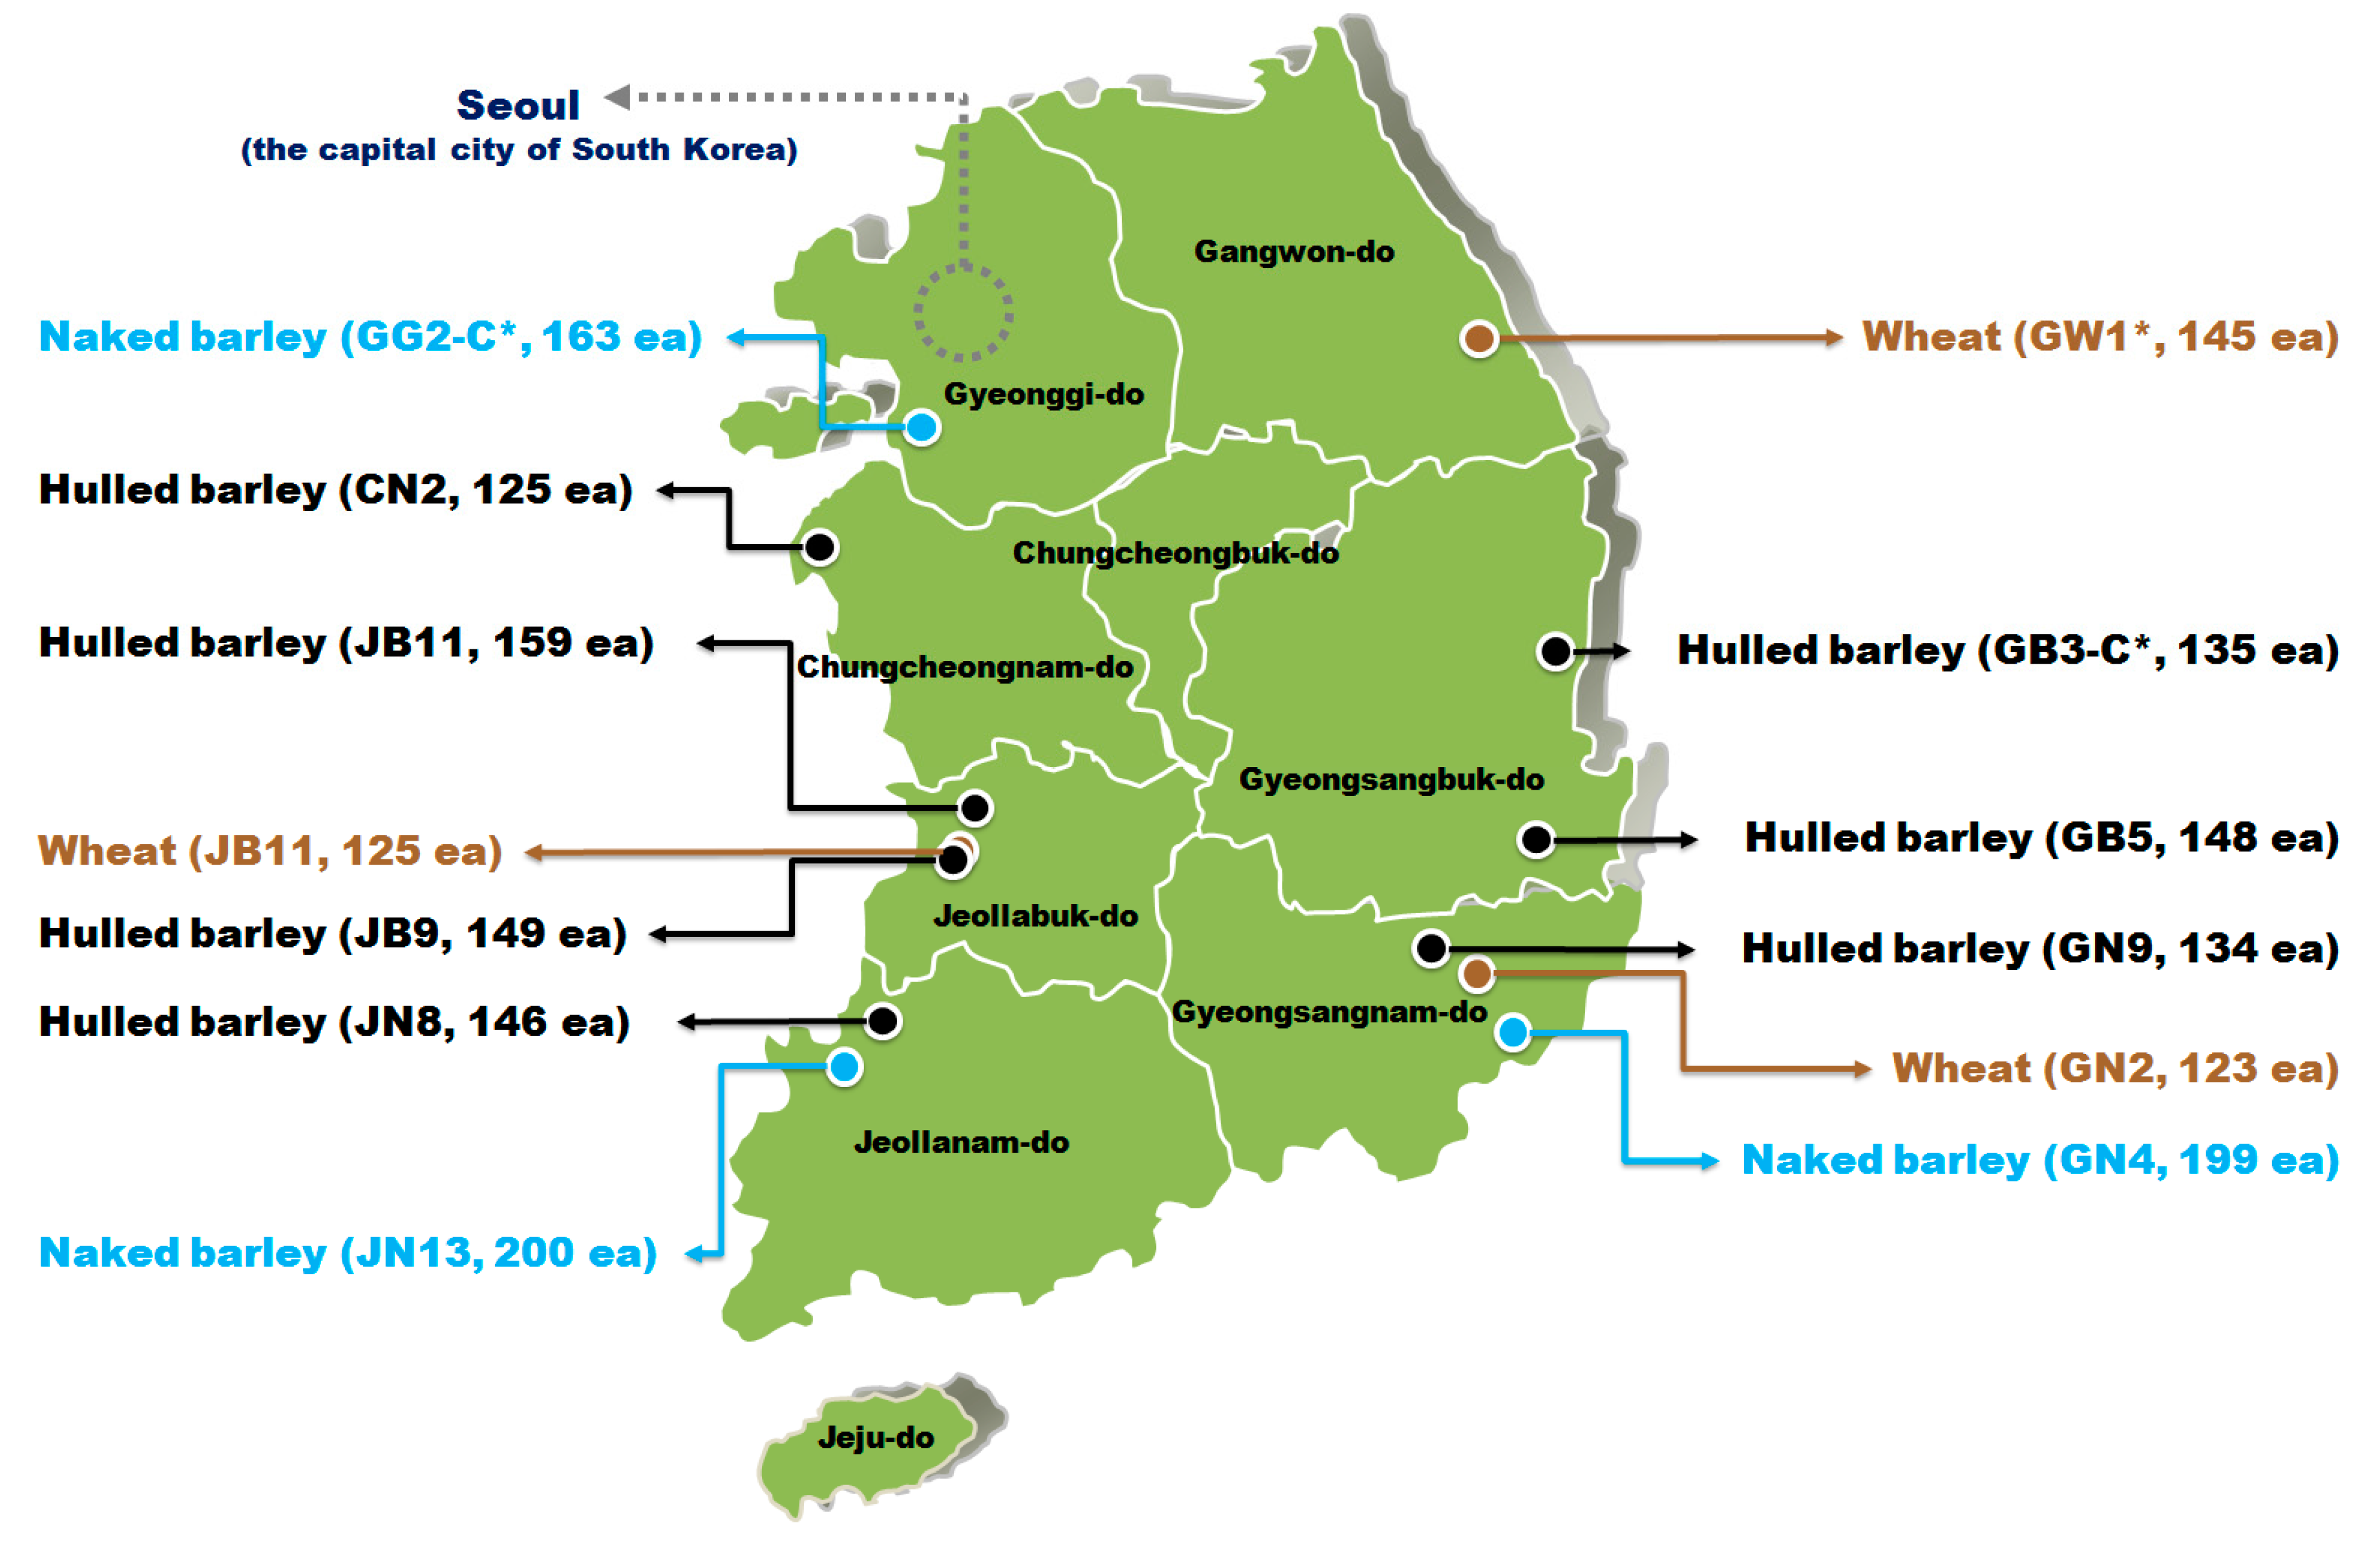
2.1. Hulled Barley, Naked Barley, and Wheat Samples

The hulled barley, naked barley, and wheat samples in this study used grains harvested from various regions in 2015, as shown in Figure 1. Hulled barley samples were collected from seven locations, including three locations in Gyeongsangbuk-do, one location in Gyeongsangnam-do, two locations in Jeollabuk-do, one location in Jeollanam-do, and two locations in Chungcheongnam-do. Naked barley samples were collected from one location each in Gyeonggi-do, Jeollanam-do, and Gyeongsangnam-do. Wheat samples were collected from one location each in Gangwon-do, Jeollabuk-do, and Gyeongsangnam-do. Each sample was kept separately in an individual container at a low temperature of 4 °C to prevent the multiplication of Fusarium. The hulled barley, naked barley, and wheat samples in which no Fusarium was found in the first culture experiment were used as the control group.
As shown in Table 1, the hulled barley samples of the GB3-C group from the Gyeongsangbuk-do region were used as the control group, because no samples contaminated with Fusarium were found in the first culture result. The hulled barley samples collected from the other six locations were used as the experimental group. For the naked barley samples, the GG2-C group from the Gyeonggi-do region were used as the control group, and the samples collected from the other two locations were used as the experimental group. For wheat samples, the GW1-C group from the Gangwon-do region were used as the control group, because no wheat contaminated with Fusarium was found, and the samples collected from the other two locations were used as the experimental group. The hulled barley, naked barley, and wheat samples used in this experiment were assigned individual sample numbers. As shown in Table 1, the grain samples were placed separately in a tray with 10 × 10 indented cells in the shape of grains.

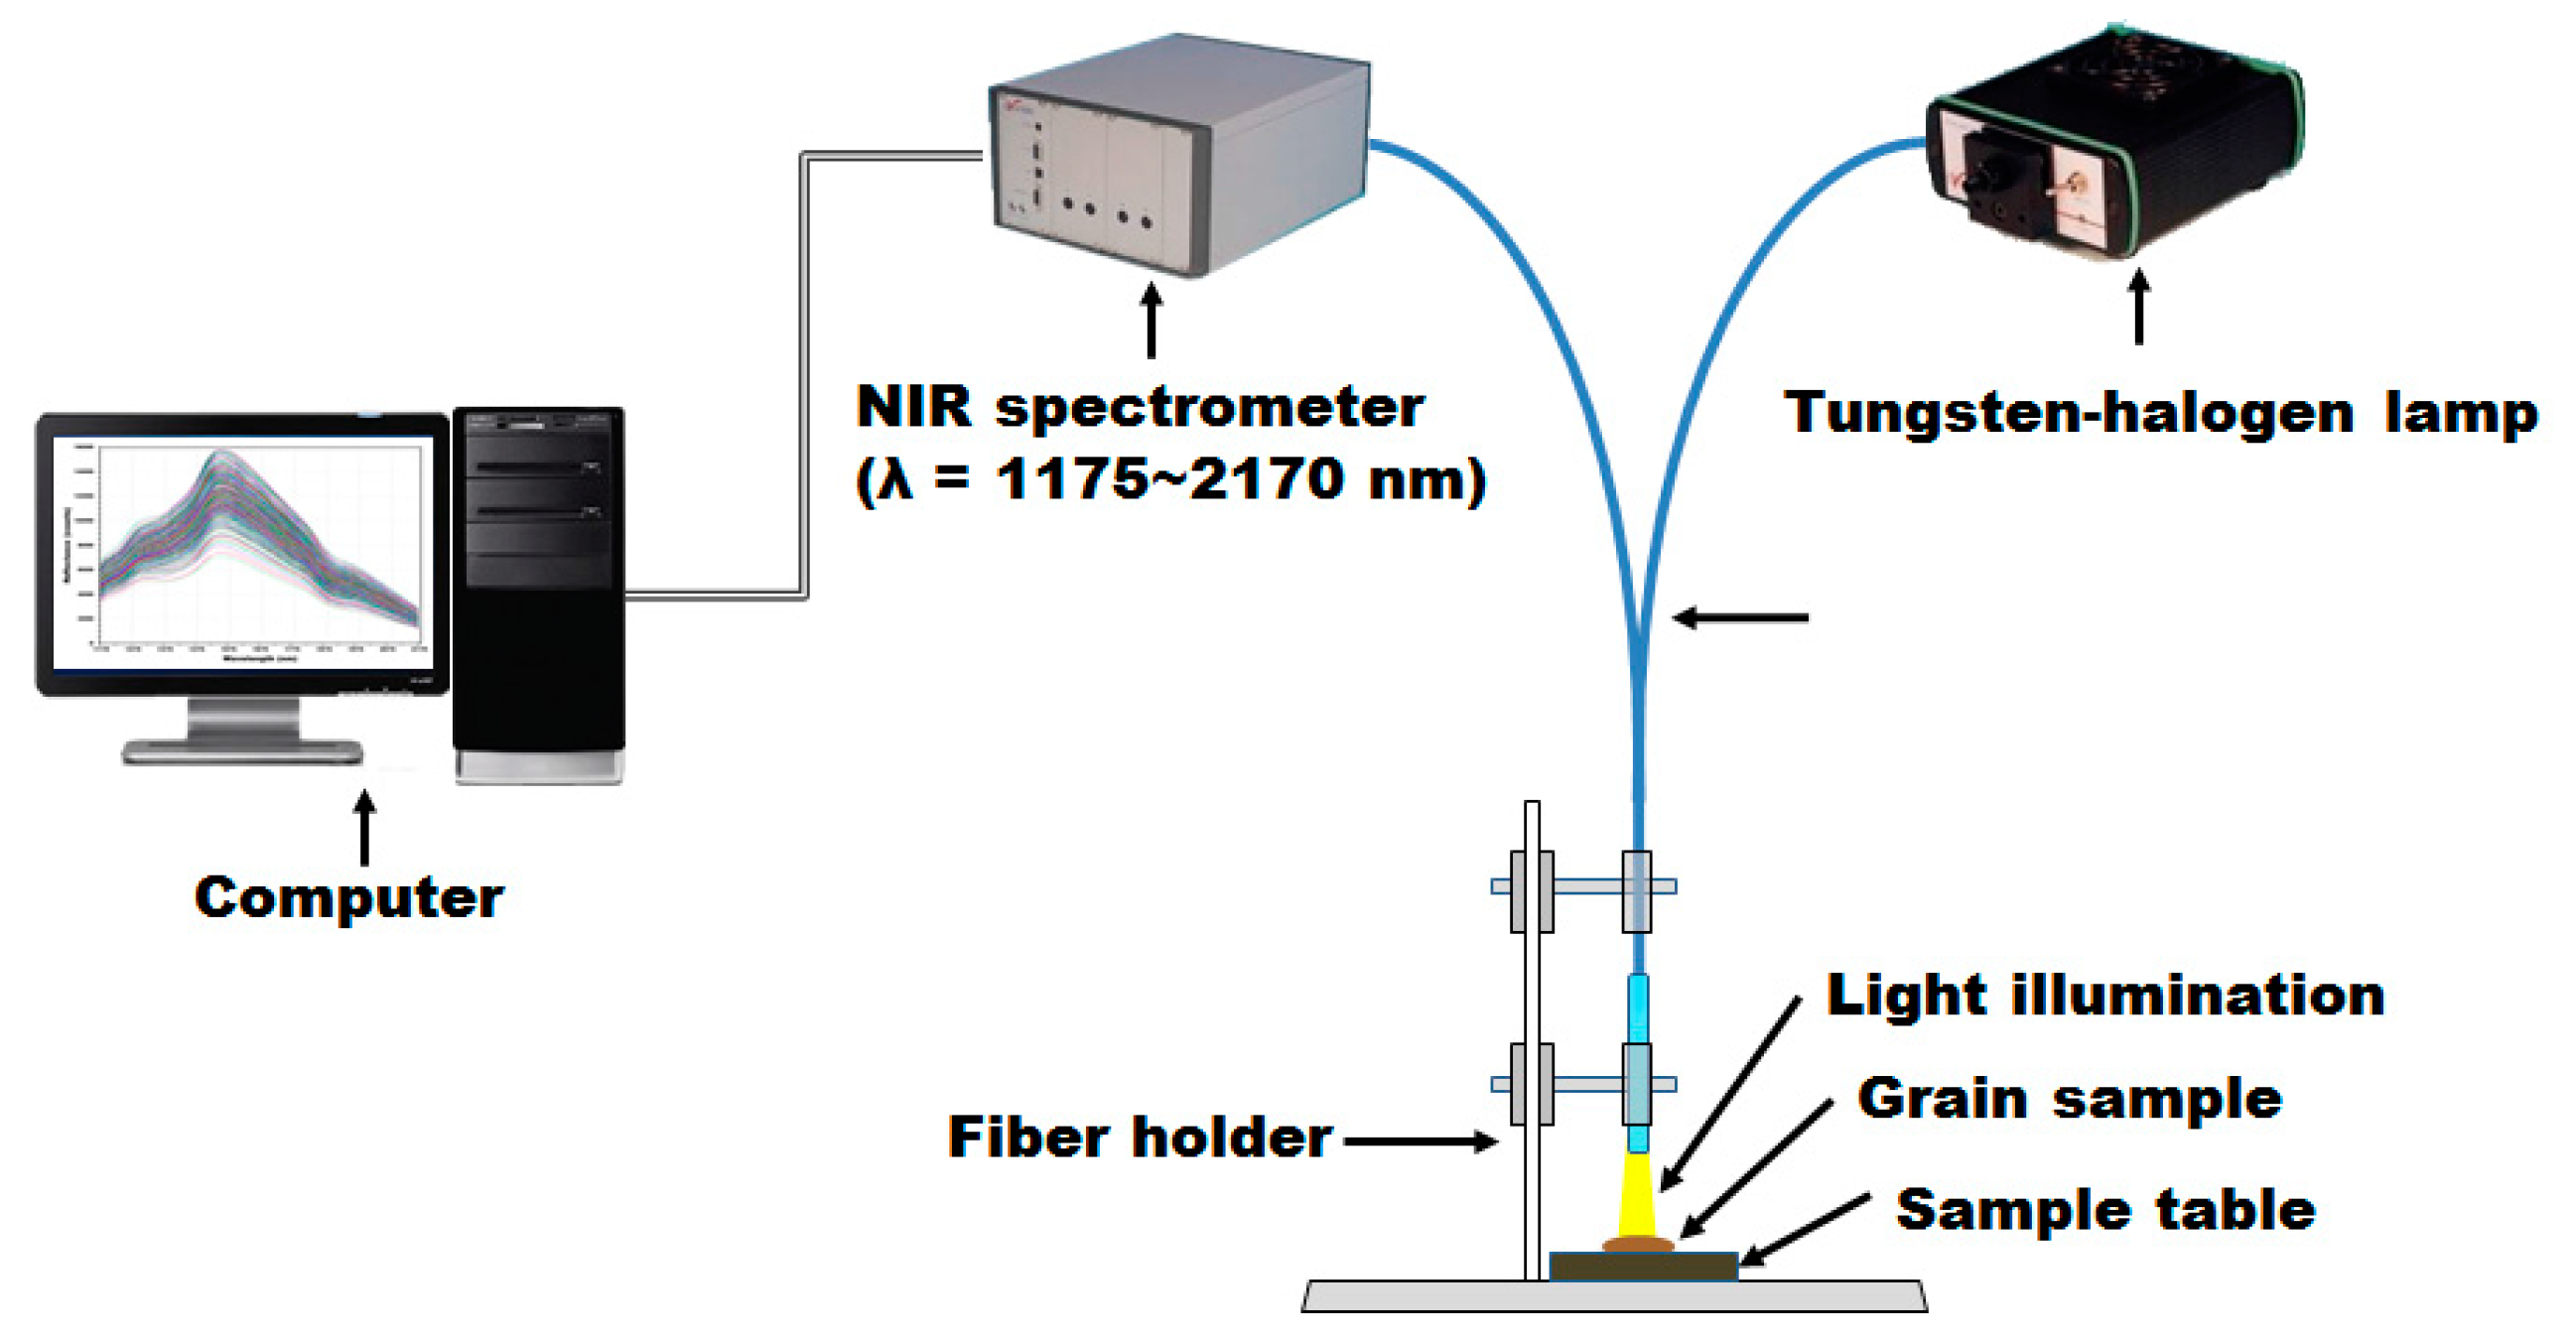
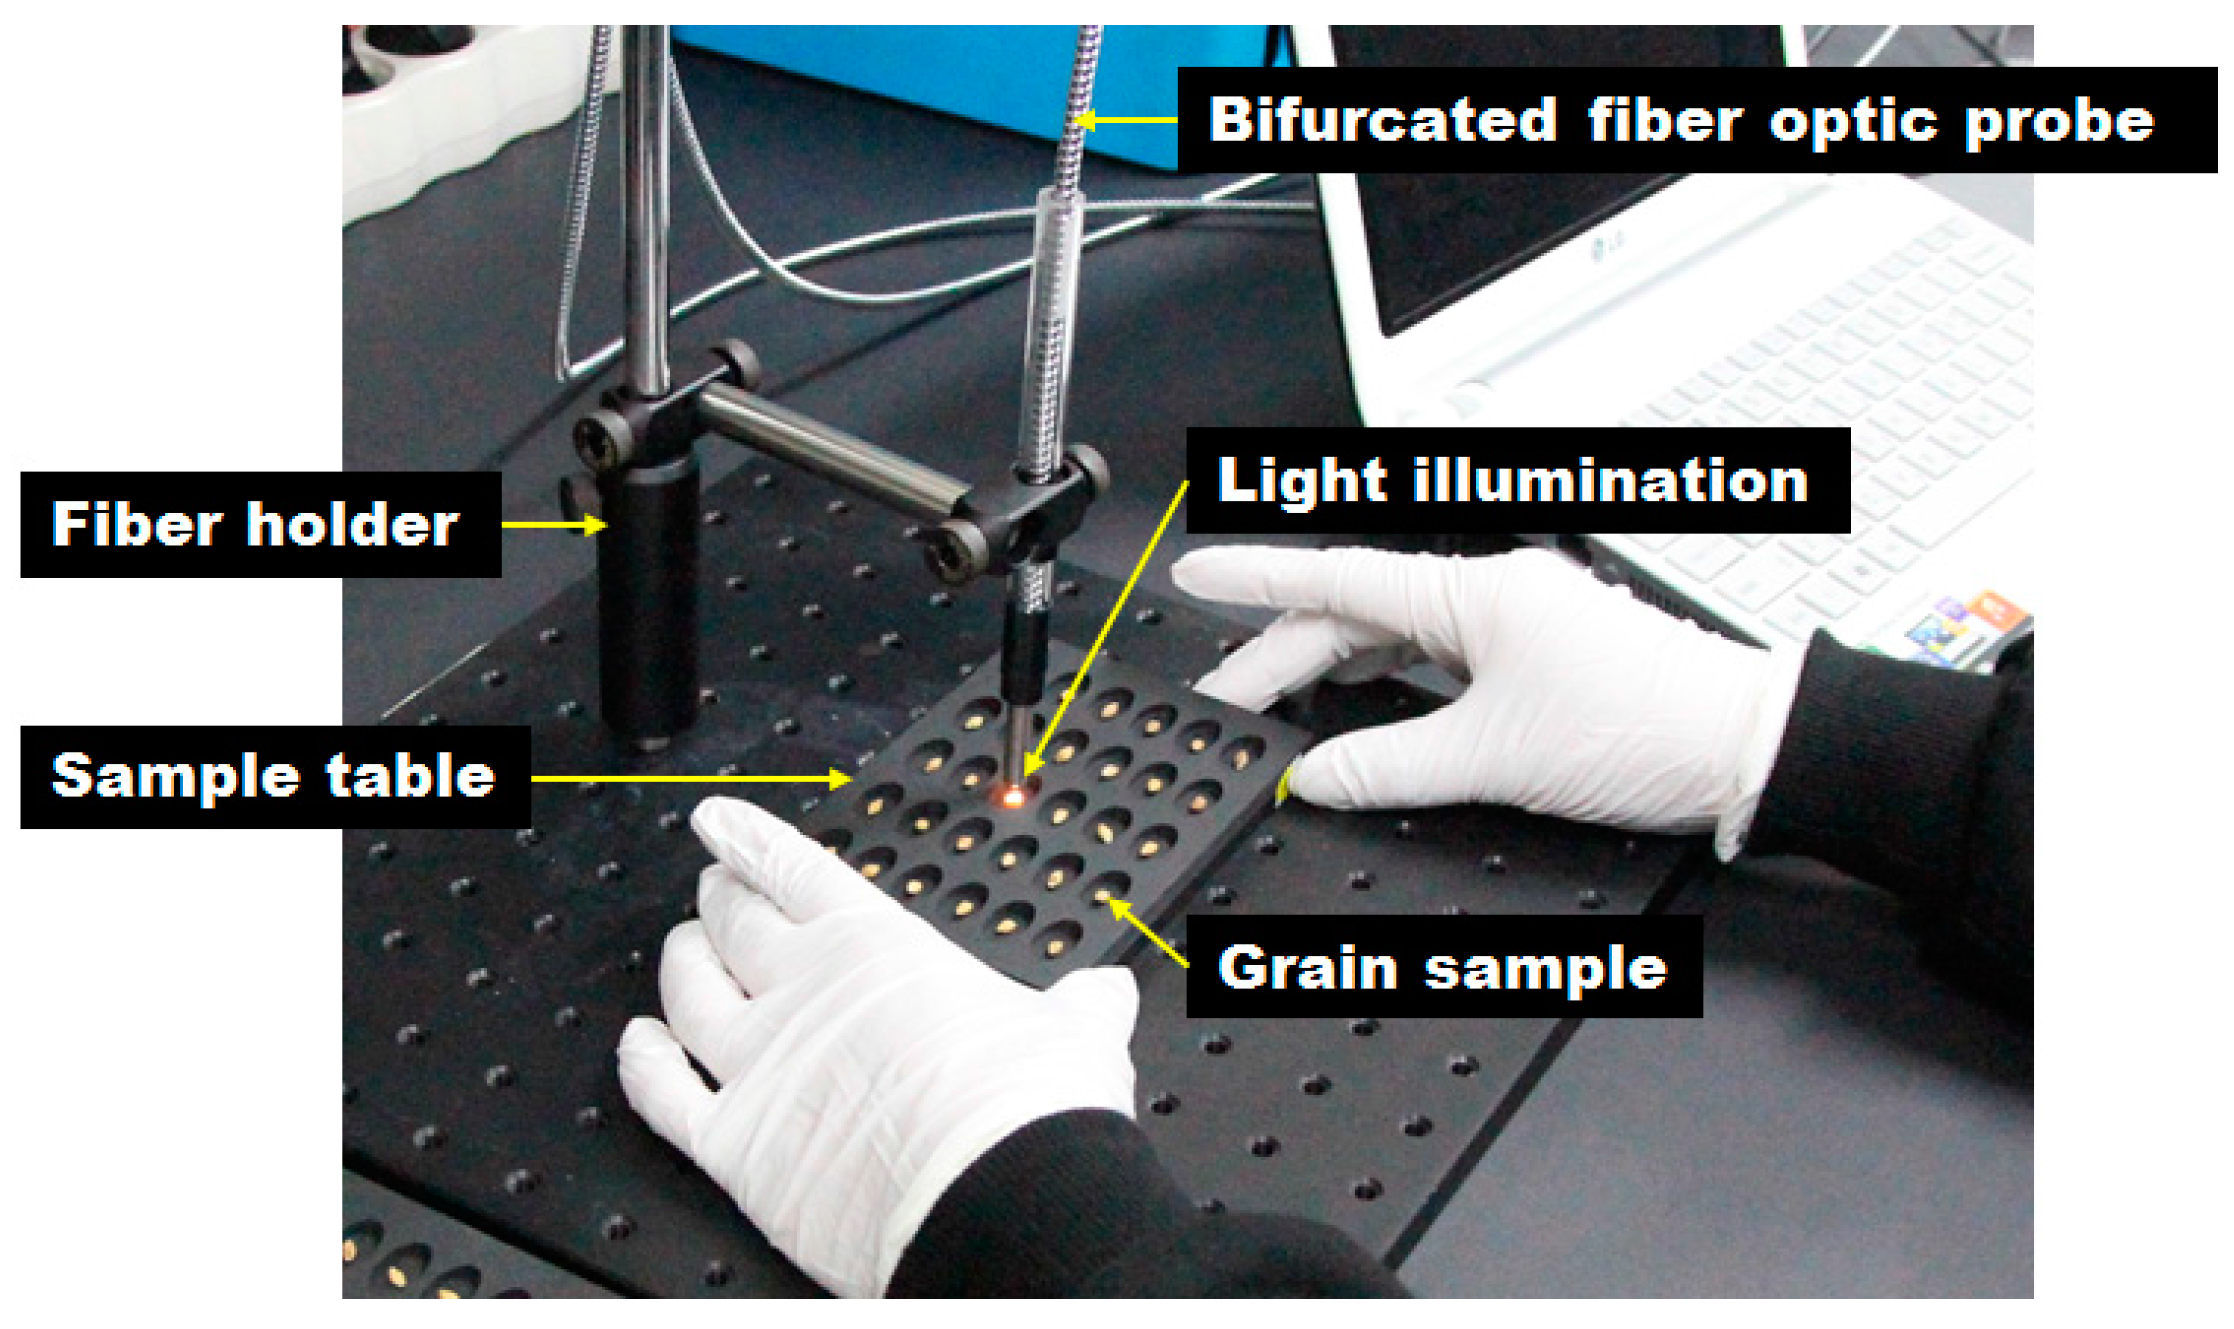
2.2. NIRS Measurement System

As shown in Figure 2, the NIRS measurement system is comprised of a NIR spectroscopic sensor, a tungsten-halogen lamp, a fiber optic probe, a sample table, a fiber holder, and a measurement computer.
The NIR spectroscopic sensor (Avaspec-NIR256-2.2TC, Avantes BV Inc., Apeldoorn, The Netherlands) has a wavelength range of 1175–2170 nm, a pixel pitch of 3.4 nm, 256 pixels in total with a pixel size of 50 × 500 μm, and an indium gallium arsenide (InGaAs) linear array sensor. For the tungsten-halogen lamp used to supply light in the NIR wavelength range, a light source with 10 W power (Avalight-HAL, Avantes BV Inc., Apeldoorn, The Netherlands) and a wavelength range of 360–2500 nm was used. The bifurcated fiber-optic probe (FCR-7IR400-2-ME, Avantes BV Inc., Apeldoorn, The Netherlands), which transmits light from the light source and receives the light reflected from the grain sample with the NIR spectrometer, consists of seven optic fibers with a diameter of 400 μm. Furthermore, the AVA soft program (Avasoft-basic, Avantes BV Inc., Apeldoorn, The Netherlands) was used to acquire and store the reflectance spectrum data from the grain samples.

2.3. NIR Reflectance Spectrum Acquisition

To acquire the NIR reflectance spectra of hulled barley, naked barley, and wheat, the grains were moved to the dedicated template for measurement, as shown in Figure 3. A total of six measurements were made for each grain sample to acquire six NIR reflectance spectra. The distance between the grain sample and the end of the fiber-optic probe was maintained at 10–15 mm, and the light from the light source was irradiated to the surface of the grain samples as much as possible. A total of 5976 reflectance spectra were acquired from 996 hulled barley samples, a total of 3372 reflectance spectra were acquired from 562 naked barley samples, and a total of 2358 spectra were acquired from 393 wheat samples. The measurement condition was 200 ms of light integration time, and the cumulative average was obtained from three measurements. In addition, smoothing pretreatment was applied by default for the acquisition of reflectance spectrum.

2.4. Culturing Fusarium

After hulled barley, naked barley, and wheat were measured for the acquisition of the NIR reflectance spectrum, a culture experiment was performed to determine Fusarium contamination for each grain of the samples. First, the medium was prepared to promote the cultivation of Fusarium latent in the grains. For the medium, 23.4 g and 5.04 g of DifcoTM potato dextrose agar and BactoTM agar, respectively, in powder state were weighed and mixed. Then, 900 mL of distilled water was added to two types of mixed medium powders, and 225 mL each of the mixture was poured into each of four bottles. The four medium solutions in the bottles were sufficiently stirred with hotplate with magnetic stirrers (MSH-30A, DAIHAN Scientific Co., Ltd., Wonju, Korea) until they were fully dissolved. The prepared medium solutions were sterilized for 15 minutes at 120 °C with a high-pressure sterilizer (AC-1 60 L, Universal Scientific Co., Ltd., Gimpo, Korea) and left on a clean bench for about one hour to cool down to 40 °C. Two types of antibiotics were injected to the medium solutions to prevent the growth of germs other than Fusarium. For the first antibiotic, 0.5 g Neomycin was melted in 50 mL distilled water and filtered through a 0.2 μm filter; then, 10.8 mL of the filtered antibiotic was injected into the medium solution. For the second antibiotic, 2.5 g Streptomycin was melted in 50 mL distilled water and filtered through a 0.2 μm filter; then, 18 mL filtered antibiotic was injected to the 900 mL medium solution. The injected two antibiotics were sufficiently mixed by stirring for 30 s using the hotplate with magnetic stirrers. Half of the medium solution with antibiotics added was poured into a 125 × 125 mm square dish (SP11125, SPL Life Sciences Co., Ltd., Pocheon, Korea), which could hold 36 grains and had been gas-sterilized. The dish was left for 2–3 h to harden the medium. Then, 36 grains were placed on the medium in each prepared square dish using sterilized tweezers. The used tweezers were sterilized with an alcohol lamp and cooled off before using again. The square dish with 36 grains was covered and sealed with tape so that no germs would enter it. The sealed square dishes were cultured for 2–4 days in an incubator at 25 °C, and the final Fusarium spores were verified by visual inspection.

2.5. Development of Fusarium Discrimination Prediction Model

The prediction model used to discriminate the grains contaminated with Fusarium was PLS-DA. For the developed model, the CCRs (%) for normal and contaminated samples were calculated, respectively. Unlike the partial least square regression model—in which a linear regression model is developed with dependent variables—and spectra data—which is an independent variable—PLS-DA, through using the actually measured concentration data [27,28], develops a regression model by specifying the groups to be discriminated as dummy variables instead of using the concentration values as the dependent variable [29]. The independent variables used to develop the PLS-DA model were the NIR reflectance spectra acquired from the hulled barley, naked barley, and wheat samples. For the dependent variables, the spectra acquired from the normal hulled barley, naked barley, and wheat samples that were not contaminated with Fusarium was specified as ‘0’ as a random virtual variable, and the spectra acquired from the contaminated grain samples was specified as ‘1’.
For the raw spectrum data, spectra pretreatment was applied by various mathematical methods to correct light scattering by irregular surface appearance and develop a good discrimination prediction model [30]. To correct the movement of the spectra baseline due to surrounding environmental conditions such as the changed lighting and temperature when measuring spectra, first derivative, second derivative, and third derivative pretreatments were applied. To remove the light scattering effect during spectrum measurement, mean scattering correction (MSC) and standard normal variate (SNV) were used. Cross-validation statistics were applied to estimate the predictive ability of the PLS-DA calibration models developed during this research. The accuracy of the developed models was determined by its coefficient of determination for calibration (RC2), the standard errors of calibration (SEC), the coefficient of determination for validation (RV2), the standard error of prediction (SEP), and the principal component (PC). Furthermore, the baseline method was applied to correct the minimum values of spectra identically. A multivariate data analysis software application (Unscrambler v9.2, Camo Co., Oslo, Norway) was used for the pretreatment of the acquired reflectance spectra, the development of the PLS-DA model with the converted spectra, and the correction and validation of the developed model.

3. Results and Discussion

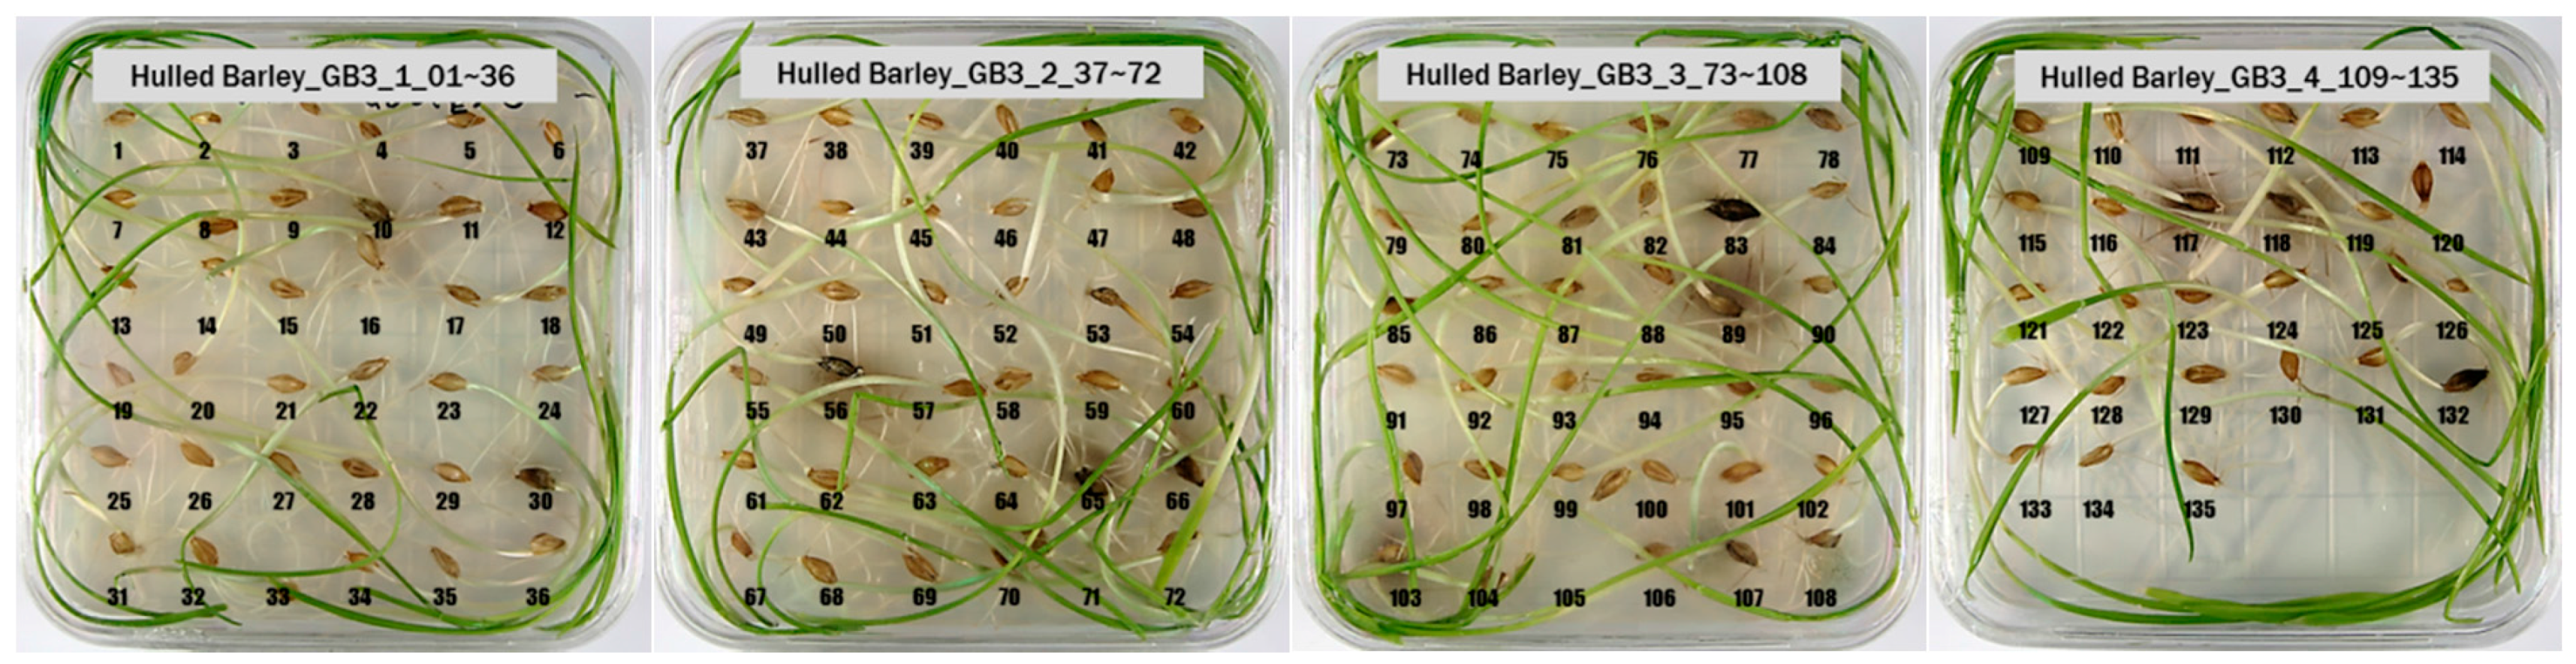
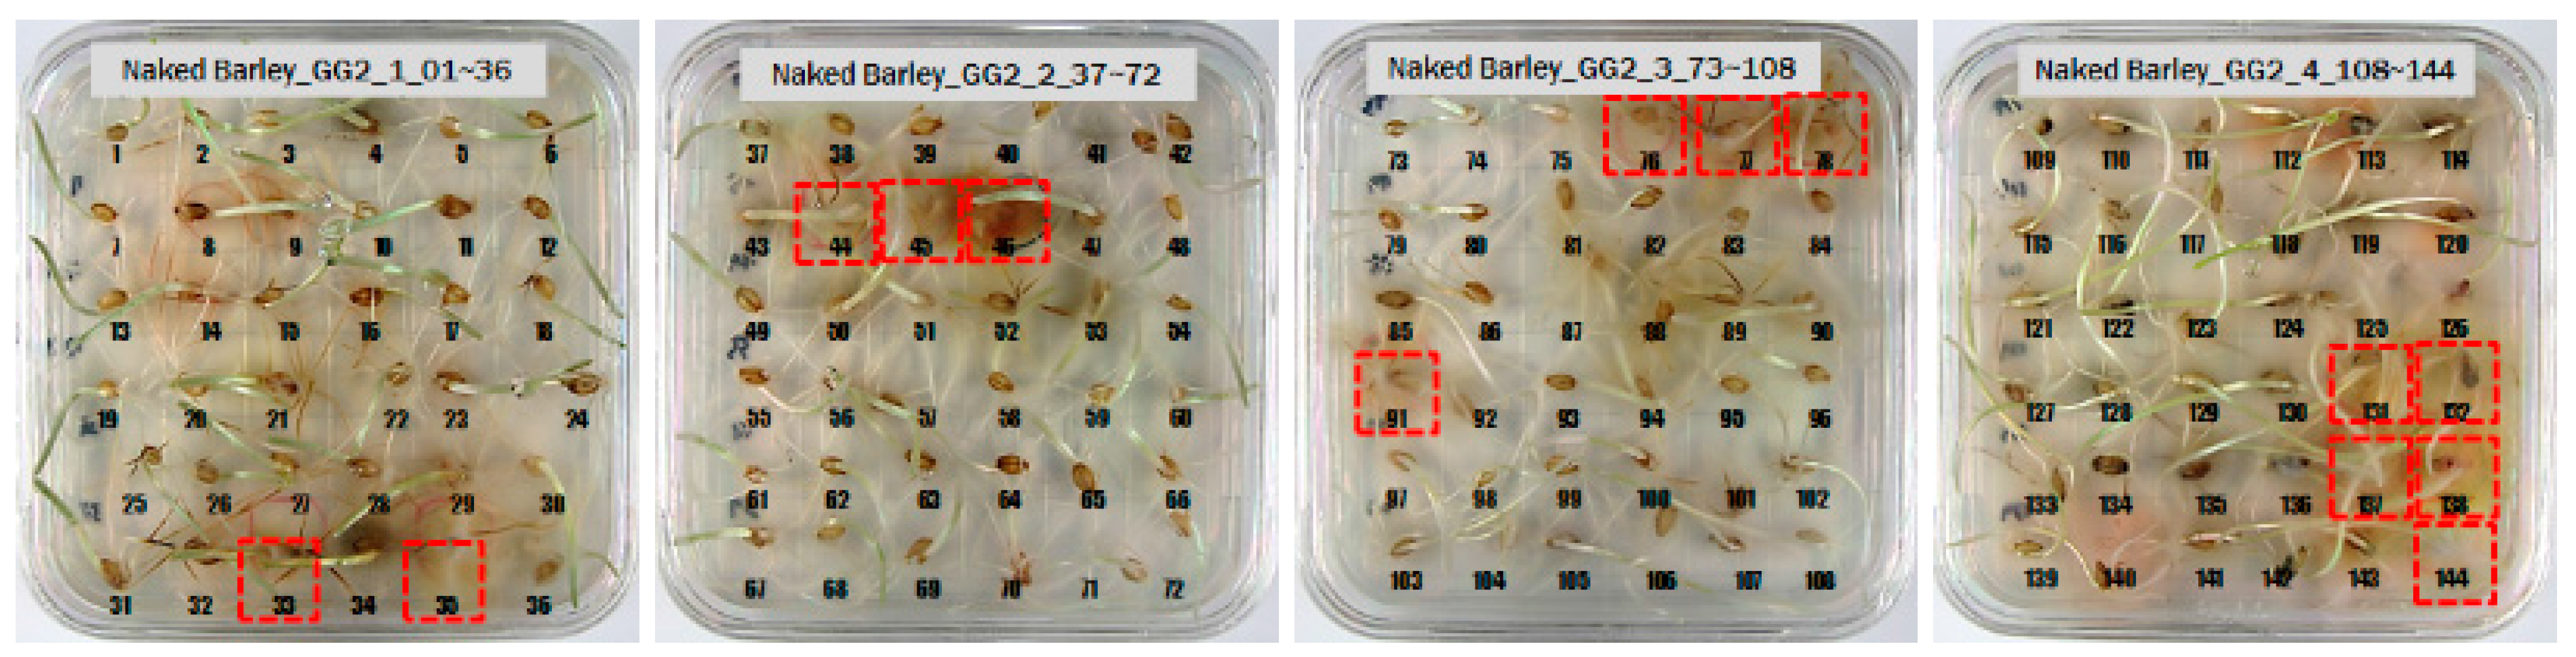
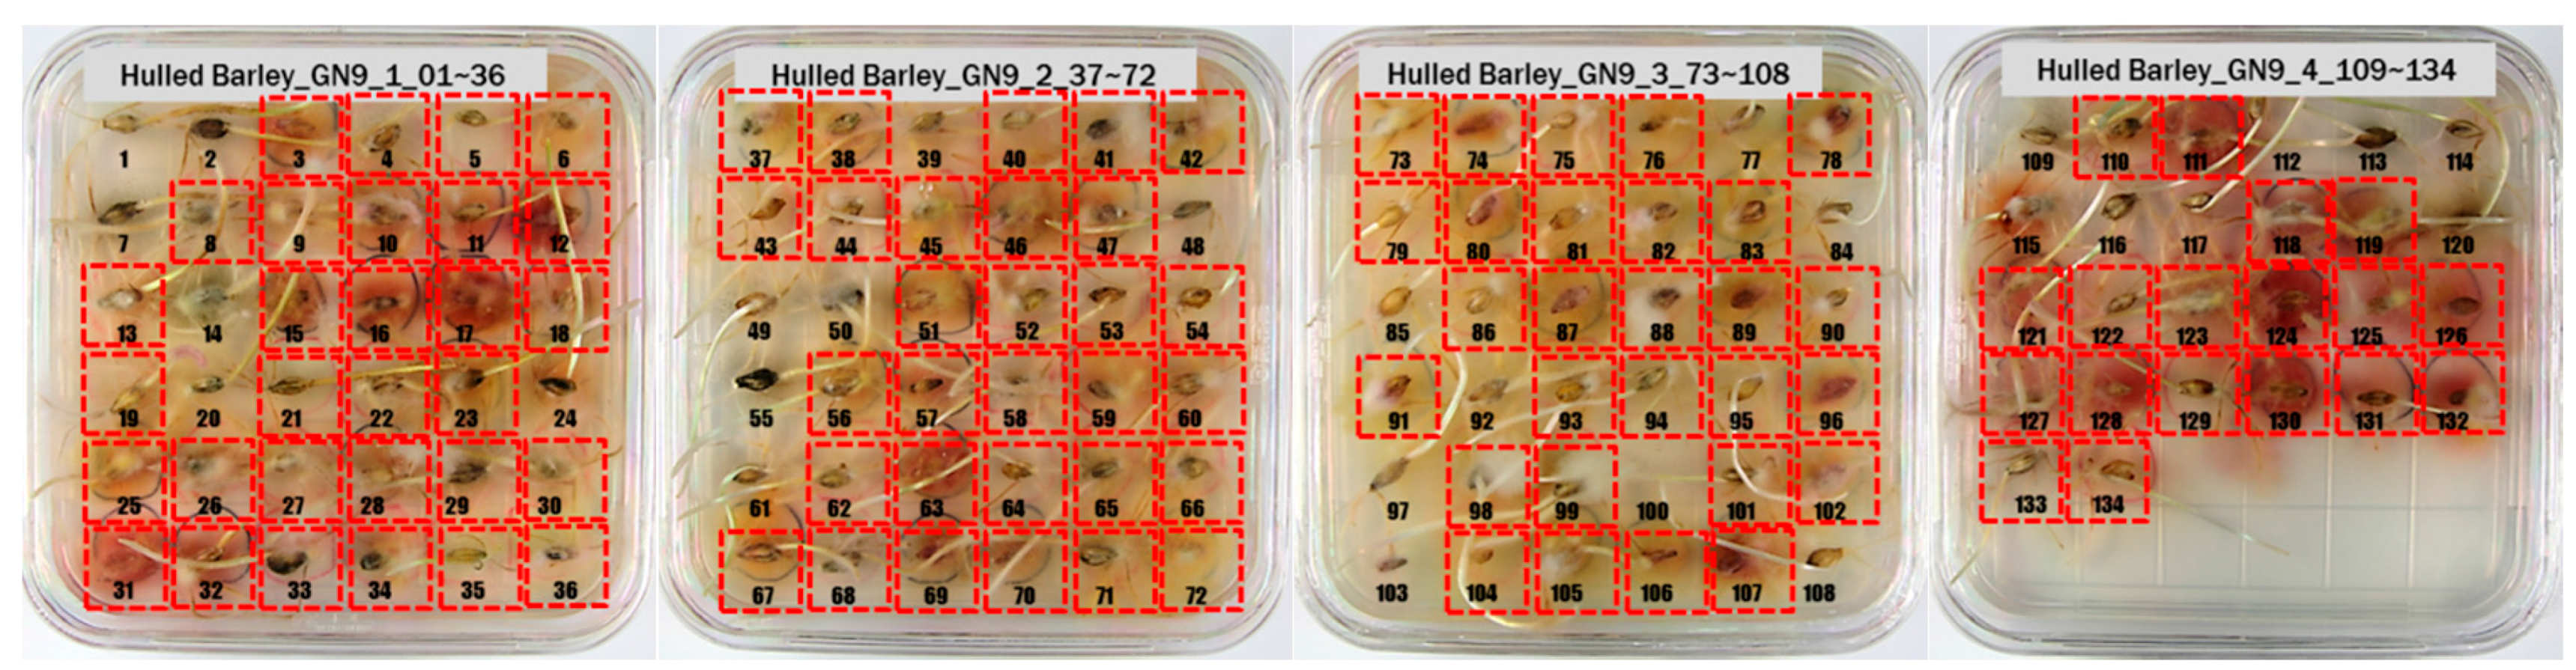
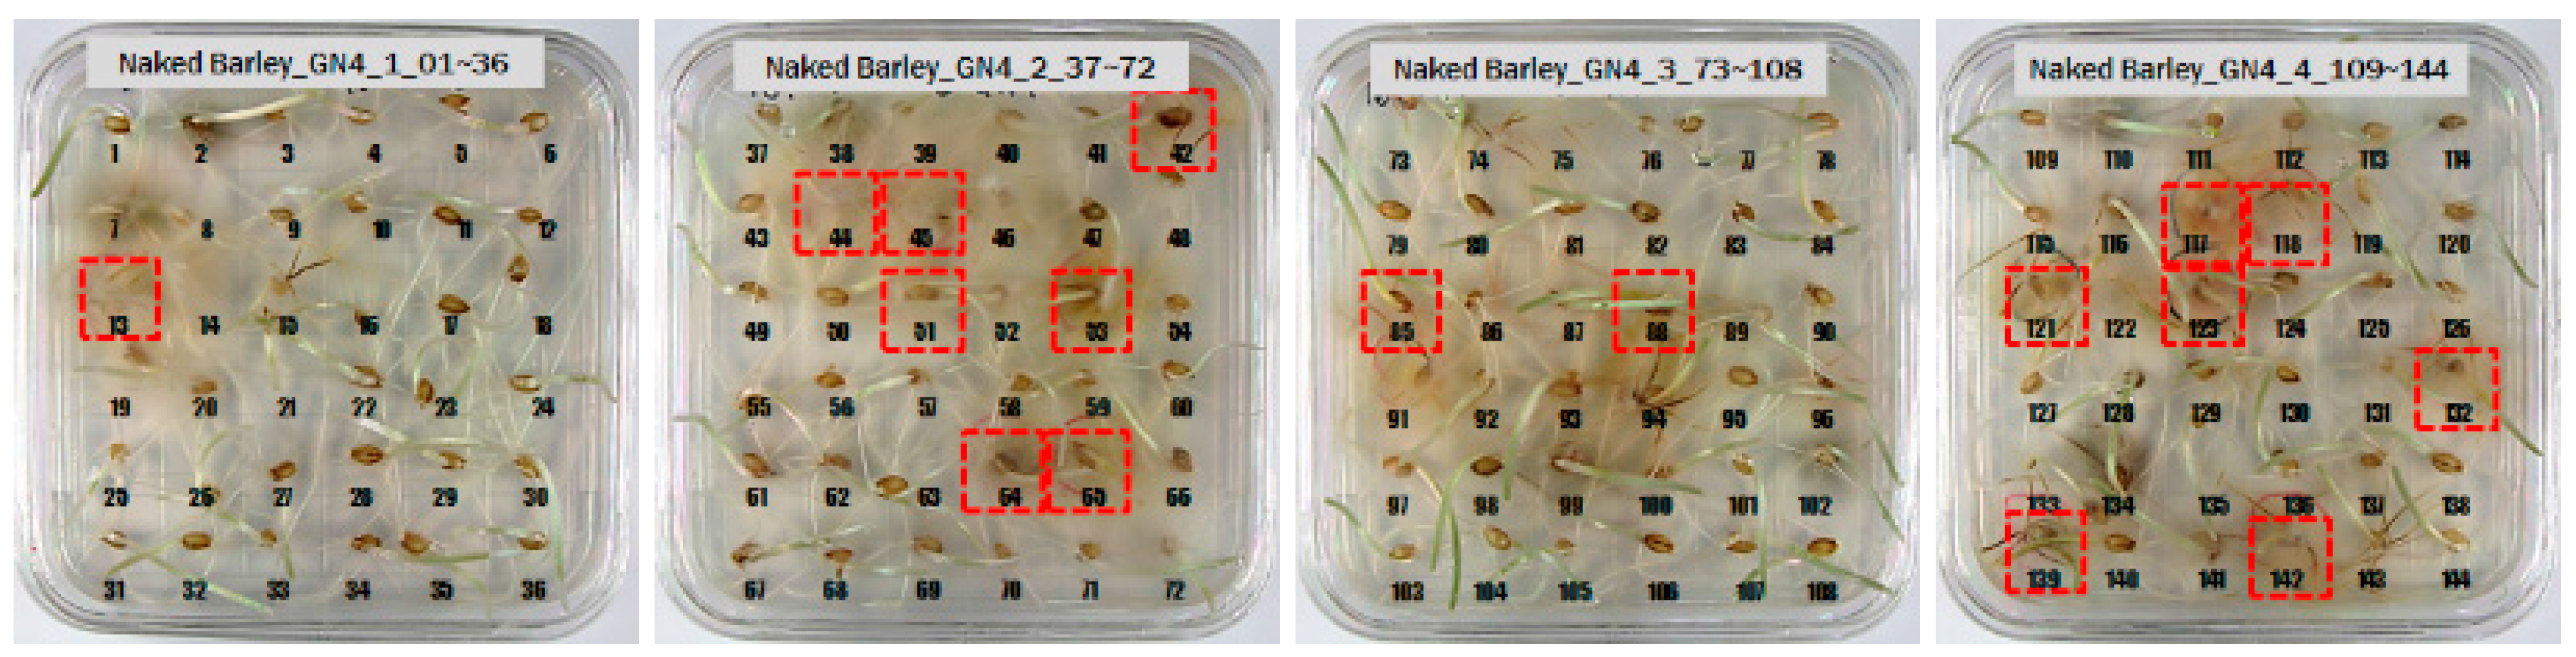
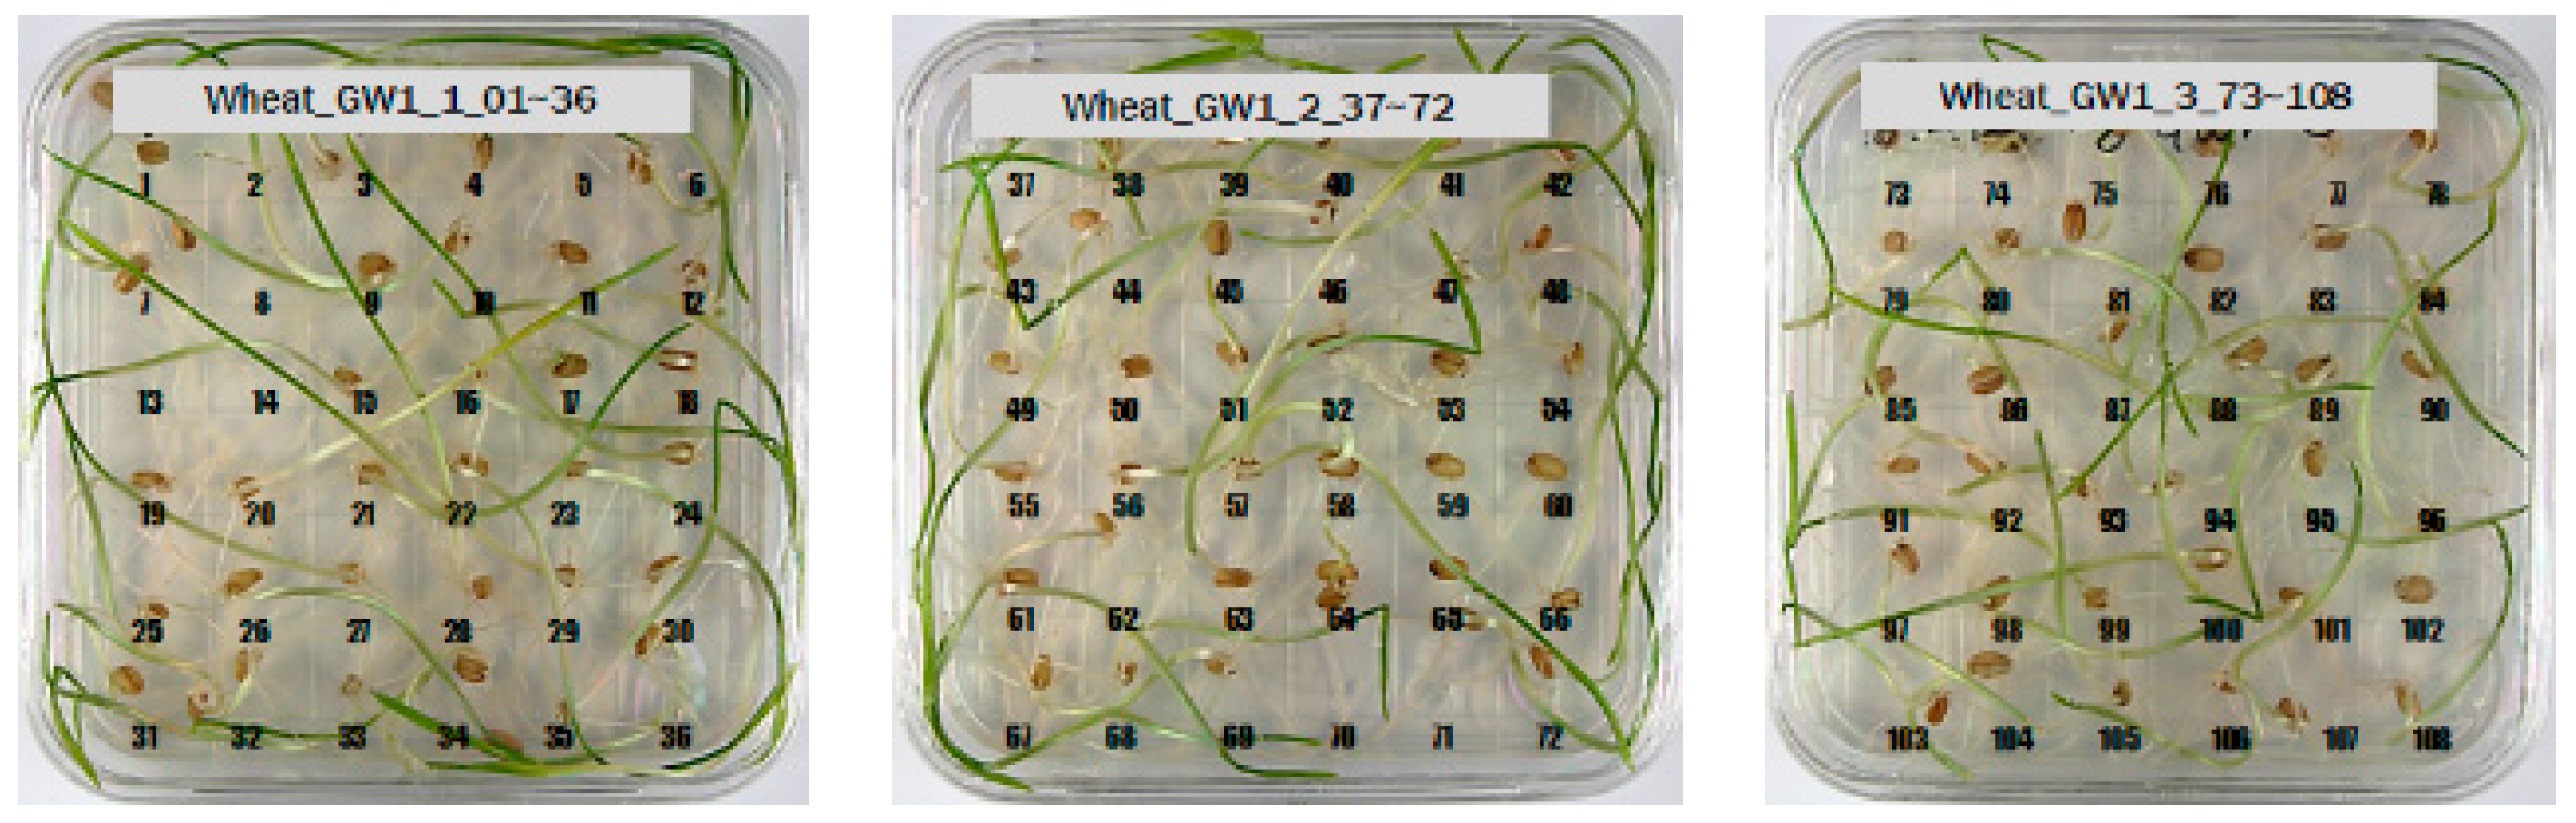
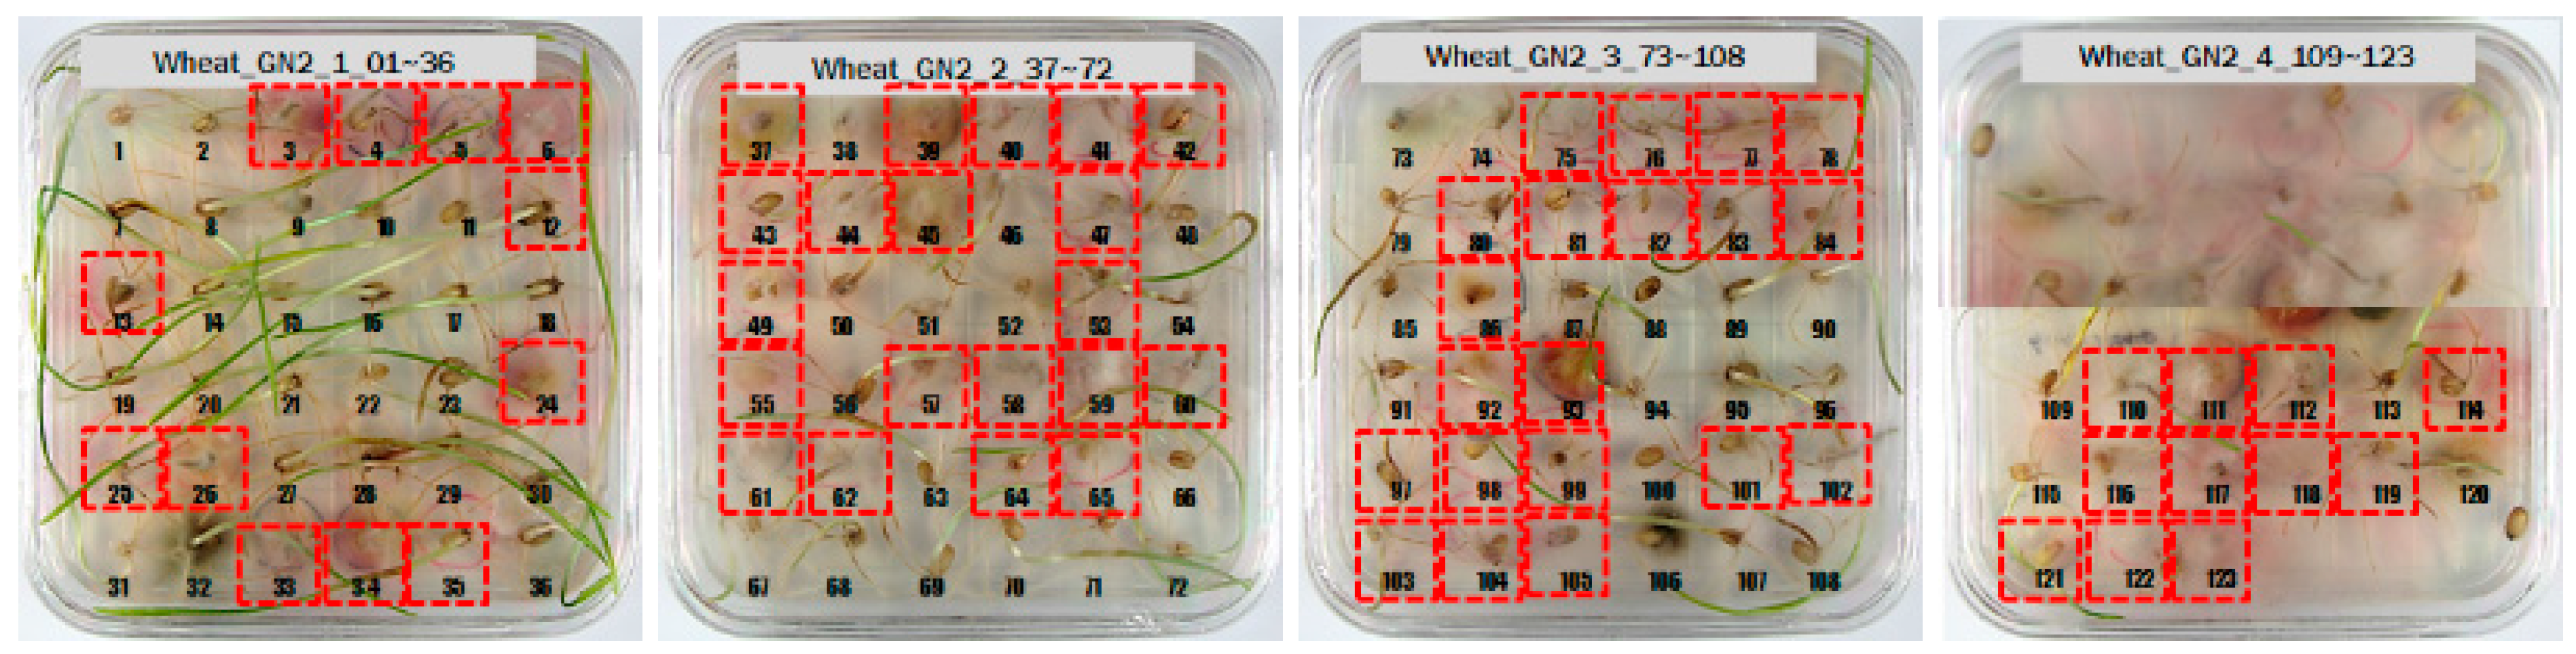
3.1. Culture Results of Hulled Barley, Naked Barley and Wheat

Table 2 shows the culture results for hulled barley, naked barley, and wheat. The first culture results in column (a) show the results of preliminary culture experiment for samples, which were used to determine whether the samples collected from each region were a contaminated group or a normal group. In this study, the control group and experimental group of the hulled barley, naked barley, and wheat samples were classified by the first culture experiment results. The number of grain samples was identical to the number of grains used in the preliminary culture experiment. The second culture experiment was carried out after the near infrared reflectance spectrum was acquired, and the results are shown in column (b).
For the hulled barley samples, a total of 996 grains including the GB3-C samples, which were the control group, and the samples collected from six regions, which were used as the experimental group, were placed in the square dishes—36 grains per dish—and were cultured. After four days, the cultured samples were discriminated by experts with the naked eye for contamination with Fusarium. In the control group (GB3-C), no spore contaminated with Fusarium was observed in the preliminary and second culture experiments. In the case of JB11, which was used as an experimental group, one grain was found to be contaminated with Fusarium in the preliminary culture experiment, but in the main experiment, no contaminated hulled barley grain was found. In the other experimental groups, Fusarium spores were observed, although the quantities were different. Therefore, 135 GB3 grains were used as the control group samples for discriminating hulled barley grains contaminated with Fusarium. For the experimental groups samples, a total of 150 grains were used, including GB5 (1 grain), GN9 (106 grains), JB9 (26 grains), JN8 (15 grains), and CN2 (2 grains) for hulled barley samples contaminated with Fusarium. Figure 4 shows the status of the GB3 samples after culture, which were the hulled barley samples that were used as the control group. Normal hulled barley germinated with no generation of spores.
Figure 5 shows the state after culture of the GN9 samples, in which 106 grains generated Fusarium spores: the largest number among the hulled barley sample groups that were used as experimental groups. The samples that generated spores were marked by red dotted lines.
For the naked barley samples, a total of 562 grains, including GG2-C samples, which were the control group, and the samples collected from the other two regions, which were used as the experimental groups, were placed and cultured in the square dishes. No Fusarium spores were found in the GG2-C sample group, which was the control group, in the preliminary culture experiment results. In the second culture experiment, however, 14 grains were contaminated with Fusarium among the 163 grains in total, as shown in Figure 6.
Among the experimental groups, 12 out of the 200 grains in the JN13 sample group and 21 out of the 199 grains in the GN4 group were contaminated. Figure 7 shows the samples of the GN4 group, which were the naked barley samples that were used as the experimental group, in which Fusarium spores were generated. For the control group for discriminating naked barley samples contaminated with Fusarium, 149 grains that were not contaminated with Fusarium in the GG2-C group were used. For the experimental group, a total of 33 grains, including JN13 (12 grains) and GN4 (21 grains), were used.
For wheat samples, a total of 393 grains were placed and cultured in square dishes, including GW1-C samples of the control group, and the samples collected from the other two regions in the experimental groups. In the GW1-C wheat samples of the control group, no spores contaminated with Fusarium were found, and normal wheats were germinated, as the second culture experiment results show in Figure 8.
Among the wheat samples in the experimental groups, a total of 96 grains were found to be contaminated with Fusarium, including 33 grains in the JB11 group, and 63 grains in the GN2 group. Figure 9 shows wheat samples of the GN2 group in which Fusarium spores were observed.

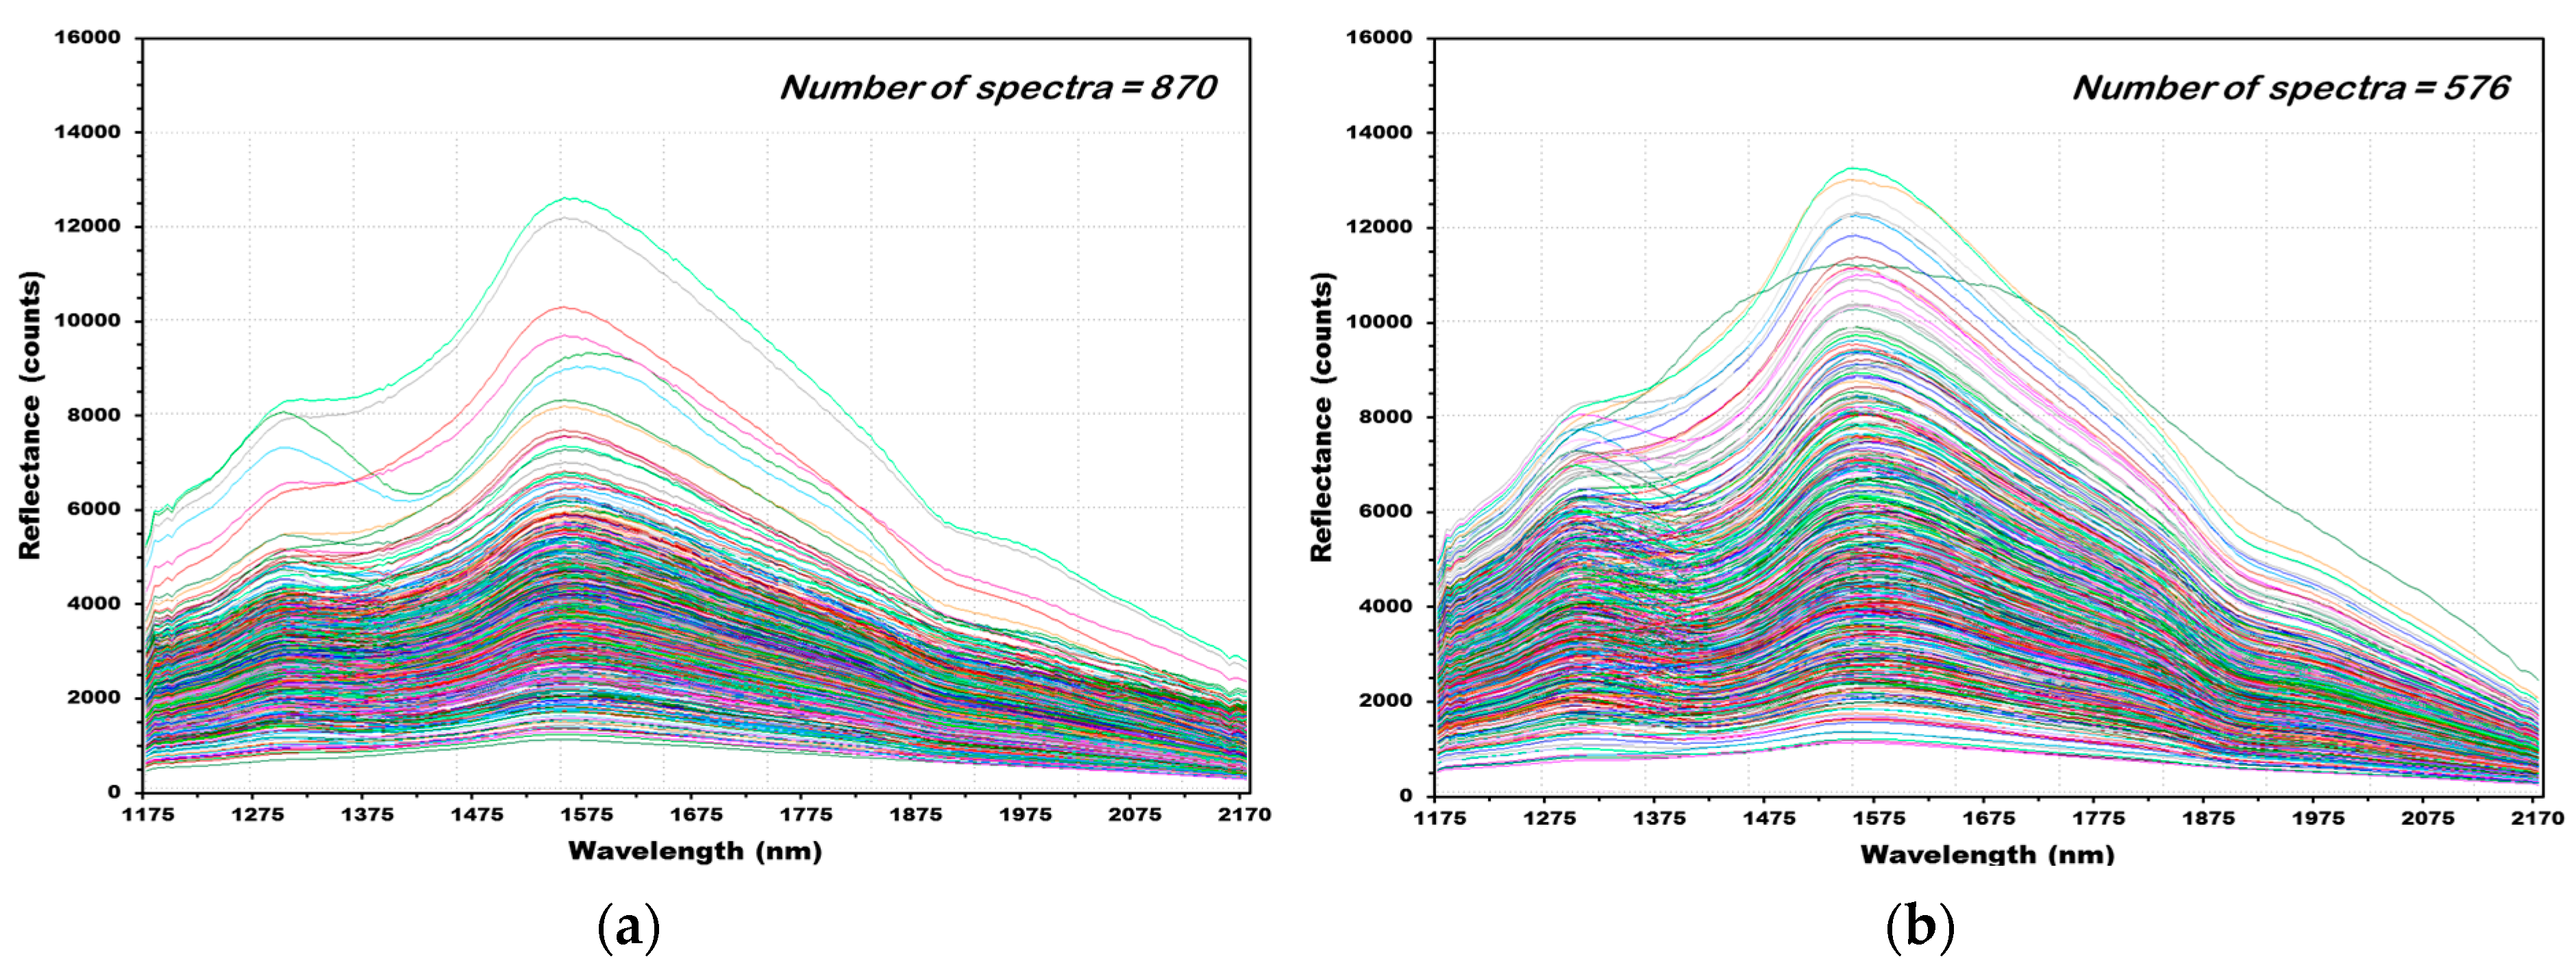
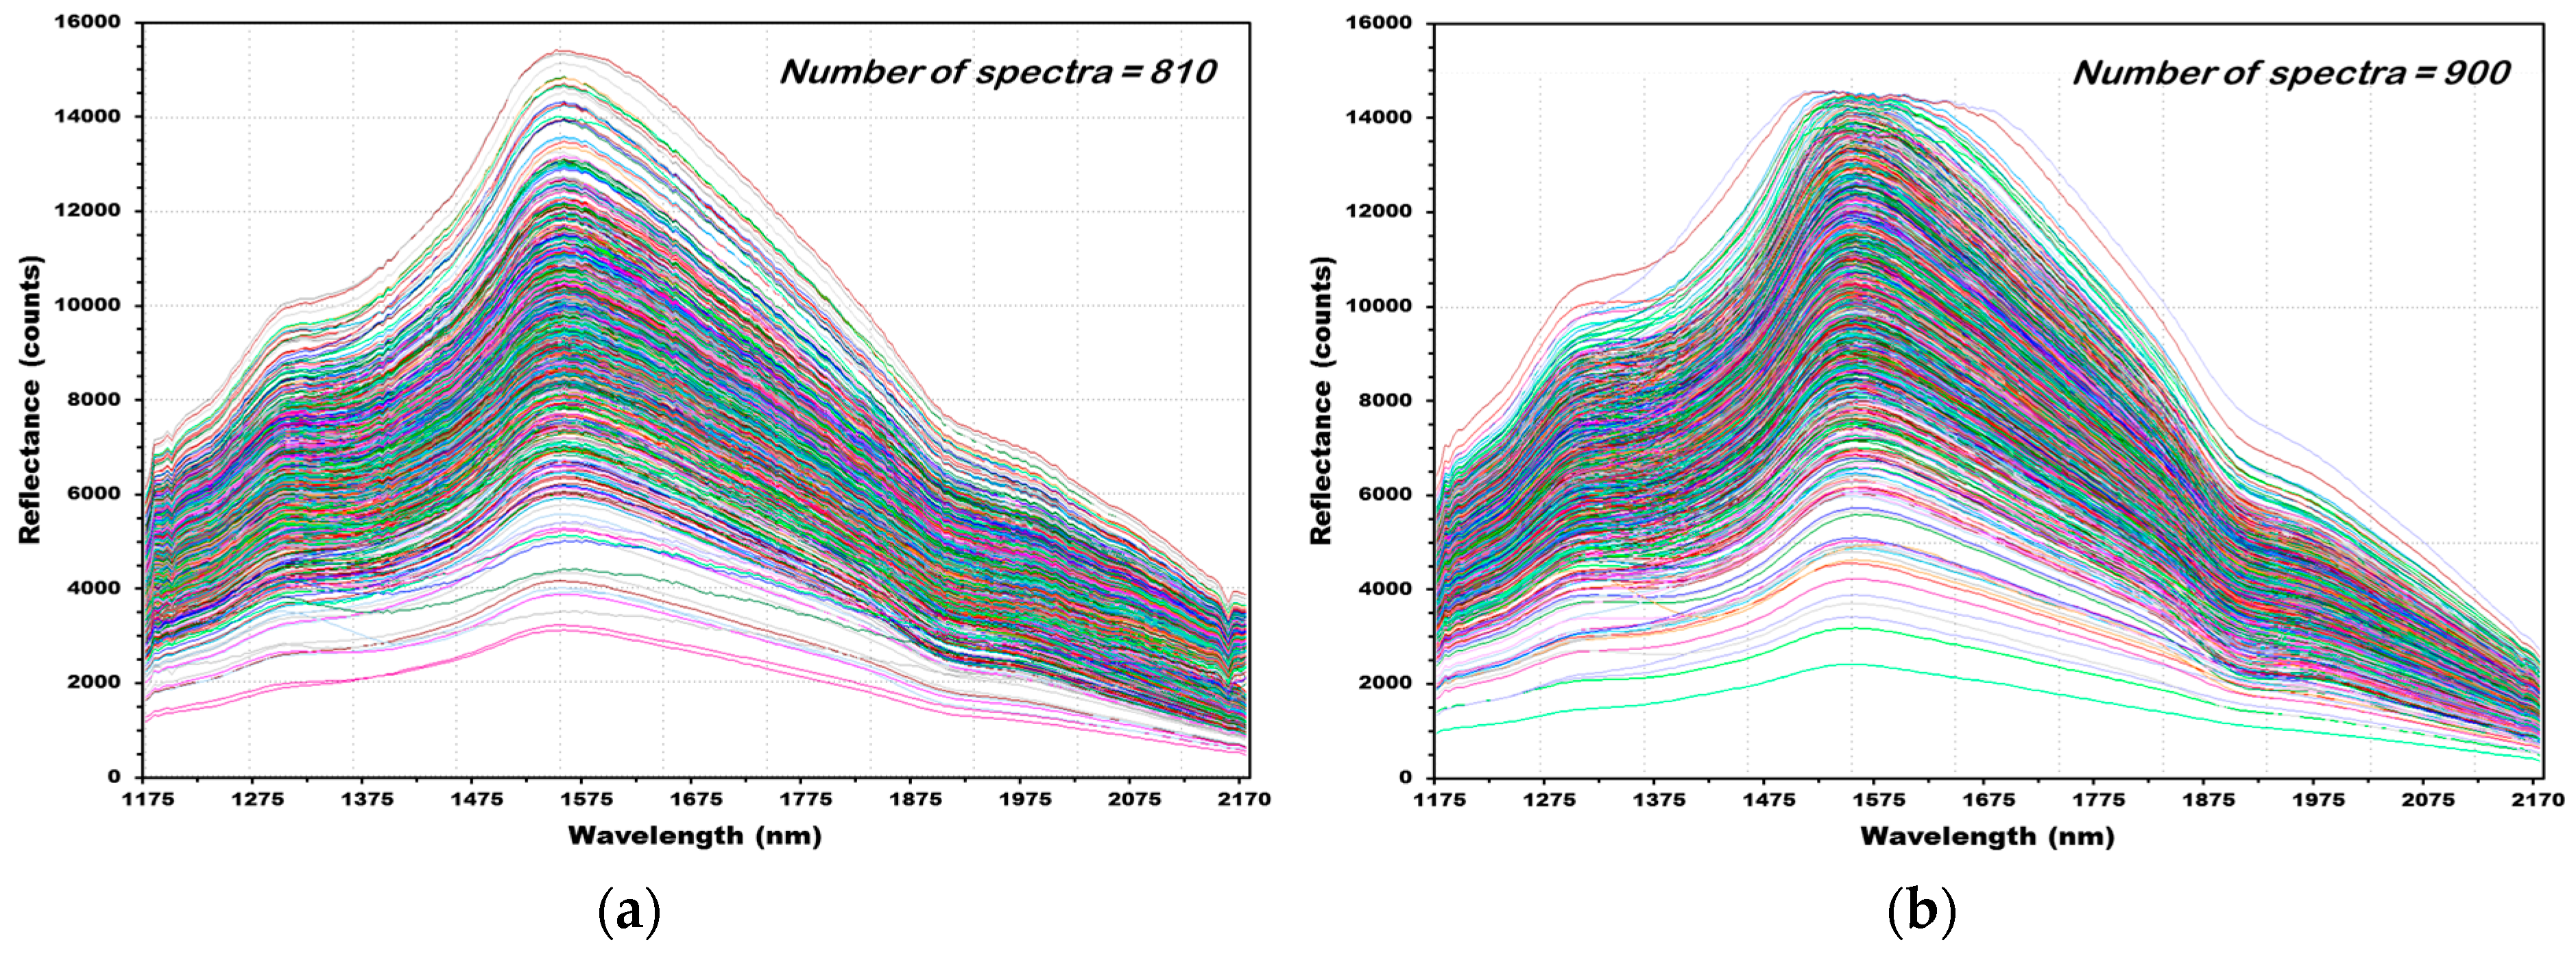
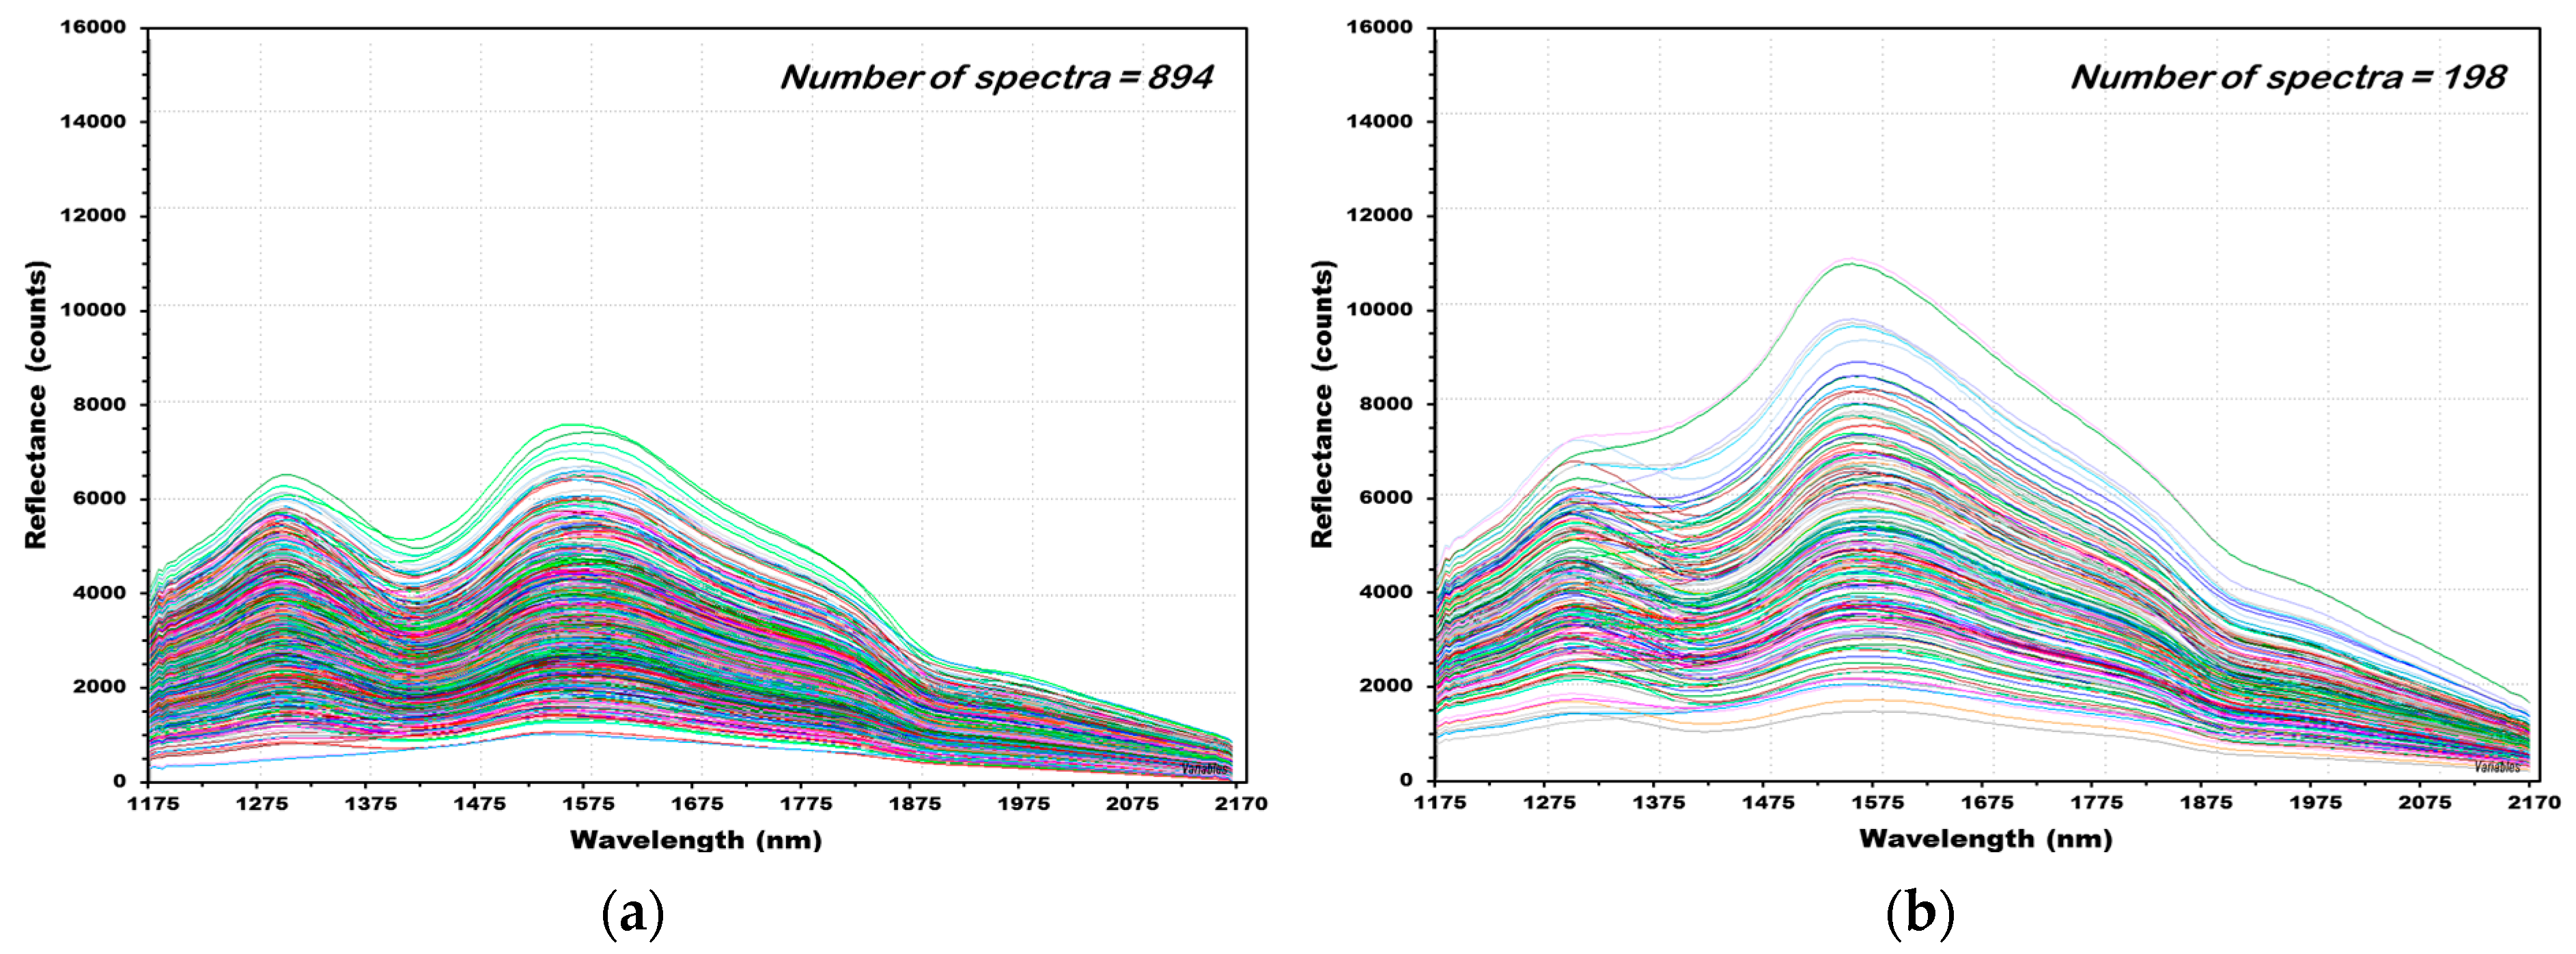
3.2. NIR Reflectance Spectra of Hulled Barley, Naked Barley, and Wheat

Figure 10 shows the reflectance spectra of 1710 (Not contaminated with Fusarium (NCF): 810, contained with Fusarium (CF): 900) obtained from 285 hulled barley samples (NCF: 135, CF: 150). Figure 10a shows the raw reflectance spectra acquired using NIR256 spectroscopic sensor for 135 grains in the hulled barley samples of the control group that were not contaminated with Fusarium. First, 810 reflectance spectra were collected by measuring 135 samples six times. The highest rising peak occurred at 1575 nm, and the strength of reflectance at this time was 15,500 counts at the maximum. A rising peak also occurred in the 1335 nm wavelength, and a falling peak occurred at the 1922 nm wavelength. Figure 10b shows the 900 NIR reflectance spectra acquired from 150 grains of hulled barley samples that were contaminated with Fusarium, which show a similar trend as the reflectance spectra of hulled barley samples. However, the second rising peak occurred at the 1327 nm wavelength, resulting in a shift.
Figure 11 shows the reflectance spectra of 1092 (NCF: 894, CF: 198) obtained from 182 naked barley samples (NCF: 149, CF: 33). Figure 11a shows 894 raw reflectance spectra acquired from 149 grains in total of the group naked barley samples in the control group that were not contaminated with Fusarium. Similar to the hulled barley, the maximum rising peak of the naked barley samples occurred at 1579 nm. However, the strength of the reflected light decreased, because the surface of naked barleys with no skin absorbed more light, and the maximum strength of reflectance was around 7500 counts, which is low. The second rising peak occurred at the 1309 nm wavelength, and the maximum strength of reflectance was 6500 counts. The falling peak occurred at 1933 nm. Figure 11b shows the 198 raw NIR reflectance spectra acquired from 33 naked barley grains contaminated with Fusarium.
Figure 12 shows the reflectance spectra of 1446 (NCF: 870, CF: 576) obtained from 241 wheat samples (NCF: 145, CF: 96). Figure 12a shows 870 raw reflectance spectra acquired from 145 grains of wheat samples that were not contaminated with Fusarium. The maximum rising peak occurred at 1579 nm wavelength, where those of hulled barley and naked barley grains occurred. The second rising peak occurred at 1314 nm. Figure 12b shows 576 raw reflectance spectra acquired from 96 grains of wheat samples contaminated with Fusarium. The first and second rising peaks occurred at wavelengths similar to those of normal wheat.

3.3. Results of the PLS-DA Prediction Model for Fusarium Discrimination

A PLS-DA prediction model was developed to discriminate Fusarium contamination using the result of culturing Fusarium after acquiring near infrared reflectance spectrum from hulled barley, naked barley, and wheat samples. Table 3 shows the CCR result for the calibration and validation performance of the PLS-DA models developed by applying various mathematical pretreatments to the NIR reflectance spectra acquired from hulled barley, naked barley, and wheat samples. The CCR of the PLS-DA discrimination prediction model for hulled barley, naked barley, and wheat that has been developed with acquired raw reflectance spectra is 98% or higher, indicating good results. The CCR for the validation performance of the raw reflectance spectra to which no pretreatment was applied was 100% (810/810) for the NCF of hulled barley samples, and 99.44% (895/900) for the CF, with 99.72% on average. The CCR of the naked barley samples was 99.89% (893/894) for NCF and 99.48% (195/198) for CF, with 99.18% on average. The CCR of wheat samples was 99.66% (867/870) for NCF and 99.83% (576/576) for CF, with 99.74% on average, showing the best discrimination performance. For the mathematical pretreatments for the three types of grain samples, the derivative pretreatment showed the most appropriate and improved performance. In the validation performance of hulled barley samples, the discrimination prediction performance of the second derivative improved to RV2 = 0.946 and SEP = ±0.116. The CCRs of NCF and CF were 100% and 99.78% (898/900), respectively. For the validation performance of naked barley samples, all of the CCRs of NCF and CF in the first, second, and third derivatives improved to 100%. Thus, the spectra pretreatment that applied derivatives effectively improved the discrimination performance. In particular, the validation performance applying the third derivative pretreatment was RV2 = 0.948 and SEP = ±0.088, showing the best performance among all of the samples. In the wheat samples, too, the CCR of the spectra pretreatment applying derivative improved. The prediction model of the PLS-DA that developed by applying second derivative pretreatment showed the best results at RV2 = 0.933 and SEP = ±0.127.

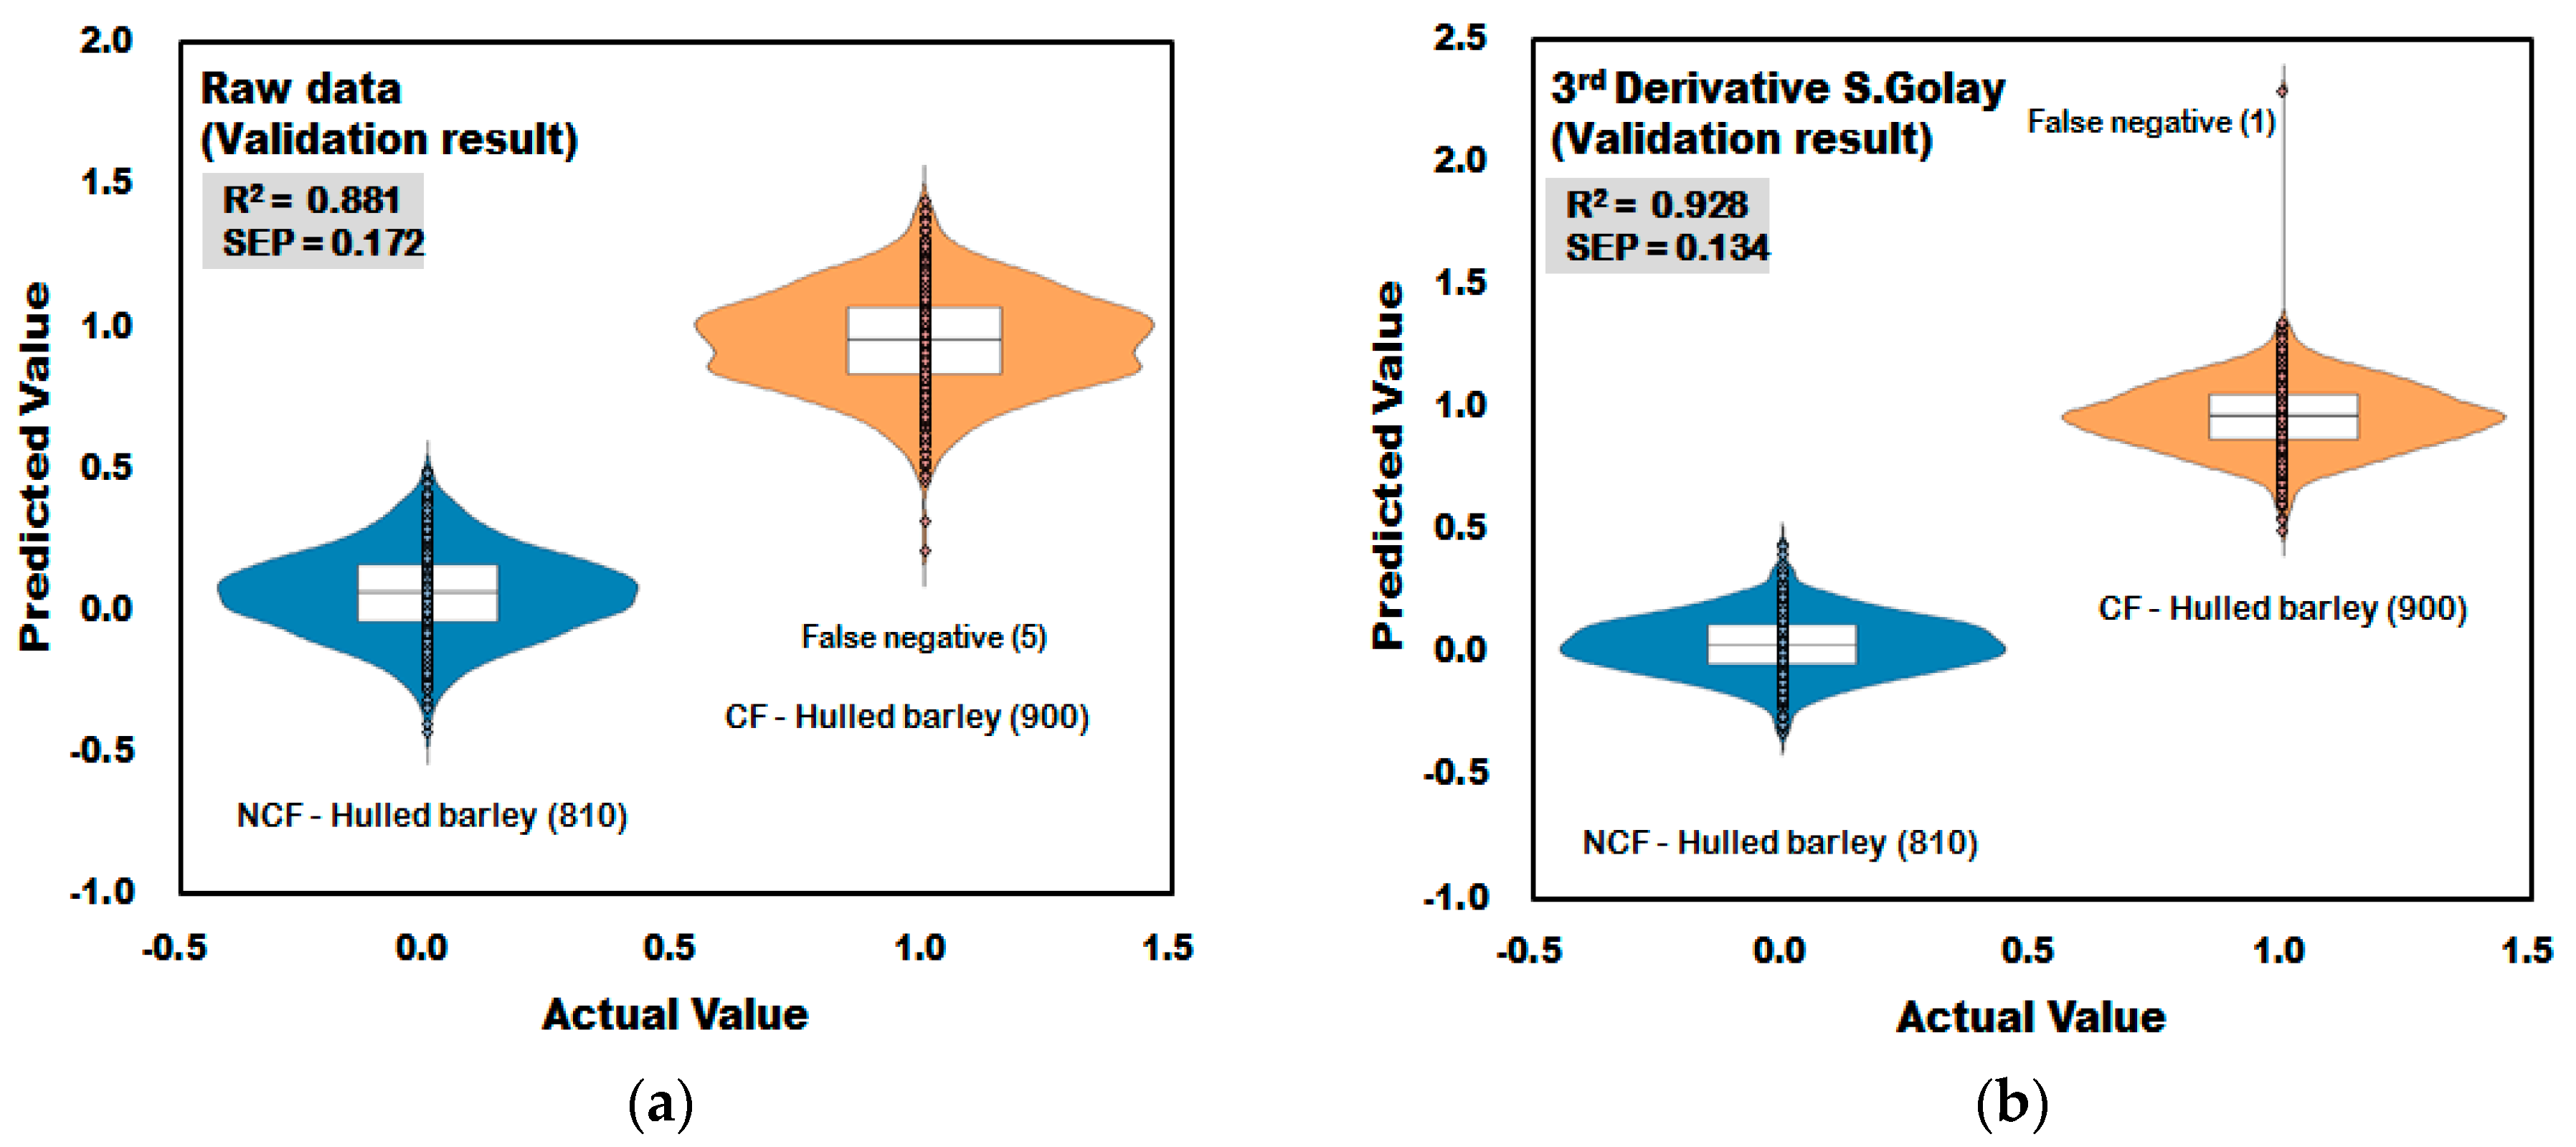
3.3.1. Prediction Results of the PLS-DA Model for Discrimination of Contaminated with Fusarium (CF)-Hulled Barley

Figure 13a shows the validation result of the PLS-DA model developed with no application of pretreatment to the raw reflectance spectra acquired from the hulled barley samples. In the raw data, five out of 900 spectra acquired from 150 grains of CF hulled barley were predicted as false positive at 0.5 or lower at the reference value of ±1, resulting in 99.44% (895/900) CCR. The 810 spectra from the hulled barley samples that were not contaminated showed 100% CCR. In this study, various mathematical spectra pretreatments were applied to improve the accuracy of the prediction model. As shown in Figure 13b, the third-order derivative result predicted only one of the 900 spectra acquired from CF as higher than 1.5, which is the reference value, resulting in a CCR of 99.89% (899/900). The CCR of the third-order derivative pretreatment was 100% (810/810) for NCF. The validation model applying the third-order derivative pretreatment showed RV2 = 0.928, which improved from 0.881, and is the result of the raw spectra in Figure 13a, and SEP decreased to ±0.134, proving the effect of spectra pretreatment.

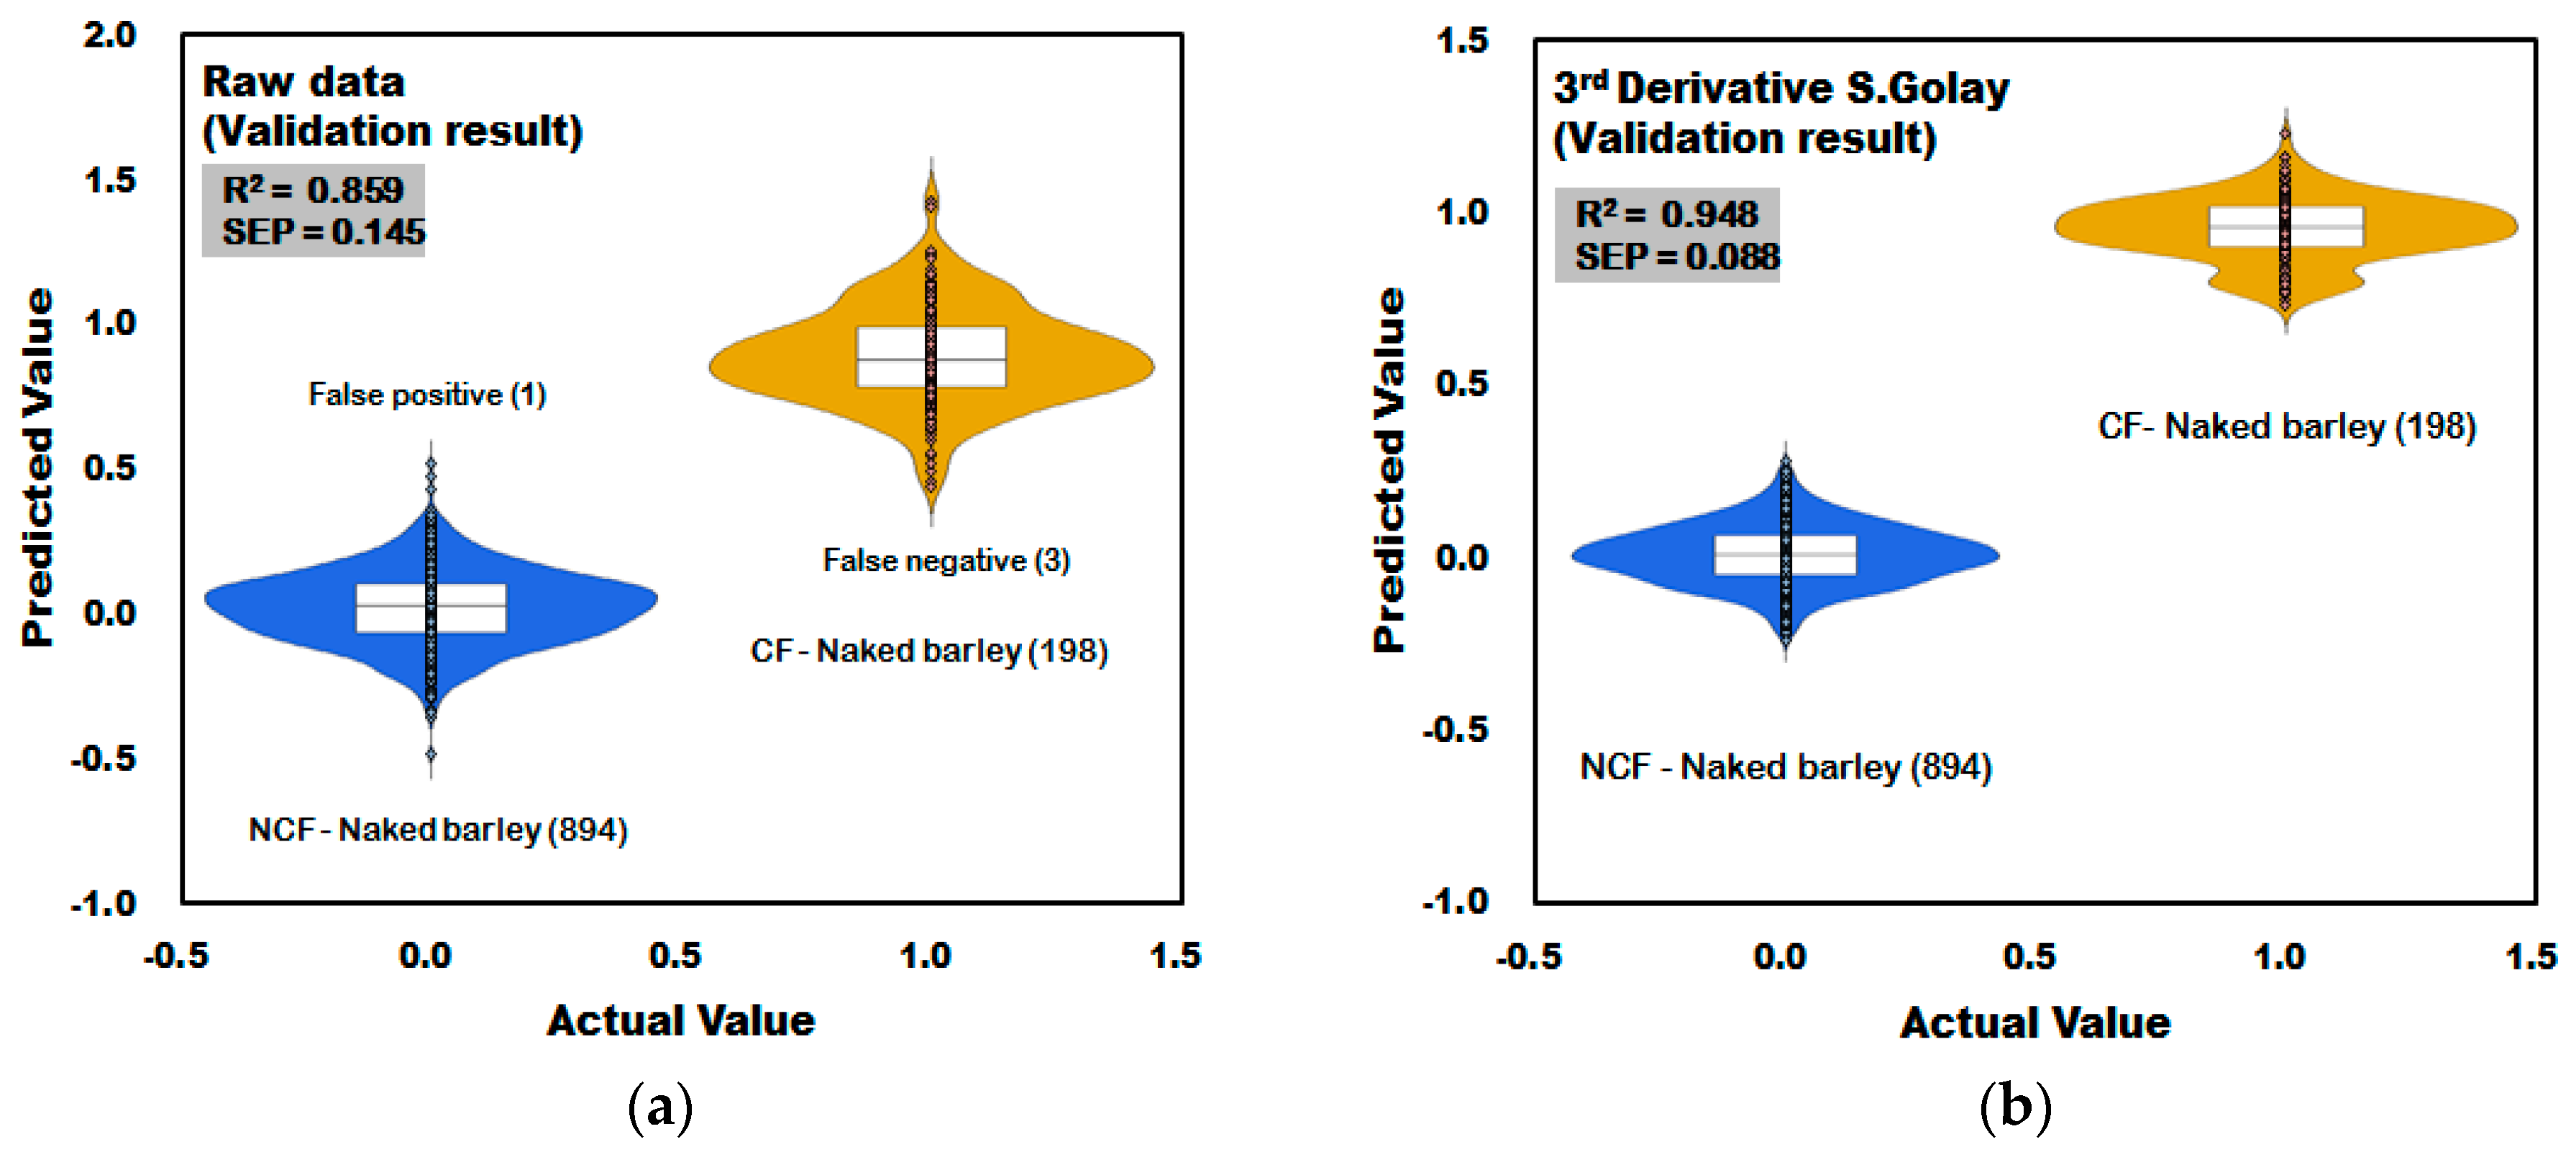
3.3.2. Prediction Result of PLS-DA Model for Discrimination of CF-Naked Barley

Figure 14a shows the result of the PLS-DA model developed using the raw spectra acquired from naked barley samples. In the raw data in Figure 14a, one of the 894 spectra acquired from NCF-naked barley samples was predicted as higher than 0.5, which is the reference value, resulting in a CCR of 99.89% (893/894). In the CF-naked barley samples, three of the 198 spectra was predicted as lower than 0.5, which is the reference value, resulting in a CCR of 98.48% (195/198). Figure 14b shows the PLS-DA model developed by applying third-order derivative pretreatment to the raw spectra acquired from naked barley samples. Validation performance of NCF-naked barley and CF-naked barley showed 100% CCR. The validation model improved to RV2 = 0.948 and decreased to SEP = ±0.088.

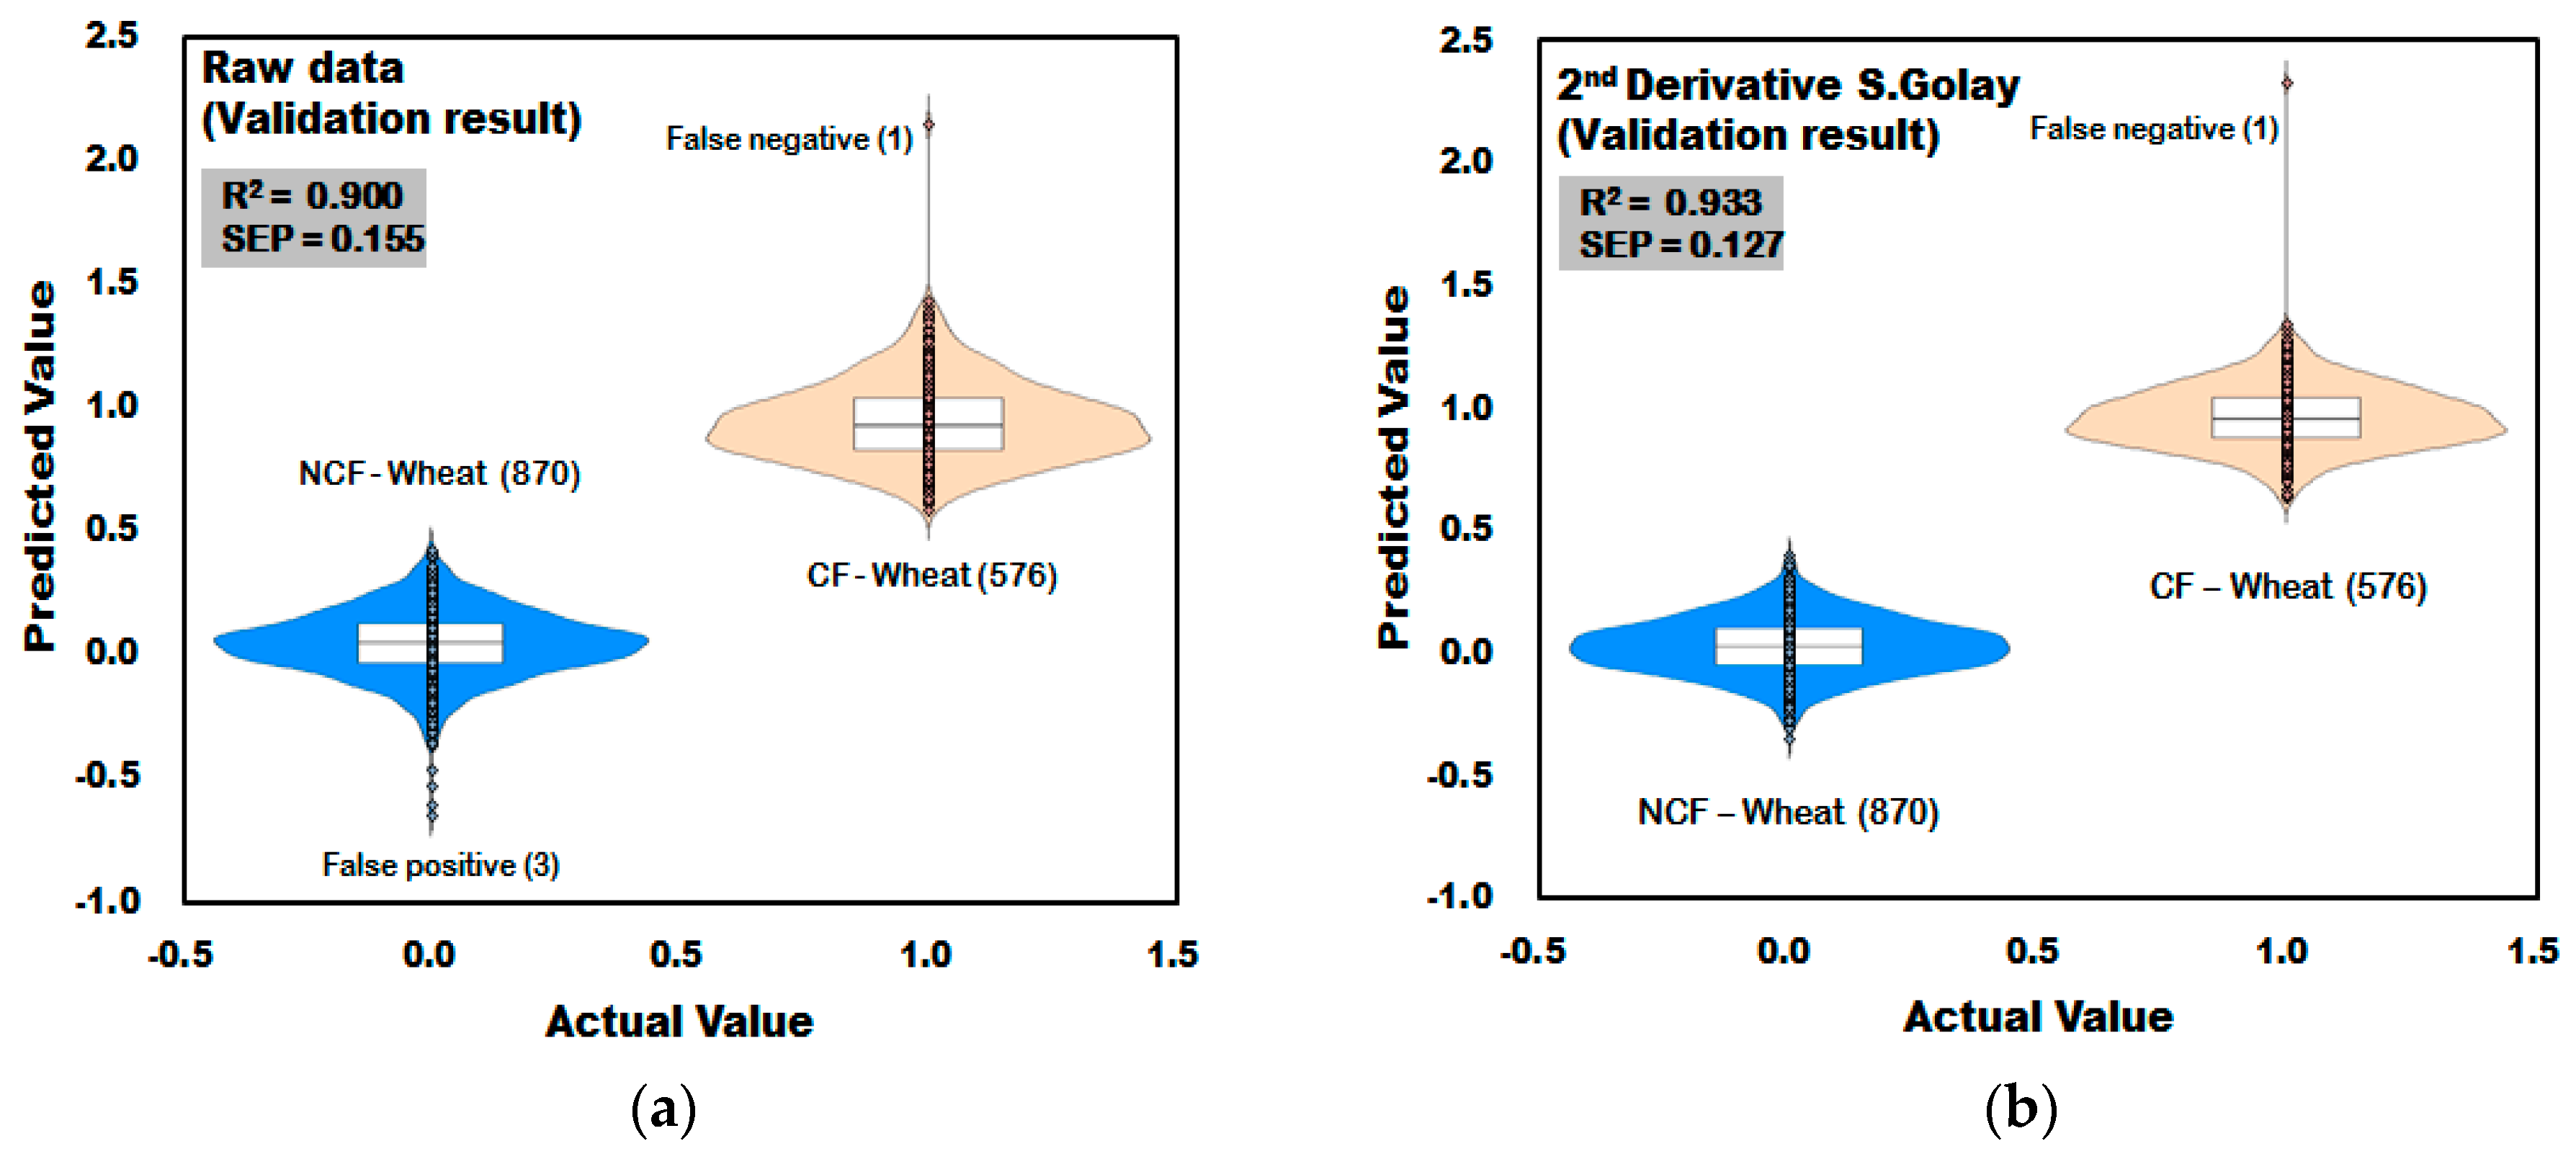
3.3.3. Prediction Result of PLS-DA Model for Discrimination of CF-Wheat

Figure 15a shows the result of validation model of PLS-DA developed using raw spectra acquired from wheat. In the developed validation model, one of the 576 spectra acquired from CF-wheat samples was predicted as higher than 1.5, which is the reference value, resulting in a CCR of 99.83% (575/576), and one of the 870 spectra acquired from the NCF wheat samples was predicted as lower than −0.5, which is the reference value, resulting in a CCR of 99.66% (867/870). Figure 15b shows the validation result of the PLS-DA model developed by applying second derivative pretreatment to raw spectra acquired from wheat samples. One of the 576 spectra acquired from the wheat samples contaminated with Fusarium was predicted as higher than 1.5, which is the reference value, resulting in a CCR of 99.83% (575/576). The RV2 of the validation model applying the second-order derivative pretreatment was 0.933, which is higher than the result of the raw spectra, and the SEP decreased to 0.127, proving the effect of the spectra pretreatment.

4. Conclusions and Outlook

A technology to discriminate hulled barley, naked barley, and wheat contaminated with Fusarium rapidly and non-destructively was developed using near infrared spectroscopy technology. The PLS-DA models that included a first-order derivative, second-order derivative, or third-order pretreatment yielded an improved predictive discrimination accuracy for the infected grain samples (>99.5%), compared with the method without a pretreatment. In particular, the naked barley discrimination accuracy was the best when compared with other grains. The PLS-DA model that was developed by applying derivative pretreatment to the acquired reflectance spectra was advantageous in the improvement of the correct classification rate. In our experiment, the use of reflectance spectra based on the NIRS technique has been proposed as an innovative and specific instrument for the discrimination of grains contaminated with fungus. The obtained results suggest the possible applications for discrimination of grains contaminated with other fungi similar to Fusarium. In the future, for the practical validation of the developed PLS-DA model, experiments to discriminate grains contaminated with Fusarium will be performed by adding grain samples produced from other regions or harvested in different years.

Acknowledgments

This study was carried out with the support of “Research Program for Agricultural Science & Technology Development (Project No. PJ01096901)”, National Institute of Agricultural Sciences, Rural Development Administration, Republic of Korea.

Author Contributions

Jongguk Lim and Seongmin Kim contributed to the conception of the study; Giyoung Kim and Changyeun Mo contributed significantly to theoretical analysis and manuscript preparation; Kyoungmin Oh and Hyeonheui Ham performed the test; Geonseob Kim and Moon S. Kim analyzed the data; All authors approved the final version.

Conflicts of Interest

The authors declare no conflict of interest.

References

  1. Lee, K.H.; Lee, S.K.; Park, H.Y.; Sim, E.Y.; Woo, K.S.; Oh, S.K.; Lee, B.K.; Kim, H.J. Quality characteristics of barley Makgeolli prepared with different barley cultivars and milling recovery. Korean J. Food Preser. 2016, 23, 530–553. [Google Scholar]
  2. Kalra, S.; Jood, S. Effect of dietary barley β-glucan on cholesterol and lipoprotein fractions in rat. J. Cereal Sci. 2000, 31, 141–145. [Google Scholar] [CrossRef]
  3. Song, E.S.; Park, S.J.; Woo, N.R.A.; Won, M.H.; Cho, J.S.; Kim, J.G.; Kang, M.H. Antioxidant capacity of colored barley extracts by varieties. Korean J. Food Nutr. 2005, 34, 1491–1497. [Google Scholar]
  4. Kim, Y.S.; Lee, Y.T.; Seong, H.M. Physicochemical properties of starches from waxy and non-waxy hull-less barleys. J. Korean Soc. Agric. Chem. Biotechnol. 1999, 42, 240–245. [Google Scholar]
  5. Hyun, J.N.; Kweon, S.J.; Park, D.S.; Ko, J.M.; Han, S.I.; Lim, S.G.; Suh, S.J. A new high quality and yielding barley variety “Geungangbori” with lodging resistance. Korean J. Breed. Sci. 2008, 40, 474–478. [Google Scholar]
  6. Seo, K.H.; Kim, Y.H.; Lee, Y.M.; Ghosh, M.; Park, K.M.; Park, D.H.; Kim, J.S.; Lim, B.O. Evaluation of Anti-Oxidant and Anti-Inflammatory Activities of Ganoderma lucidum Cultured on Hulled Barley. Korean J. Med. Crop Sci. 2017, 25, 29–36. [Google Scholar] [CrossRef]
  7. Kim, J.Y.; Yi, Y.H. pH, acidity, color, amino acids, reducing sugars, total sugars, and alcohol in puffed millet powder containing millet Takju during fermentation. Korean J. Food Sci. Technol. 2010, 42, 727–732. [Google Scholar]
  8. Shin, D.S.; Choi, Y.J.; Jeong, S.T.; Sim, E.Y.; Lee, S.K.; Kim, H.J.; Woo, K.S.; Kim, S.J.; Oh, S.K.; Park, H.Y. Quality Characteristics of Mixed Makgeolli with Barley and Wheat. Korean J. Food Nutr. 2016, 29, 565–572. [Google Scholar] [CrossRef]
  9. McMullen, M.; Jones, R.; Gellenberg, D. Scab of wheat and barley: A re-emerging disease of devastating impact. Plant Dis. 1997, 81, 1340–1348. [Google Scholar] [CrossRef]
  10. Chung, H.S. Cereal scab causing mycotoxicosis in Korea and present status of mycotoxin researches. Korean J. Mycol. 1975, 3, 31–36. [Google Scholar]
  11. Marasas, W.F.O.; Kriek, N.P.J.; Fincham, J.E.; van Rensburg, S.J. Primary liver cancer and oesophageal basal cell hyperplasia in rats caused by Fusarium moniliforme. Int. J. Cancer 1984, 34, 383–387. [Google Scholar] [CrossRef] [PubMed]
  12. Delwiche, S.R. Classification of scab- and other mold-damaged wheat kernels by near-infrared reflectance spectroscopy. Trans. ASAE. 2003, 46, 731–738. [Google Scholar] [CrossRef]
  13. Ren, Y.; Zhang, Y.; Shao, S.; Cai, Z.; Feng, L.; Pan, H.; Wang, Z. Simultaneous determination of multi-component mycotoxin contaminants in foods and feeds by ultra-performance liquid chromatography tandem mass spectrometry. J. Chromatogr. A 2007, 1143, 48–64. [Google Scholar] [CrossRef] [PubMed]
  14. Trenholm, H.L.; Warner, R.M.; Prelusky, D.B. Assessment of extraction procedures in the analysis of naturally contaminated grain products for deoxynivalenol (vomitoxin). J. AOAC 1985, 68, 645–649. [Google Scholar]
  15. Scott, P.M.; Kanhere, S.R.; Tarter, E.J. Determination of nivalenol and deoxynivalenol in cereals by electron-capture gas chromatography. J. AOAC 1986, 69, 889–893. [Google Scholar]
  16. Tacke, B.K.; Casper, H.H. Determination of deoxynivalenol in wheat, barley, and malt by column cleanup and gas chromatography with electron capture detection. J. AOAC Int. 1996, 79, 472–475. [Google Scholar] [PubMed]
  17. Scott, P.M.; Lau, P.Y.; Kanhere, S.R. Gas chromatography with electron capture and mass spectrometric detection of deoxynivalenol in wheat and other grains. J. AOAC 1981, 64, 1364–1371. [Google Scholar]
  18. Usleber, E.; Schneider, E.; Märtlbauer, E.; Terplan, G. Two formats of enzyme immunoassay for 15-acetyldeoxynivalenol applied to wheat. J. Agric. Food Chem. 1993, 41, 2019–2023. [Google Scholar] [CrossRef]
  19. Abramson, D.; Clear, R.M.; Usleber, E.; Gessler, R.; Nowicki, T.W.; Märtlbauer, E. Fusarium species and 8-keto-trichothecene mycotoxins in Manitoba barley. Cereal Chem. 1998, 75, 137–141. [Google Scholar] [CrossRef]
  20. De Girolamo, A.; Cervellieri, S.; Visconti, A.; Pascale, M. Rapid Analysis of Deoxynivalenol in Durum Wheat by FT-NIR Spectroscopy. Toxins 2014, 6, 3129–3143. [Google Scholar] [CrossRef] [PubMed]
  21. Hart, J.R.; Norris, K.H.; Golumbic, C. Determination of the moisture content of seeds by near-infrared spectrophotometry of their methanol extracts. Cereal Chem. 1962, 39, 94–99. [Google Scholar]
  22. Wold, H. Path Models with Latent Variables: The NIPALS Approach. In Quantitative Sociology: International Perspectives on Mathematical and Statistical Modeling; Blalock, H.M., Aganbegian, A., Borodkin, F.M., Boudon, R., Capecchi, V., Eds.; Academic Press: New York, NY, USA, 1975; pp. 307–357. [Google Scholar]
  23. Wold, S.; Sjostrom, M.; Eriksson, L. PLS-Regression: a Basic Tool of Chemometrics. Chemometr. Intell. Lab. 2001, 58, 109–130. [Google Scholar] [CrossRef]
  24. Han, I.S.; Kim, M.; Lee, C.H.; Cha, W.; Ham, B.K.; Jeong, J.H.; Lee, H.; Chung, C.B.; Han, C. Application of Partial Least Squares Methods to a Terephthalic Acid Manufacturing Process for Product Quality Control. Korean J. Chem. Eng. 2003, 20, 977–984. [Google Scholar] [CrossRef]
  25. Han, I.S.; Han, C. Modeling of Multistage Air-Compression Systems in Chemical Processes. Ind. Eng. Chem. Res. 2003, 42, 2209–2218. [Google Scholar] [CrossRef]
  26. Han, I.S.; Han, C.; Chung, C.B. Melt Index Modeling with Support Vector Machines, Partial Least Squares, and Artificial Neural Networks. J. Appl. Polym. Sci. 2004, 95, 967–974. [Google Scholar] [CrossRef]
  27. Lee, K.J.; Hruschka, W.R.; Abbott, J.A.; Noh, S.H.; Park, B.S. Predicting the soluble solids of apples by near infrared spectroscopy(II)-PLS and ANN moddels. J. Korean Soc. Agric. Mach. 1998, 23, 571–582. [Google Scholar]
  28. Son, J.R.; Lee, K.J.; Kang, S.W.; Yang, G.M.; Seo, Y.W. Development of prediction model for sugar content of strawberry using NIR spectroscopy. Food Eng. Prog. 2009, 13, 297–301. [Google Scholar]
  29. Alexandrakis, D.; Downey, G.; Scannell, A.G.M. Detection and identification of bacteria in an isolated system with near-infrared spectroscopy and multivariate analysis. J. Agric. Food Chem. 2008, 56, 3431–3437. [Google Scholar] [CrossRef] [PubMed]
  30. Hwang, I.G. Development of On-Line Apple (Fuji) Sorting System by the Soluble Solid and Acid Contents Using VIS/NIR Spectroscopy. Ph.D. Thesis, Seoul National University, Seoul, Korea, 2000. [Google Scholar]
Figure 1. Geographic locations and numbers of hulled barley, naked barley, and wheat used in the experiments from each location. Sample groups marked with an asterisk (*) are control groups.
Sensors 18 00113 g001
Figure 2. A schematic diagram of the near infrared reflectance spectroscopy (NIRS) measurement system for the discrimination of Fusarium contamination of cereals.
Sensors 18 00113 g002
Figure 3. Bifurcated fiber-optic probe and light illumination in near infrared reflectance (NIR) spectrum acquisition for hulled barley, naked barley, and wheat.
Sensors 18 00113 g003
Figure 4. Culture results for hulled barley (GB3-C) in the control group, showing that the Fusarium spore was not observed.
Sensors 18 00113 g004
Figure 5. Culture results for hulled barley (GN9) in the experimental group, showing that the Fusarium spore was observed. The hulled barley samples that generated spores were marked by red squares.
Sensors 18 00113 g005
Figure 6. Culture results for naked barley (GG2-C) in the control group, showing that the Fusarium spore was observed. The naked barley samples that generated spores were marked by red squares.
Sensors 18 00113 g006
Figure 7. Culture results for naked barley (GN4) in the experimental group, showing that the Fusarium spore was observed. The naked barley samples that generated spores were marked by red squares.
Sensors 18 00113 g007
Figure 8. Culture results for wheat (GW1) in the control group, showing that the Fusarium spore was not observed.
Sensors 18 00113 g008
Figure 9. Culture results for wheat (GN2) in the control group, showing that the Fusarium spore was observed. The wheat samples that generated spores were marked by red squares.
Sensors 18 00113 g009
Figure 10. All of the NIR reflectance spectra of hulled barley samples not contaminated with Fusarium (NCF) (a) and contaminated Fusarium (CF) (b).
Sensors 18 00113 g010
Figure 11. All NIR reflectance spectra of naked barley samples NCF (a) and CF (b).
Sensors 18 00113 g011
Figure 12. All NIR reflectance spectra of wheat samples NCF (a) and CF (b).
Sensors 18 00113 g012
Figure 13. Validation results for Fusarium discrimination of the PLS-DA model developed using raw reflectance spectra (a) and the third-order derivative pretreatment (b) obtained from hulled barley.
Sensors 18 00113 g013
Figure 14. Validation results for Fusarium discrimination of the PLS-DA model developed using raw reflectance spectra (a) and the third-order derivative pretreatment (b) obtained from naked barley.
Sensors 18 00113 g014
Figure 15. Validation results for the Fusarium discrimination of the PLS-DA model developed using raw reflectance spectra (a) and the second-order derivative pretreatment (b) obtained from wheat.
Sensors 18 00113 g015
Table 1. Pictures and quantity of hulled barley, naked barley, and wheat samples.
GrainsGeographic LocationsGroupQuantityPictures
Hulled barleyGyeongsangbuk-do (Yeongdeok-gun)GB3-C *135 Sensors 18 00113 i001 Sensors 18 00113 i002
Gyeongsangbuk-do (Gyeongju-si)GB5148 Sensors 18 00113 i003 Sensors 18 00113 i004
Gyeongsangnam-do (Changnyeong-gun)GN9134 Sensors 18 00113 i005 Sensors 18 00113 i006
Jeollabuk-do (Iksan-si)JB11159 Sensors 18 00113 i007 Sensors 18 00113 i008
Jeollabuk-do (Gimje-si)JB9149 Sensors 18 00113 i009 Sensors 18 00113 i010
Jeollanam-do (Yeonggwang-gun)JN8146 Sensors 18 00113 i011 Sensors 18 00113 i012
Chungcheongnam-do (Taean-gun)CN2125 Sensors 18 00113 i013 Sensors 18 00113 i014
Naked barleyGyeonggi-do (Hwaseong-si)GG2-C *163 Sensors 18 00113 i015 Sensors 18 00113 i016
Jeollanam-do (Hampyeong-gun)JN13200 Sensors 18 00113 i017 Sensors 18 00113 i018
Gyeongsangnam-do (Gimhae-si)GN4199 Sensors 18 00113 i019 Sensors 18 00113 i020
WheatGangwon-do (Donghae-si)GW1-C *145 Sensors 18 00113 i021 Sensors 18 00113 i022
Jeollabuk-do (Gimje-si)JB11125 Sensors 18 00113 i023 Sensors 18 00113 i024
Gyeongsangnam-do (Milyang-si)GN2123 Sensors 18 00113 i025 Sensors 18 00113 i026
* Control group.
Table 2. Culture results for control group and experimental group of hulled barley, naked barley, and wheat samples contaminated with Fusarium.
Types of Grain(a) Primary Culture Results (1) NCF + 2) CF = Sum)(b) Secondary Culture Results (NCF + CF = Sum)
Hulled barleyGB3-C *135 + 0 = 135135 + 0 = 135
GB5 147 + 1 = 148147 + 1 = 148
GN939 + 95 = 13428 + 106 = 134
JB11158 + 1 = 159159 + 0 = 159
JB9107 + 42 = 149123 + 26 = 149
JN8117 + 29 = 146131 + 15 = 146
CN2114 + 11 = 125123 + 2 = 125
Naked barleyGG2-C *163 + 0 = 163149 + 14 = 163
JN13166 + 34 = 200188 + 12 = 200
GN4172 + 27 = 199178 + 21 = 199
WheatGW1-C *145 + 0 = 145145 + 0 = 145
JB1125 + 100 = 12592 + 33 = 125
GN273 + 50 = 12360 + 63 = 123
1) NCF: Not contaminated with Fusarium; 2) CF: Contaminated with Fusarium; * Control group.
Table 3. Performance of the partial least square discrimination analysis (PLS-DA) calibration and validation models for Fusarium-contaminated hulled barley samples, as well as the classification accuracy for normal and contaminated hulled barley, naked barley, and wheat.
Pretreatment1) PCPerformances of CalibrationPerformances of Validation
2) Rc23) SEC4) CCR (%)5) Rv26) SEPCCR (%)
NCFCFNCFCF
Hulled barley
Non-pretreatment160.8880.16710099.560.8810.17210099.44
1st order Derivative110.9180.1431001000.9110.14910099.56
2nd order Derivative100.9500.11210099.780.9460.11610099.78
3rd order Derivative90.9340.12810099.890.9280.13410099.89
Mean 7) Nor130.8630.18598.5299.000.8550.19098.5298.89
Maximum Nor130.8550.19098.5299.000.8460.19698.1598.78
Range Nor140.8690.18198.8999.110.8600.18798.7799.00
8) MSC120.8350.20398.0299.110.8260.20897.9098.78
Baseline150.8750.17710099.440.8680.18299.8899.22
9) SNV130.8360.20297.9099.110.8270.20897.9098.78
Naked barley
Non-pretreatment130.8680.14099.8998.990.8590.14599.8998.48
1st order Derivative100.9390.0951001000.9320.101100100
2nd order Derivative70.9440.0911001000.9410.093100100
3rd order Derivative70.9500.0861001000.9480.088100100
Mean Nor120.8100.16899.2298.990.8000.17499.2298.99
Maximum Nor130.8100.17099.2298.990.7920.17699.2298.99
Range Nor130.8070.16999.2298.990.7920.17699.2298.99
MSC110.7770.18299.3398.990.7580.19098.9998.48
Baseline130.8650.14299.8998.990.8550.14799.8998.48
SNV120.7810.18199.3398.480.7630.18899.1198.48
Wheat
Non-pretreatment120.9080.14999.661000.9000.15599.6699.83
First-order Derivative80.9230.1361001000.9090.14710099.83
Second-order Derivative70.9410.1191001000.9330.12710099.83
Third-order Derivative50.9160.14110099.830.9110.14610099.83
Mean Nor90.9390.12199.8999.830.9340.12699.8999.83
Maximum Nor100.9330.12799.8999.830.9280.13299.8999.83
Range Nor100.9280.13199.541000.9210.13899.5499.83
MSC90.9120.14599.541000.9060.15099.5499.65
Baseline130.9090.14799.891000.9010.15499.8999.65
SNV100.9130.14499.541000.9080.14999.5499.65
1) PC: Principle component number; 2) Rc2: Coefficient of determination for calibration; 3) SEC: Standard error of calibration; 4) CCR: Correct classification rate; 5) Rv2: Coefficient of determination for validation; 6) SEP: Standard error of prediction; 7) Nor: Normalization; 8) MSC: Mean scattering correction; 9) SNV: Standard normal variate.

