Autonomous Sensors Powered by Energy Harvesting from von Karman Vortices in Airflow


1
Department of Information Engineering, University of Brescia, Via Branze 38, 25123 Brescia, Italy
2
Department of Mechanical and Industrial Engineering, University of Brescia, Via Branze 38, 25123 Brescia, Italy
*
Author to whom correspondence should be addressed.
Sensors 2017, 17(9), 2100; https://doi.org/10.3390/s17092100
Submission received: 3 August 2017
/
Revised: 5 September 2017
/
Accepted: 8 September 2017
/
Published: 13 September 2017
(This article belongs to the Special Issue Energy Harvesting Sensors for Long Term Applications in the IoT Era)
Abstract
:In this paper an energy harvesting system based on a piezoelectric converter to extract energy from airflow and use it to power battery-less sensors is presented. The converter is embedded as a part of a flexure beam that is put into vibrations by von Karman vortices detached from a bluff body placed upstream. The vortex street has been investigated by Computational Fluid Dynamics (CFD) simulations, aiming at assessing the vortex shedding frequency as a function of the flow velocity. From the simulation results the preferred positioning of the beam behind the bluff body has been derived. In the experimental characterization the electrical output from the converter has been measured for different flow velocities and beam orientations. Highest conversion effectiveness is obtained by an optimal orientation of the beam, to exploit the maximum forcing, and for flow velocities where the repetition frequency of the vortices allows to excite the beam resonant frequency at its first flexural mode. The possibility to power battery-less sensors and make them autonomous has been shown by developing an energy management and signal conditioning electronic circuit plus two sensors for measuring temperature and flow velocity and transmitting their values over a RF signal. A harvested power of about 650 μW with retransmission intervals below 2 min have been obtained for the optimal flow velocity of 4 m/s.
1. Introduction
Energy harvesting from von Karman vortices can prove effective since vortices behind obstacles in a flow represent an ideal forcing for a vibrating energy harvester. The vortices are obtained from a conversion of a unidirectional flow into an alternate velocity field [1,2,3,4,5,6].
Energy harvesting from von Karman vortices has been studied in recent years to demonstrate and optimize this possibility. Various configurations and energy converters from flows in different fluids, air or liquid, have been investigated. In several works, flexible piezoelectric membranes in the wake of a bluff body were used as the converter. In particular, it was demonstrated that the optimal condition to harvest energy is obtained when the shedding frequency of the vortices matches the fundamental frequency of the membrane [7]. The flapping dynamics of a piezoelectric membrane in a wake of a square cylinder were studied in [8,9], in terms of flapping modes, amplitude, frequency, and strain distribution along the membrane length. Different bluff body shapes, such as cylinder or parallelepiped with triangular section, have been extensively investigated demonstrating good efficacy in the generation of vortices [7,8,10,11,12]. The oscillations and the energy harvesting effectiveness of a piezoelectric beam element in the wake of a cylinder were extensively investigated in [10,13]. The best performances were obtained when the vortices induce resonance in a beam placed at an optimal positioning, i.e., with the tip of the beam at a distance of about two cylinder diameters downstream of the cylinder in the center line. The possibility to improve the harvested energy by exploiting the proximity effects of multiple vibrating harvesters has been investigated in [3,14]. An example of energy harvesting from von Karman vortices in a liquid water flow was presented in [15], where pressure variations were used to generate a periodic displacement of a magnet connected to a membrane as a part of the pipe wall. The produced movement of the magnet was exploited to generate electrical power by means of the relative motion between the magnet and a coil. A wide review of energy harvesting devices that exploit flow induced vibrations and of their possible application on aerospace vehicles was presented in [16]. Proof-of-concept preliminary experiments of autonomous sensors powered by energy harvesting from vortices in airflow were presented in [17].
This paper innovatively presents the design, analysis, and experimental validation of a complete energy harvesting system that exploits von Karman vortices. The energy harvester is composed of a bluff body and a flexure beam with an embedded piezoelectric converter. The beam is placed behind the bluff body to collect the alternate forcing in the vortex street. The analysis has focused on the beam orientations, to exploit the maximum alternate forcing, and the conversion effectiveness as a function of the flow velocity, i.e., the repetition frequency of the vortices and the magnitude of the alternate forcing. The aim of this work is to demonstrate the possibility to successfully power autonomous, i.e., battery-less, sensors that measure the flow properties and send data over a wireless Radio-Frequency (RF) link. The proposed configuration can be used, for example, to realize self-powered Wireless Sensor Networks (WSNs), and several applications may be identified, for instance, in the environmental monitoring or structural health monitoring in critical positions where batteries are difficult to replace, in the general framework of the Internet of Things (IoT) scenario.
The energy harvester has been mounted in a wind tunnel system developed to obtain two specific possibilities, namely rotate the beam at different orientation angles with respect to the prevailing flow direction, and generate different flow velocities in the wind tunnel. In this way, the harvesting performances could be investigated as a function of the above two parameters. In fact, on the one hand, the orientation angle affects the interaction between the beam and the forcing pressure field. On the other hand, the repetition frequency of the vortices and the coupling with the beam mechanical resonance depend on the flow velocity. In order to perform the proposed investigations, initially the voltage from the converter has been measured and analyzed in both time and frequency domains. The harvesting performances have been first quantified by measuring the harvested power on a resistive load as a function of the flow velocity. Then the possibility to exploit the harvested energy to power autonomous sensors has been investigated. To this purpose, the converter has been connected to a tailored battery-less electronic circuit that accumulates the harvested energy and powers two sensors and a RF transmitter. When enough accumulated energy is available, the circuit triggers a measurement-plus-transmission cycle. Therefore, the system operates intermittently with repeated transmissions of a RF signal carrying data from the sensors from which information on the flow properties can be extracted.
2. Energy Harvesting System
2.1. System Description
As shown in Figure 1, a rectangular prism, with a width W, is placed in the airflow field acting as bluff body for the generation of the vortices. The rectangular cross-section for the bluff body has been chosen as an effective shape for the generation of von Karman vortices [8]. In addition, it represents a sufficiently generic obstacle, yet no optimization of the bluff body shape was considered within the scope of this work. The beam is placed in the vortex street behind the obstacle in order to undergo periodic excitation. The beam is composed of a bimorph piezoelectric converter (WAC3X/18) and of a blade profile with air-foil profile cross-section connected to the free end of the converter. The converter consists of a flat steel plate with lead zirconate titanate (PZT) films and electrode metal layers on both the surfaces [18]. Both the PZT films have a thickness of about 200 μm. The converter is clamped at one end to obtain a cantilever structure and it represents the flexural part of the beam, where the elastic response is concentrated. The blade is connected to the free end of the converter in order to increase coupling with the pressure filed generated by the flow in the vortex street. The blade is made of a rigid plastic which has an asymmetric air-foil profile cross-section.
The bluff body and the beam are mounted in a low-velocity wind tunnel creating a compact characterization system. The beam has been placed at a properly selected distance d behind the bluff body, in the center line, along which the maximum excitation of the beam is expected. The beam is connected to the shaft of a stepper motor by means of a fit-for-purpose clamp in order to vary the orientation of the blade surface with respect to the flow direction. The orientation angle θ is defined as the angle between the direction normal to the bluff body width W and the beam face, i.e., the plane of the blade.
2.2. Flow Simulations
An investigation of the von Karman street behind the proposed bluff body has been performed by Computational Fluid Dynamics (CFD) simulations. Before the subsequent experimental analysis, simulations have been carried out to obtain an estimation of the shedding frequency fu of the vortices as a function of the inlet flow velocity. The simulation analysis was intentionally performed without the beam placed in the flow, since a detailed description of the system with the beam requires a fluid-structure interaction study, which complexity is out of the scope of this paper. Despite the simplified approach, the CFD simulations retain full validity and substantial importance since neither the shedding frequency nor the von Karman street are influenced to a significant extent by the beam presence. Simulations have been performed on the two-dimensional middle horizontal cross-section of the wind tunnel. These simulations are representative of the investigated flow, since the turbulence allows neglecting the effect of the upper and bottom wind tunnel walls, which is confined within the boundary layer.
The large time-step transient solver pimpleFoam of the free software OpenFOAM, version 16.06, has been used to solve an incompressible flow using the k-ε turbulence model. The default model constants available in OpenFOAM have been employed together with the kqRWallFunction and epsilonWallFunction to describe k and ε at walls. The simulated cross-section has a width of 17.5 cm (about 3.5 W) and a length of 62 cm. The bluff body has been placed 25 cm after the inlet section. The inlet flow velocity u has been varied in the range between 2.0 and 7.0 m/s, which corresponds to the actual working condition of the wind tunnel. The frequency of the vortices has been calculated from the time evolution of the simulated velocity field observed at 90 mm downstream from the bluff body.
A grid refinement analysis has been performed to assess the convergence of the simulation results. The vortex shedding frequency fu has been adopted as the reference quantity to assess the grid convergence. The Grid Convergence Index (GCI) method, proposed by Roache [19], has been adopted. Three different structured grids have been employed: the coarsest one has a grid spacing of h3 = 4 mm, and the refinement ratio r = h3/h2 = h2/h1 = has been used to obtain a doubling of the cells number between successive grid steps. The maximum Courant number (CFL condition) has been set as unitary in all the simulations and the time step has been computed consequently. The analysis has been carried out for two different inlet flow velocities of 2.0 m/s and 7.0 m/s which respectively represent the minimum and the maximum values. This is because if the grid convergence is observed at the boundaries of the range of interest, then it is ensured within the whole range. Table 1 reports the vortex frequency fu computed for the three different grids. From these values the order of convergence p, the GCI2,3 between the medium and the coarse grids, and the GCI1,2 between the fine and the medium grids have been computed; a safety factor of 3 has been employed in computing the GCI, as suggested in [19]. The last column of Table 1 reports the relation between the GCIs, adopted to observe if the three checked grids are in the asymptotic range of convergence. Since the order of convergence p is about 3 and the GCIs report a low uncertainty on both the two couples of grids and the uncertainty is reduced as the grid is refined, then grid convergence is ensured. Moreover, the relation between the GCIs is near unity, which ensures the analyzed grids are within the asymptotic range of convergence. By the grid analysis results, the finest grid h1 = 2 mm has been adopted to perform all the simulations.
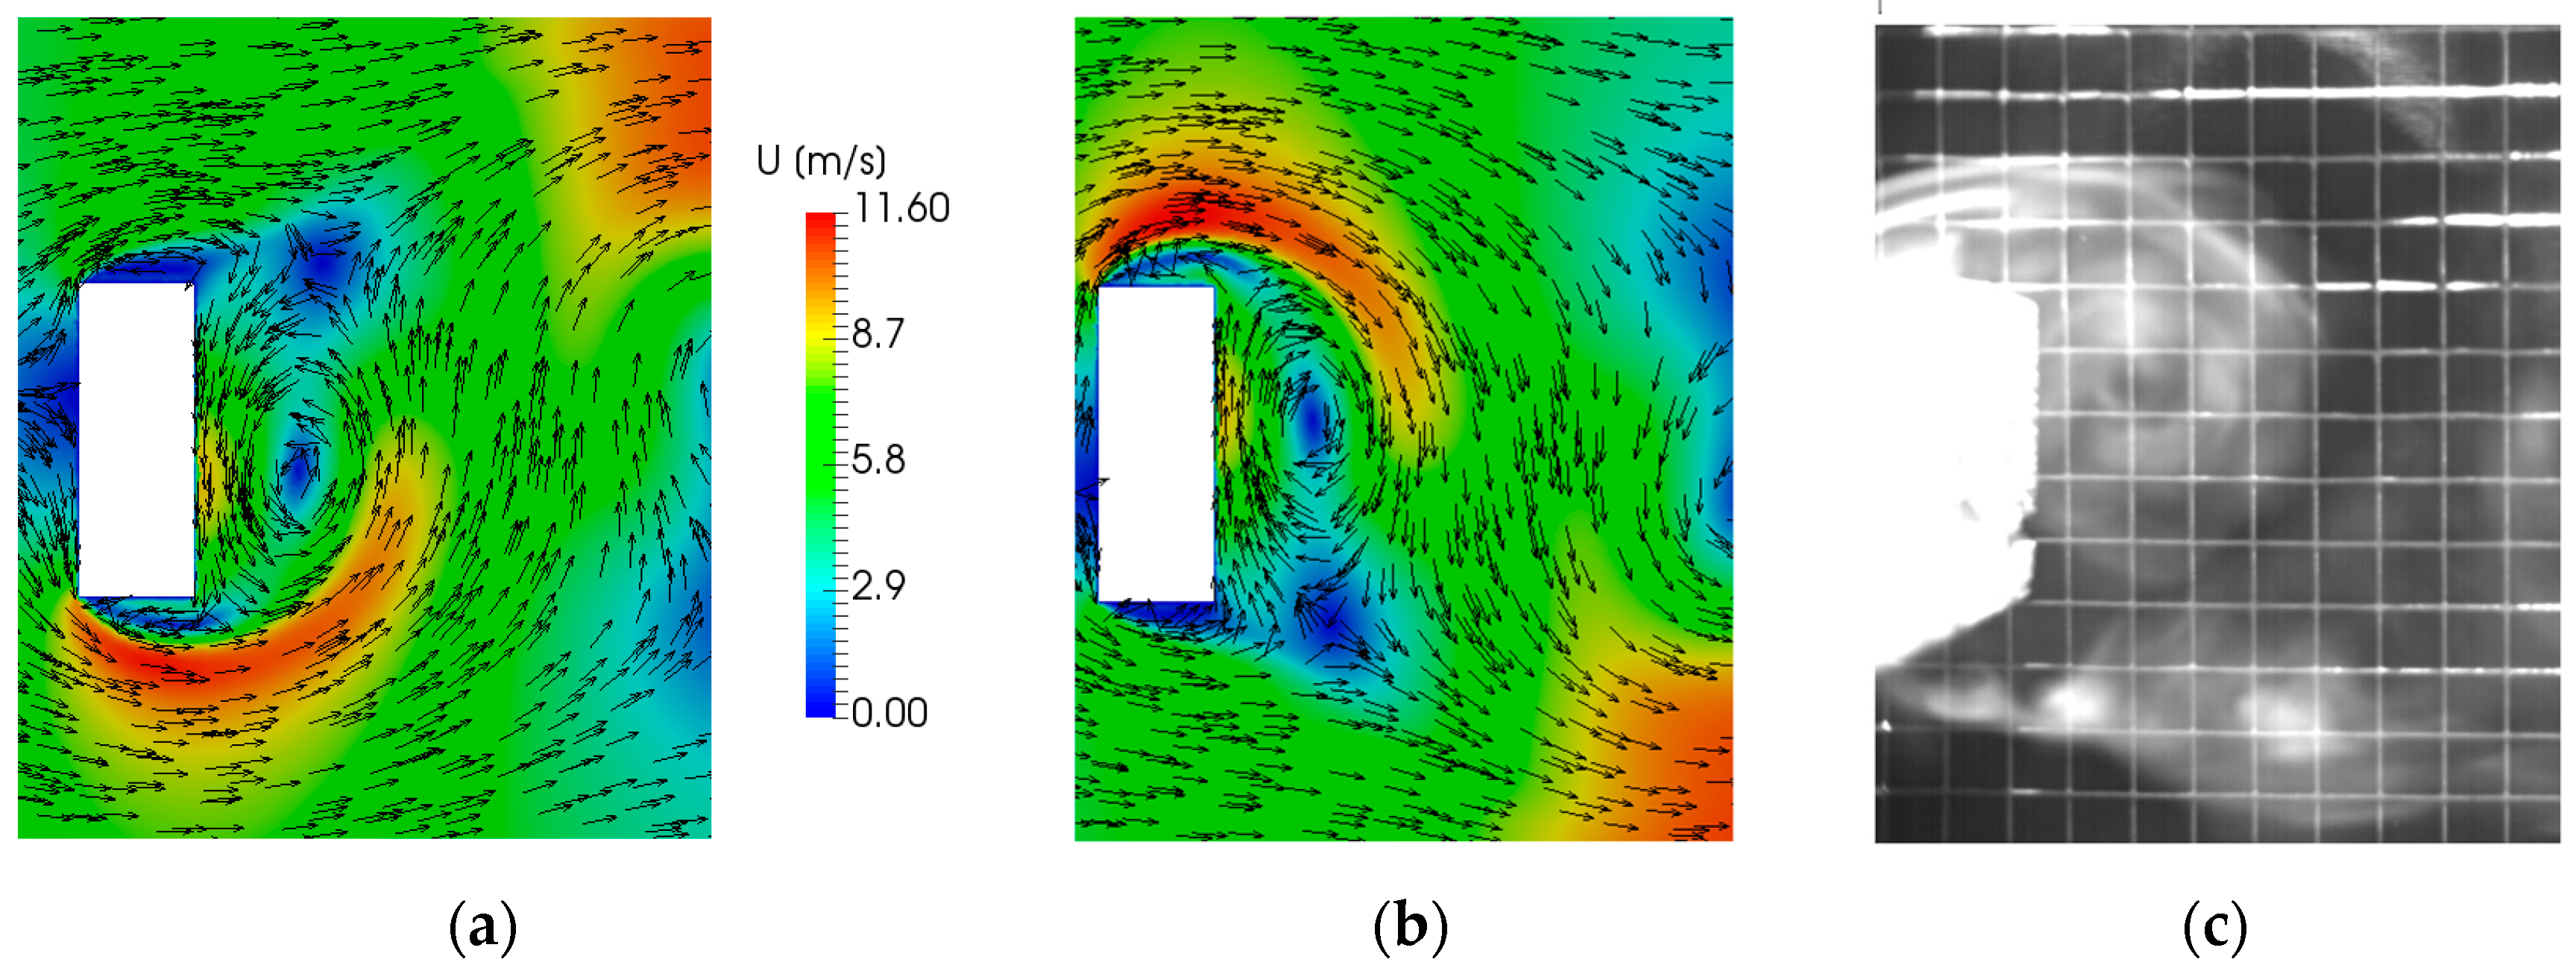
Figure 2a,b show the simulated flow velocity field in the vortex street correspondent to the generation of two subsequent vortices at the left and right edge of the bluff body, respectively. In addition, Figure 2c shows for comparison the smoke visualization image of the air streamline in the vortex region. A good agreement in the dimension and shape of the vortices can be observed.
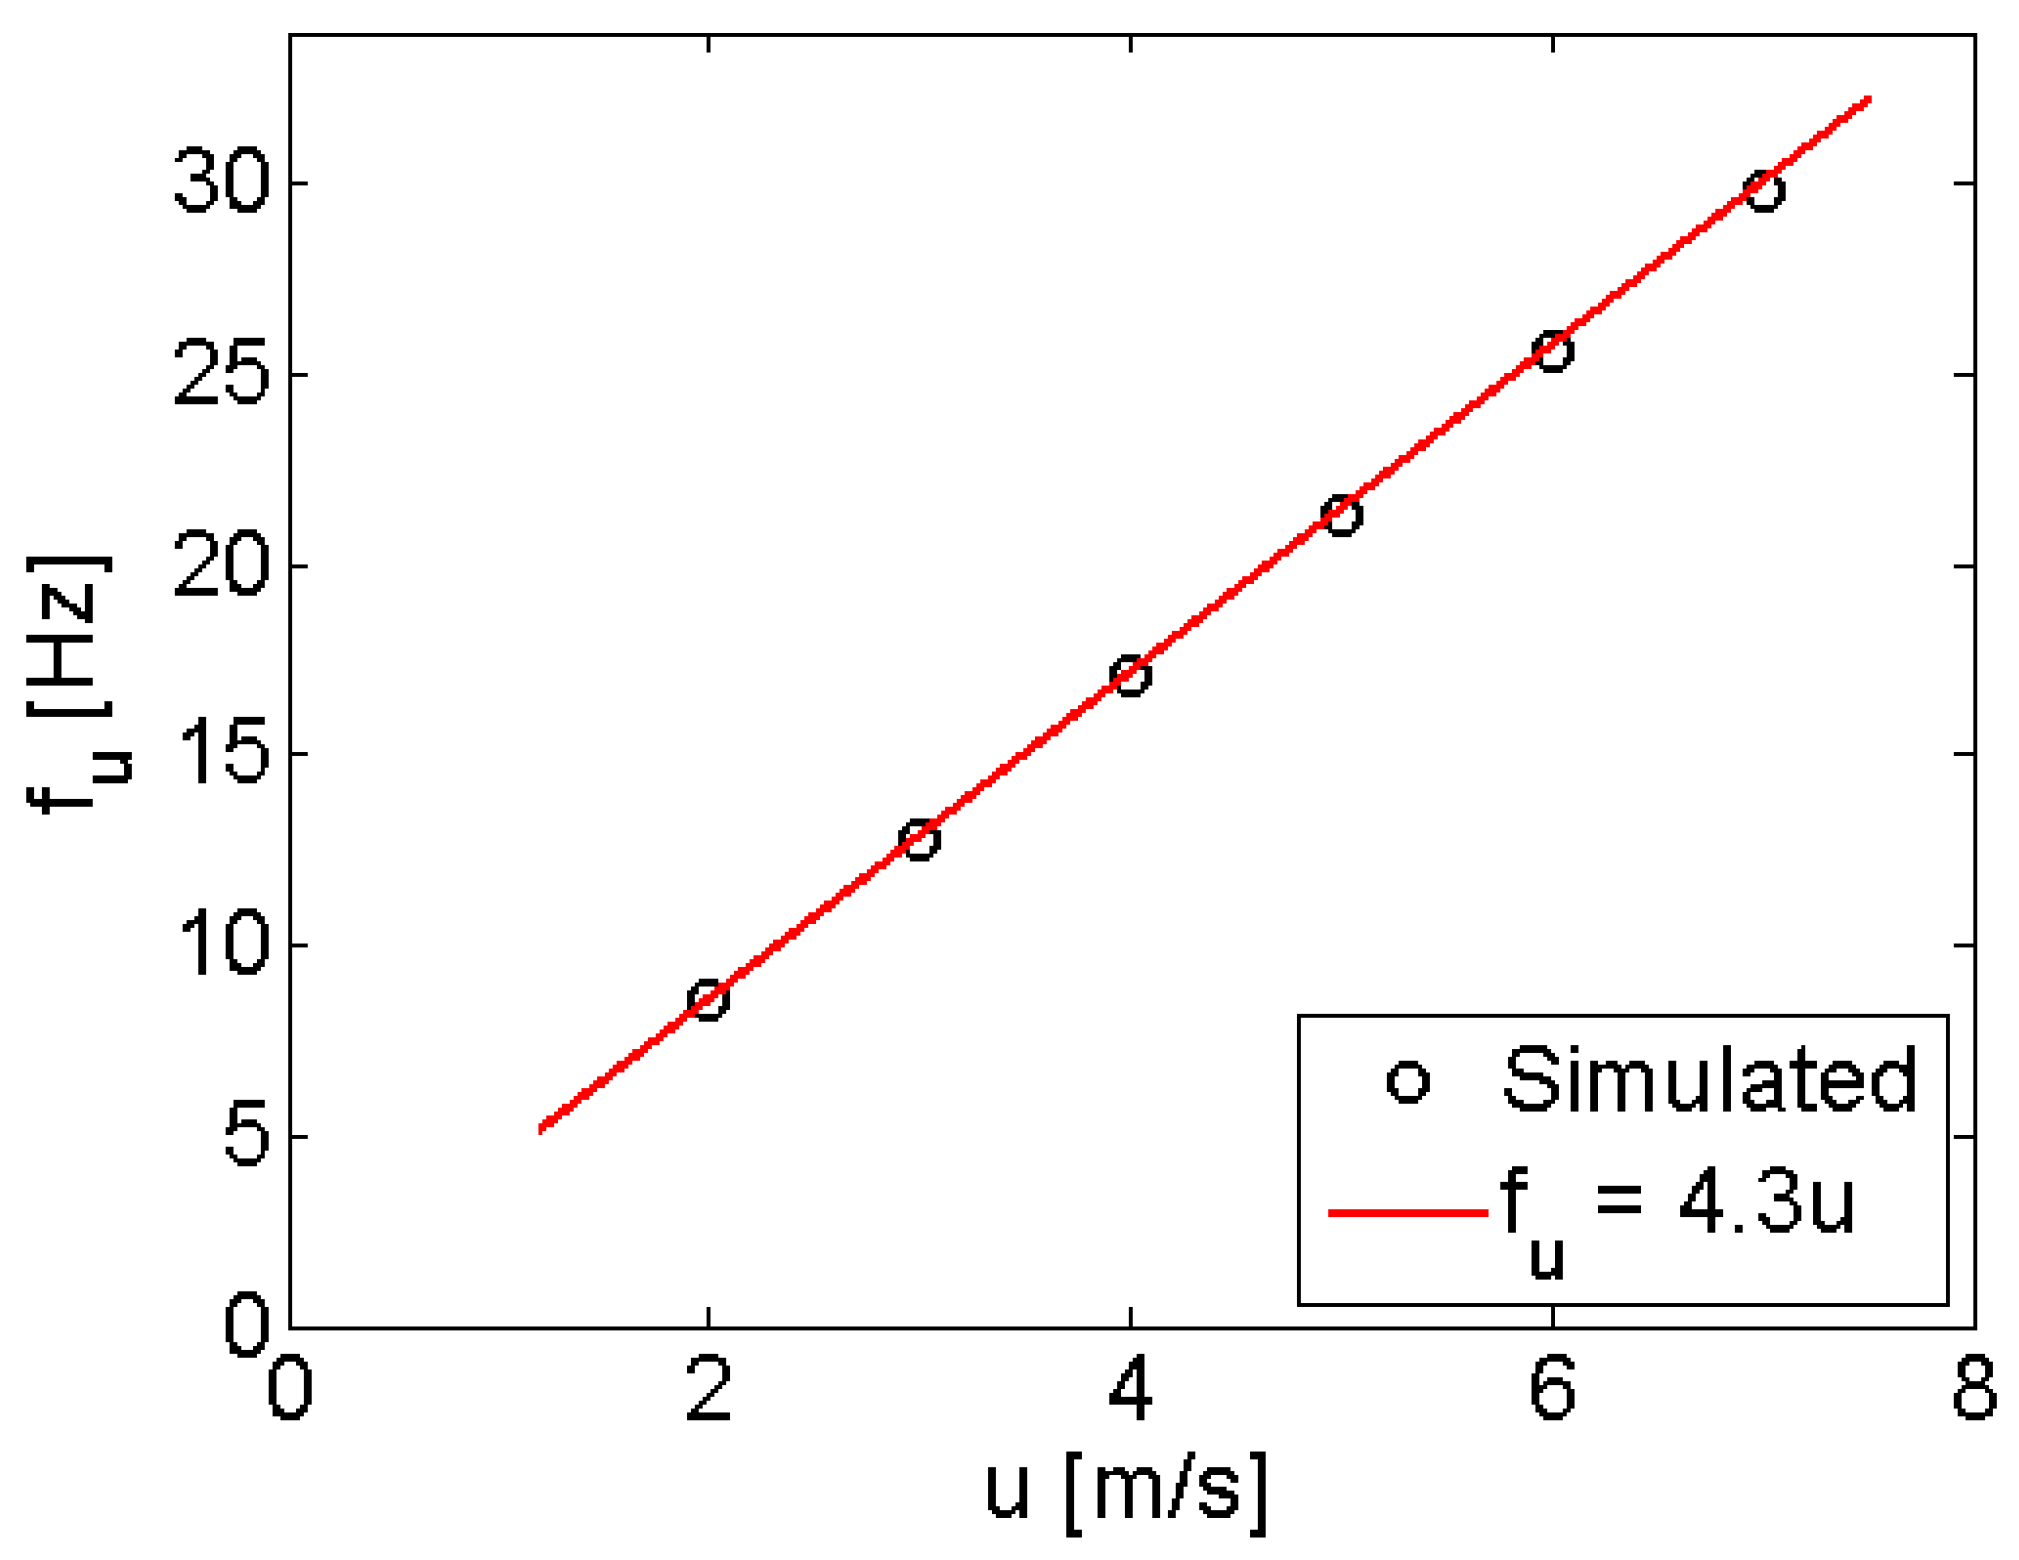
The flow in the vortex street consists of a periodic sequence of alternate vortices. Figure 3 reports the simulated shedding frequency fu of the vortices, as function of the inlet flow velocity. Results suggest linear relation between u and fu, in good agreement with the theoretical expectations since the shedding frequency fu of the vortices behind a bluff body with a characteristic dimension W, is linked to the inlet flow velocity u by:
where St is the Strouhal number [10,12,15,20] of the flow. From the linear interpolation of the fu values, shown in Figure 3, a Strouhal number Stsim ≈ 0.23 has been obtained from the CFD simulations.
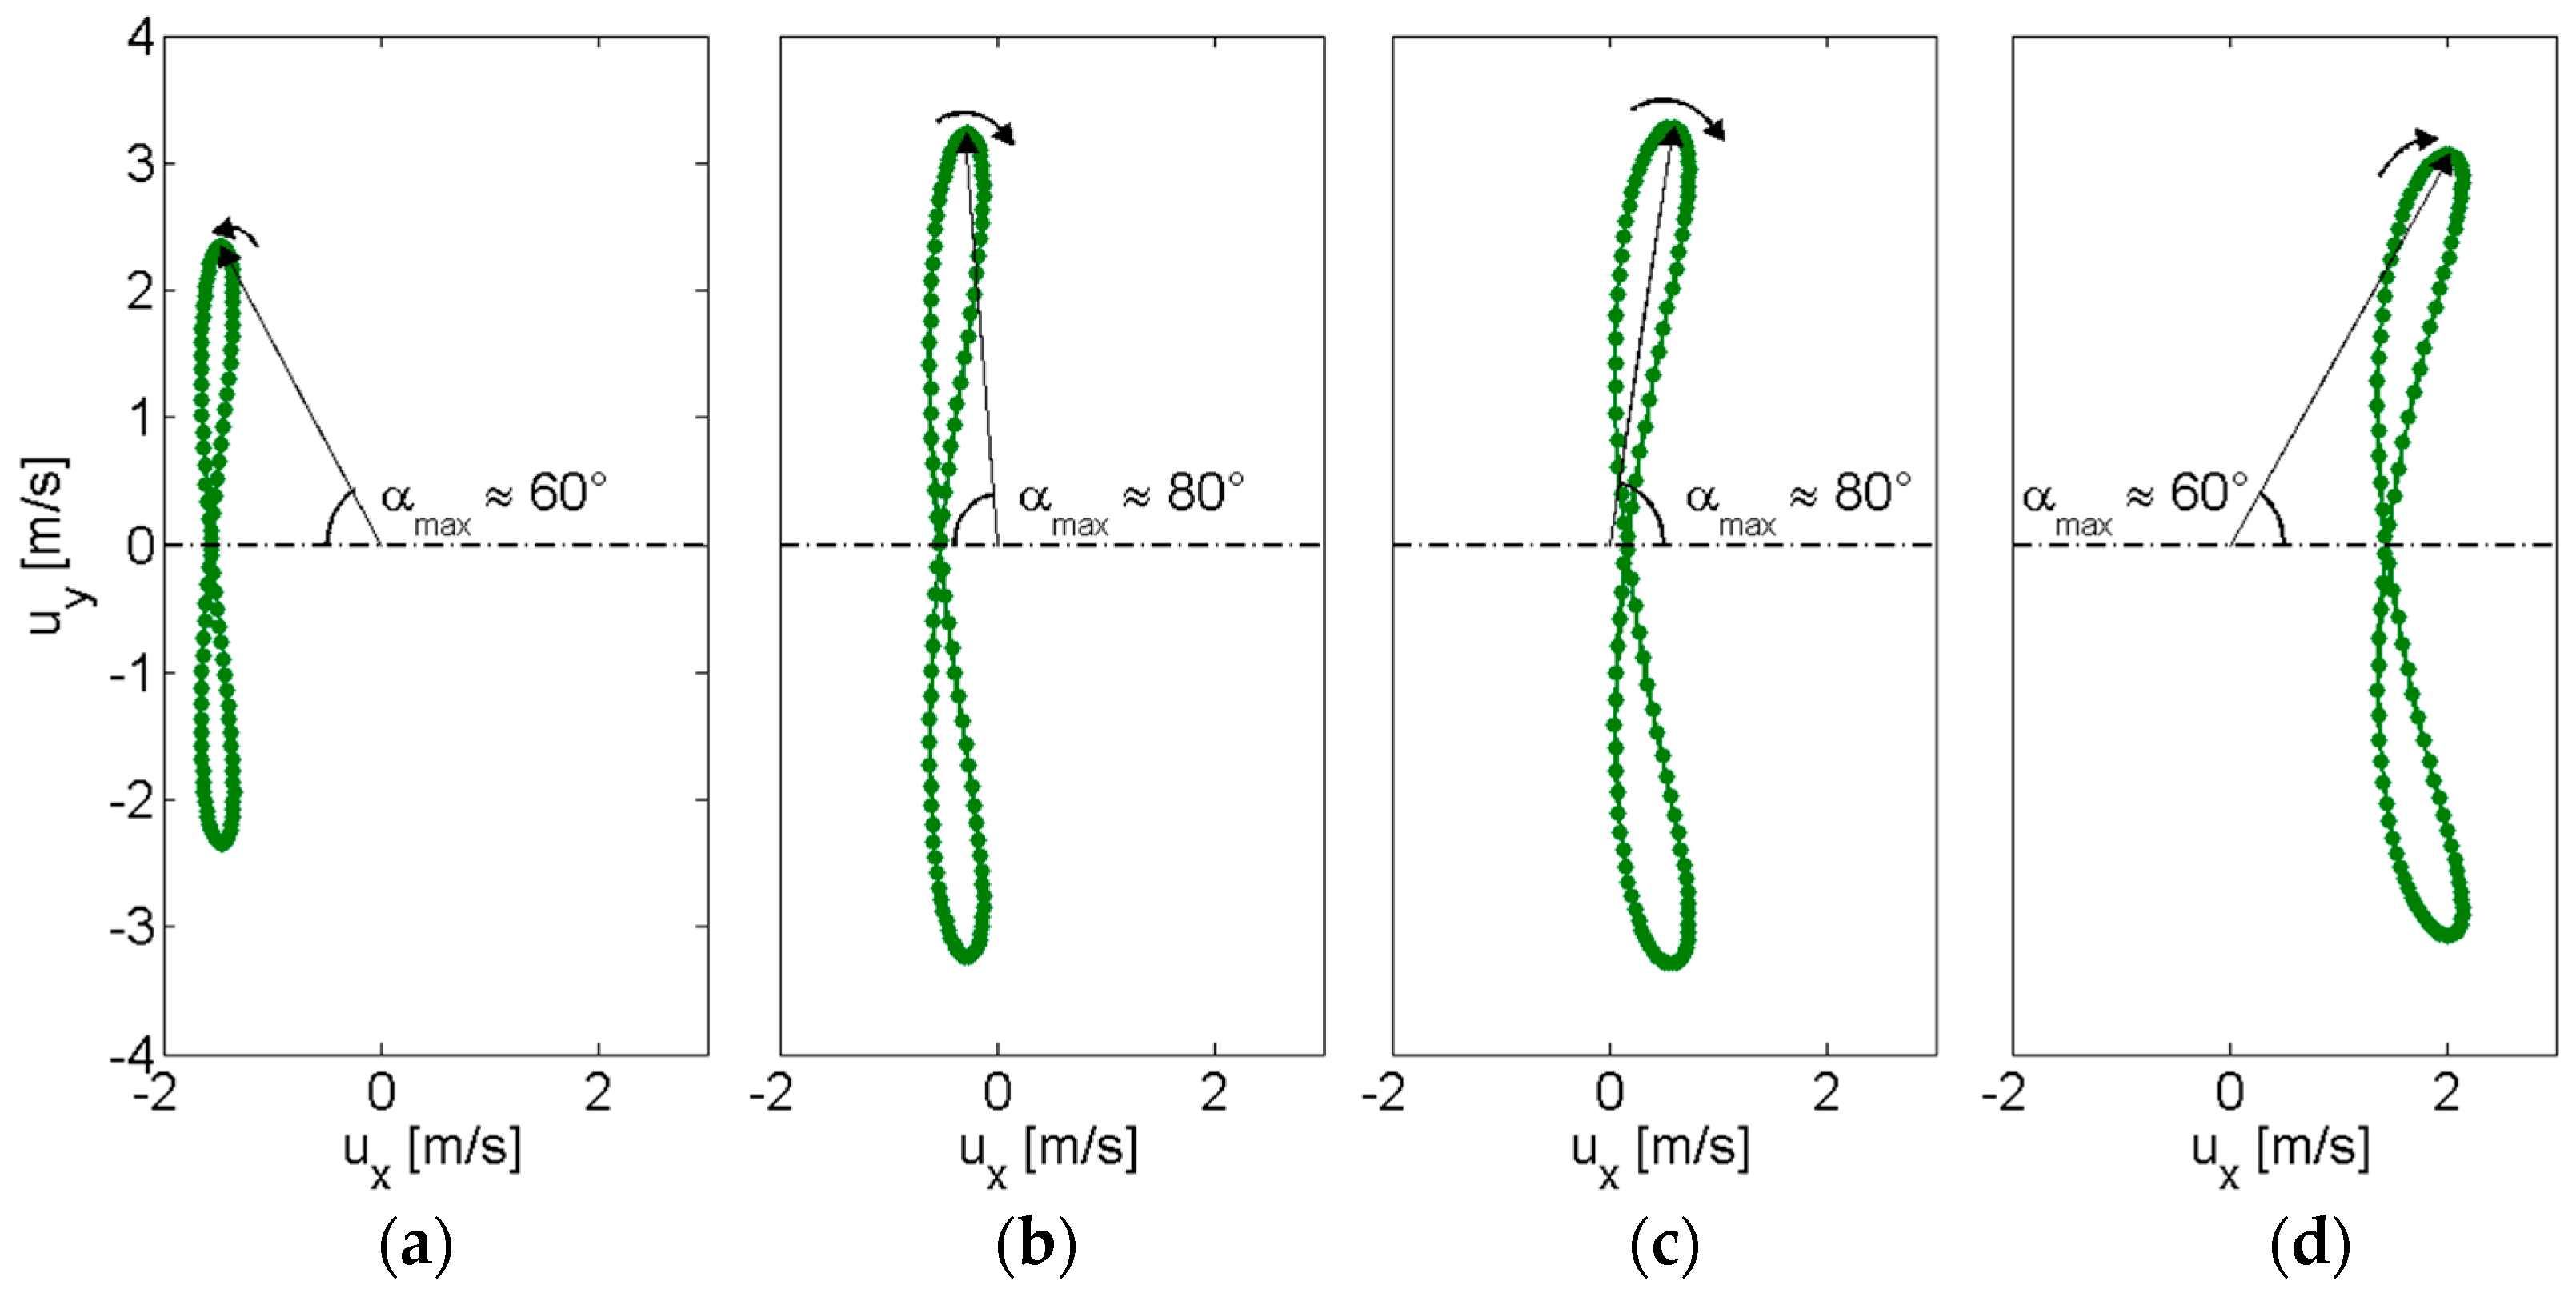
Besides a prediction of the working frequency range of the oscillating beam placed in the vortex street, numerical simulations can provide information on the preferred position behind the bluff body where the beam should be placed. The velocity components, ux and uy in the streamwise and spanwise directions, respectively, have been obtained by simulations at different positions behind the bluff body, namely 30, 70, 90, and 130 mm along the central axis. The inlet flow velocity of 5 m/s has been considered in all cases. The plots of Figure 4 report the loci of the velocity vectors obtained from the components ux and uy on the x-axis and on the y-axis, respectively, during a cycle composed by two subsequent vortices. Thus, the time evolution of the velocity vector magnitude and angle α between the central axis and the vector direction can be compared in the four positions.
For the two intermediate distances 70 mm (Figure 4b), and 90 mm (Figure 4c), both the velocity magnitude and the angle α present the maximum variations during the complete cycle, if compared to the other positions 30 mm (Figure 4a), and 130 mm (Figure 4d). In fact, together with the maximum variations of α in Figure 4b,c, which are about −80° < α < +80°, the velocity magnitude spans between 0.5 ÷ 3.3 m/s and 0.1 ÷ 3.4 m/s, respectively. Instead, at short distance behind the bluff body (Figure 4a), not only the magnitude variation, 1.6 ÷ 2.8 m/s, is lower, but also the same is true for the angle variation, namely about −60° < α < +60°. At this position a recirculation region is present behind the bluff body, as it can be observed by the negative value of ux. As the distance from the bluff body increases (Figure 4d, both and α variations decrease to 1.5 ÷ 3.7 m/s and −60° < α < +60°, respectively, since ux approaches the inlet flow velocity and uy reduces because of turbulent dissipation. The results suggest that the distance range between 70 and 90 mm are expected to provide an effective alternate forcing for a vibrating energy harvester due to the best combination between the magnitude variation and the angle variation taking place.
Following these considerations, the beam has been placed at d = 80 mm ≈ 1.5 W downstream from the bluff body. This choice is supported also by the results reported in [10], since 1.5 W represents a trade-off between the distance of two times the bluff body width, 2 W, and the distance of two hydraulic diameters of the rectangular section of the bluff body, 1.1 W.
2.3. Experimental Characterization
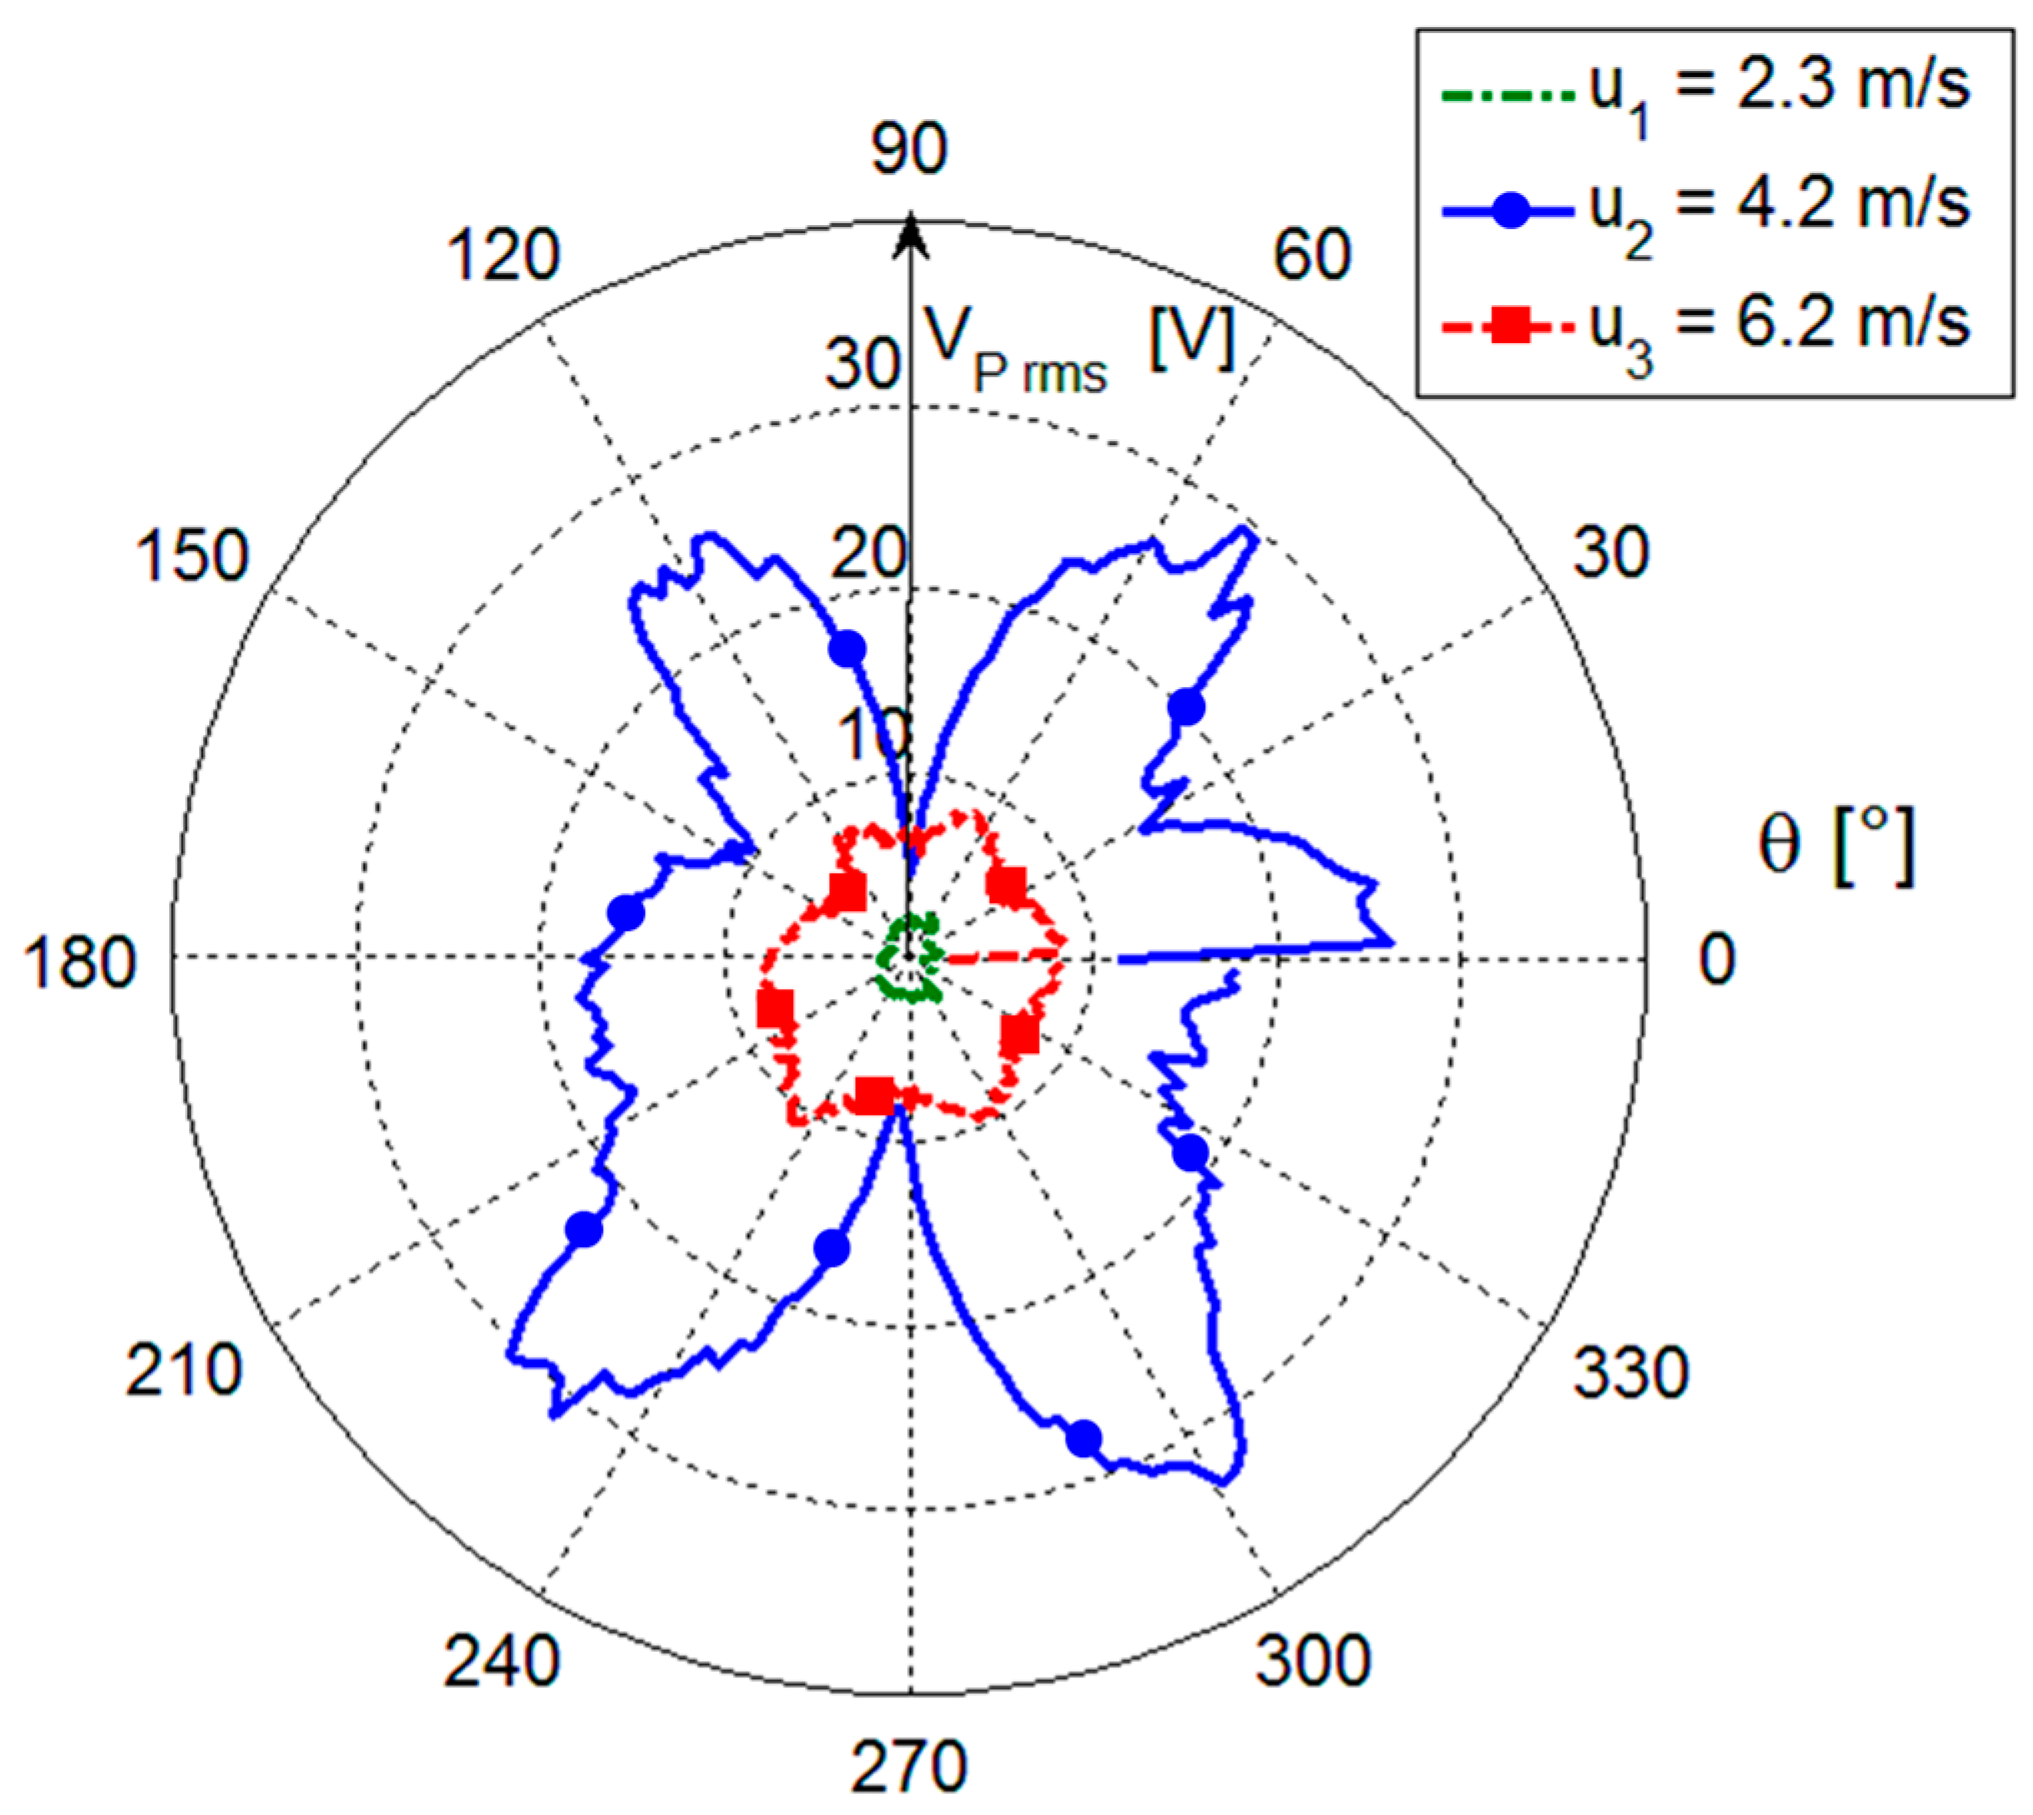
The converter open-circuit voltage VP, which is associated to the beam oscillations, has been measured for different beam orientations at three different flow velocities generated in the wind tunnel. The whole range of orientations of 360° has been divided in 200 steps leading to an angle resolution of 1.8°. For each step the voltage VP has been measured by using an MSO-X 3014A digital oscilloscope (Agilent, Santa Clara, CA, USA) with an input impedance of 10 MΩ in parallel with 15 pF that overall can be assumed as an open circuit load for the adopted piezoelectric converter that has an internal equivalent impedance composed of a capacitance CP ≈ 305 nF and a parallel resistor RP ≈ 250 kΩ as measured at 100 Hz by a HP4194 impedance analyzer (Hewlett-Packard, Palo Alto, CA, USA). The flow velocity has been measured by a 405-V1 hot wire anemometer (Testo SE & Co. KGaA, Lenzkirch, Germany) placed before the bluff body in the center of the initial section of the wind tunnel. The sensor has a velocity resolution of 0.1 m/s and an accuracy of ±0.3 m/s. In Figure 5 the rms values of VP measured on a time window of 20 s are shown as a function of the angle θ for three values of flow velocity, namely u1 = 2.3 m/s, u2 = 4.2 m/s and u3 = 6.2 m/s. As it can be observed, higher rms values are obtained when the orientation angles are about θ = 60°, 120°, 240° and 300°. This means that, for such orientations, the beam experiences a better coupling with the forcing pressure field. The slight deviations from perfect symmetry in specular orientations of the beam can be ascribed to the asymmetry of the blade profile.
Moreover, in Figure 5 it can be observed that the highest rms values of VP, of up to about 30 V, have been achieved for the intermediate velocity u2, with respect to the values below 10 V obtained for the other velocities. This would seem in contrast with the increasing flow intensity and turbulence with velocity progressively increasing from u1 to u3. The reason for the highest rms values of VP at the intermediate velocity u2 can be found in the repetition frequency of the vortices that at u2 becomes close to the resonant frequency fm of the beam first flexural mode, which is of about 13.6 Hz. As a consequence, under this condition, the vortices excite the beam generating larger oscillations compared to other flow velocities. In particular, this happens for u3, where, despite the higher velocity compared to u2, lower rms values are generated.
The effect of the vortex repetition frequency has been investigated by the analysis of the time and frequency behavior of the measured VP at the different flow velocities. Figure 6a shows the comparison of the voltages VP versus time for the three velocities u1, u2 and u3, obtained at the fixed orientation of θ = 300°. This comparison confirms that the higher magnitude of VP associated to the larger oscillations is obtained for the intermediate velocity, since the repetition frequency of the vortices excites the beam resonance. The trajectories in the phase plane [21] derived from the time records of VP are also reported in Figure 6b. For the piezoelectric element, the open-circuit output voltage VP and its time derivative dVP/dt are proportional to displacement and velocity, respectively [22]. The comparison of the phase plots show that quasi-periodic oscillations are obtained at u2, while for u1 and u3 sets of manifold trajectories are evident suggesting a more complex dynamical behavior.
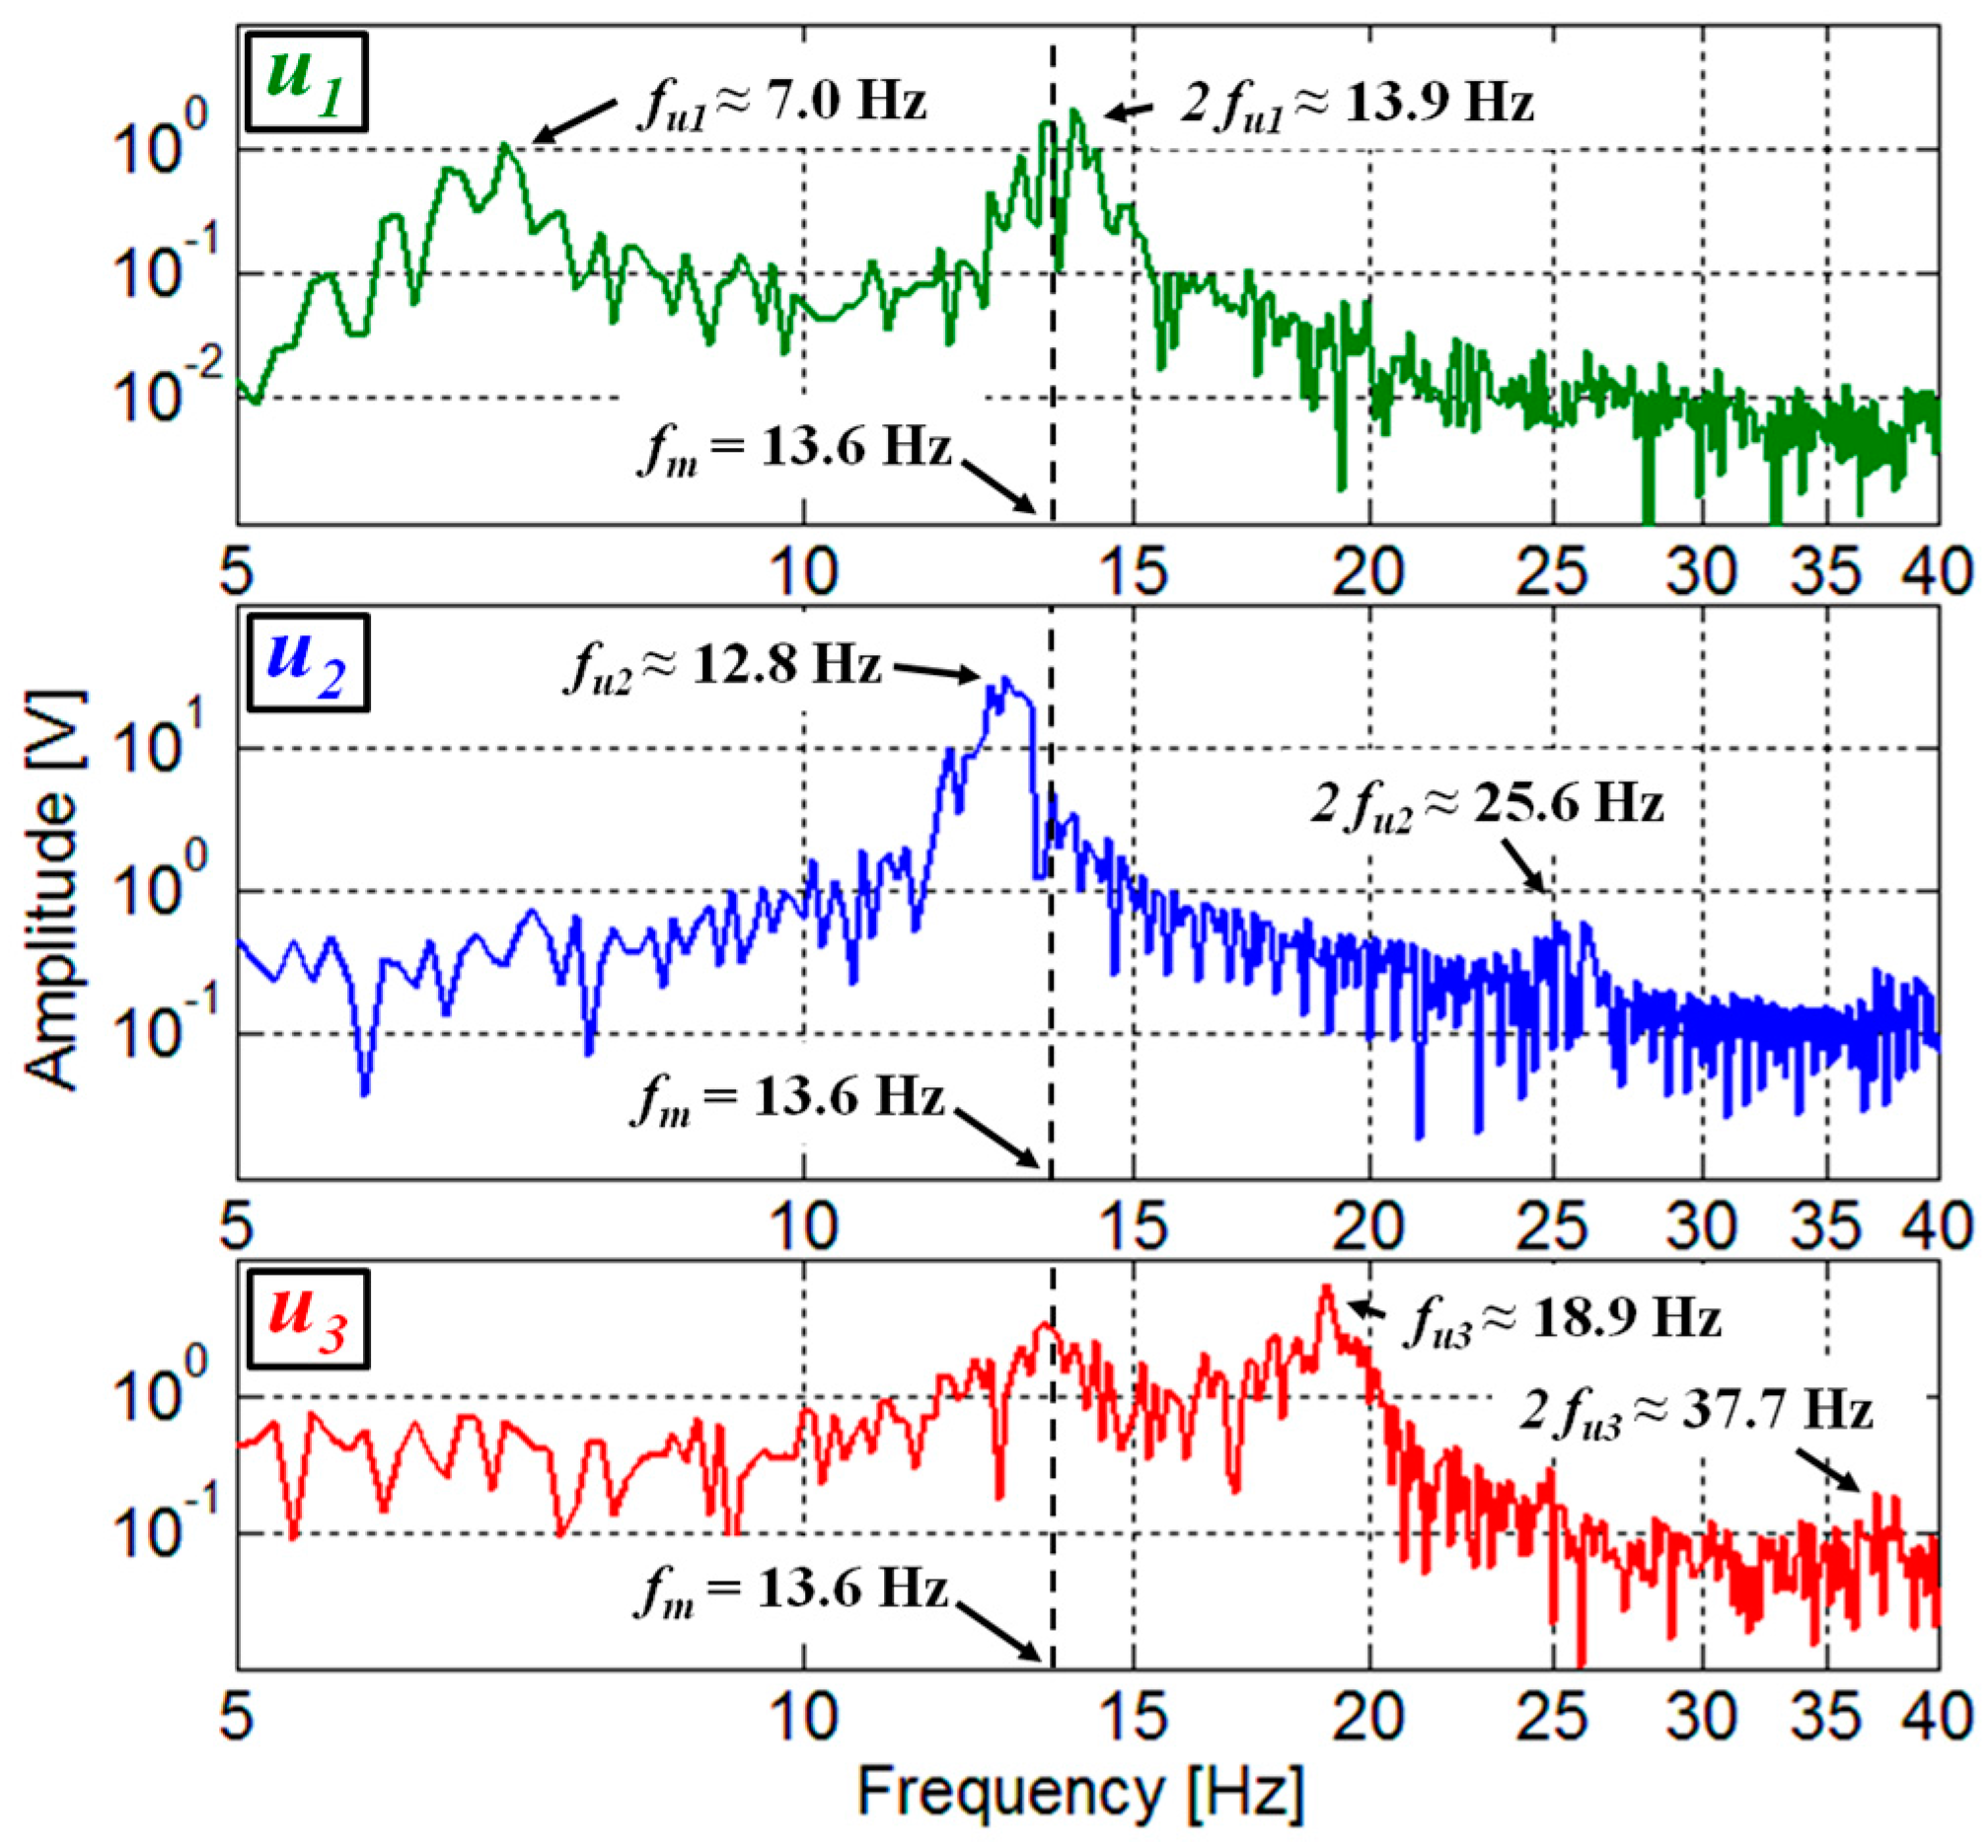
The frequency spectra of the measured voltages VP have been obtained by FFT processing, considering a time window of 20 s. Figure 7 shows the comparison among the frequency spectra of VP measured for the three different velocities considered in Figure 6. In the spectrum relative to the intermediate velocity u2, a main component at the corresponding vortex repetition frequency fu2, well beyond the voltage level at other frequencies, is present. Indeed, at the velocity u2 it was possible to clearly identify fu2 = 12.8 Hz since it is near to the beam resonant frequency of 13.6 Hz. From Equation (1) and the frequency fu2, the Strouhal number of the proposed configuration could thus be determined, resulting in St ≈ 0.17; this value is in reasonably good agreement with the value of Stsim ≈ 0.23 obtained by CFD in Section 2.2.
In this way, Equation (1) also allows to calculate the repetition frequencies fu1 and fu3 at u1 and u3, resulting in fu1 = 7.0 Hz and fu3 = 18.9 Hz, respectively. As it can be observed in Figure 7, main components in the spectra of VP for u1 and u3 are present at the frequencies fu1 and fu3. This confirms that the oscillations contain a frequency contribution at the repetition frequency of the forcing vortices also for the velocities u1 and u3. In addition, it can be observed that in all three spectra components are also present at the second harmonics of the repetition frequencies.
Given the sufficiently high bending stiffness of the piezoelectric element, no significant departure from mechanical linearity is expected in the explored flow range. This is confirmed in Figure 6a where the output voltage VP is shown to be essentially a sinusoid when the system is excited at a vortex repetition frequency close to the resonant frequency fm, i.e., for velocity u2. Then an analysis of the frequency spectra in linear conditions is appropriate.
For this purpose, it can be assumed that the action of a vortex on the beam consists of a force pulse and that the oscillation of the beam caused by the force pulse is a sinusoidal damped oscillation. Thus, when the oscillation is generated by a periodic sequence of vortices with a repetition frequency fV, the voltage VC(t) at the output of the piezoelectric cantilever, can be expressed as the sum of sinusoidal damped oscillations:
where s(t) represents the step function, and Tv = 1/fv is the time interval between two subsequent vortices, and k is an integer. The parameters Ad, αd and fd represent, respectively, the amplitude, damping factor and oscillation frequency of the damped oscillation of the beam due to an applied force pulse.
The frequency spectrum VC(f) can be derived by the Fourier transform of the time function in Equation (2) as follows:
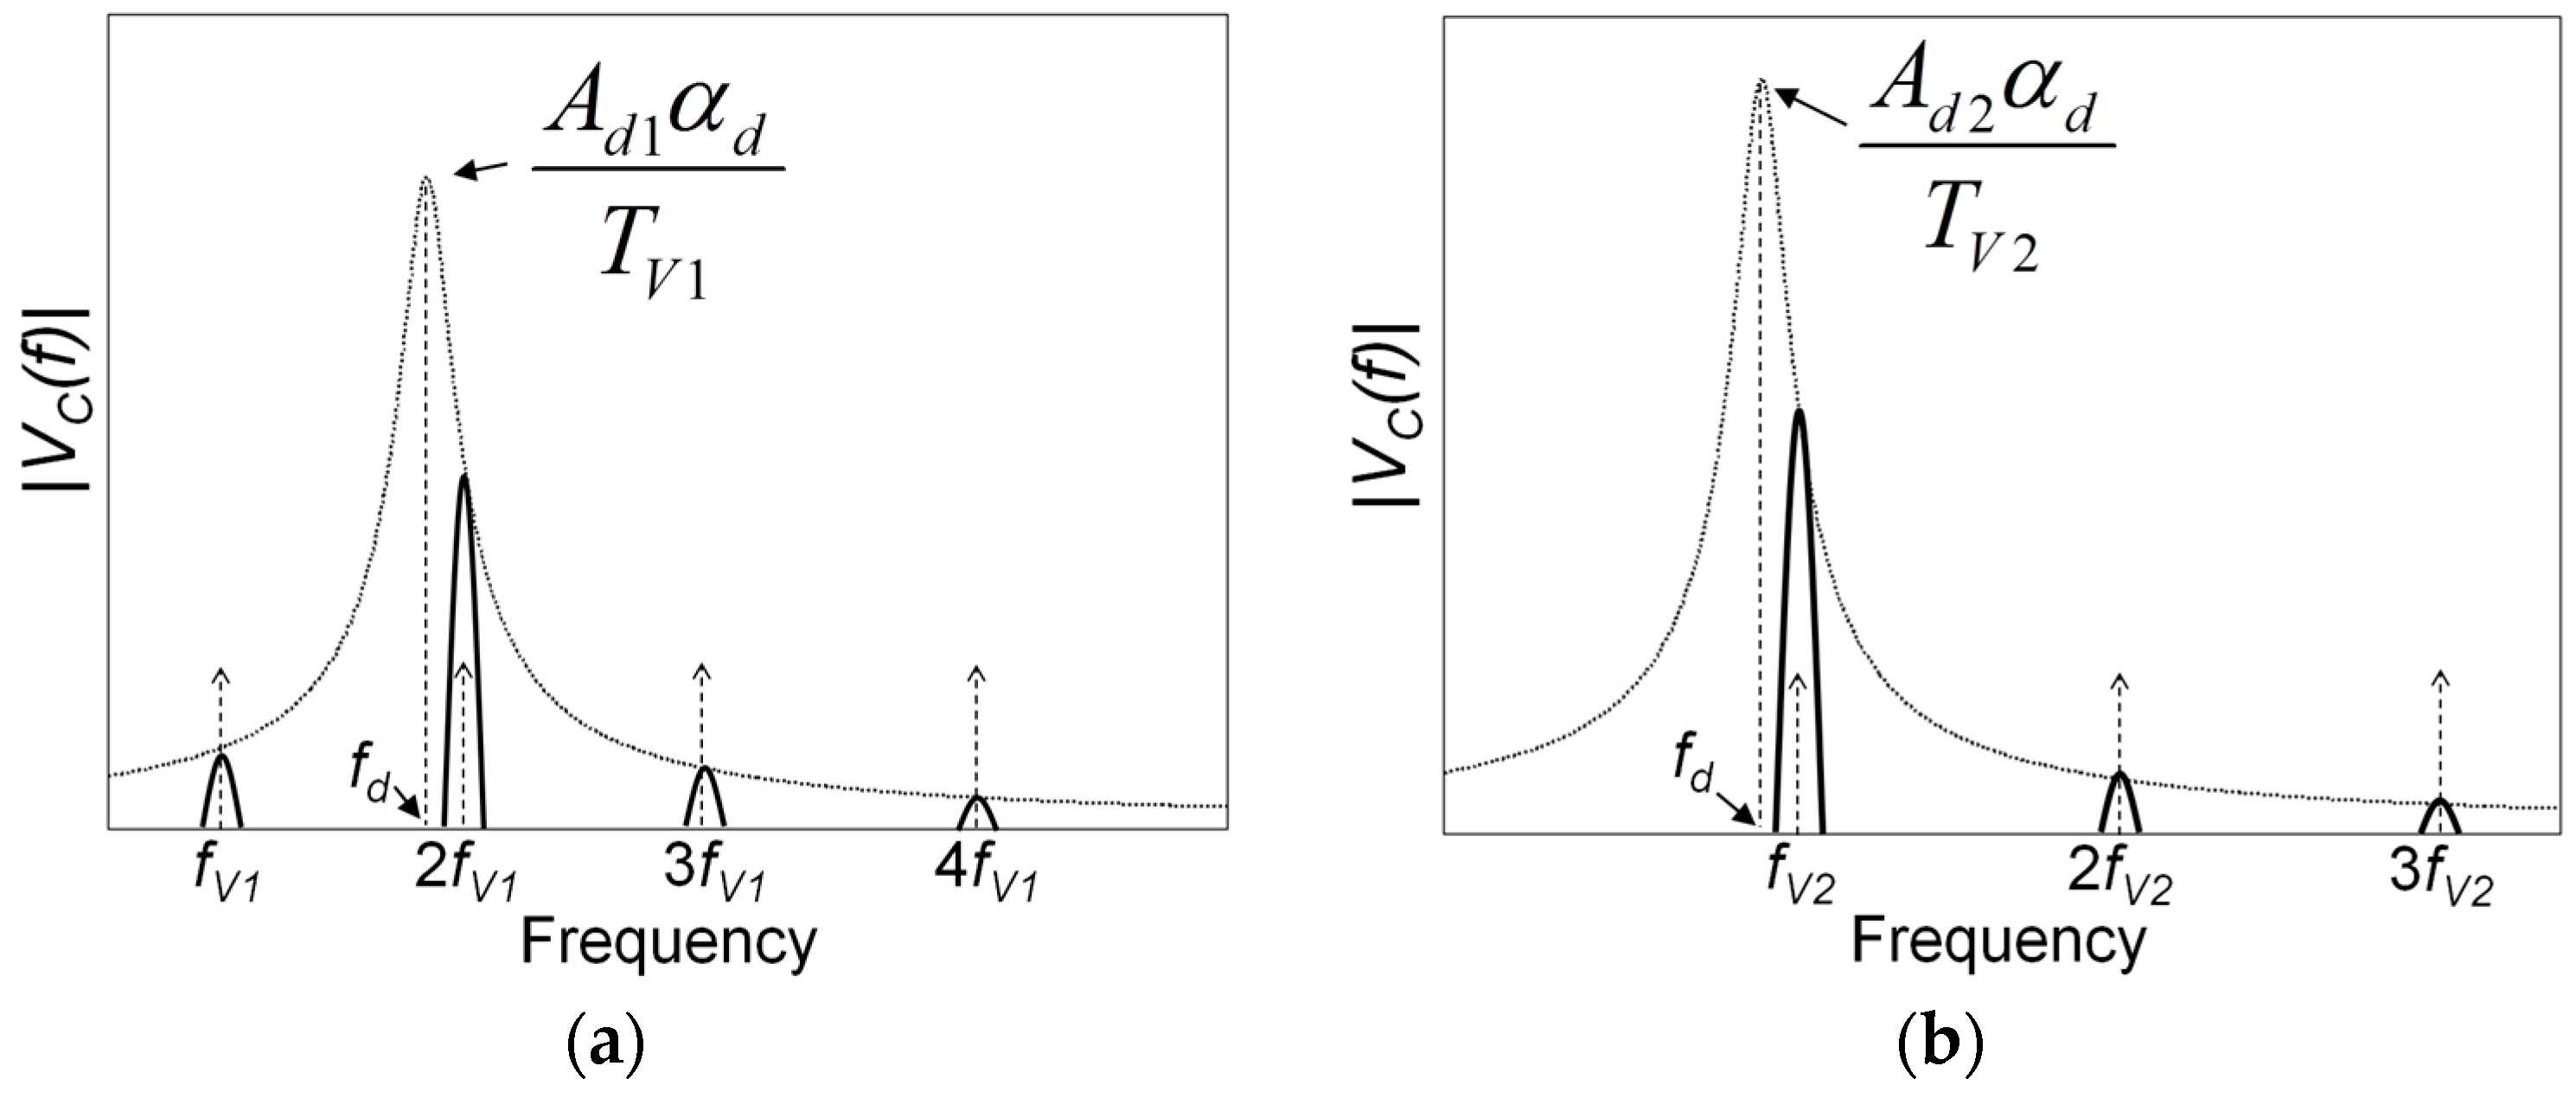
The spectrum VC(f) consists of the product of two terms, where the first term represents the spectrum of a single damped oscillation of the beam centered at its damped frequency fd, and the second term δfv(f) consists of a sequence of Dirac pulses equally spaced of fv. A graphical representation of the magnitude of VC(f), derived from Equation (3), is shown in Figure 8.
The comparison between the spectra of the measured VP as shown in Figure 7 and the spectra predicted from the present analysis confirms the presence in the experimental results of main components at the repetition frequency of the vortices and at its harmonics. However, unlike an ideal force pulse, the force pulses associated to the vortices have a finite duration in real conditions. This reflects in the spectra of the measured VP with the presence of pulses with a finite width. In addition, in Figure 8 it can be observed that the components in the region of the damped oscillation frequency fd are amplified by the resonance effect. This is well confirmed in the spectra of Figure 7 for all the components in the region around fm. In particular, it is evident for the velocity u1, where the second harmonic component at 2fu1 is close to fm and its magnitude exceeds the fundamental component at the vortex repetition frequency fu1.
2.4. Harvested Power Measurements
Tests were then performed to measure the power harvested by the converter and delivered to a load in different excitation conditions. A resistive load has been used to evaluate the available active power, and the optimal value of the load resistor has been investigated to obtain the maximum power [23,24,25,26]. For this purpose, the converter was connected to a resistive load to obtain on average the maximum power in the explored frequency range between about 5 and 50 Hz. The range of the optimal load resistor has been calculated through the simplified relation Ropt ≈ 1/(2πfmCP), where CP is the equivalent internal capacitance of the converter as described in Section 2.1 [24,25]. Then, the specific value of the optimal load resistor RL = 15 kΩ was determined through an experimental optimization process to obtain the maximum power, calculated as PL = VP,rms2/RL.
The measured power as a function of the flow velocity with the beam positioned at the orientation angle θ = 300° is shown in Figure 9. The power extracted from the system presents a cut-in velocity of the airflow of about 3 m/s. The largest power values, up to 1.3 mW, are obtained for intermediate velocities where the vortex repetition frequency is close to the beam resonant frequency. For higher velocities, the power tends to a constant value of about 0.2 mW. This trend to constancy can be ascribed to the combination of two opposite contributions occurring for increasing flow velocity and vortex repetition frequency in turn. There is a positive contribution due to the increasing magnitude of the forcing, and there is a negative contribution due to the decreasing response of the beam excited out of resonance by the increasing repetition frequency.
From the measured power on the optimal resistive load an estimation of the performances in terms of power density and conversion efficiency can be obtained for the proposed harvesting system. Considering the area of the piezoelectric converter plus the blade, a maximum power per unit area of about 40 μW/cm2 is achieved. In addition, considering as the volume of the system the total region, comprising the bluff body, the beam with the converter, and the intermediate portion where the vortices arise, a maximum power density of about 2 μW/cm3 can be calculated. The obtained power density and power per unit area are comparable to similar reported harvesting systems [24,26]. The conversion efficiency can be defined as the ratio of the output electrical power to the input available power associated to the airflow which hits the exposed surface of the bluff body. As stated by the Betz law, only a portion cP ≈ 0.6 of the impinging power can be extracted from a mechanical-to-electrical converter. This portion goes down to cP ≈ 0.3–0.4 for reduced dimensions of the converter, as in the case of the proposed system [24]. Thus, the maximum electrical power as a function of the flow velocity can be calculated as:
where S is the exposed surface of the bluff body and ρair is the air density. The proposed system presents an efficiency PL/Pel_max of up to about 1.7% for the flow velocity u = 4 m/s where the maximum power is extracted.
3. Autonomous Sensors
The ability of the developed energy harvesting system to power autonomous sensors has been investigated by connecting the converter to a tailored electronic energy management unit plus a signal conditioning circuit and two sensors [27,28,29].
As shown in the block diagram of Figure 10, the energy management unit stores the harvested energy in a capacitor and periodically delivers it to the sensors and conditioning circuit and a RF transmission module. Once enough energy has been stored in the capacitor CS the management unit momentarily powers the conditioning circuit. This is based on a relaxation oscillator and PWM (pulse width modulator) circuit that together generate a rectangular-wave voltage VTM. The frequency of VTM depends on the flow temperature measured by a resistive temperature sensor in the flow, while the duty cycle of VTM is modulated by the voltage from an additional piezoelectric sensor placed onto the cantilever to sense the deflections. Therefore, the single waveform VTM simultaneously and independently carries in an energy efficient way information on both the flow temperature and the beam oscillations. The voltage VTM is then used as the control signal of a RF OOK (On-Off Keying) modulator to transmit the information on a 315 MHz carrier to an external receiving unit.
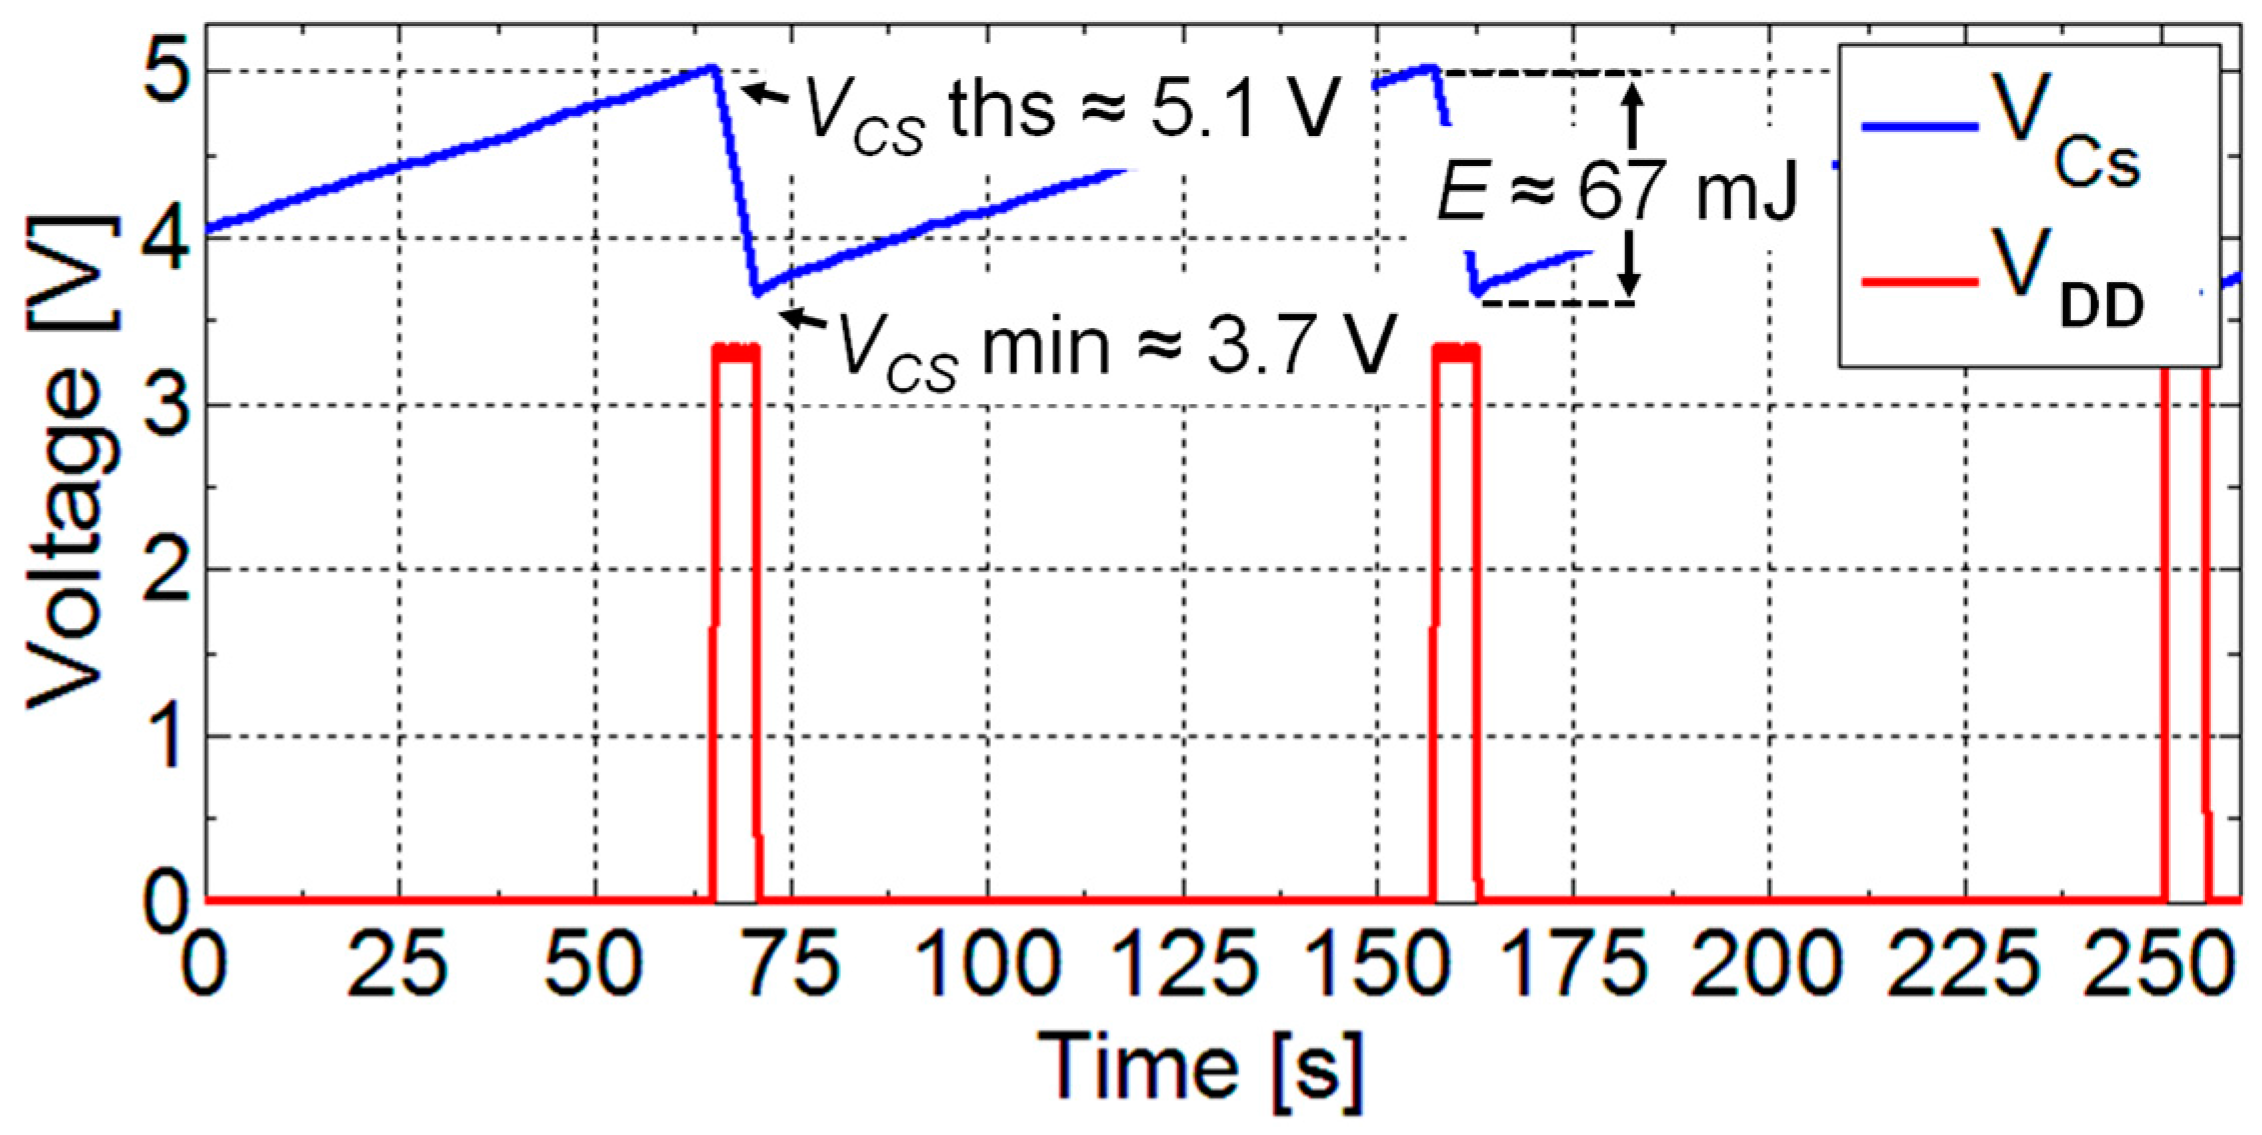
The energy management unit is based on a dedicated integrated circuit (LTC 3588, Linear Technology, Milpitas, CA, USA) set to supply with a regulated voltage VDD = 3.3 V the load circuit. The input stage of the energy management unit is used to convert the AC voltage provided by the piezoelectric converter into a DC voltage used to charge the storage capacitor. Figure 11 reports a typical operation cycle of the unit. As it can be observed, when the voltage VCS on the storage capacitor CS is in the range that ensures the output regulated voltage, the load circuit is powered. In this way, the unit operation consists in charging phases followed by phases where the sensors, conditioning circuits and the RF transmission module are powered. During the charging phase, the harvested energy is stored in the capacitor CS. The following phase starts only when the voltage across the storage capacitor reaches the threshold voltage VCS_THS and thus enough energy to power sensors, conditioning circuits and to wireless transmit the information. An energy amount of about 67 mJ is stored and subsequently released in the alternating phases.
The generation of the signal VTM starts from a pulse wave generator which produces a signal VT with a frequency fTM dependent on the resistance of an NTC K164/10k temperature sensor (Epcos AG, Munich, Germany) placed in the flow. To this purpose the signal VT is used as the trigger for a pulse width modulator which generates the signal VTM. The duty cycle DCTM of VTM is controlled by the voltage VD generated by a PVDF piezoelectric foil that is attached onto the cantilever beam and acts as deflection sensor. Therefore, with reference to Figure 12a, VTM can be seen as a sequence of pulses with frequency fTM and duty cycle DCTM given by:
where Tempflow is the flow temperature and Temp0 = 25 °C is the reference ambient temperature; the frequency fTM0 is the base frequency at Temp0 and KT is the temperature sensitivity of fTM, the voltages VD,max and VD,min are the maximum and minimum values of VD corresponding to the maximum and minimum beam deflections. The linear relationship between frequency and temperature in Equation (5) results from the combination of the NTC sensor characteristic curve and the resistance-to-frequency conversion function of the relaxation oscillator [27]. As shown in Figure 12a, the temperature sensitivity KT of frequency fTM derived experimentally is 30.3 Hz/°C.
According to Equation (6), Figure 12b shows that VTM on its duty cycle DCTM carries information on the normalized value of VD.
An external receiver unit can reconstruct the rectangular wave VTM from the RF signal, extract the frequency fTM and duty cycle DCTM and, in turn, derive the flow temperature and the beam oscillation level, respectively. By analyzing the latter in the frequency domain as discussed in Section 2.3, the repetition frequency of the forcing vortices can be derived. Therefore, by the known St number of the proposed configuration and Equation (1), the information on the flow velocity can be also extracted [30].
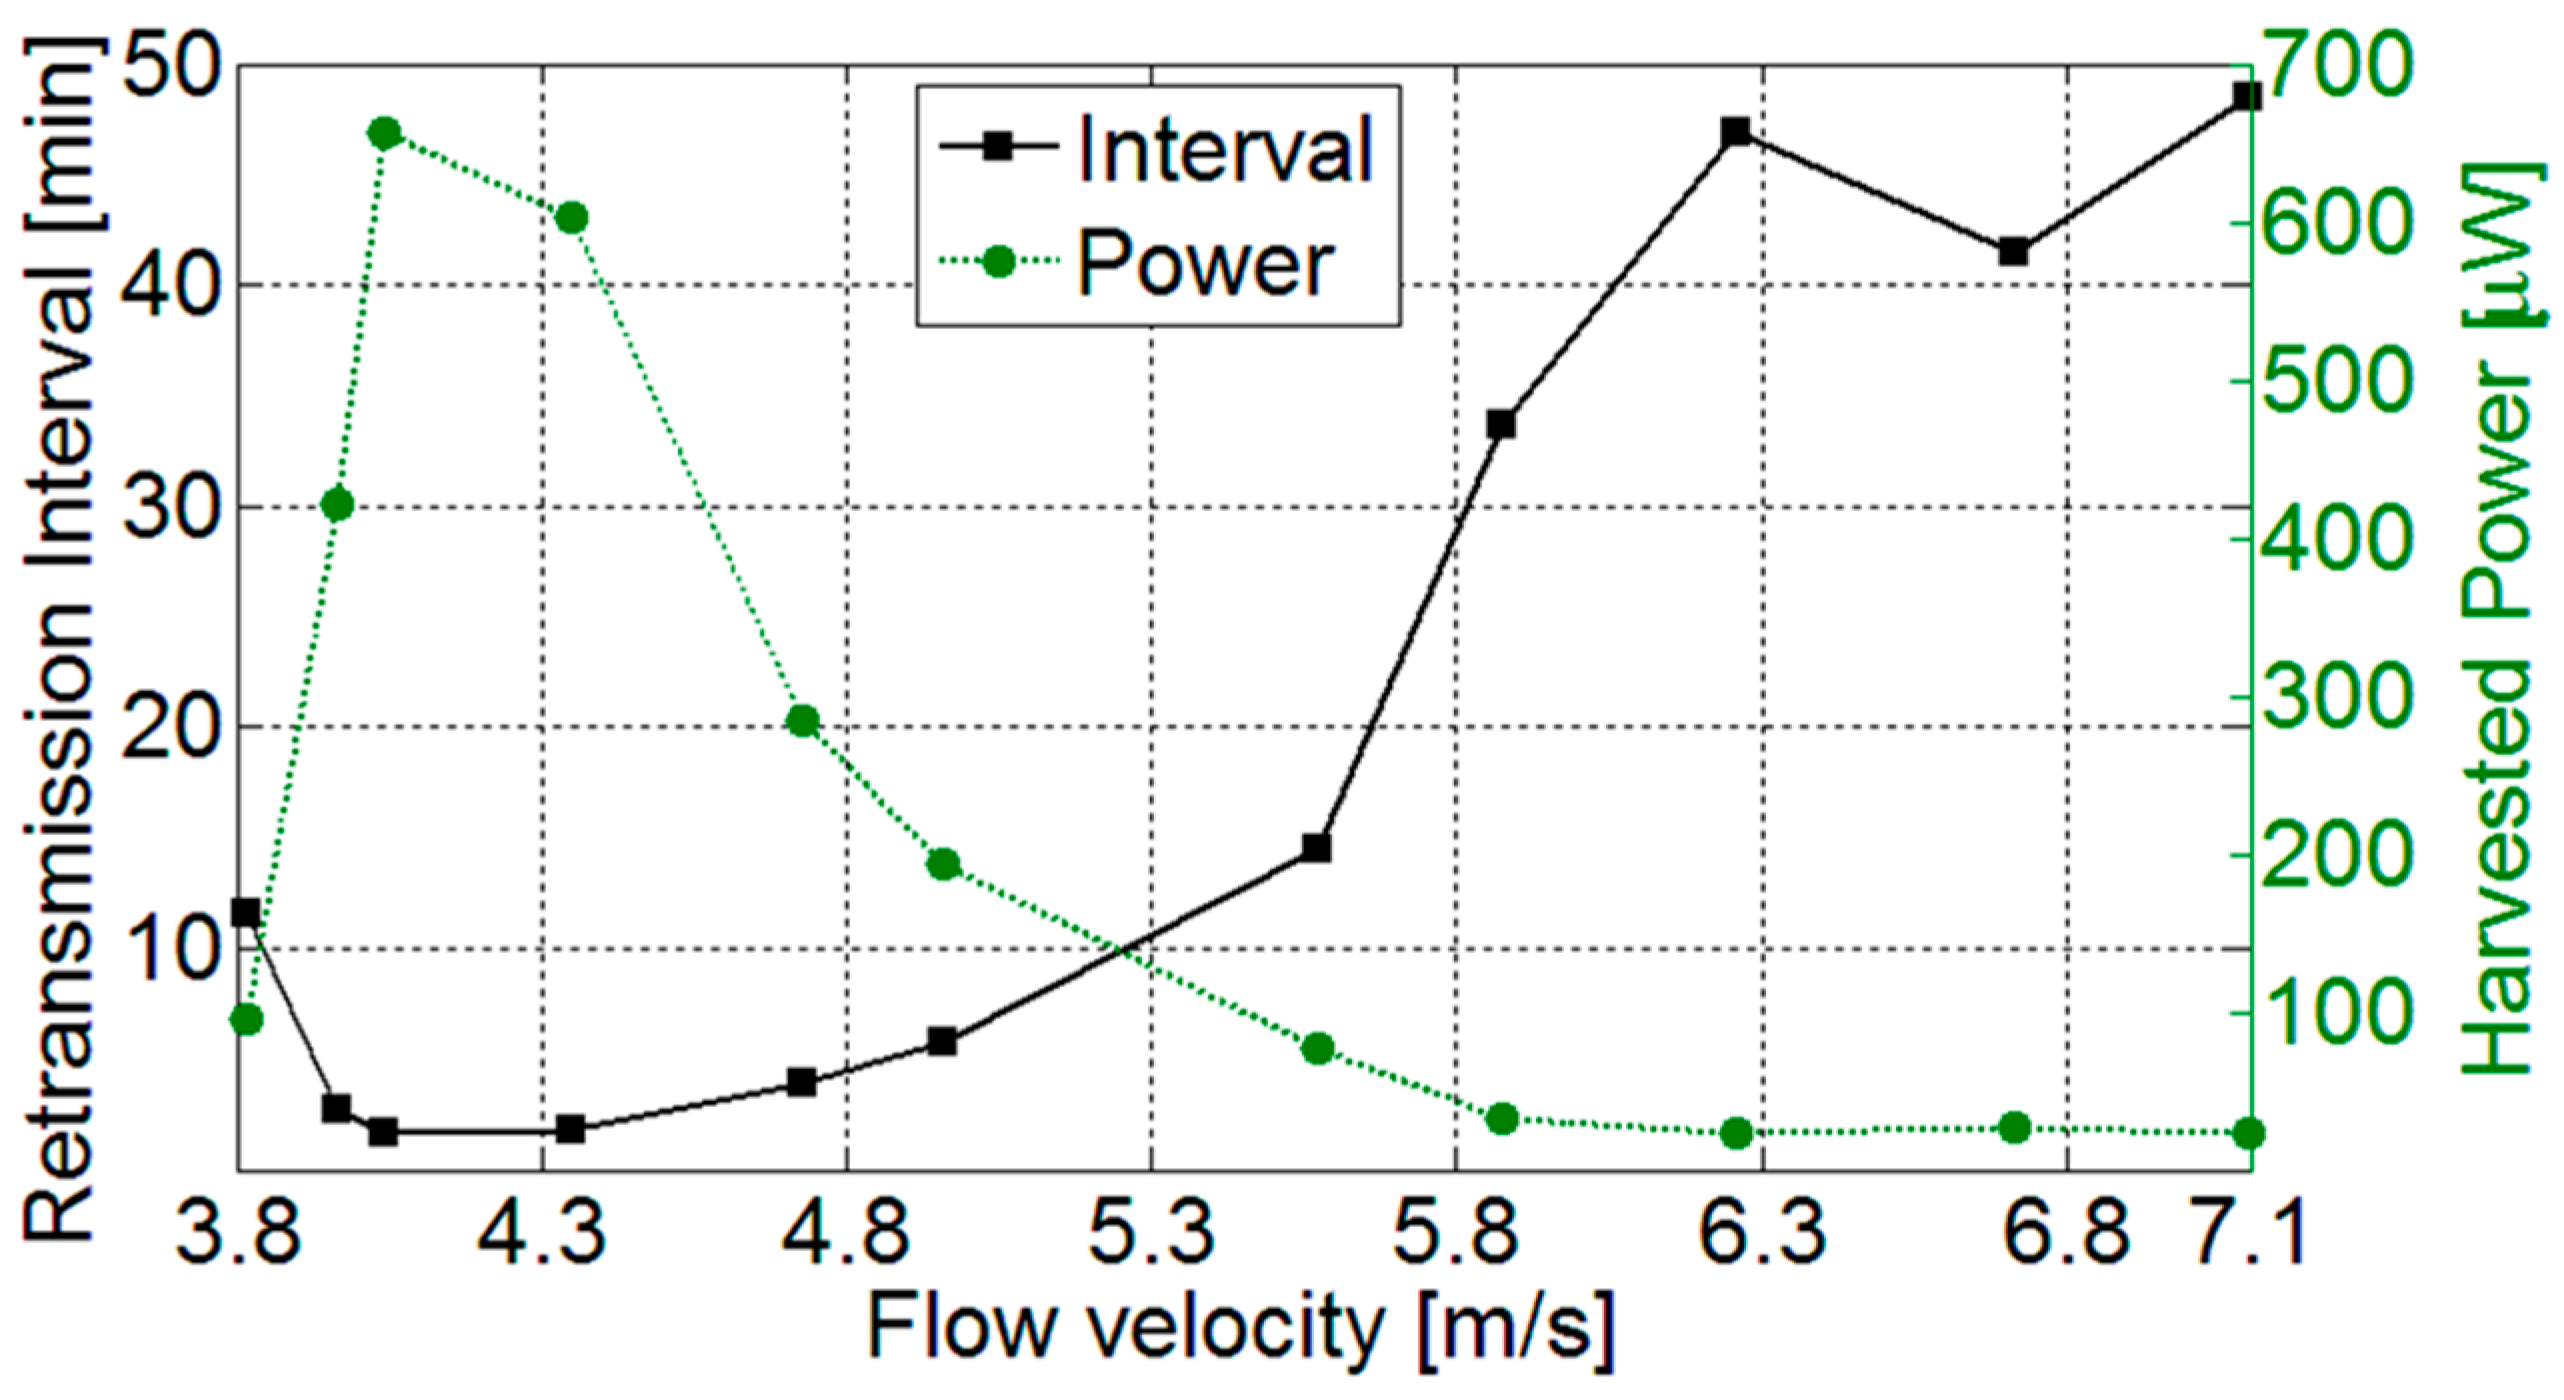
The performances of the harvesting system and energy management circuit have been characterized by measuring the transmission time and the time interval between consecutive transmissions as a function of the flow velocity. Considering a power consumption of the conditioning circuit and the RF transmission module of about 25 mW a transmission time duration of about 2 s has been obtained. In Figure 13 the measured retransmission intervals and the corresponding average harvested power are reported. Power values of up to 650 μW have been obtained and correspondingly a retransmission interval below 2 min has been achieved. As it can be observed, best performances are obtained, as expected, for flow velocities of about 4 m/s that produce vortex repetition frequencies that excite the beam resonance.
4. Conclusions
In this work the possibility of using a piezoelectric converter to harvest energy from airflow as a power source for autonomous sensors has been demonstrated. The pulsed force for the vibration of the piezoelectric beam converter is provided by von Karman vortices generated behind a bluff body placed in the airflow. A way to exploit the harvested energy to power autonomous sensors has been shown. Two sensors measuring the fluid temperature and flow velocity, and the respective signal conditioning circuits have been powered by a tailored energy management unit.
An analysis by CFD simulations has been carried out to demonstrate the effectiveness of the adopted configuration in generating an alternate velocity field. The theoretically expected linear trend between the inlet flow velocity and the vortices shedding frequency was confirmed by the numerical simulations.
Experimental results obtained varying the flow velocity in the explored range show that specific orientations of the beam converter behind the bluff body ensure better conversion performances. In addition, it is shown that the optimal harvesting effectiveness is obtained when the vortex repetition frequency is close to the resonant frequency of the beam. In this condition the system is able to generate a harvested power of about 1.3 mW on adapted resistive load for a flow velocity around 4 m/s. The system presents a cut-in velocity and an optimal velocity range followed by a reduction of the generated power for the higher velocities. Nevertheless, the experimental results show that the system is able to convert sufficient amount of energy and to power autonomous sensors also for flow velocity above the optimal working range, due to a careful design of the power management unit and of the low-power front-end circuits.
An improvement of the system to extend the operational bandwidth obtaining a wider optimal velocity range could be the use of a combination of multiple converter beams behind the bluff body exploiting both proximity effects [3,14] and different resonant frequencies.
The simultaneous measurement of air temperature and airflow velocity through an energetically autonomous module as offered by the present system represent an important capability in a wide range of applications in the industrial, building automation, automotive fields to name a few. The obtained results show that the proposed approach is viable for applications where battery-less maintenance-free sensor units and wireless transmission of flow information are required, for example to realize self-powered units in a WSN.
Acknowledgments
The work was partially carried out under the project PRIN-2009KFLWJA co-funded by the Italian MIUR.
Author Contributions
Vittorio Ferrari contributed in the theory and modeling, in revising the paper and coordinating the research. Pietro Poesio proposed the experimental activity on the energy harvesting from von Karman vortices and supervised the CFD activity. Marco Ferrari contributed in the electronic design, analysis of experimental data, and in writing and revising the paper. Arianna Bonzanini performed the CFD simulations and contributed in the interpretation of the simulation results. Marco Demori performed the experimental activity on system design, assembling and testing, contributed in the analysis of experimental data, theory and modeling, and in writing the paper.
Conflicts of Interest
The authors declare no conflict of interest.
References
- Erturk, A.; Vieira, W.G.R.; De Marqui Junior, C.; Inman, D.J. On the energy harvesting potential of piezoaeroelastic systems. Appl. Phys. Lett. 2010, 96, 184103. [Google Scholar] [CrossRef]
- McCarthy, J.M.; Watkins, S.; Deivasigamani, A.; John, S.J.; Coman, F. An investigation of fluttering piezoelectric energy harvesters in off-axis and turbulent flows. J. Wind Eng. Ind. Aerodyn. 2015, 136, 101–113. [Google Scholar] [CrossRef]
- McCarthy, J.M.; Deivasigamani, A.; John, S.J.; Watkins, S.; Coman, F.; Petersen, P. Downstream flow structures of a fluttering piezoelectric energy harvester. Exp. Therm. Fluid Sci. 2013, 51, 279–290. [Google Scholar] [CrossRef]
- Deivasigamani, A.; McCarthy, J.M.; John, S.; Watkins, S.; Trivailo, P.; Coman, F. Piezoelectric Energy Harvesting from Wind Using Coupled Bending-Torsional Vibrations. Mod. Appl. Sci. 2014, 8, 106–126. [Google Scholar] [CrossRef]
- Dai, H.L.; Abdelkefi, A.; Wang, L. Piezoelectric energy harvesting from concurrent vortex-induced vibrations and base excitations. Nonlinear Dyn. 2014, 77, 967–981. [Google Scholar] [CrossRef]
- Shan, X.; Song, R.; Fan, M.; Xie, T. Energy-Harvesting Performances of Two Tandem Piezoelectric Energy Harvesters with Cylinders in Water. Appl. Sci. 2016, 6, 230. [Google Scholar] [CrossRef]
- Allen, J.J.; Smits, A.J. Energy harvesting eel. J. Fluids Struct. 2001, 15, 629–640. [Google Scholar] [CrossRef]
- Shi, S.; New, T.H.; Liu, Y. Flapping dynamics of a low aspect-ratio energy-harvesting membrane immersed in a square cylinder wake. Exp. Therm. Fluid Sci. 2013, 46, 151–161. [Google Scholar] [CrossRef]
- Shi, S.; New, T.H.; Liu, Y. Effects of aspect ratio on the flapping behavior of energy-harvesting membrane. Exp. Therm. Fluid Sci. 2014, 52, 339–346. [Google Scholar] [CrossRef]
- Akaydın, H.D.; Elvin, N.; Andreopoulos, Y. Wake of a cylinder: A paradigm for energy harvesting with piezoelectric materials. Exp. Fluids 2010, 49, 291–304. [Google Scholar] [CrossRef]
- Gao, X.; Shih, W.; Shih, W.Y. Flow energy harvesting using piezoelectric cantilevers with cylindrical extension. IEEE Trans. Ind. Electron. 2013, 60, 1116–1118. [Google Scholar] [CrossRef]
- Penga, J.; Fub, X.; Chen, Y. Experimental investigations of Strouhal number for flows past dual triangulate bluff bodies. Flow Meas. Instrum. 2008, 19, 350–357. [Google Scholar] [CrossRef]
- Yu, Y.; Liu, Y. Flapping dynamics of a piezoelectric membrane behind a circular cylinder. J. Fluids Struct. 2015, 55, 347–363. [Google Scholar] [CrossRef]
- Bryant, M.; Mahtani, R.L.; Garcia, E. Wake synergies enhance performance in aeroelastic vibration energy harvesting. J. Intell. Mater. Syst. Struct. 2012, 23, 1131–1141. [Google Scholar] [CrossRef]
- Wang, D.A.; Chiu, C.Y.; Pham, H.T. Electromagnetic energy harvesting from vibrations induced by Kármán vortex street. Mechatronics 2012, 22, 746–756. [Google Scholar] [CrossRef]
- Li, D.; Wu, Y.; DaRonch, A.; Xiang, J. Energy harvesting by means of flow-induced vibrations on aerospace vehicles. Prog. Aerosp. Sci. 2016, 86, 28–62. [Google Scholar] [CrossRef]
- Demori, M.; Ferrari, M.; Ferrari, V.; Farisè, S.; Poesio, P. Energy Harvesting from Von Karman Vortices in Airflow for Autonomous Sensors. Procedia Eng. 2014, 87, 775–778. [Google Scholar] [CrossRef]
- Ferrari, M.; Cerini, F.; Ferrari, V. Autonomous sensor module powered by impact-enhanced energy harvester from broadband low-frequency vibrations. In Proceedings of the 17th International Conference on Solid-State Sensors, Actuators and Microsystems (TRANSDUCERS & EUROSENSORS XXVII), 2013 Transducers & Eurosensors XXVII, Barcelona, Spain, 16–20 June 2013; pp. 2249–2252. [Google Scholar]
- Roache, P.J. Perspective: A method for uniform reporting of grid refinement studies. J. Fluids Eng. 1994, 116, 405–413. [Google Scholar] [CrossRef]
- Sarioglu, M.; Yavuz, T. Vortex Shedding From Circular and Rectangular Cylinders Placed Horizontally in a Turbulent Flow. Turk. J. Eng. Environ. Sci. 2000, 24, 217–228. [Google Scholar]
- Dai, H.; Yue, X.; Yuan, J.; Xie, D.; Atluri, S.N. A comparison of classical Runge-Kutta and Henon’s methods for capturing chaos and chaotic transients in an aeroelastic system with freeplay nonlinearity. Nonlinear Dyn. 2015, 81, 169–188. [Google Scholar] [CrossRef]
- Hehn, T.; Manoli, Y. CMOS Circuits for Piezoelectric Energy Harvesters; Springer Series in Advanced Microelectronics; Springer: Dordrecht, The Netherlands, 2015; Volume 38, pp. 21–40. [Google Scholar]
- Li, S.; Yuan, J.; Lipson, H. Ambient wind energy harvesting using cross-flow fluttering. J. Appl. Phys. 2011, 109, 026104. [Google Scholar] [CrossRef]
- Rezaei-Hosseinabadi, N.; Tabesh, A.; Dehghani, R.; Aghili, A. An Efficient Piezoelectric Windmill Topology for Energy Harvesting From Low-Speed Air Flows. IEEE Trans. Ind. Electron. 2015, 62, 3576–3583. [Google Scholar] [CrossRef]
- Khaligh, A.; Zeng, P.; Zheng, C. Kinetic Energy Harvesting Using Piezoelectric and Electromagnetic Technologies—State of the Art. IEEE Trans. Ind. Electron. 2010, 57, 850–860. [Google Scholar] [CrossRef]
- Perez, M.; Boisseau, S.; Gasnier, P.; Willemin, J.; Reboud, J.L. An electret-based aeroelastic flutter energy harvester. Smart Mater. Struct. 2015, 24, 035004. [Google Scholar] [CrossRef]
- Ferrari, M.; Ferrari, V.; Guizzetti, M.; Marioli, D. An autonomous battery-less sensor module powered by piezoelectric energy harvesting with RF transmission of multiple measurement signals. Smart Mater. Struct. 2009, 18, 085023. [Google Scholar] [CrossRef]
- Fei, F.; Maib, J.D.; Li, W.J. A wind-flutter energy converter for powering wireless sensors. Sens. Actuators A 2012, 173, 163–171. [Google Scholar] [CrossRef]
- Zhang, C.; He, X.; Li, S.; Cheng, Y.; Rao, Y. A Wind Energy Powered Wireless Temperature Sensor Node. Sensors 2015, 15, 5020–5031. [Google Scholar] [CrossRef] [PubMed]
- Venugopal, A.; Agrawal, A.; Prabhu, S.V. Frequency detection in vortex flowmeter for low Reynolds number using piezoelectric sensor and installation effects. Sens. Actuators A 2012, 184, 78–85. [Google Scholar] [CrossRef]
Figure 1.
Sketch of the system: the bluff body is placed perpendicular to the flow direction and it is W = 55 mm wide and 20 mm thick; the beam is composed of the piezoelectric converter, with 45 mm length and 20 mm width, and the blade with the air-foil profile cross-section, with 70 mm length and 30 mm width (a); Top view shows the position of the blade at d from the bluff body, and the orientation angle θ (b).
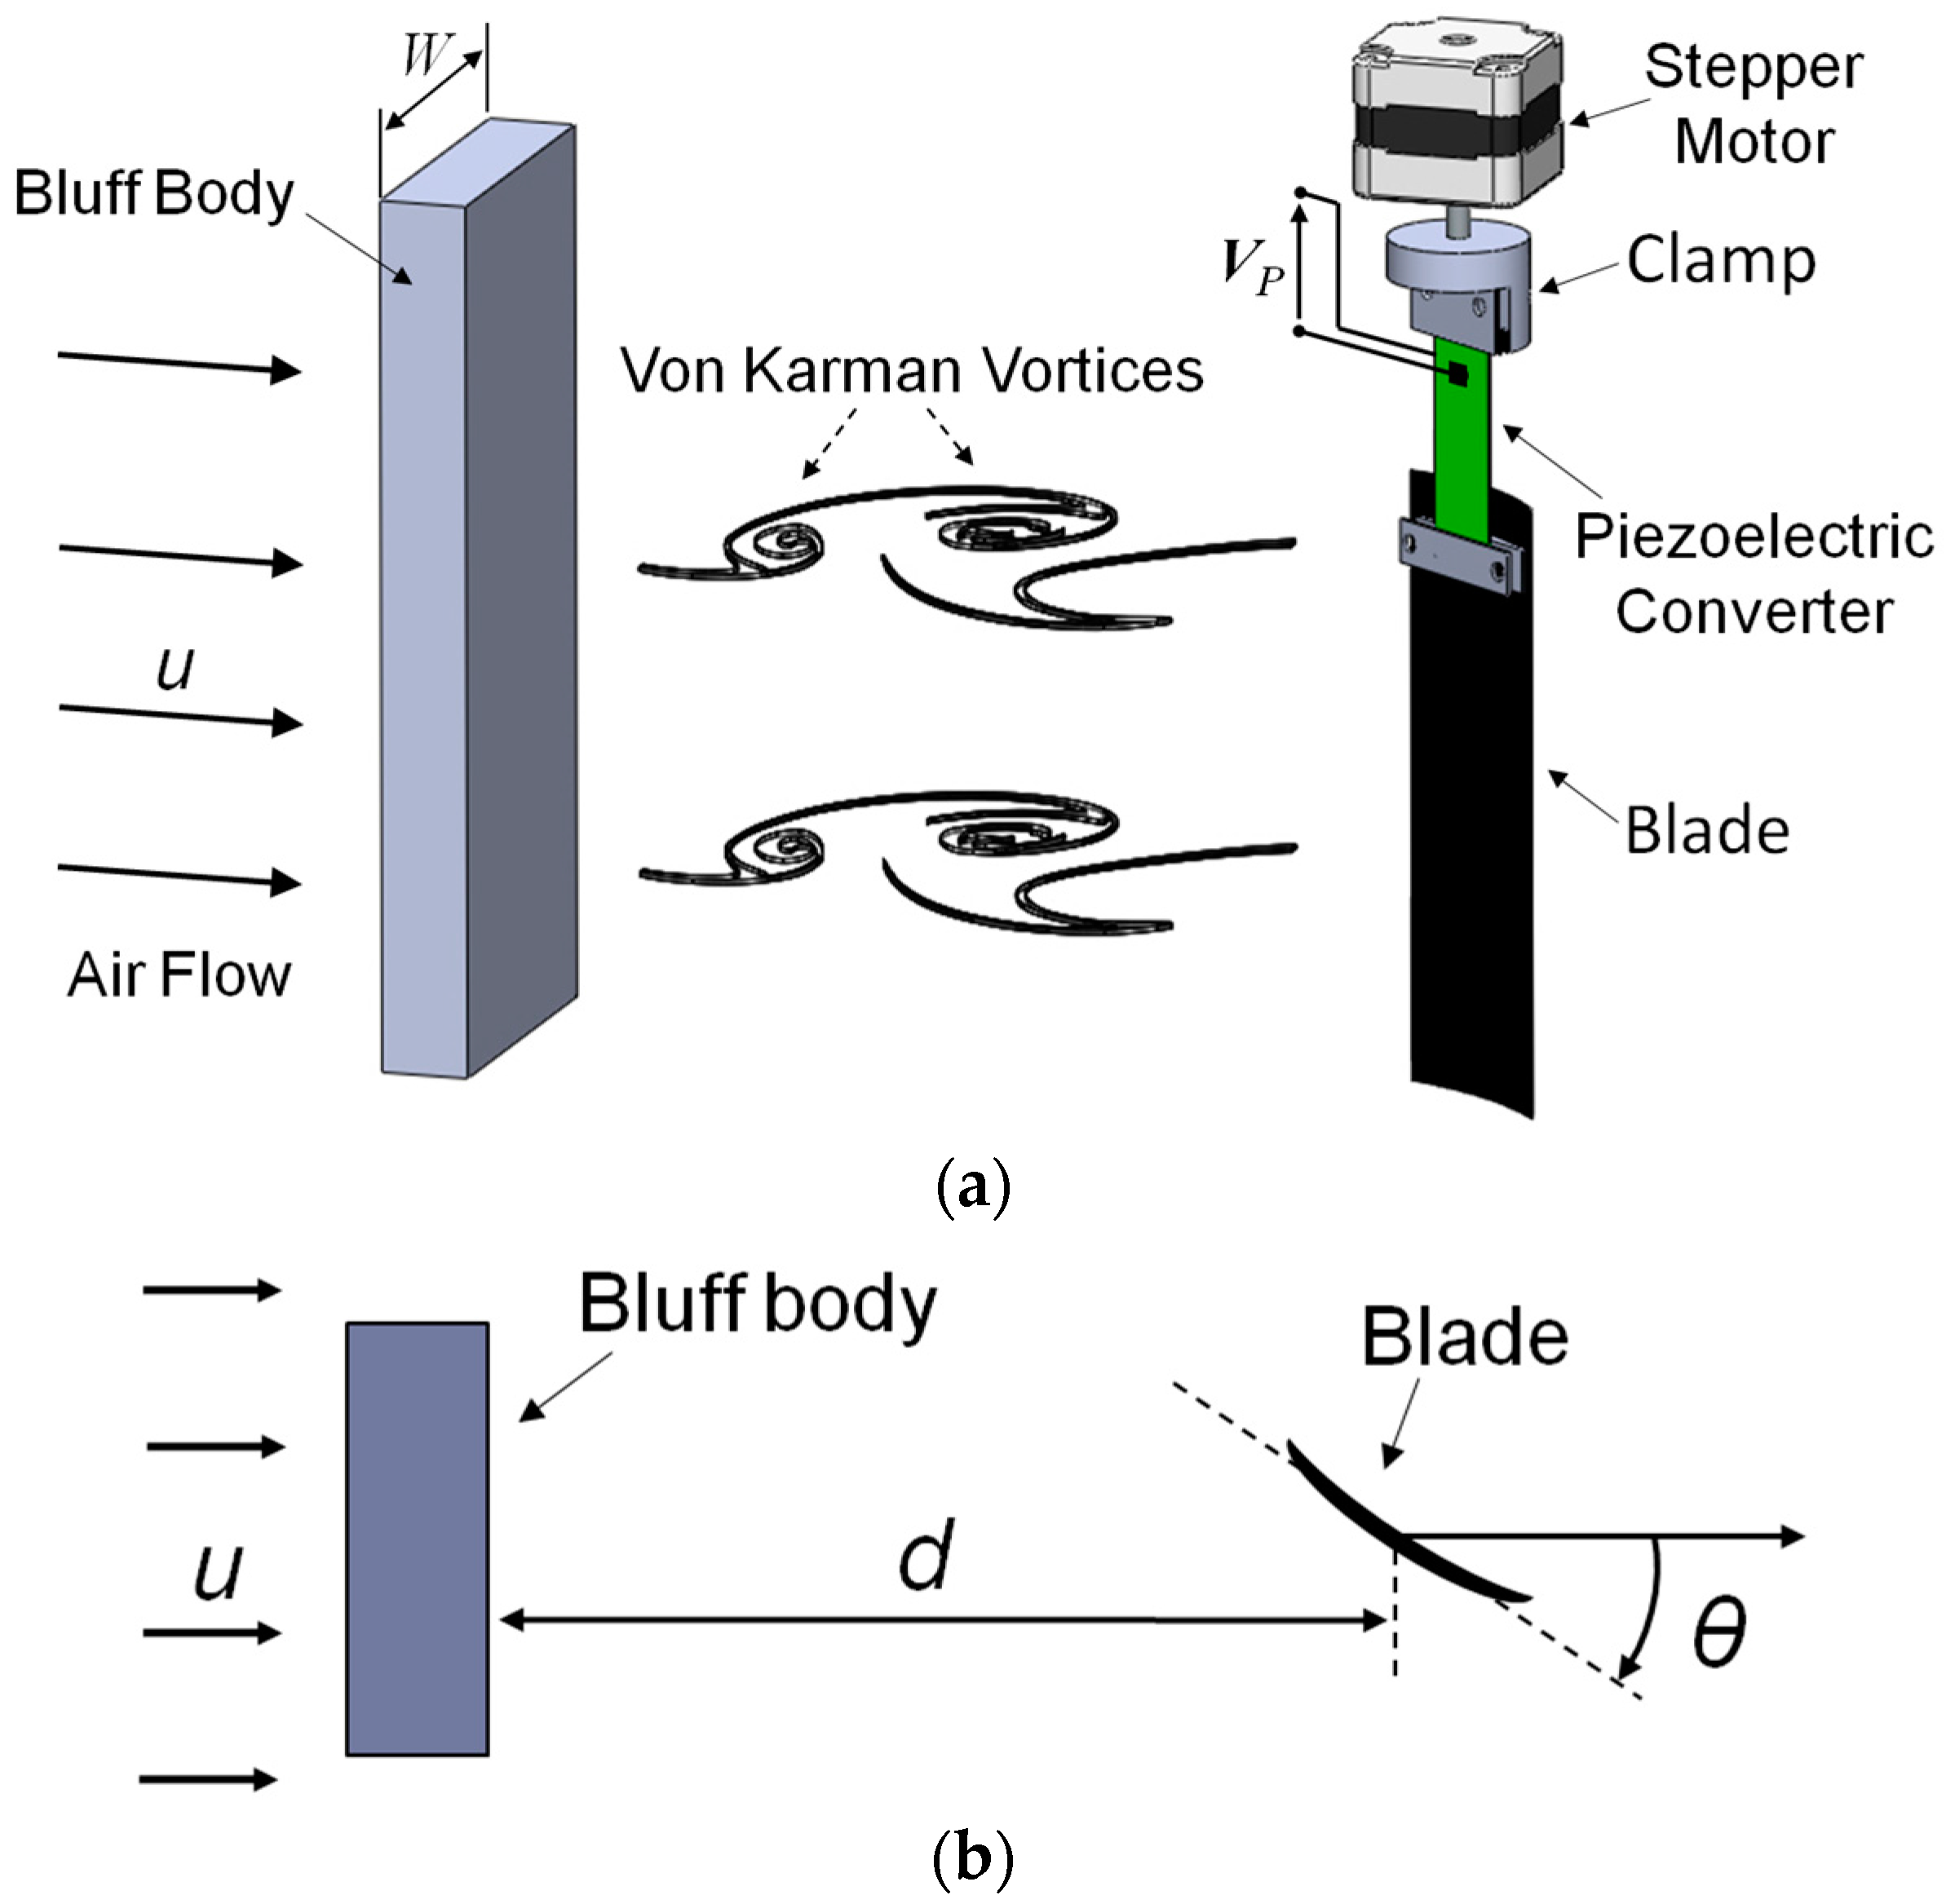
Figure 2.
Simulated velocity field of two subsequent vortices (a,b); Comparison between the smoke visualization image of the air streamline in the vortex region (c) and the flow simulation (b). The 1-cm-pitch wire-mesh shown in (c) has been placed outside the wind tunnel as dimensional reference and it is not interfering with the flow.

Figure 3.
Vortices shedding frequency as function of the inlet flow velocity obtained by CFD simulations. The expected linear trend is observed.
Figure 3.
Vortices shedding frequency as function of the inlet flow velocity obtained by CFD simulations. The expected linear trend is observed.

Figure 4.
Time evolution of the velocity vector obtained by the components uy vs. ux at 30 mm (a); 70 mm (b); 90 mm (c); 130 mm (d) behind the bluff body, in the center line, for a complete cycle composed of two subsequent vortices. The trajectory of the velocity vector tip is reported in green and the vector correspondent to the maximum angle αmax between the central axis and the velocity vector is shown.

Figure 5.
Polar visualization of the rms value of the VP measurements as a function of θ for the three different flow velocities u1, u2 and u3. An accuracy of ±1.8° can be assumed in the orientations θ that corresponds to an uncertainty of one step of the stepper motor.
Figure 5.
Polar visualization of the rms value of the VP measurements as a function of θ for the three different flow velocities u1, u2 and u3. An accuracy of ±1.8° can be assumed in the orientations θ that corresponds to an uncertainty of one step of the stepper motor.

Figure 6.
Voltages VP measured versus time (a) and phase planes (b) at different flow velocities: u1 = 2.3 m/s, u2 = 4.2 m/s, and u3 = 6.2 m/s for the same orientation angle θ = 300°.
Figure 6.
Voltages VP measured versus time (a) and phase planes (b) at different flow velocities: u1 = 2.3 m/s, u2 = 4.2 m/s, and u3 = 6.2 m/s for the same orientation angle θ = 300°.
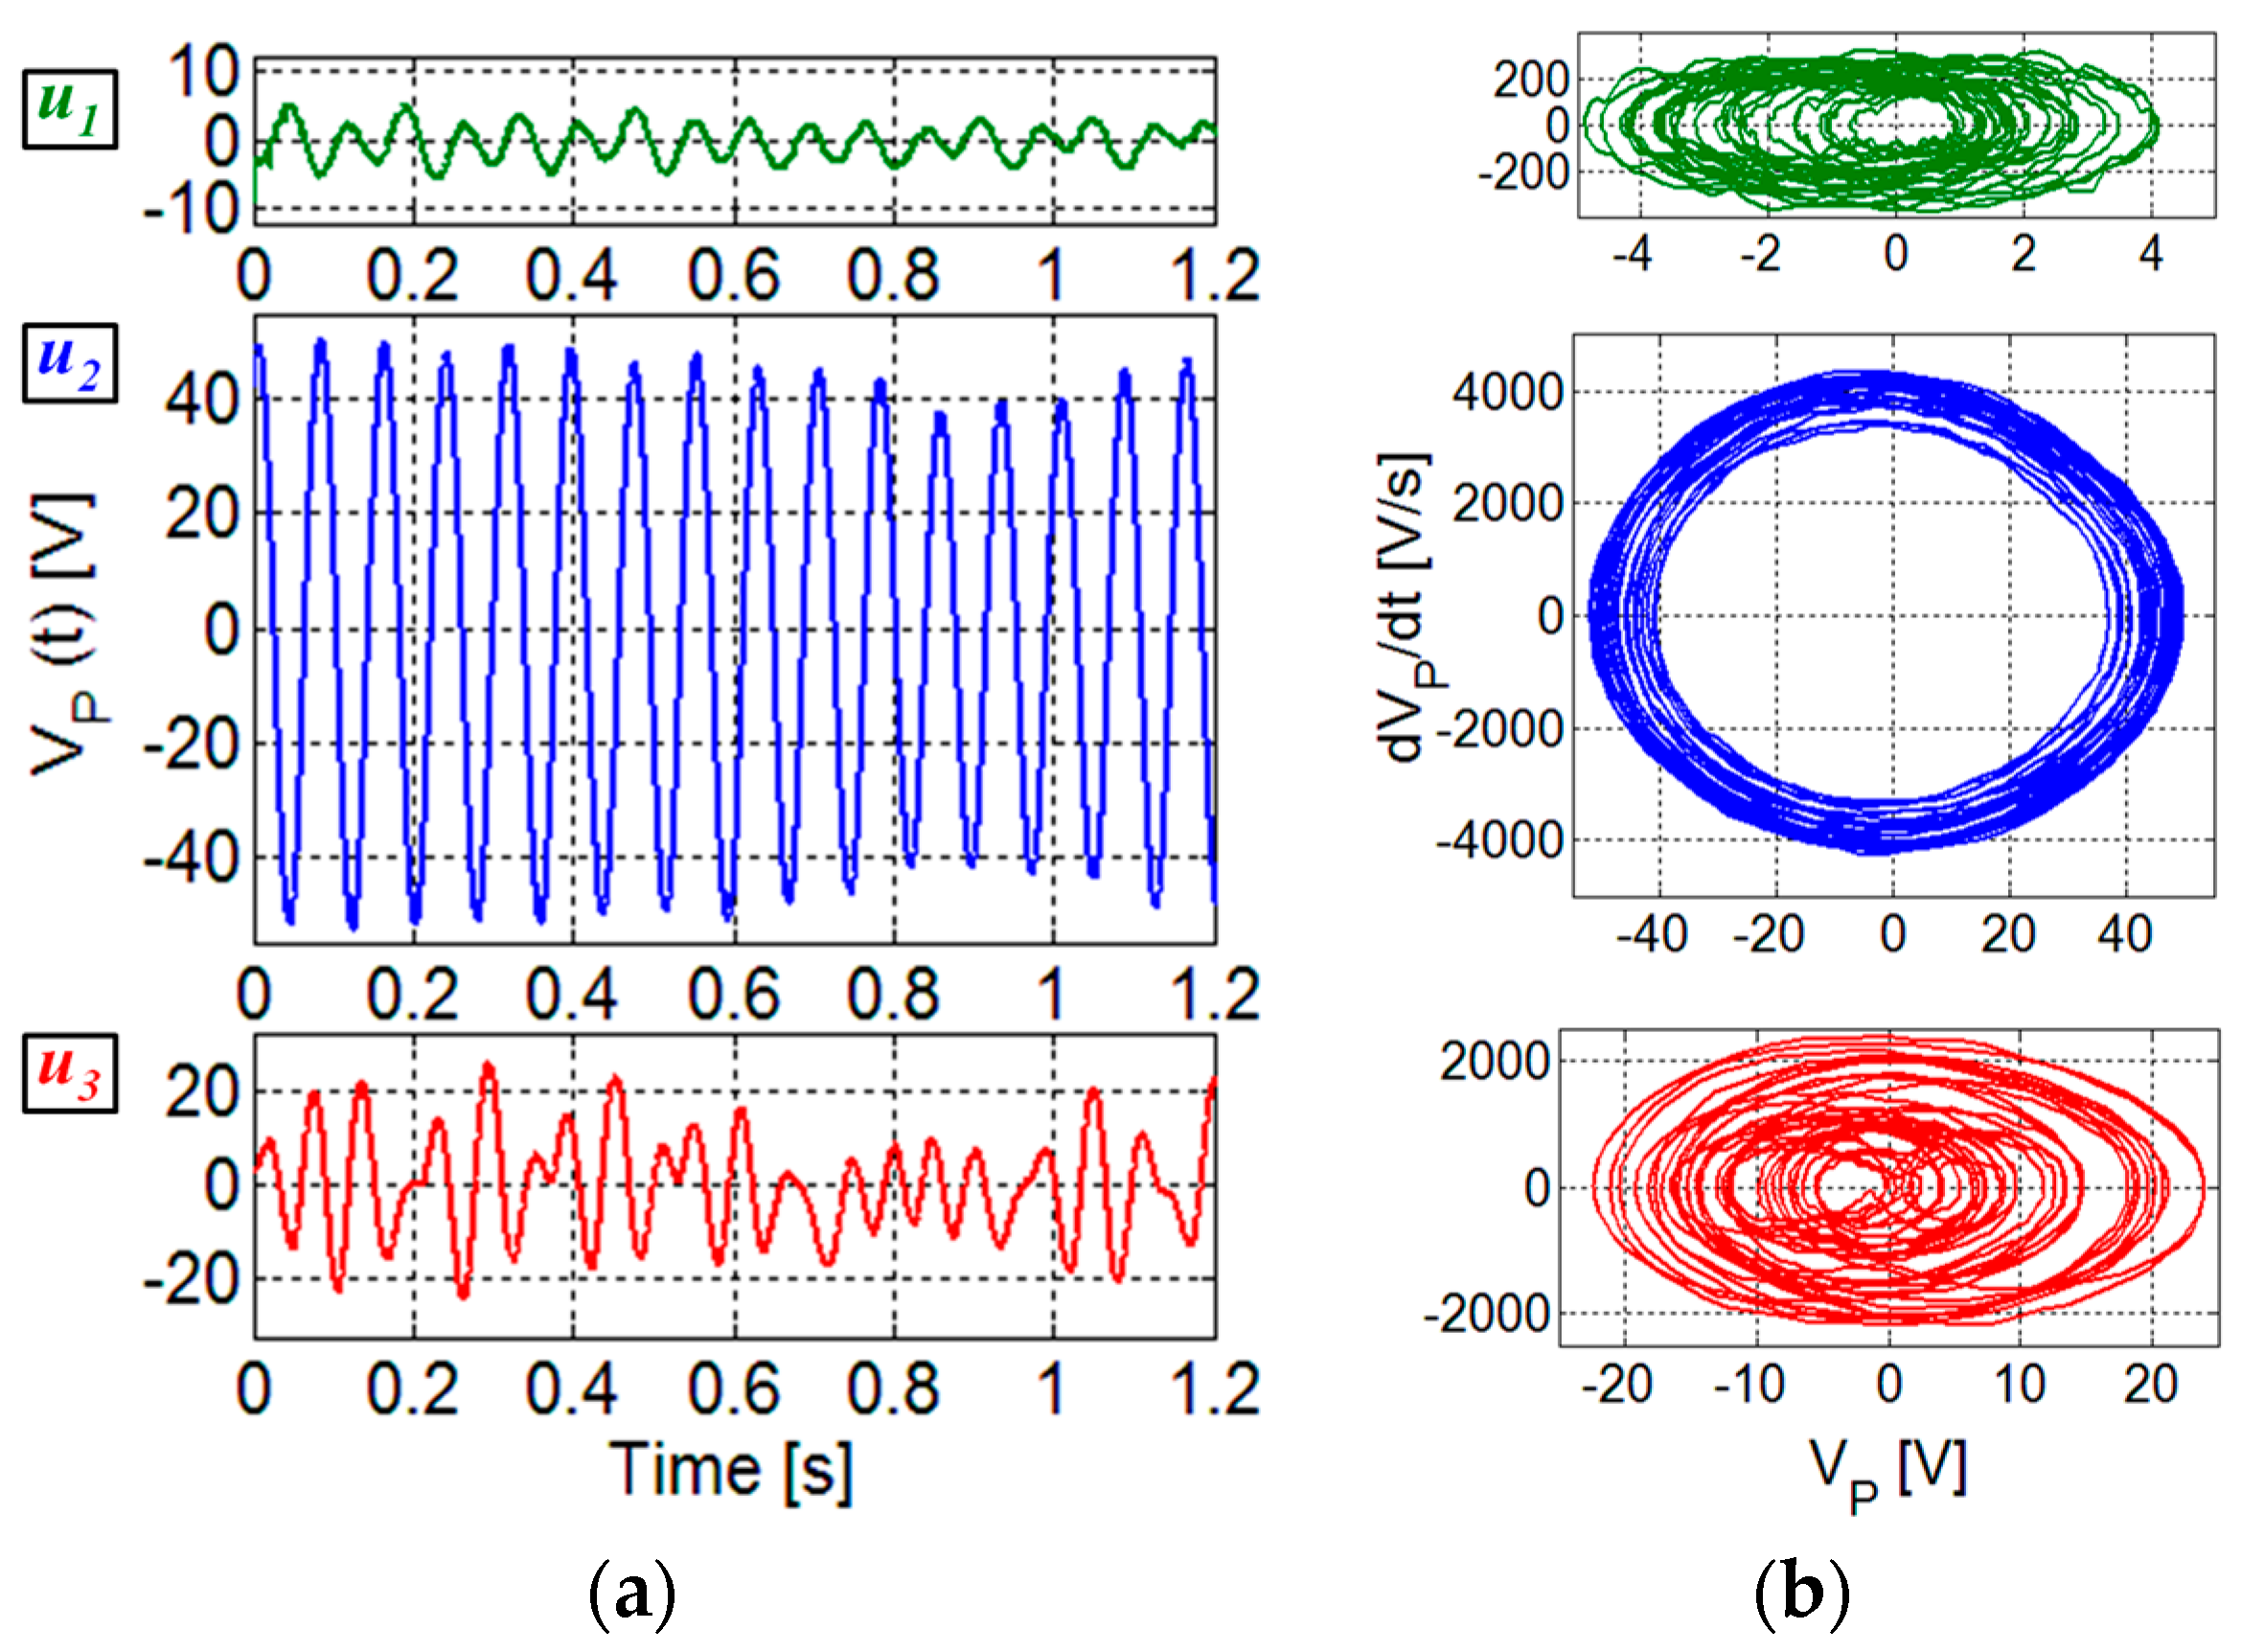
Figure 7.
Frequency spectrum of VP measured for three different flow velocities: u1 = 2.3 m/s, u2 = 4.2 m/s, and u3 = 6.2 m/s for the same orientation angle θ = 300°. The indication of frequency of the main components and the resonant frequency of the beam are reported.
Figure 7.
Frequency spectrum of VP measured for three different flow velocities: u1 = 2.3 m/s, u2 = 4.2 m/s, and u3 = 6.2 m/s for the same orientation angle θ = 300°. The indication of frequency of the main components and the resonant frequency of the beam are reported.

Figure 8.
Frequency spectra of the magnitude of the voltage VC calculated by Equation (3). Two cases are considered: repetition frequency of the vortices fV1 below the frequency fd of the damped oscillation (a); repetition frequency of the vortices fV2 above the frequency fd (b).
Figure 8.
Frequency spectra of the magnitude of the voltage VC calculated by Equation (3). Two cases are considered: repetition frequency of the vortices fV1 below the frequency fd of the damped oscillation (a); repetition frequency of the vortices fV2 above the frequency fd (b).

Figure 9.
Measured power PL on a resistive load RL = 15 kΩ as a function of the flow velocity with the beam oriented at the angle θ = 300°.
Figure 9.
Measured power PL on a resistive load RL = 15 kΩ as a function of the flow velocity with the beam oriented at the angle θ = 300°.
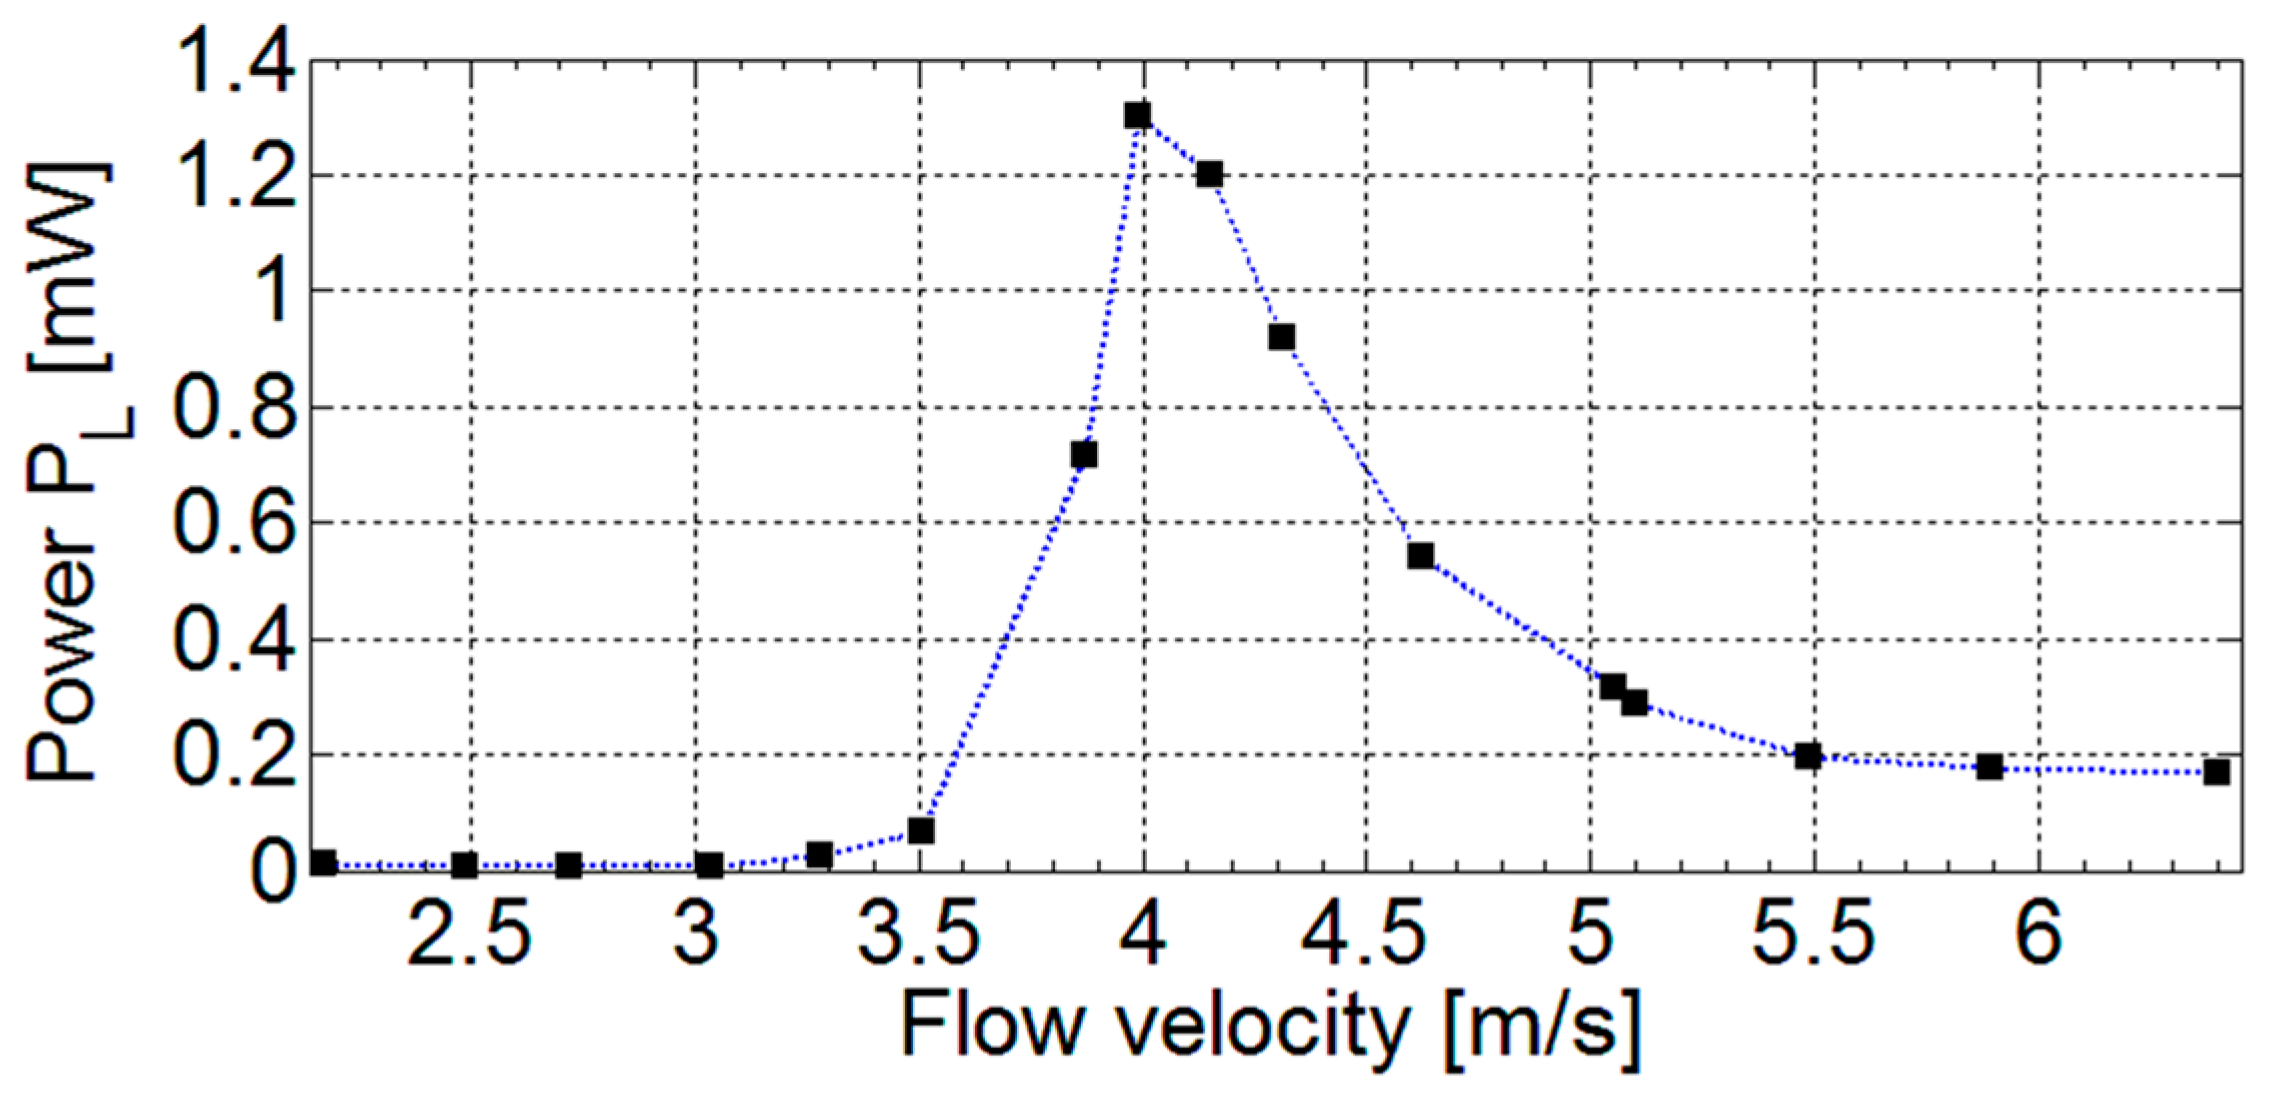
Figure 10.
Block diagram of the autonomous sensor module powered by the piezoelectric converter (a); Picture of the realized system with the oscillating beam and the sensors placed behind the bluff body in the wind tunnel (b).
Figure 10.
Block diagram of the autonomous sensor module powered by the piezoelectric converter (a); Picture of the realized system with the oscillating beam and the sensors placed behind the bluff body in the wind tunnel (b).
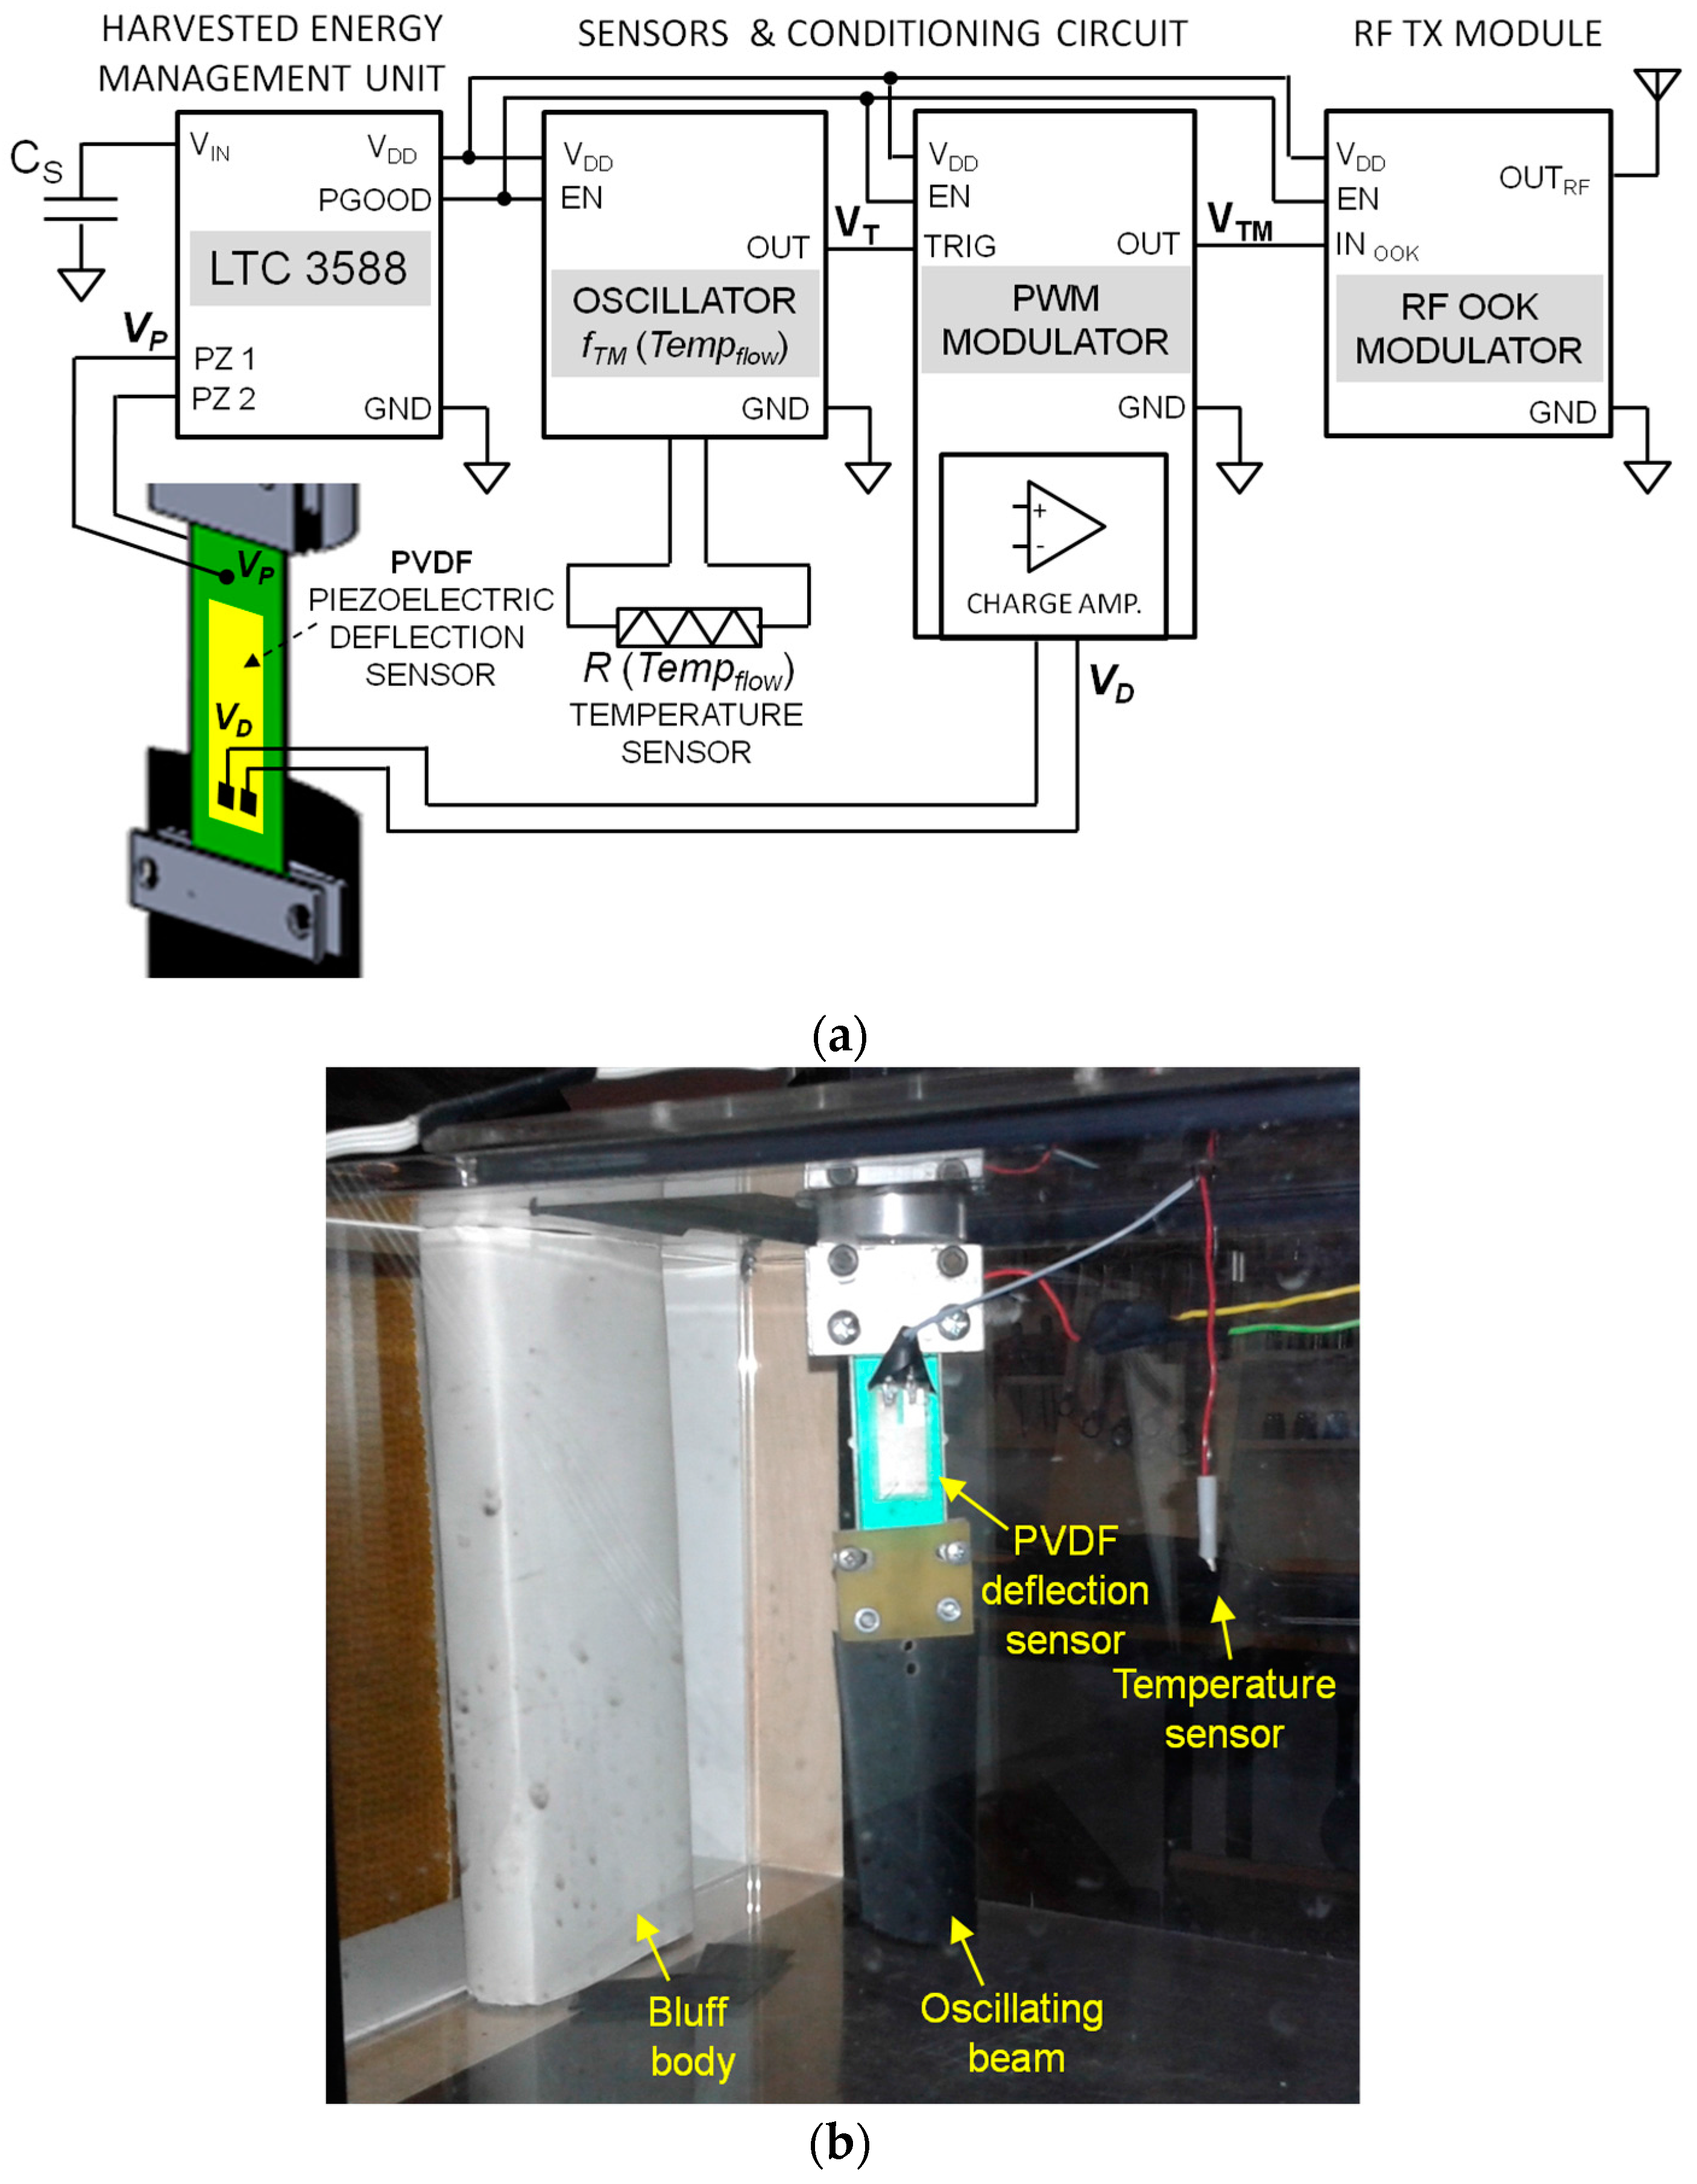
Figure 11.
Operation cycle of the power management unit. The voltages VCS_THS and VCS_MIN on the storage capacitor represent the thresholds at which the load circuit is powered and disconnected, respectively.
Figure 11.
Operation cycle of the power management unit. The voltages VCS_THS and VCS_MIN on the storage capacitor represent the thresholds at which the load circuit is powered and disconnected, respectively.

Figure 12.
VTM for two different temperature of the flow (a); Example of the VD signal from the PVDF foil on the beam, and the associated duty cycle of VTM (b).
Figure 12.
VTM for two different temperature of the flow (a); Example of the VD signal from the PVDF foil on the beam, and the associated duty cycle of VTM (b).
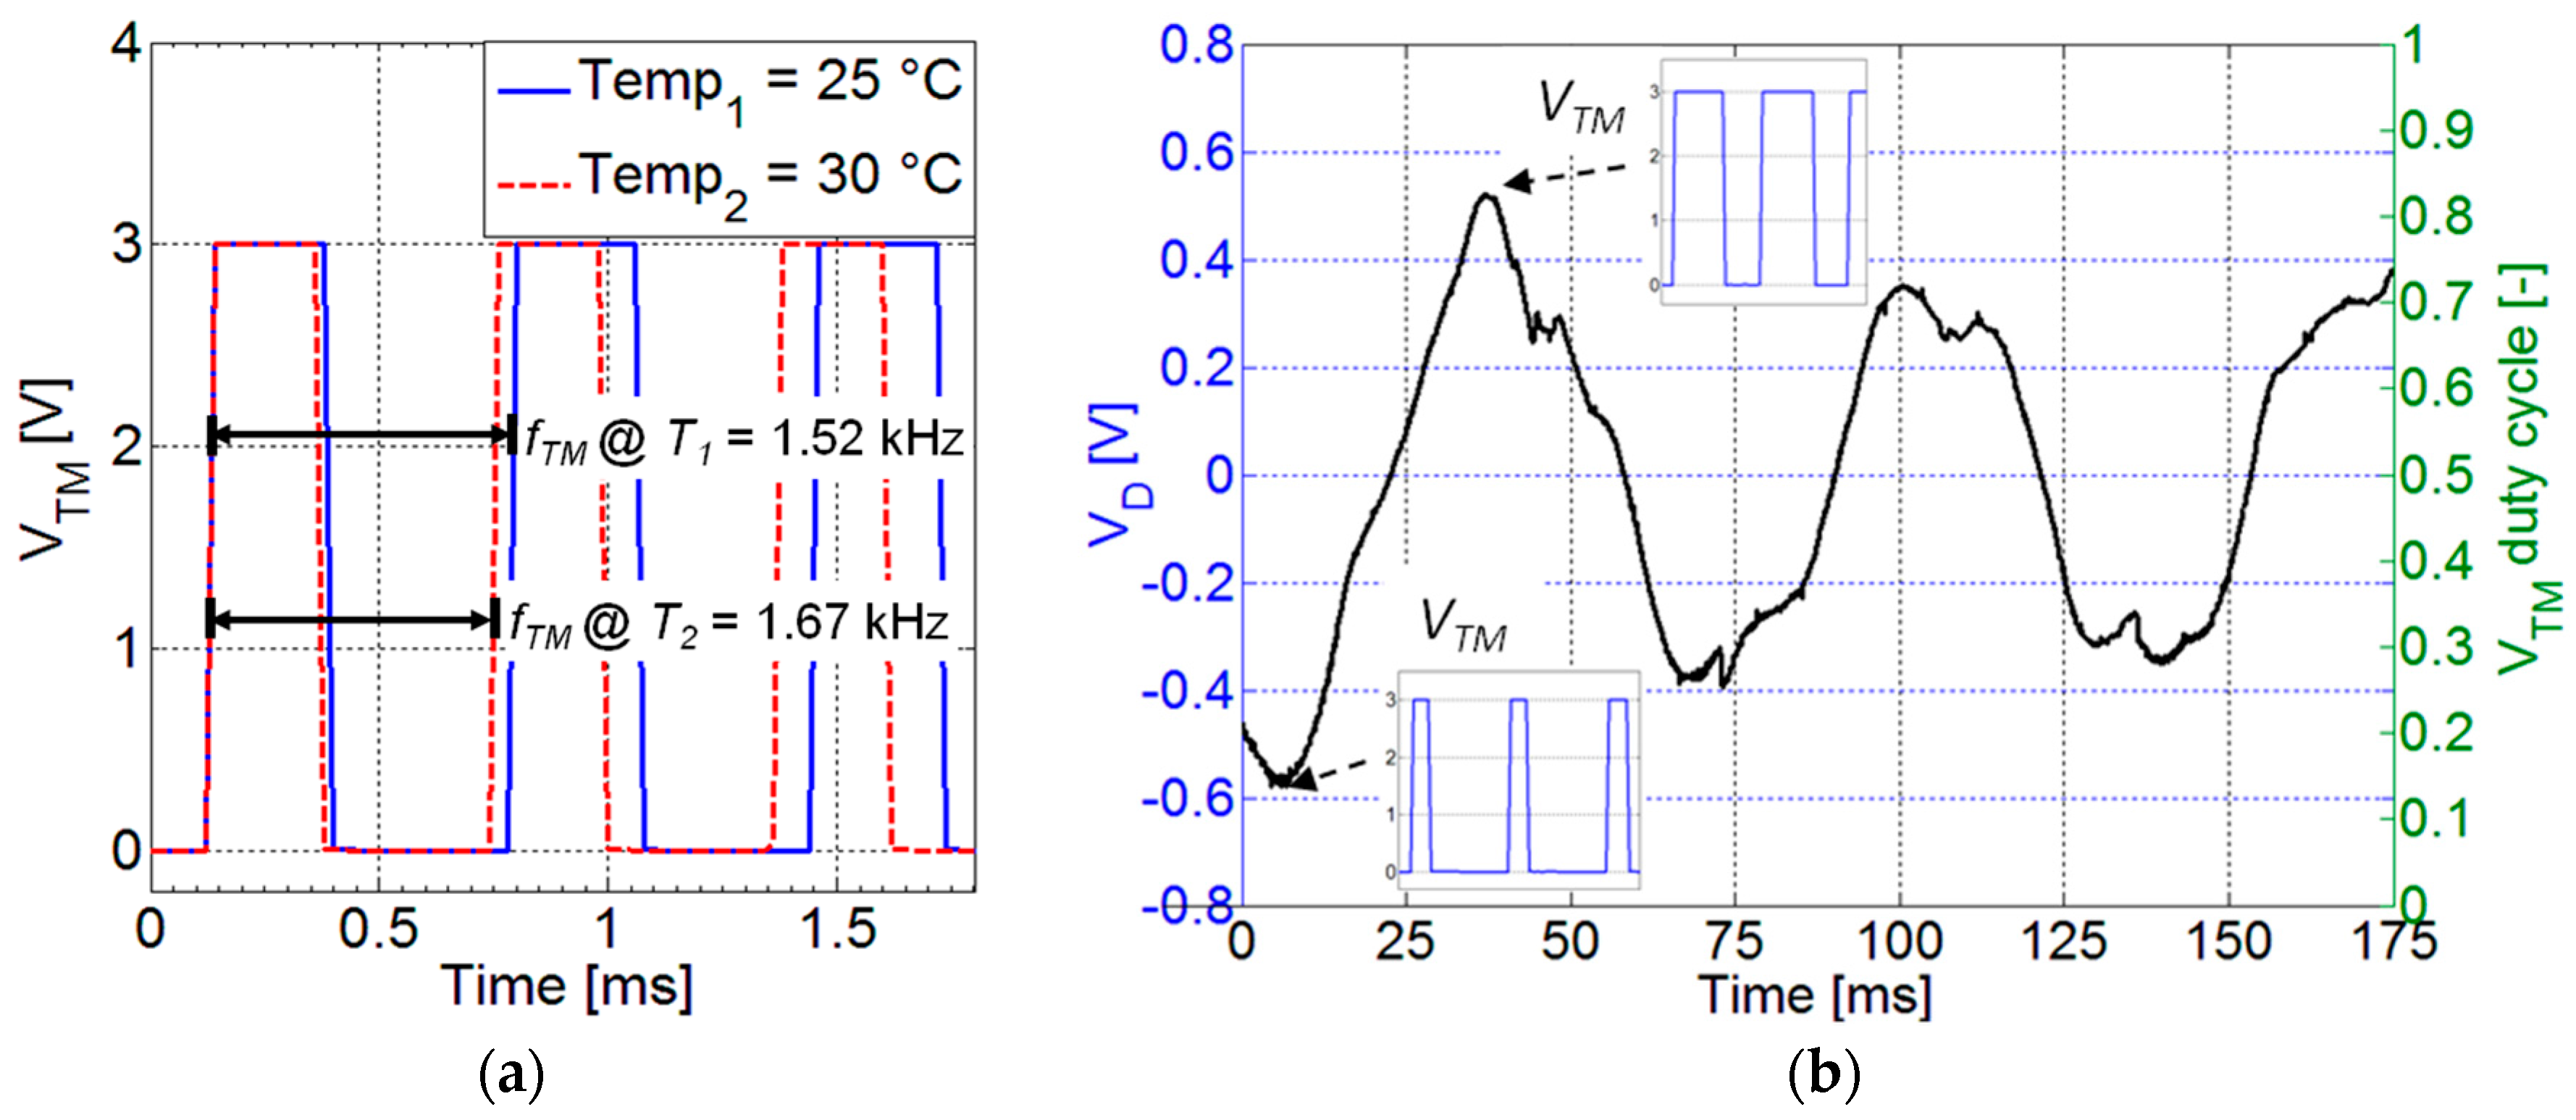
Figure 13.
Average harvested power and retransmission time interval as a function of the flow velocity.
Figure 13.
Average harvested power and retransmission time interval as a function of the flow velocity.

Table 1.
Grid convergence analysis: vortex frequency fu computed on the three grids, the order of convergence p, the GCIs and their relation are reported.
Table 1.
Grid convergence analysis: vortex frequency fu computed on the three grids, the order of convergence p, the GCIs and their relation are reported.
| u (m/s) | fu (Hz) h3 = 4 mm | fu (Hz) h2 = 2.83 mm | fu (Hz) h1 = 2 mm | p (-) | GCI2,3 (%) | GCI1,2 (%) | (-) |
|---|---|---|---|---|---|---|---|
| 2.0 | 8.03 | 8.41 | 8.55 | 2.99 | 7.45 | 2.60 | 1.016 |
| 7.0 | 28.07 | 29.30 | 29.74 | 2.98 | 6.98 | 2.44 | 1.015 |
© 2017 by the authors. Licensee MDPI, Basel, Switzerland. This article is an open access article distributed under the terms and conditions of the Creative Commons Attribution (CC BY) license (http://creativecommons.org/licenses/by/4.0/).
Share and Cite
MDPI and ACS Style
Demori, M.; Ferrari, M.; Bonzanini, A.; Poesio, P.; Ferrari, V. Autonomous Sensors Powered by Energy Harvesting from von Karman Vortices in Airflow. Sensors 2017, 17, 2100. https://doi.org/10.3390/s17092100
AMA Style
Demori M, Ferrari M, Bonzanini A, Poesio P, Ferrari V. Autonomous Sensors Powered by Energy Harvesting from von Karman Vortices in Airflow. Sensors. 2017; 17(9):2100. https://doi.org/10.3390/s17092100
Chicago/Turabian StyleDemori, Marco, Marco Ferrari, Arianna Bonzanini, Pietro Poesio, and Vittorio Ferrari. 2017. "Autonomous Sensors Powered by Energy Harvesting from von Karman Vortices in Airflow" Sensors 17, no. 9: 2100. https://doi.org/10.3390/s17092100
Note that from the first issue of 2016, this journal uses article numbers instead of page numbers. See further details here.