Electrospinning Hetero-Nanofibers In2O3/SnO2 of Homotype Heterojunction with High Gas Sensing Activity


1
College of mechanical and Electronic Engineering, Dalian Minzu University, Dalian 116600, China
2
School of Electronic Science and Technology, Dalian University of Technology, Dalian 116023, China
3
Department of Electrical and Computer Engineering, College of Engineering, Iowa State University, Ames, IA 50011, USA
4
School of Educational Technology, Shenyang Normal University, Shenyang 110034, China
5
School of Physics and Materials Engineering, Dalian Minzu University, Dalian 116600, China
*
Author to whom correspondence should be addressed.
Sensors 2017, 17(8), 1822; https://doi.org/10.3390/s17081822
Submission received: 2 July 2017
/
Revised: 3 August 2017
/
Accepted: 3 August 2017
/
Published: 9 August 2017
(This article belongs to the Special Issue Gas Sensors based on Semiconducting Metal Oxides)
Abstract
:In2O3/SnO2 composite hetero-nanofibers were synthesized by an electrospinning technique for detecting indoor volatile organic gases. The physical and chemical properties of In2O3/SnO2 hetero-nanofibers were characterized and analyzed by X-ray diffraction (XRD), field emission scanning electron microscope (FE-SEM), Energy Dispersive X-Ray Spectroscopy (EDX), specific surface Brunauer–Emmett–Teller (BET) and X-ray photoelectron spectroscopy (XPS). Gas sensing properties of In2O3/SnO2 composite hetero-nanofibers were measured with six kinds of indoor volatile organic gases in concentration range of 0.5~50 ppm at the operating temperature of 275 °C. The In2O3/SnO2 composite hetero-nanofibers sensor exhibited good formaldehyde sensing properties, which would be attributed to the formation of n-n homotype heterojunction in the In2O3/SnO2 composite hetero-nanofibers. Finally, the sensing mechanism of the In2O3/SnO2 composite hetero-nanofibers was analyzed based on the energy-band principle.
1. Introduction
With the aggravation of environmental pollution and the deterioration of the climate, human beings have put forward higher requirements on the gas detection of living environment. Semiconductor metal oxides have been investigated extensively and applied widely in the various fields of gas detection technology for its low cost, high accuracy, small size and easy to carry [1,2,3,4]. There are many parameters and factors that affect and limit gas sensor applications, such as adsorption ability, catalytic activity, sensitivity, selectivity, thermodynamic stability, and so on [5].
Among the various semiconductor gas sensitive materials, SnO2 is used popularly as gas sensors because of excellent adsorption ability, high sensitivity at relatively low operating temperatures, but there is a challenge to improve the sensing performance due to the cross-sensitivity of SnO2 gas sensors [6,7]. To enhance the gas sensing properties of SnO2, doping or surface modification methods have been adopted [8,9]. In addition, the preparation of composite semiconductor metal oxides attracts more attention [10,11]. The physical interface between two dissimilar materials is often referred to as a heterojunction. The new composite incorporates two components forming a heterostructure. Gas sensors based on the composite are more sensitive than the individual components due to the interface heterostructure and a synergistic effect between the two components [5,12]. Some researchers found that the heterojunction acts as a lever in electron transfer, through which electron transport is facilitated or restrained resulting in superior sensing performance [13,14,15,16,17,18]. Recently, many heterostructure composites such as SnO2/ZnO [19,20], TiO2/SnO2 [21], SnO2/Fe2O3 [22] have been prepared to be applied as gas sensing materials to obtain the sensitive and selective gas sensors. In2O3 and SnO2 heterostructure composites have also been synthesized to enhance the properties of sensors [23,24,25]. In2O3/SnO2 heterojunction microstructures synthesized by a facile room temperature solid-state reaction route exhibited high response to chlorine [26]. A rapidly responding methanol sensor based on electrospinning In2O3/SnO2 nanofibers was reported [27]. Many researchers have found that In2O3 can be used to effectively limit grain growth of the SnO2 host nanoparticles in the high temperature synthesis process to affect gas sensitivity and selectivity [28]. However, to the best of our knowledge, few reports have shown that In2O3–SnO2 heterostructure composites have an excellent response and selectivity for formaldehyde.
In this manuscript, In2O3/SnO2 composite hetero-nanofibers with n-n-type heterojunction were synthesized successfully by a mixed electrospinning method. Gas sensors based on In2O3/SnO2 composite hetero-nanofibers were fabricated for detecting low concentration indoor volatile organic gas. Six kinds of indoor volatile organic gases (including formaldehyde, ethanol, acetone, methanol, toluene and ammonia) were tested based on In2O3/SnO2 composite hetero-nanofibers sensors by a static gas test method. It was found that In2O3/SnO2 composite hetero-nanofibers sensors show excellent formaldehyde sensing properties superior to the pure SnO2 or In2O3 nanofibers sensors at a low operating temperature of 275 °C, which could be attributed to the formation of n-n homotype heterojunction in the In2O3/SnO2 composite hetero-nanofibers.
2. Experimental
2.1. Preparation and Characterization of In2O3/SnO2 Composite Hetero-Nanofibers
All chemical reagents used were of the analytical grade in the experiments; 0.76 g indium nitrate (In(NO3)3·4.5H2O), 0.45 g stannous chloride (SnCl2·2H2O) and 10 ml ethanol were mixed and stirred vigorously for 1 h. The molar ratio of In to Sn in the composites is 1:1. Then, 1 g Polyvinyl pyrrolidone (PVP, Mw = 1,300,000) and 8 ml N, N Dimethylformamide (DMF) were added to the mixture solution and stirred for 3 h until dissolved evenly at the room temperature. The colorless and transparent mixed electrospinning precursor solution was formed.
The mixed precursor solution was loaded into the glass syringe with a metal jet. A high DC voltage was applied between the jet and the collector. The precursor was ejected from the jet and formed a wet nanofibers net under the electric force. Then, the net was heated at 600 °C for 120 min in the air using a muffle furnace with temperature control system. PVP and water in the polymer nanofibers volatilized during the annealing process. Finally, the light yellow In2O3/SnO2 composite hetero-nanofibers were obtained. Pure SnO2 and In2O3 electrospinning nanofibers were synthesized by using a traditional electrospinning device, respectively. The annealing process of SnO2 and In2O3 electrospinning nanofibers were the same as that of In2O3/SnO2 composite hetero-nanofibers.
The phase structure and morphology of the In2O3/SnO2 composite hetero-nanofibers were characterized by an X-ray diffraction instrument (XRD: D/Max 2400, Rigaku, Japan) in 2θ region of 20~80° with Cu Kα1 radiation and a field emission scanning electron microscope (FE-SEM: Hitachi S-4800, Japan), respectively. The composition and contents were analyzed by using an Energy Dispersive X-Ray Spectroscopy (FE-SEM: Hitachi S-4800, Japan). The specific surface was measured by a Brunauer–Emmett–Teller (BET: Quanta AUTOSORB-1-MP, Boynton Beach, FL, USA) method. The chemical composition and surface state were examined using high-resolution X-ray photoelectron spectroscopy (XPS) on a spectrometer (XPS: Thermo ESCALAB 250Xi, Westmont, IL, USA). The AC impedance spectroscopy of electrochemical properties was carried out and analyzed on an impedance analyzer (B1500A, Agilent, Santa Clara, CA, USA).
2.2. Sensors Fabrication and Measurements
In2O3/SnO2 composite hetero-nanofibers were mixed with deionized water to form a paste. The paste was coated onto the surface of a ceramic tube with a pair of gold electrodes to form a sensitive film (about 300 μm thick) and dried in hot air, then, annealed at 500 °C for 2 h in open air. Finally, a Ni-Cr heating wire used as a heating electrode was inserted into the ceramic tube to form an inside-heated gas sensor. The inside-heated gas sensor picture is shown in Figure 1a. Indoor volatile organic gases were measured based on In2O3/SnO2 composite hetero-nanofibers sensor using a static-state gas-sensing test method [17]. In the detection process of volatile organic gases, a given amount of target gas was injected into a hermetic chamber (50 L in volume) by a syringe through a rubber plug. For a required concentration, the volume of the injected gas (V) can be calculated by theEquation (1) [29]:
where C is the concentration of the target gas (ppm), and v% is the volume fraction of bottled gas injected from the gas inlet hole. The gas response (S) was defined as a ratio of the electrical resistance of the sensor in the air (Ra) to that in target gas (Rg): S = Ra/Rg [17]. A structure schematic diagram of the static gas testing system was shown in Figure 1b.
3. Results and Discussion
3.1. Characterization
The XRD patterns of the pure SnO2, In2O3 nanofibers and In2O3/SnO2 composite hetero-nanofibers are shown in Figure 2a–c. We can see from Figure 2a,b that the SnO2 spinning nanofibers belong to tetragonal rutile [Joint Committee on Powder Diffraction Standards [(JCPDS) 41-1445] (square) and the In2O3 nanofibers belong to cubic phase [JCPDS 71-2195] (circle). As shown in Figure 2c, both SnO2 and In2O3 exist in the In2O3/SnO2 composite hetero-nanofibers. According to the results calculating by the Debye–Scherrer equation [30]:
where is the size of the crystalline domains, which may be smaller or equal to the grain size; K is the dimensionless shape factor, with a value close to unity. The shape factor has a typical value of about 0.9; λ is the X-ray wavelength; β is the line broadening at half the maximum intensity, after subtracting the instrumental line broadening, in radians. This quantity is also sometimes denoted as Δ(2θ); θ is the Bragg angle. The average crystallite sizes of the pure SnO2 nanofibers (Figure 2a) and the pure In2O3 nanofibers (Figure 2b) are 21 nm and 37 nm, respectively. Meanwhile, the average crystallite size of the In2O3/SnO2 composite hetero-nanofibers (Figure 2c) is 20 nm. The average crystallite size of In2O3/SnO2 composite hetero-nanofibers is much smaller than that of pure In2O3 nanofibers and the same as that of the pure SnO2 nanofibers.
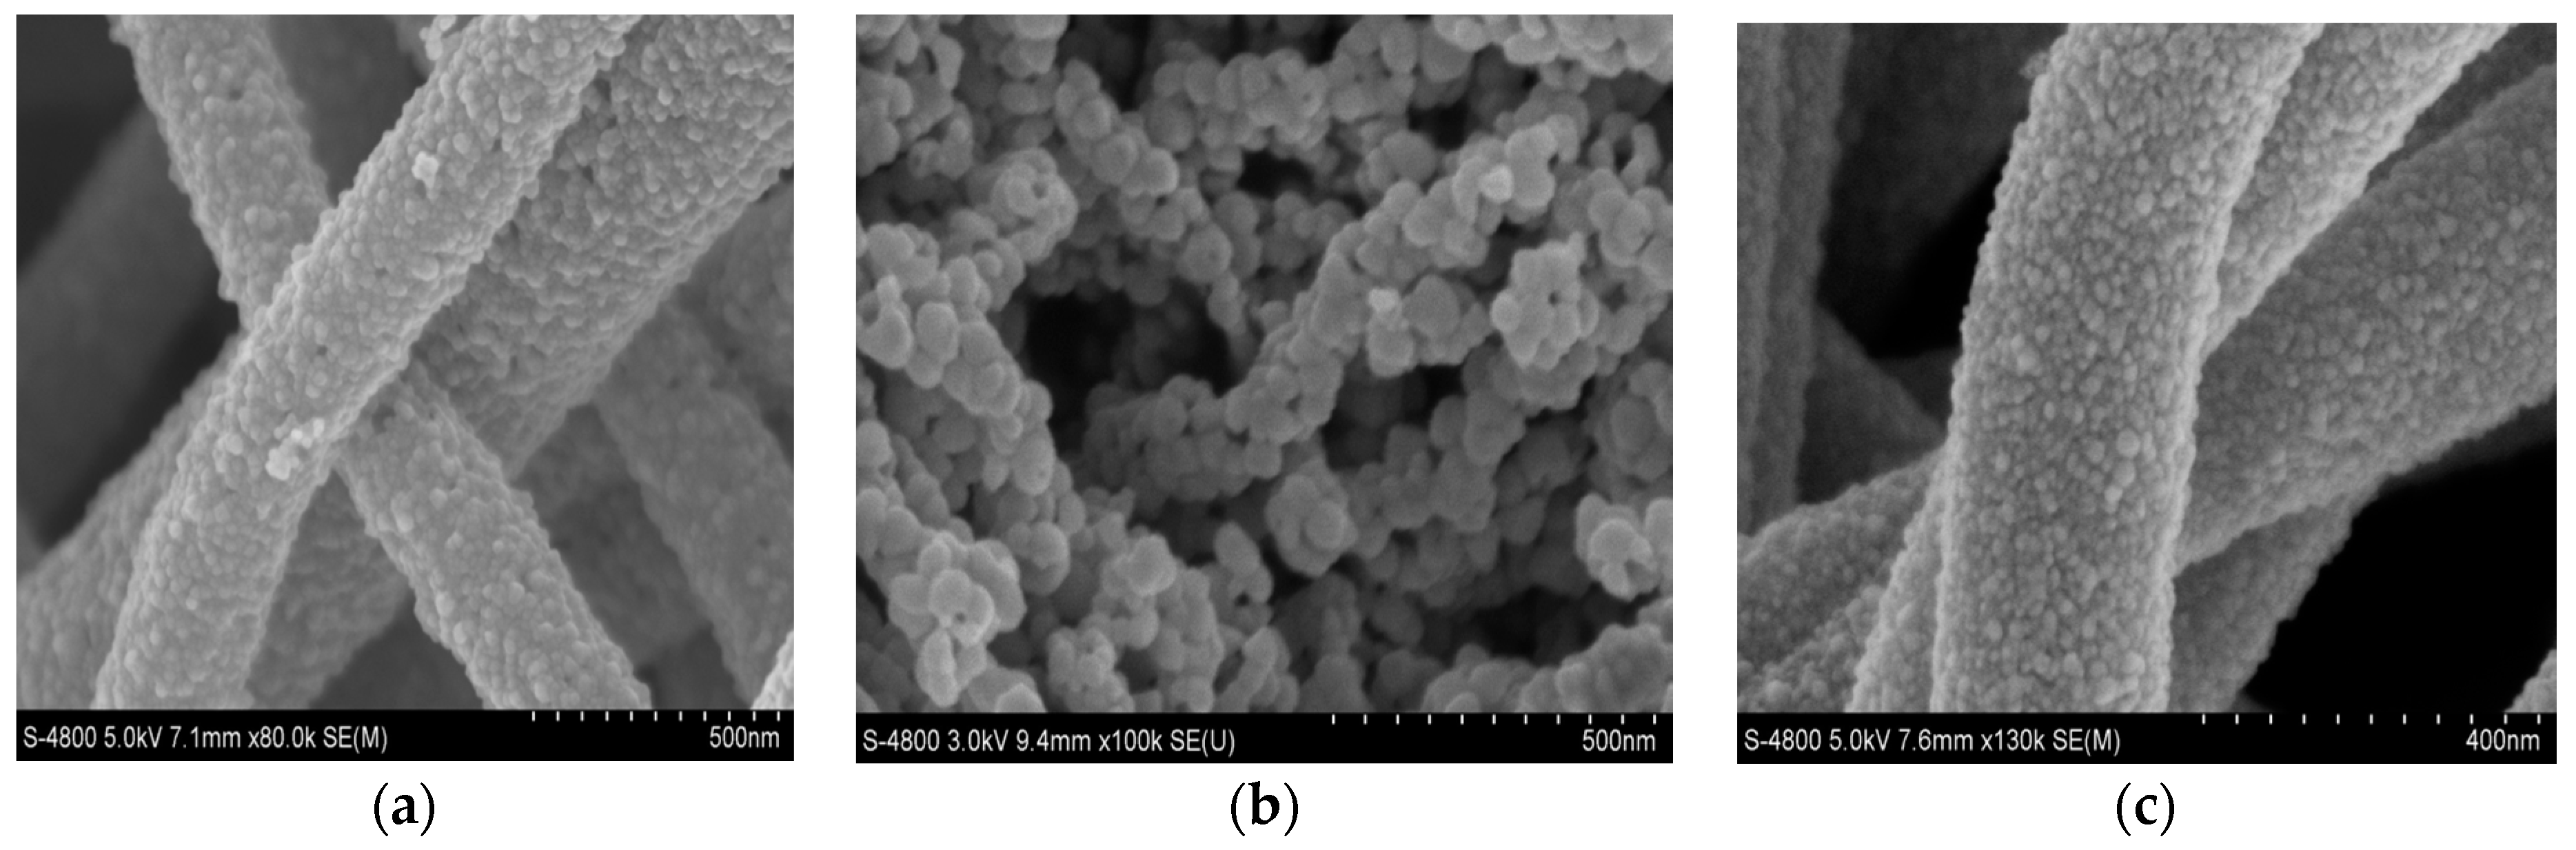
Figure 3a–c give the SEM images of the as-prepared SnO2 nanofibers, In2O3 nanofibers and In2O3/SnO2 composite hetero-nanofibers, respectively. It can be seen from Figure 3a–c that SnO2, In2O3 and In2O3/SnO2 nanofibers are hierarchical structures composed of small nanoparticles. As depicted in Figure 3a, the diameters of SnO2 nanofibers are ~200 nm, and the diameters of SnO2 nanoparticles are about 20 nm. Figure 3b shows that the surfaces of the In2O3 nanofibers are irregular and slightly rough with the diameters of 150 nm. Each In2O3 nanofiber is composed of many nanoparticles with the diameters of 35–40 nm. Figure 3c displays that the diameters of In2O3/SnO2 composite hetero-nanofibers are about 410 nm. The In2O3/SnO2 nanofibers are much thicker than SnO2 and In2O3 nanofibers. The diameters of In2O3/SnO2 nanoparticles are about 16 nm. The diameters of In2O3/SnO2 nanoparticles are smaller than those of In2O3 or SnO2 nanofibers.
There is a big difference among the morphologies and structures of the three kinds of nanofibers. In the process of nanofibers formation, the forces of each nanoparticle will be influenced by many factors, such as the surface tension, solubility, electric field force and so on. Of the factors that affect the morphology and structures, the conductivity of salt solutions must be considered. The conductivities of SnCl2 solution, In(NO3)3 solution and the mixed solution are different, which will result in the great difference of the electric field force and the Coulomb force of the nanofibers ejected from the spinning jet. These will have an effect on the diameters and morphologies of the nanofibers. At the same time, SnCl2 and In(NO3)3 are mixed sufficiently, the distribution of Sn and In ions in the solution is relative uniformity. The arrangement and distribution of two kinds of nanoparticles in the nanofibers are uniform.
Figure 4 gives the Energy Dispersive X-ray (EDX) spectra of the In2O3/SnO2 composite hetero-nanofibers. It can be observed in Figure 4 that O, In, and Sn elements are present in the spectra of the In2O3/SnO2 composite hetero-nanofibers. Table 1 lists the elemental contents of O, In and Sn in In2O3/SnO2 composite. The weight percentages of O, In and Sn are 31.5%, 19.6% and 48.9%, respectively. The atomic percentages of O, In and Sn are 77.2%, 6.7% and 16.1%, respectively.
Figure 5 gives the N2 isotherms adsorption–desorption curves of In2O3/SnO2 composite hetero-nanofibers. As shown in Figure 5, the N2 isotherms adsorption–desorption curves of In2O3/SnO2 composite hetero-nanofibers belong to the IV-type isotherms, which demonstrates that In2O3/SnO2 composite nanofibers are the mesoporous solid materials. The adsorption curve and desorption curve are different. H3-type hysteresis loop is shown in Figure 5, which means that the whole adsorption process can be divided into the monolayer adsorption process of the first zone, the multilayer adsorption process of the second zone, and the capillary condensation process of the third zone. The adsorption process belongs to the weak saturation adsorption [31]. According to the inset in Figure 5, the specific surface (BET) of In2O3/SnO2 composite hetero-nanofibers is 16.67 m2/g, and the pore distribution is in the range of 2.3–9.5 nm. The pore distribution of In2O3/SnO2 composite hetero-nanofibers spreads out widely and disorderly. The saturated zone is not obvious. The results show that the In2O3/SnO2 composite hetero-nanofibers adsorption mechanism is disorder mesoporous adsorption. This kind of hierarchically composite fibers composed of small nanoparticles does not show significant absorption limit in the relatively high-pressure region.
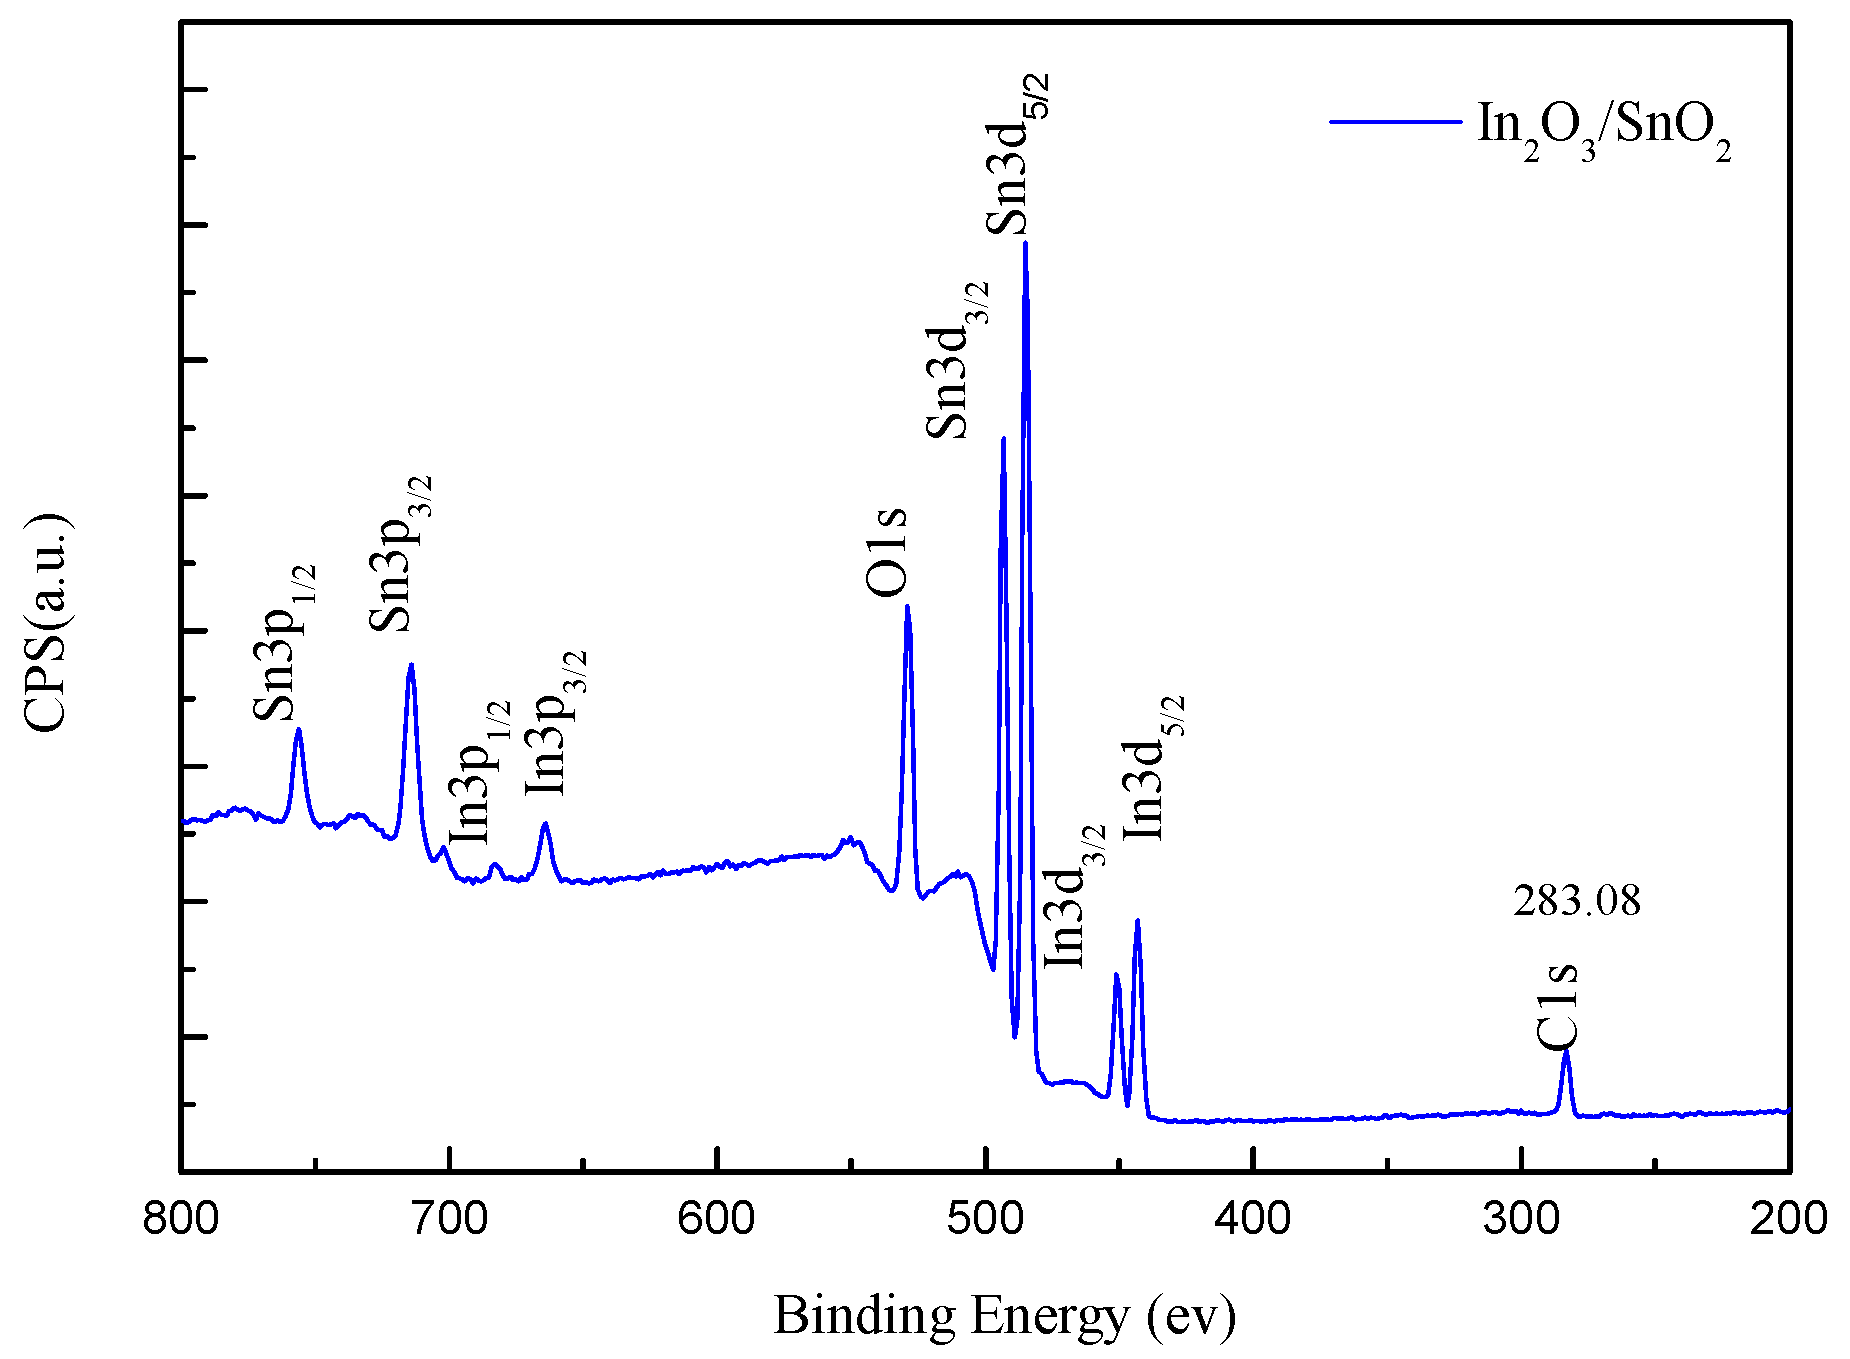
To further confirm the chemical composition and surface oxidation state, the X-ray photoelectron spectroscopy (XPS) of In2O3/SnO2 composite hetero-nanofibers is performed, and the XPS survey spectrum of In2O3/SnO2 composite hetero-nanofibers is shown in Figure 6. As expected, the XPS spectrum of In2O3/SnO2 is dominated by the lines of In, Sn, O and C. The C element is attributed to adventitious carbon-based additives and the C1s, whose banding energy peak locating at 283.08 eV, is used as reference for calibration. There are nine main peaks in the spectrum of In2O3/SnO2 composite hetero-nanofibers, and they are Sn3p1/2, Sn3p3/2, In3p1/2, In3p3/2, O1s, Sn3d3/2, Sn3d5/2, In3d3/2 and In3d5/2, respectively.
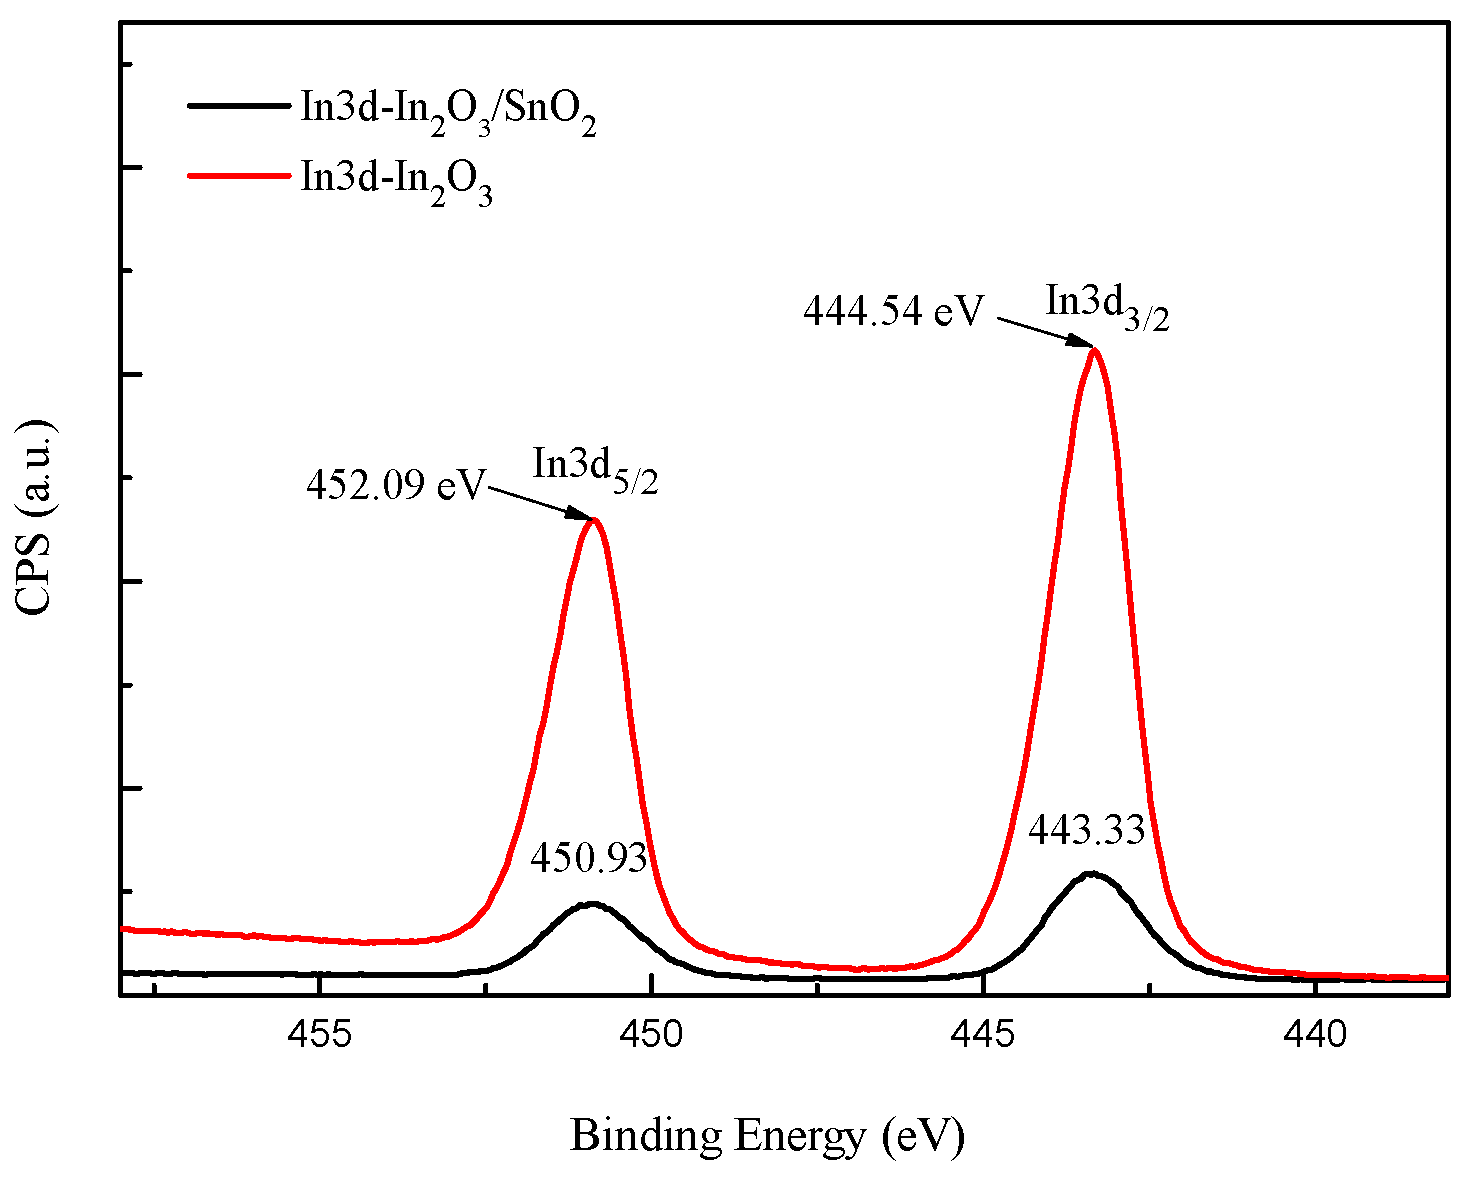
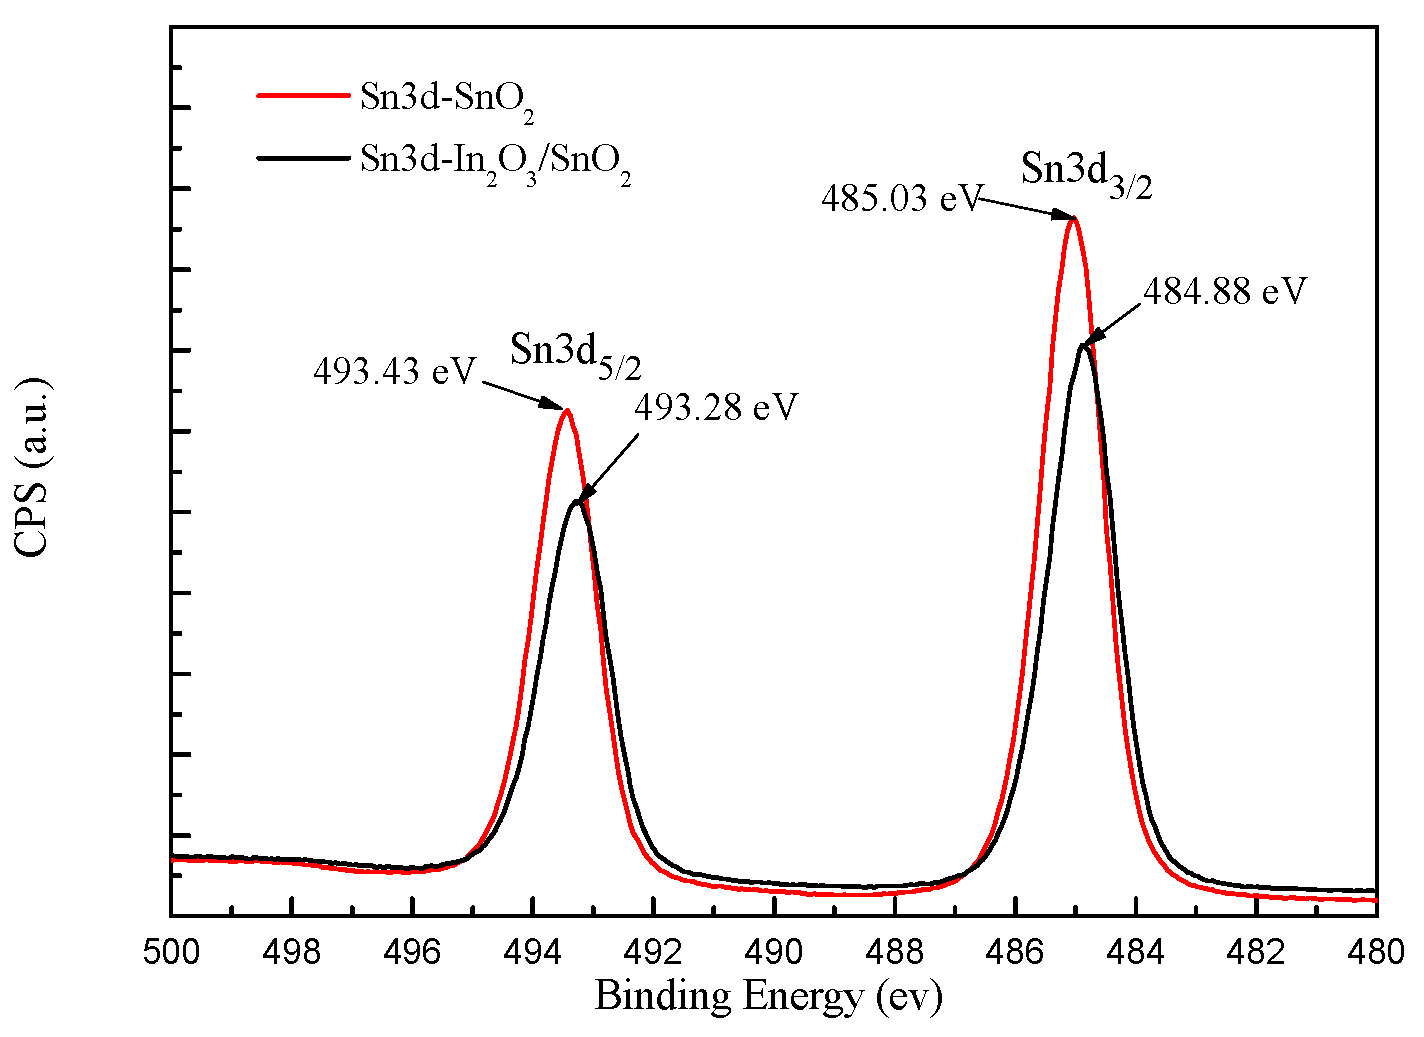
As can be seen in In3d core level XPS spectrum of In2O3/SnO2 composite hetero-nanofibers (Figure 7), two binding energy peaks centered at 443.33 eV and 450.93 eV are ascribed to In3d5/2 and In3d3/2, respectively, which originate from In-O in In2O3 lattice [32]. Figure 8 shows Sn3d core level XPS spectrum of In2O3/SnO2 composite hetero-nanofibers. As shown in Figure 8, the binding energy of Sn3d3/2 and Sn3d5/2 obtained from the XPS measurements are 484.88 eV and 493.28 eV, respectively, which indicates that Sn in the composites has s valence of +4 [33]. Compared with In3d5/2 (452.09 eV) and In3d3/2 (444.54 eV) of pure In2O3, the binding energy of both In3d5/2 and In3d3/2 of In2O3/SnO2 composite hetero-nanofibers moves to higher binding energy direction. On the contrary, the binding energy of both Sn3d3/2 and Sn3d5/2 of In2O3/SnO2 composite hetero-nanofibers moves to lower binding energy direction compared with Sn3d3/2 (493.43 eV) and Sn3d5/2 (485.03 eV) of pure SnO2 nanofibers. This phenomenon, due to electron transfer, will occur from In2O3 to SnO2 until the energy-band diagram of the n-n heterojunction of In2O3/SnO2 comes to equilibrium [14,34,35]. This phenomenon can also be explained by the strong interaction between In2O3 and SnO2, which will lead to the decreased surface activity of SnO2 and the increased surface activity of In2O3 [36].
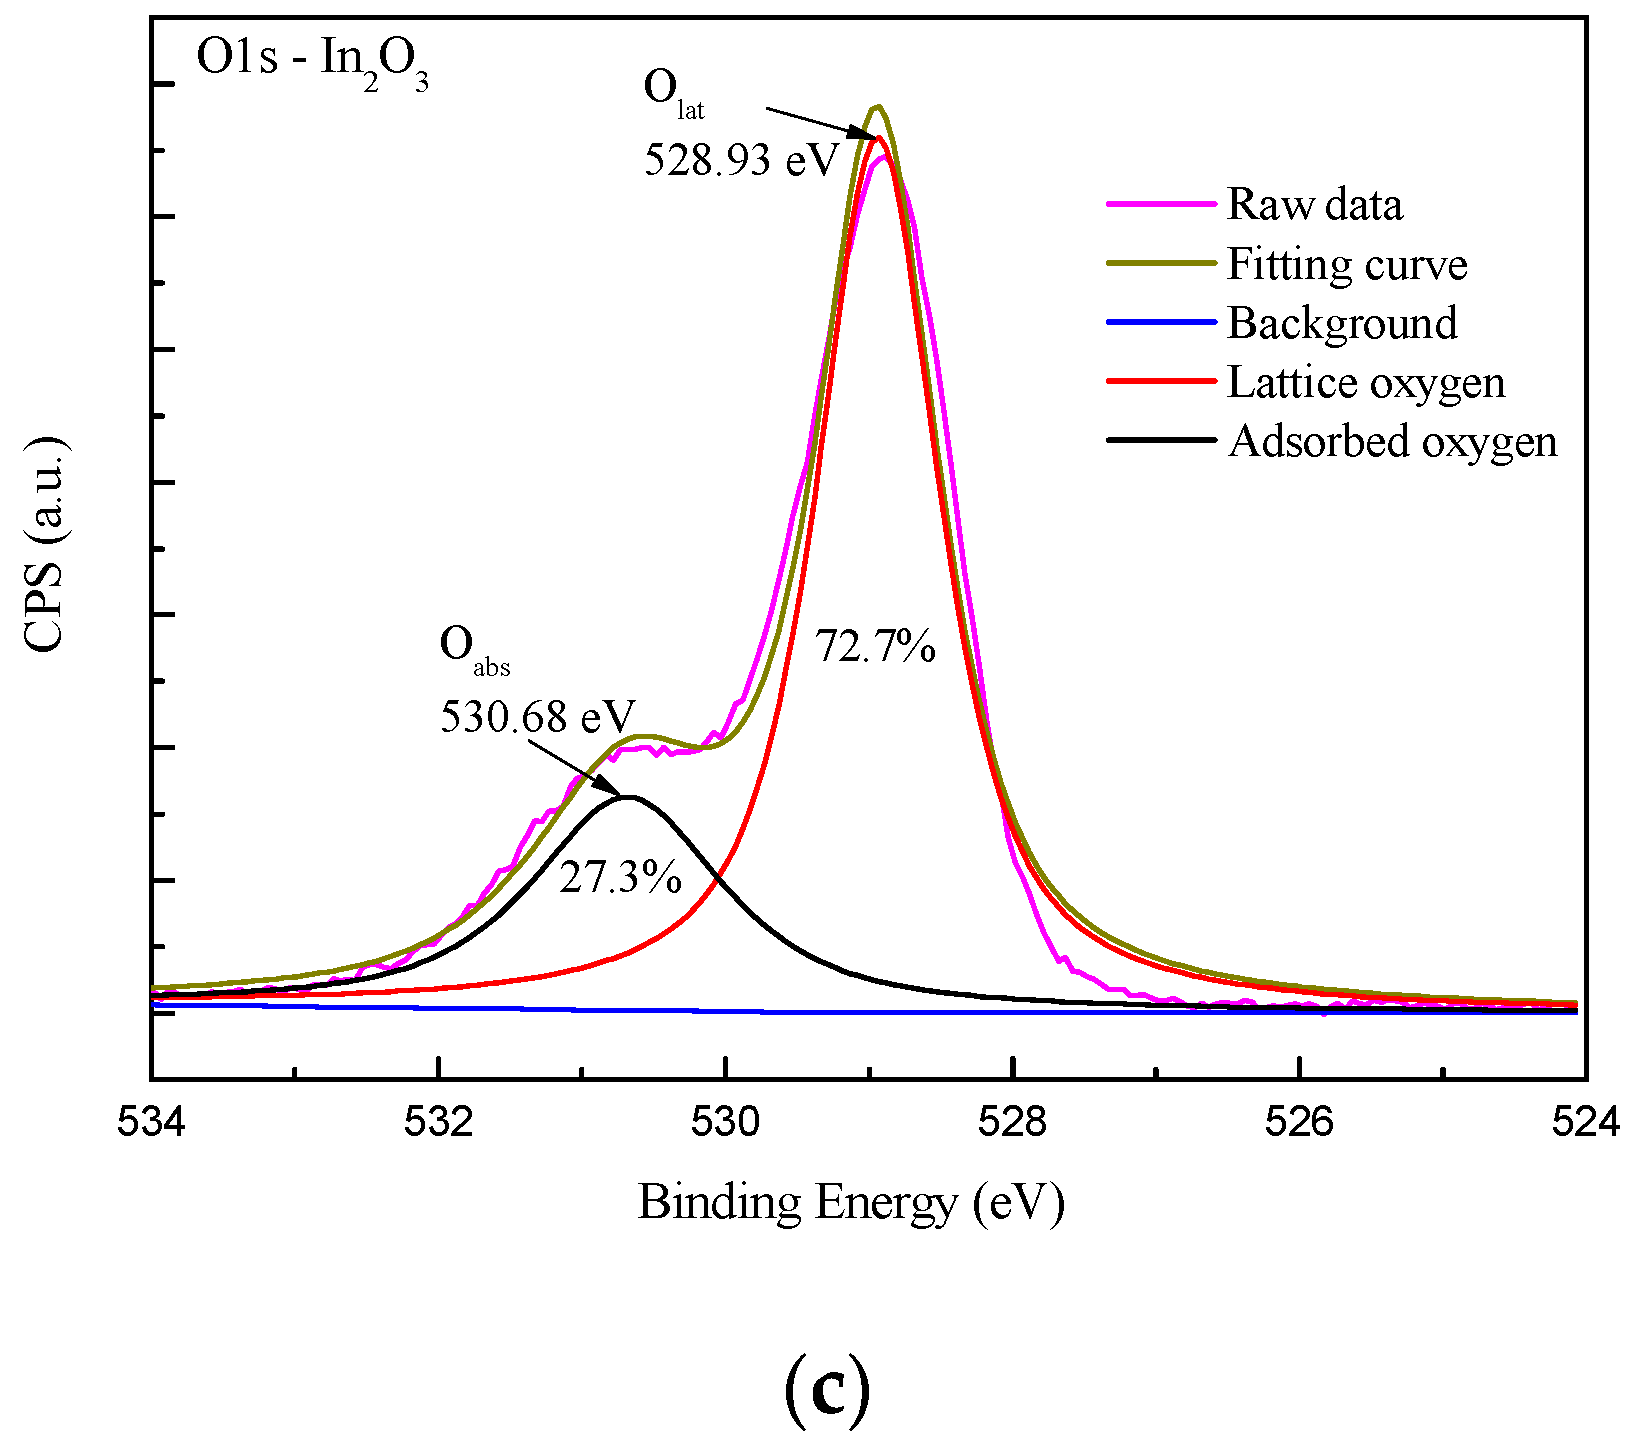
Figure 9 gives O1s core level XPS spectrums of In2O3/SnO2 composite hetero-nanofibers, In2O3 nanofibers and SnO2 nanofibers, respectively. As can be seen in Figure 9a, an asymmetric peak at 528.73 eV is shown on O1s core level XPS spectrum of In2O3/SnO2 composite nanofibers. The peak of O1s can be separated into two peaks at Olat (528.73 eV) and Oads (530.28). The Olat (528.73 eV) can be assigned to the lattice oxygen on the surface of In2O3/SnO2 composite hetero-nanofibers. It will not participate in the chemical reaction in the process of gas adsorption below 300 °C. The Oads is attributed to the adsorbed oxygen of In2O3/SnO2 composite hetero-nanofibers. Adsorbed oxygen participates in the reaction with activity in the process of gas adsorption. The relative intensities of Olat and Oads contributions are 70.5% and 29.5%, respectively. Similarly, the relative intensities of Olat and Oads contributions in SnO2 nanofibers are 82.6% and 17.4%, respectively (shown in Figure 9b). The relative intensities of Olat and Oads contributions in In2O3 nanofibers are 72.7% and 27.3%, respectively (shown in Figure 9c). The proportion of adsorbed oxygen in In2O3/SnO2 composite hetero-nanofibers is higher than that in pure SnO2 nanofibers or pure In2O3 nanofibers. It may improve adsorption capacity of In2O3/SnO2 composite hetero-nanofibers, and then, increase the response sensitivity of gas sensors [37,38,39].
3.2. Gas Sensing Properties
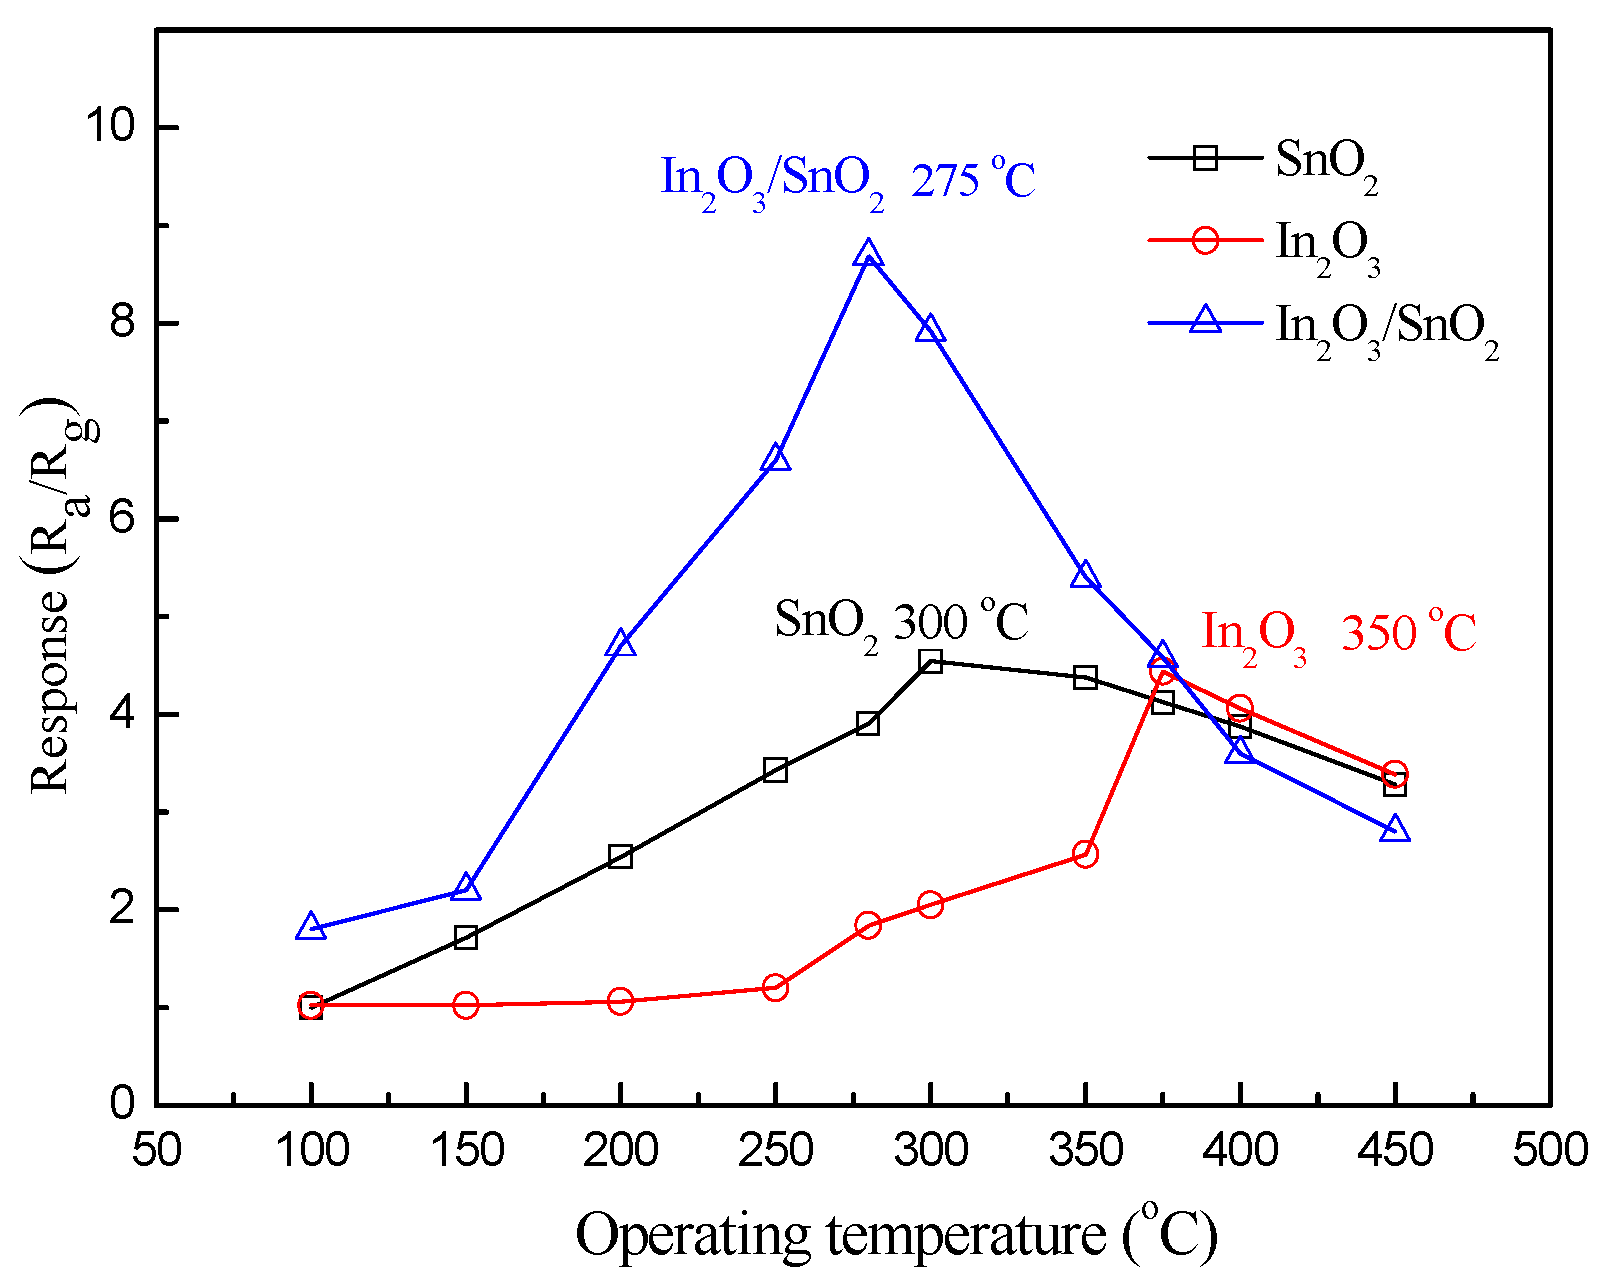
Figure 10 gives the response curves of the gas sensors based on SnO2, In2O3 and In2O3/SnO2 composite hetero-nanofibers versus operating temperatures to 10 ppm formaldehyde, respectively. It can be seen that the response of In2O3/SnO2 sensor increases as the operating temperature increases from 100 °C to 275 °C. The response of the gas sensor decreases when the operating temperature increases from 275 °C to 450 °C. The response reaches the maximum value (8.7) in 10 ppm formaldehyde at the operating temperature of 275 °C. Therefore, 275 °C is chosen as the optimum operating temperature of the In2O3/SnO2 composite hetero-nanofibers sensors. Similarly, 300 °C and 350 °C are selected as the optimum operating temperatures of the pure SnO2 and In2O3 nanofibers sensors, respectively.
The optimum operating temperature of the In2O3/SnO2 composite hetero-nanofibers sensors is lower than that of pure SnO2 or In2O3 nanofibers sensors, which may be explained as follows. Comparing with the pristine In2O3 and SnO2 nanofibers, In2O3/SnO2 composite hetero-nanofibers have a different crystallographic structure, which is decided by their own combination of crystallographic planes, nanocrystal framing and structure, which is decided by its own total combination of surface electron parameters. It includes surface state density; energetic position of the levels, induced by adsorbed species, adsorption–desorption energies of interacted gas molecules, concentration of adsorption surface states, position of surface Fermi level, activation energy of native point defects, and so on. Also, the gas sensitivity, operating temperature and rate of response and recovery time are magnitude by combination of surface electron parameters according to the chemisorption theory of Volkenshtein [40,41,42,43], another reason maybe arises by transport characteristics of In2O3/SnO2 hetero-nanostructures. The electron transport characteristics of In2O3/SnO2 composite hetero-nanofibers will be significantly strongly tuned by the heterojunction barrier comparing the pristine In2O3 or SnO2 due to the formation of many semiconductor heterojunctions at interfaces. The conductivity of the heterojunctions will consequently be greatly increased. Therefore, the barrier with adjustable height controls the transport of electrons in the heterostructures, and accordingly controls the sensing characteristics of the nanocomposites, including the lower operating temperature [22].
Figure 11a–c shows the gas sensing properties of the In2O3/SnO2 composite hetero-nanofibers sensor to indoor volatile organic gases (including formaldehyde, methanol, acetone, toluene, ammonia and ethanol) in the concentration range of 0.5–50 ppm at an operating temperature of 275 °C with relative humidity of 40% RH. Figure 11a shows the relationship of the response of In2O3/SnO2 sensor versus the concentration of formaldehyde, methanol, acetone, toluene, ammonia, ethanol vapor. The In2O3/SnO2 sensor shows the highest response to the formaldehyde vapor in the whole concentration range. The response to ethanol is lower than that to formaldehyde, and the response to ammonia is the lowest.
Figure 11b gives the transient response curves of the In2O3/SnO2 sensor to formaldehyde in the concentration of 0.5–50 ppm. In the experiment, ten cycles were recorded. The In2O3/SnO2 sensor shows excellent sensitivities to formaldehyde vapor. The inset shows the response and recovery time for 10 ppm formaldehyde vapor at an operating temperature of 275 °C with the relative humidity of 40% RH. It can be seen that the response and recovery time are 37 s and 42 s to 10 ppm formaldehyde vapor, respectively.
In order to compare the gas sensing properties of In2O3/SnO2 composite hetero-nanofibers sensors with that of the SnO2 or In2O3 sensors, Figure 11c shows the response of SnO2, In2O3 and In2O3/SnO2 sensors versus the concentration of formaldehyde vapor at the operating temperature of 275 °C, respectively. The response curves of SnO2, In2O3 and In2O3/SnO2 sensors to formaldehyde vapor are basically linear when the formaldehyde vapor concentration is in the range of 0.5–50 ppm, respectively. The response of the In2O3/SnO2 composite hetero-nanofibers sensor to formaldehyde vapor is much higher than that of the SnO2 or In2O3 sensors. The response of the In2O3/SnO2 sensor to 50 ppm formaldehyde vapor is 24.4. The lowest concentration of formaldehyde detected by the In2O3/SnO2 sensor is 0.5 ppm with a response of 2.5.
3.3. The Gas Sensing Mechanism of the In2O3/SnO2 Composite Hetero-Nanofibers Sensor
The experiment results demonstrate that the In2O3/SnO2 sensors show the excellent formaldehyde sensing properties compared to those of SnO2 or In2O3 sensors, which means that the adsorption capability of In2O3/SnO2 composite hetero-nanofibers sensor to formaldehyde is greatly enhanced. The reason may be explained by the mechanism of oxygen adsorption. It is well known that the reducing gas will interact with the adsorbed oxygen on the surface of the semiconductor, which will lead to the change of sensor resistance. The more surface-adsorbed oxygen exists on the gas sensing material, the greater the sensor’s resistance changes when meeting the reducing volatile organic gases. Figure 12 illustrates the energy-band diagram of the In2O3/SnO2 composite hetero-nanofibers system. As seen in Figure 12a–c, the pre-adsorbed oxygen could give rise to a depletion layer near to the surface of n-type semiconducting oxides [44], which results in a band bending around the surface. It is well known that SnO2 and In2O3 are the prototypical n-type transparent conducting oxide semiconductor. The band gap and the work function of SnO2 are 3.59 eV and 4.9 eV, respectively [45], while the band gap and the work function of In2O3 are 2.8 eV and 5.28 eV, respectively. SnO2 has higher electron affinity (4.5 eV) than In2O3 (4.45 eV). Both the bottom of the conduction band and the top of the valence band of In2O3 are higher than those of SnO2 (Figure 12d,e), since the SnO2 has a lower work function and a strong electron affinity [46]. The transport of electrons should transport form In2O3 to SnO2 to overcome the heterojunction barriers [22,47]. When the In2O3/SnO2 heterostructures are exposed to reducing gases, the reaction between the adsorbed oxygen species and the reducing gases leads to the release of the trapped electrons back simultaneously into the conduction bands of the In2O3 and SnO2, resulting in a decrease in the width and height of the barrier potential at their interfaces, as shown in Figure 12e. Therefore, the conductivity of the heterojunction will consequently be greatly increased, the barrier with adjustable height controls the transport of electrons in the heterostructures, which will improve the gas sensing properties of In2O3/SnO2 composite hetero-nanofibers sensor [12,13,46,47].
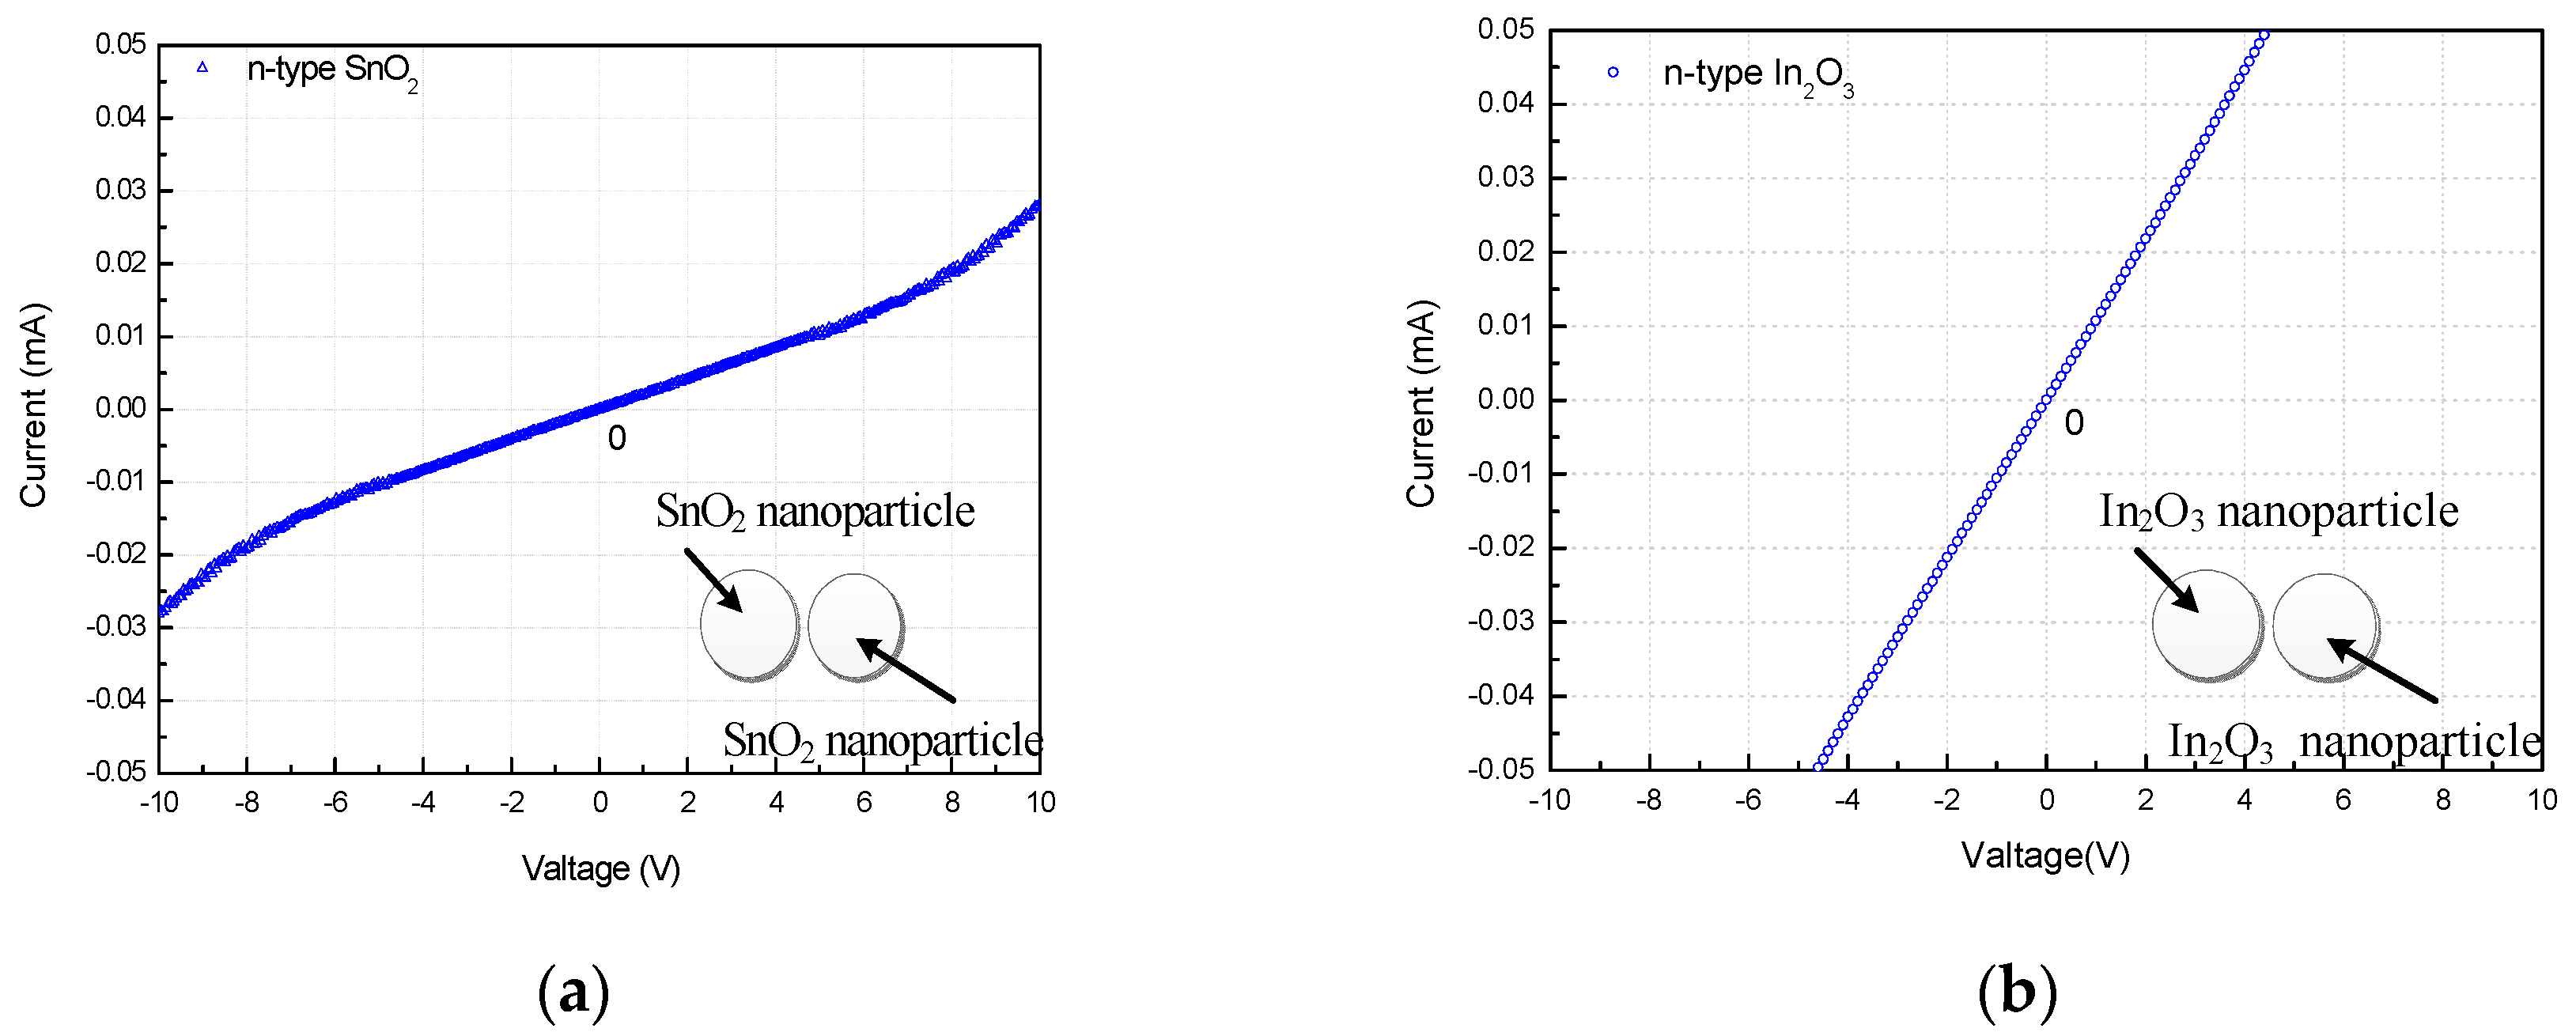
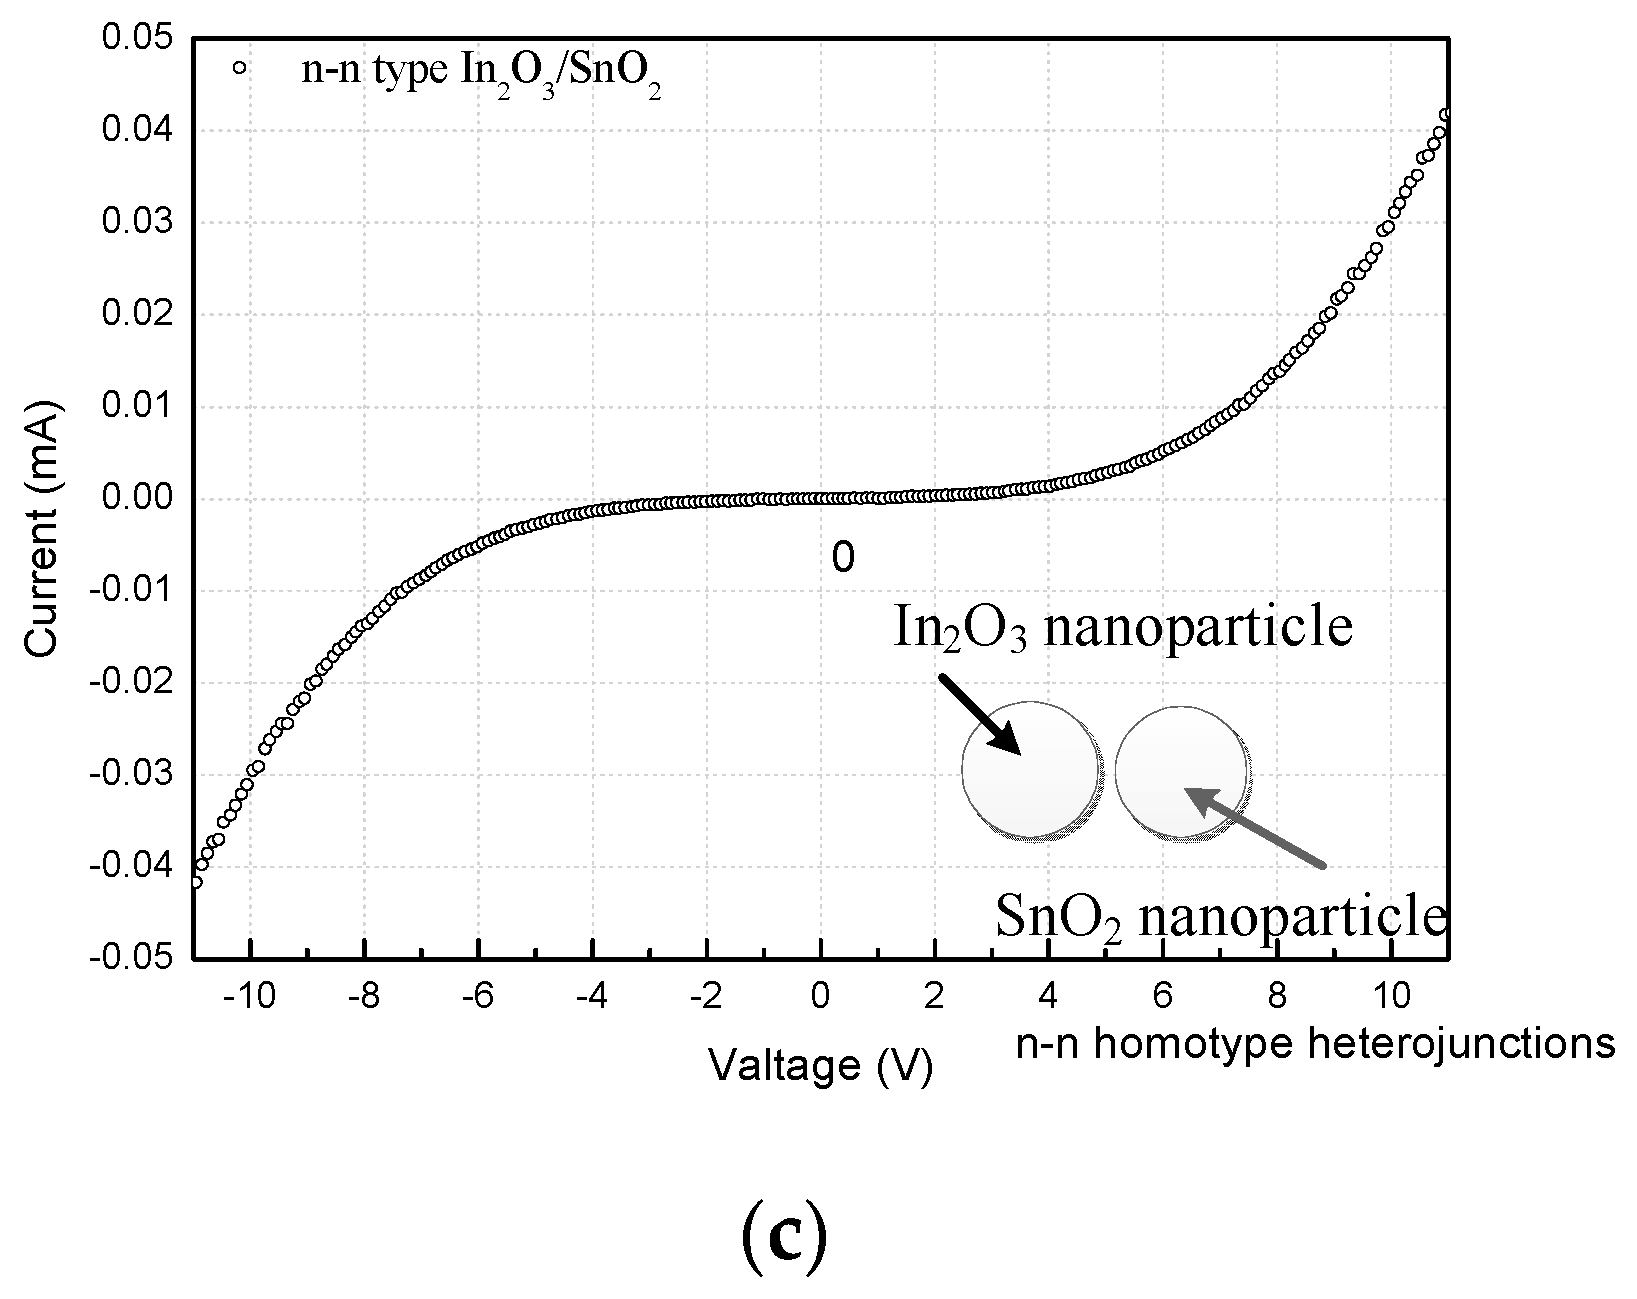
In order to confirm that n-n homotype heterojunctions exist in In2O3/SnO2 composite hetero-nanofibers, electrochemical characteristics of SnO2, In2O3 and In2O3/SnO2 sensors were measured at the operating temperature of 275 °C. Figure 13 reports the double-isotype I-V characteristics of the SnO2, In2O3 and In2O3/SnO2 sensors, respectively. We can see that I-V curves of SnO2, In2O3 nanofibers are almost linear, which indicates that there is a good ohmic contact existing inside of the n-type SnO2 and In2O3 sensors, respectively. Meanwhile, the I-V curve of In2O3/SnO2 sensor is nonlinear when the applied voltage drops in the reversely biased heterojunction, which is asymmetric for positive and negative voltages. The slightly rectifying behavior has to be ascribed to the different shape and crystalline state of the In2O3/SnO2 of the n-n homotype heterojunctions [35,48,49]. Electrochemical characteristics of In2O3/SnO2 sensors indicate the presence of n-n heterojunctions of two-type semiconducting oxides in In2O3/SnO2 composite hetero-nanofibers [48,50,51,52]. The sensing mechanism of homotype hetero-nanofibers sensing material needs further investigation.
4. Conclusions
In2O3/SnO2 composite hetero-nanofibers were synthesized by a traditional electrospinning. The SnO2 nanofibers and In2O3 nanofibers exist simultaneously in the In2O3/SnO2 composite hetero-nanofibers. Each nanofiber is composed of small uniform nanocrystallites. The morphology and structure of all the nanofibers and SnO2 and In2O3 nanoparticles in same nanofibers are similar. Gas sensors were fabricated based on SnO2 nanofibers, In2O3 nanofibers, and In2O3/SnO2 composite hetero-nanofibers, respectively. The gas sensing properties of In2O3/SnO2 sensor were tested to six kinds of indoor volatile organic gases with gas concentration range of 0.5–50 ppm at the operating temperature of 275 °C. The gas sensor based on In2O3/SnO2 composite hetero-nanofibers exhibits the higher response to formaldehyde. The responses are 24.4 and 2.5 for formaldehyde concentrations of 50 ppm and 0.5 ppm, respectively. The response of In2O3/SnO2 composite hetero-nanofibers sensor was higher than that of SnO2 nanofibers or In2O3 nanofibers sensors, respectively. The gas sensing mechanism of the In2O3/SnO2 composite hetero-nanofibers sensor is analyzed. An n-n homotype heterojunction of In2O3/SnO2 may exist in the composite material, and the nanocrystallite boundary barrier of the homotype heterojunction may decrease when the composite materials meet formaldehyde, which leads to more electrons transfer and the increase of surface adsorption oxygen. As a result, the properties of In2O3/SnO2 composite hetero-nanofibers sensor are improved greatly.
Acknowledgments
This subject was supported by the National Natural Science Foundation of China under Grant Numbers 61501081, 61574025 and 61474012, the Natural Science Foundation of Liaoning Province China under Grant Number 2015020096, and the Fundamental Research Funds for the Central Universities under Grant Number DC201502010302.
Author Contributions
PengJun Yao, Yanhui Sun and Jing Wang conceived and designed the experiments, Yanhui Sun analyzed the gas sensing mechanism, Huisheng Wang took part in performing the experiments and NaiSen Yu took part in the character and analysis.
Conflicts of Interest
The authors declare no conflict of interest.
References
- Khan, M.M.; Adil, S.F.; Al-Mayouf, A. Metal oxides as photocatalysts. J. Saudi Chem. Soc. 2015, 19, 462–464. [Google Scholar] [CrossRef]
- Phanichphant, S. Semiconductor Metal Oxides as Hydrogen Gas Sensors. Proced. Eng. 2014, 87, 795–802. [Google Scholar] [CrossRef]
- Jahnel, M.; Thomschke, M.; Fehse, K.; Vogel, U.; An, J.D.; Park, H.; Leo, K.; Im, C. Integration of near infrared and visible organic photodiodes on a complementary metal–oxide–semiconductor compatible backplane. Thin Solid Films 2015, 592 Pt A, 94–98. [Google Scholar] [CrossRef]
- Adhikari, S.; Sarkar, D. Metal oxide semiconductors for dye degradation. Mater. Res. Bull. 2015, 72, 220–228. [Google Scholar] [CrossRef]
- Wang, C.; Yin, L.; Zhang, L.; Xiang, D.; Gao, R. Metal oxide gas sensors: Sensitivity and influencing factors. Sensors 2010, 10, 2088–2106. [Google Scholar] [CrossRef] [PubMed]
- Maekawa, T.; Tamaki, J.; Miura, N.; Yamazoe, N. Sensing behavior of CuO-loaded SnO2 element for H2S detection. Chem. Lett. 1991, 20, 575–578. [Google Scholar] [CrossRef]
- Göpel, W.; Schierbaum, K.D. SnO2 sensors: Current status and future prospects. Sens. Actuators B Chem. 1995, 26, 1–12. [Google Scholar] [CrossRef]
- Tang, W.; Wang, J.; Qiao, Q.; Liu, Z.; Li, X. Mechanism for acetone sensing property of Pd-loaded SnO2 nanofibers prepared by electrospinning: Fermi-level effects. J. Mater. Sci. 2015, 50, 2605–2615. [Google Scholar] [CrossRef]
- Huang, H.; Lee, Y.C.; Chow, C.L.; Tan, O.K.; Tse, M.S.; Guo, J.; White, T. Plasma treatment of SnO2 nanocolumn arrays deposited by liquid injection plasma-enhanced chemical vapor deposition for gas sensors. Sens. Actuators B Chem. 2009, 138, 201–206. [Google Scholar] [CrossRef]
- De Lacy Costello, B.; Ewen, R.J.; Ratcliffe, N.M.; Sivanand, P. Thick film organic vapour sensors based on binary mixtures of metal oxides. Sens. Actuators B Chem. 2003, 92, 159–166. [Google Scholar] [CrossRef]
- Na, C.W.; Woo, H.-S.; Kim, I.-D.; Lee, J.-H. Selective detection of NO2 and C2H5OH using a Co3O4-decorated ZnO nanowire network sensor. Chem. Commun. 2011, 47, 5148–5150. [Google Scholar] [CrossRef] [PubMed]
- Miller, D.R.; Akbar, S.A.; Morris, P.A. Nanoscale metal oxide-based heterojunctions for gas sensing: A review. Sens. Actuators B Chem. 2014, 204, 250–272. [Google Scholar] [CrossRef]
- Zeng, W.; Liu, T.; Wang, Z. Sensitivity improvement of TiO2-doped SnO2 to volatile organic compounds. Phys. E Low Dimen. Syst. Nanostruct. 2010, 43, 633–638. [Google Scholar] [CrossRef]
- Ma, L.; Fan, H.; Tian, H.; Fang, J.; Qian, X. The n-ZnO/n-In2O3 heterojunction formed by a surface-modification and their potential barrier-control in methanal gas sensing. Sens. Actuators B Chem. 2016, 222, 508–516. [Google Scholar] [CrossRef]
- Patil, D.; Patil, L.; Patil, P. Cr2O3-activated ZnO thick film resistors for ammonia gas sensing operable at room temperature. Sens. Actuators B Chem. 2007, 126, 368–374. [Google Scholar] [CrossRef]
- Ren, F.; Gao, L.; Yuan, Y.; Zhang, Y.; Alqrni, A.; Al-Dossary, O.M.; Xu, J. Enhanced BTEX gas-sensing performance of CuO/SnO2 composite. Sens. Actuators B Chem. 2016, 223, 914–920. [Google Scholar] [CrossRef]
- Du, H.; Wang, J.; Su, M.; Yao, P.; Zheng, Y.; Yu, N. Formaldehyde gas sensor based on SnO2/In2O3 hetero-nanofibers by a modified double jets electrospinning process. Sens. Actuators B Chem. 2012, 166, 746–752. [Google Scholar] [CrossRef]
- Tharsika, T.; Haseeb, A.; Akbar, S.A.; Sabri, M.F.M.; Hoong, W.Y. Enhanced ethanol gas sensing properties of SnO2-core/ZnO-shell nanostructures. Sensors 2014, 14, 14586–14600. [Google Scholar] [CrossRef] [PubMed]
- De Lacy Costello, B.; Ewen, R.; Jones, P.; Ratcliffe, N.; Wat, R. A study of the catalytic and vapour-sensing properties of zinc oxide and tin dioxide in relation to 1-butanol and dimethyldisulphide. Sens. Actuators B Chem. 1999, 61, 199–207. [Google Scholar] [CrossRef]
- Tien, L.; Norton, D.; Gila, B.; Pearton, S.; Wang, H.-T.; Kang, B.; Ren, F. Detection of hydrogen with SnO2-coated ZnO nanorods. Appl. Surf. Sci. 2007, 253, 4748–4752. [Google Scholar] [CrossRef]
- Carney, C.M.; Yoo, S.; Akbar, S.A. TiO2–SnO2 nanostructures and their H2 sensing behavior. Sens. Actuators B Chem. 2005, 108, 29–33. [Google Scholar] [CrossRef]
- Chen, Y.; Zhu, C.; Shi, X.; Cao, M.; Jin, H. The synthesis and selective gas sensing characteristics of SnO2/α-Fe2O3 hierarchical nanostructures. Nanotechnology 2008, 19, 205603. [Google Scholar] [CrossRef] [PubMed]
- Her, Y.-C.; Chiang, C.-K.; Jean, S.-T.; Huang, S.-L. Self-catalytic growth of hierarchical In2O3 nanostructures on SnO2 nanowires and their CO sensing properties. Cryst. Eng. Comm. 2012, 14, 1296–1300. [Google Scholar] [CrossRef]
- Du, H.; Wang, J.; Sun, Y.; Yao, P.; Li, X.; Yu, N. Investigation of gas sensing properties of SnO2/In2O3 composite hetero-nanofibers treated by oxygen plasma. Sens. Actuators B Chem. 2015, 206, 753–763. [Google Scholar] [CrossRef]
- Xu, S.; Gao, J.; Wang, L.; Kan, K.; Xie, Y.; Shen, P.; Li, L.; Shi, K. Role of the heterojunctions in In2O3-composite SnO2 nanorod sensors and their remarkable gas-sensing performance for NO x at room temperature. Nanoscale 2015, 7, 14643–14651. [Google Scholar] [CrossRef] [PubMed]
- Li, P.; Fan, H.; Cai, Y. In2O3/SnO2 heterojunction microstructures: Facile room temperature solid-state synthesis and enhanced Cl2 sensing performance. Sens. Actuators B Chem. 2013, 185, 110–116. [Google Scholar] [CrossRef]
- Zheng, W.; Lu, X.; Wang, W.; Dong, B.; Zhang, H.; Wang, Z.; Xu, X.; Wang, C. A rapidly responding sensor for methanol based on electrospun In2O3–SnO2 nanofibers. J. Am. Ceram. Soc. 2010, 93, 15–17. [Google Scholar] [CrossRef]
- Chen, A.; Huang, X.; Tong, Z.; Bai, S.; Luo, R.; Liu, C.C. Preparation, characterization and gas-sensing properties of SnO2–In2O3 nanocomposite oxides. Sens. Actuators B Chem. 2006, 115, 316–321. [Google Scholar] [CrossRef]
- Pouget, J.; Jozefowicz, M.; Epstein, A.E.A.; Tang, X.; MacDiarmid, A. X-ray structure of polyaniline. Macromolecules 1991, 24, 779–789. [Google Scholar] [CrossRef]
- Patterson, A. The Scherrer formula for X-ray particle size determination. Phys. Rev. 1939, 56, 978. [Google Scholar] [CrossRef]
- Yang, Z.; Yuan, G. BET Surface Area Analysis on Microporous Materials. Mod. Sci. Instrum. 2010, 1, 97–102. [Google Scholar]
- Mu, J.; Chen, B.; Zhang, M.; Guo, Z.; Zhang, P.; Zhang, Z.; Sun, Y.; Shao, C.; Liu, Y. Enhancement of the visible-light photocatalytic activity of In2O3–TiO2 nanofiber heteroarchitectures. ACS Appl. Mater. Interfaces 2011, 4, 424–430. [Google Scholar] [CrossRef] [PubMed]
- Yang, D.J.; Kamienchick, I.; Youn, D.Y.; Rothschild, A.; Kim, I.D. Ultrasensitive and highly selective gas sensors based on electrospun SnO2 nanofibers modified by Pd loading. Adv. Funct. Mater. 2010, 20, 4258–4264. [Google Scholar] [CrossRef]
- Wang, E.Y.; Hsu, L. Determination of Electron Affinity of In2O3 from Its Heterojunction Photovoltaic Properties. J. Electrochem. Soc. 1978, 125, 1328–1331. [Google Scholar] [CrossRef]
- Brillson, L.J.; Lu, Y. ZnO Schottky barriers and Ohmic contacts. J. Appl. Phys. 2011, 109, 8. [Google Scholar] [CrossRef]
- Xu, L.; Zheng, R.; Liu, S.; Song, J.; Chen, J.; Dong, B.; Song, H. NiO@ ZnO heterostructured nanotubes: coelectrospinning fabrication, characterization, and highly enhanced gas sensing properties. Inorg. Chem. 2012, 51, 7733–7740. [Google Scholar] [CrossRef] [PubMed]
- Chenari, H.M.; Weinhardt, L.; Lastra, N.R.; Ernst, M.; Reinert, F.; Golzan, M.; Hassanzadeh, A. Structural properties and x-ray photoelectron spectroscopic study of SnO 2 nanoparticles. Mater. Lett. 2012, 85, 168–170. [Google Scholar] [CrossRef]
- Nagasawa, Y.; Choso, T.; Karasuda, T.; Shimomura, S.; Ouyang, F.; Tabata, K.; Yamaguchi, Y. Photoemission study of the interaction of a reduced thin film SnO2 with oxygen. Surf. Sci. 1999, 433, 226–229. [Google Scholar] [CrossRef]
- Wagner, C.; Biloen, P. X-ray excited Auger and photoelectron spectra of partially oxidized magnesium surfaces: The observation of abnormal chemical shifts. Surf. Sci. 1973, 35, 82–95. [Google Scholar] [CrossRef]
- Korotcenkov, G. Gas response control through structural and chemical modification of metal oxide films: state of the art and approaches. Sens. Actuators B Chem. 2005, 107, 209–232. [Google Scholar] [CrossRef]
- Brinzari, V.; Korotcenkov, G.; Golovanov, V. Factors influencing the gas sensing characteristics of tin dioxide films deposited by spray pyrolysis: understanding and possibilities of control. Thin Solid Films 2001, 391, 167–175. [Google Scholar] [CrossRef]
- Brynzari, V.; Korotchenkov, G.; Dmitriev, S. Theoretical study of semiconductor thin films gas sensors: Attempt to consistent approach. Electron Technol. 2000, 33, 225–235. [Google Scholar]
- Brynzari, V.; Korotchenkov, G.; Dmitriev, S. Simulation of thin film gas sensors kinetics. Sens. Actuators B Chem. 1999, 61, 143–153. [Google Scholar] [CrossRef]
- Lee, H.; Hwang, W. Substrate effects on the oxygen gas sensing properties of SnO2/TiO2 thin films. Appl. Surf. Sci. 2006, 253, 1889–1897. [Google Scholar] [CrossRef]
- Feneberg, M.; Lidig, C.; Lange, K.; Goldhahn, R.; Neumann, M.D.; Esser, N.; Bierwagen, O.; White, M.E.; Tsai, M.Y.; Speck, J.S. Ordinary and extraordinary dielectric functions of rutile SnO2 up to 20 eV. Appl. Phys. Lett. 2014, 104, 231106. [Google Scholar] [CrossRef]
- Xiong, C.; Balkus, K.J. Mesoporous molecular sieve derived TiO2 nanofibers doped with SnO2. J. Phys. Chem. C 2007, 111, 10359–10367. [Google Scholar] [CrossRef]
- Weis, T.; Lipperheide, R.; Wille, U.; Brehme, S. Barrier-controlled carrier transport in microcrystalline semiconducting materials: Description within a unified model. J. Appl. Phys. 2002, 92, 1411–1418. [Google Scholar] [CrossRef]
- Sze, S.M.; Ng, K.K. Physics of Semiconductor Devices, 3rd ed.; John Wiley & Sons: Hoboken, NJ, USA, October 2006. [Google Scholar]
- Vomiero, A.; Ferroni, M.; Comini, E.; Faglia, G.; Sberveglieri, G. Preparation of radial and longitudinal nanosized heterostructures of In2O3 and SnO2. Nano Lett. 2007, 7, 3553–3558. [Google Scholar] [CrossRef]
- Mandalapu, L.; Yang, Z.; Xiu, F.; Zhao, D.; Liu, J. Homojunction photodiodes based on Sb-doped p-type ZnO for ultraviolet detection. Appl. Phys. Lett. 2006, 88, 092103. [Google Scholar] [CrossRef]
- Hoffman, R.; Wager, J.; Jayaraj, M.; Tate, J. Electrical characterization of transparent p–i–n heterojunction diodes. J. Appl. Phys. 2001, 90, 5763–5767. [Google Scholar] [CrossRef]
- Muzikante, I.; Parra, V.; Dobulans, R.; Fonavs, E.; Latvels, J.; Bouvet, M. A novel gas sensor transducer based on phthalocyanine heterojunction devices. Sensors 2007, 7, 2984–2996. [Google Scholar] [CrossRef]
Figure 1.
(a) The picture of inside-heated gas sensor; (b) The structure schematic diagram of the static gas testing system.
Figure 1.
(a) The picture of inside-heated gas sensor; (b) The structure schematic diagram of the static gas testing system.
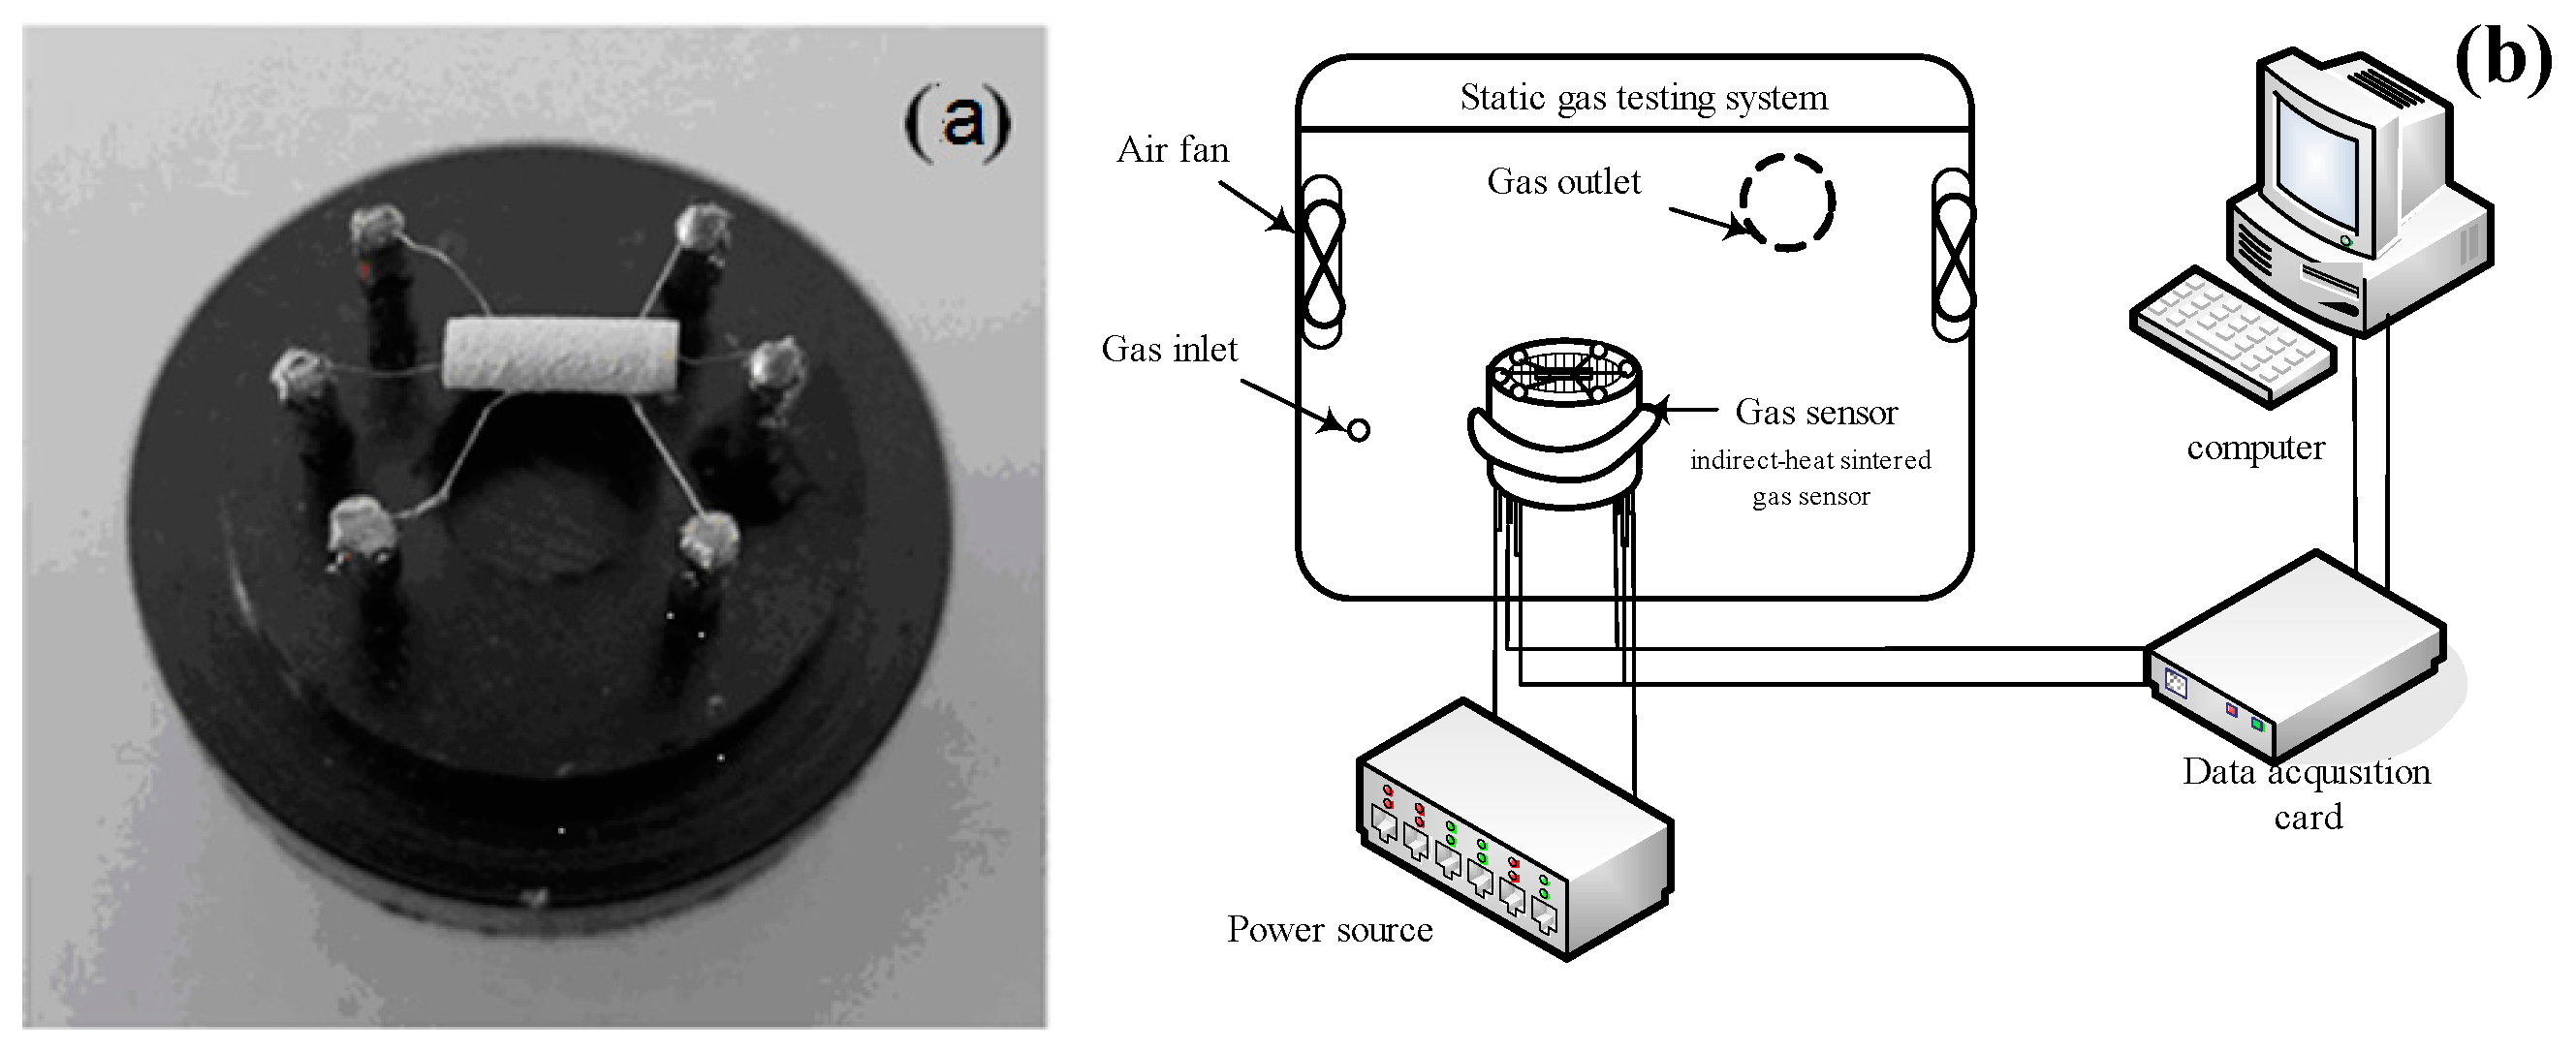
Figure 2.
XRD patterns of (a) SnO2, (b) In3O2 and (c) In2O3/SnO2 composite hetero-nanofibers.
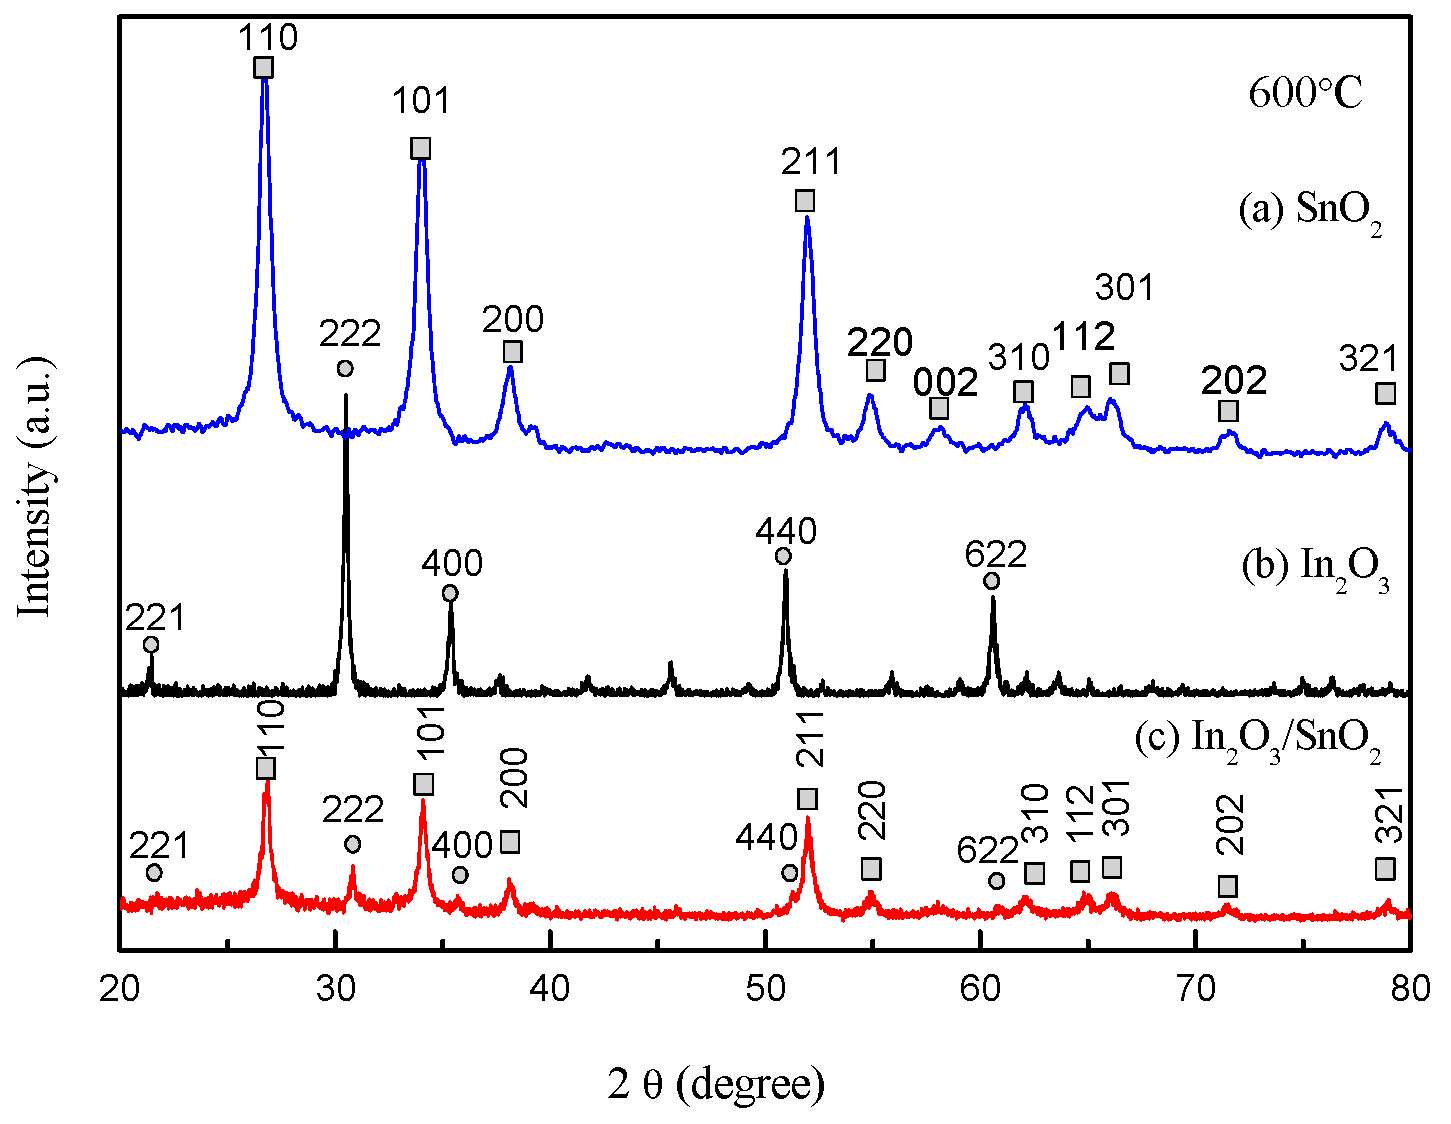
Figure 3.
SEM images of (a) SnO2 nanofibers, (b) In2O3 nanofibers, (c) In2O3/SnO2 composite hetero-nanofibers.
Figure 3.
SEM images of (a) SnO2 nanofibers, (b) In2O3 nanofibers, (c) In2O3/SnO2 composite hetero-nanofibers.

Figure 4.
EDX spectra of In3O2/SnO2 composite hetero-nanofibers.
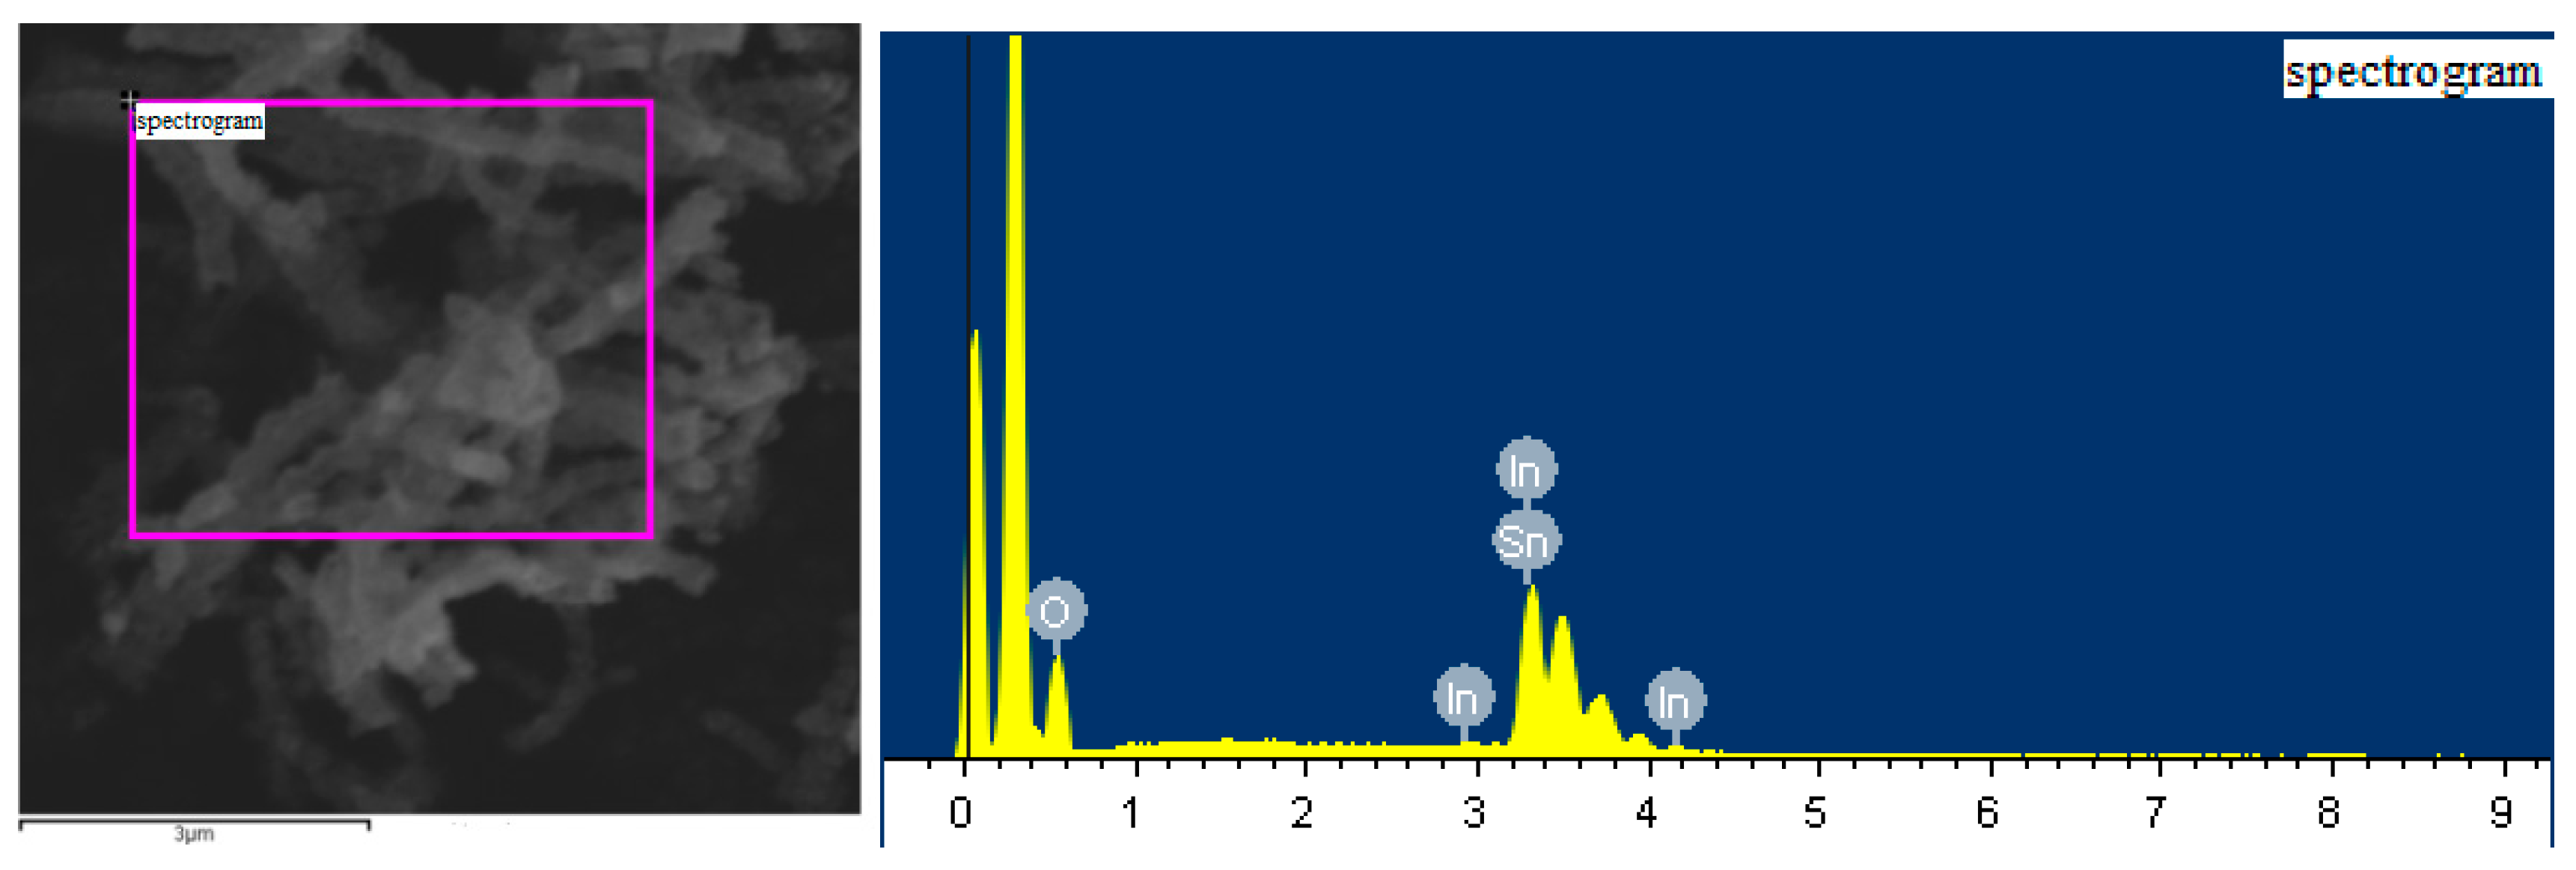
Figure 5.
N2 isotherms adsorption–desorption curves of In2O3/SnO2 composite hetero-nanofibers.
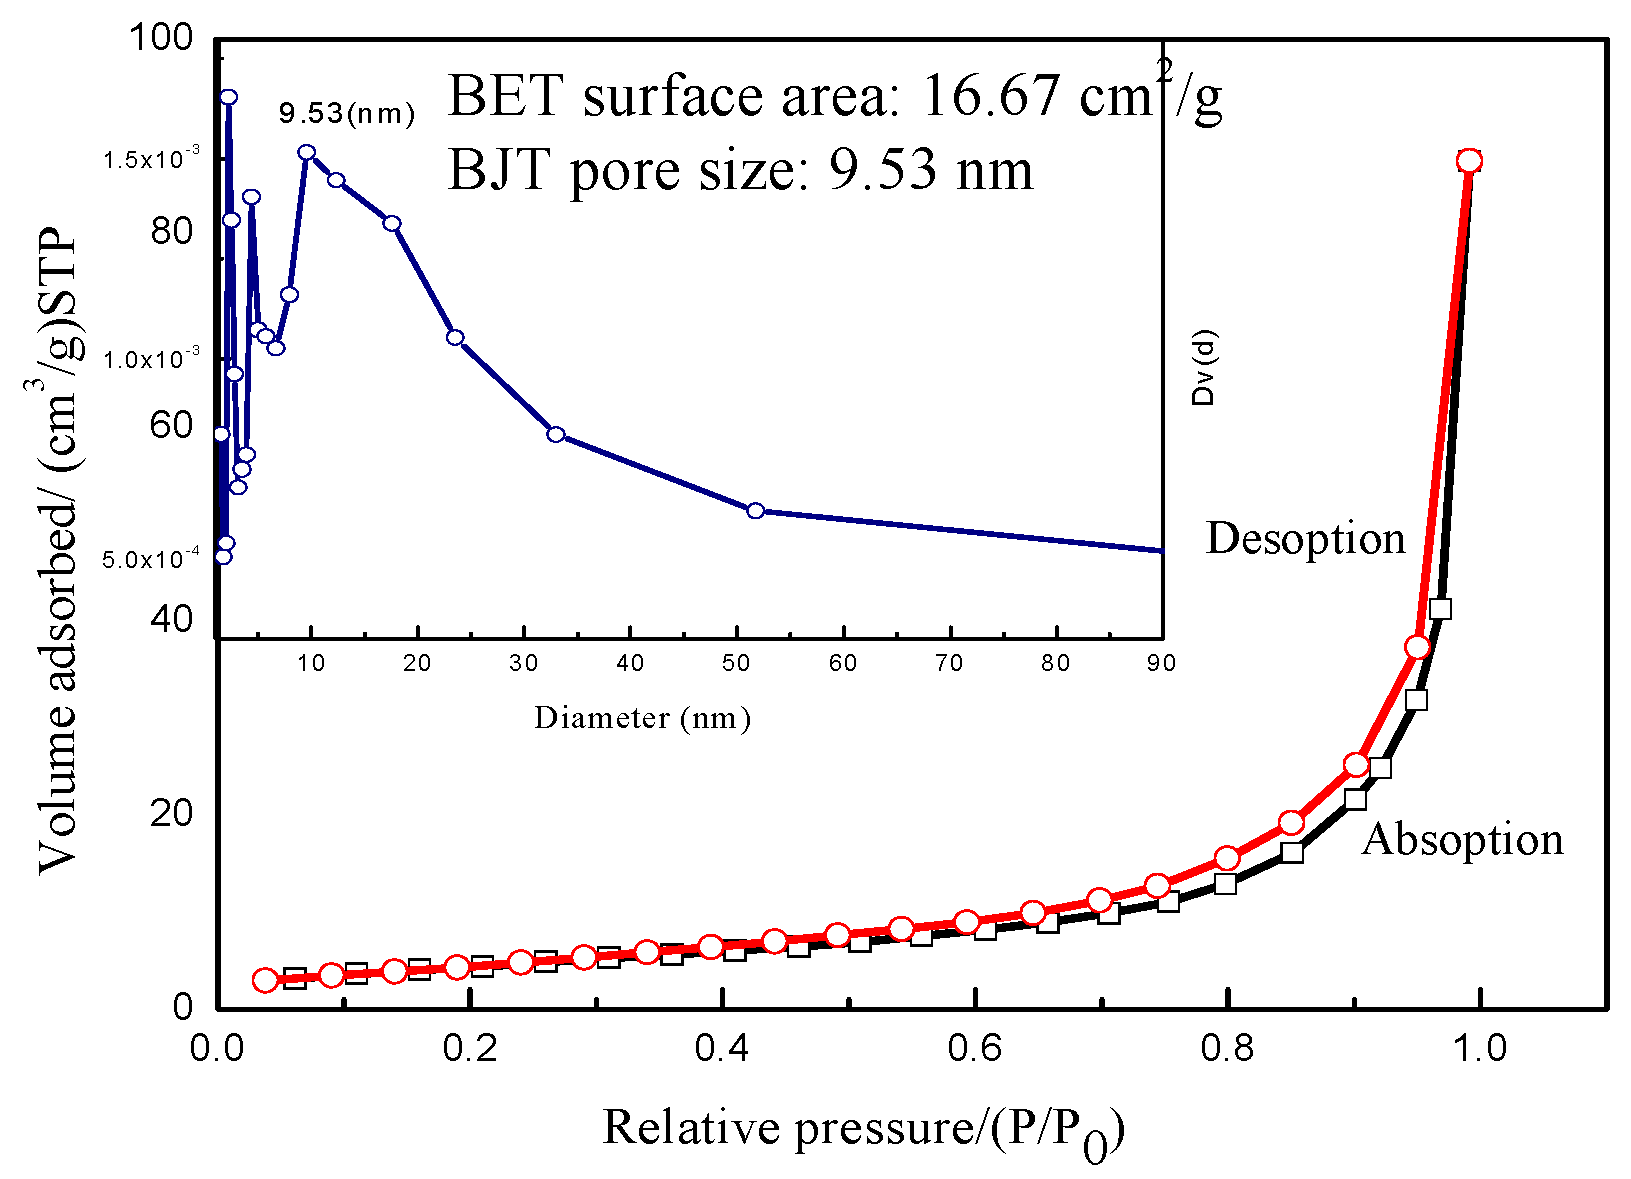
Figure 6.
XPS survey spectrum of In2O3/SnO2 nanofibers.

Figure 7.
In3d core level XPS spectrum of In2O3 nanofibers and In2O3/SnO2 composite hetero-nanofibers.
Figure 7.
In3d core level XPS spectrum of In2O3 nanofibers and In2O3/SnO2 composite hetero-nanofibers.

Figure 8.
Sn3d core level XPS spectrum of SnO2 nanofibers and In2O3/SnO2 composite hetero-nanofibers.
Figure 8.
Sn3d core level XPS spectrum of SnO2 nanofibers and In2O3/SnO2 composite hetero-nanofibers.

Figure 9.
O1s core level XPS spectrum of (a) In2O3/SnO2 composite hetero-nanofibers (b) SnO2 nanofibers and (c) In2O3 nanofibers.
Figure 9.
O1s core level XPS spectrum of (a) In2O3/SnO2 composite hetero-nanofibers (b) SnO2 nanofibers and (c) In2O3 nanofibers.
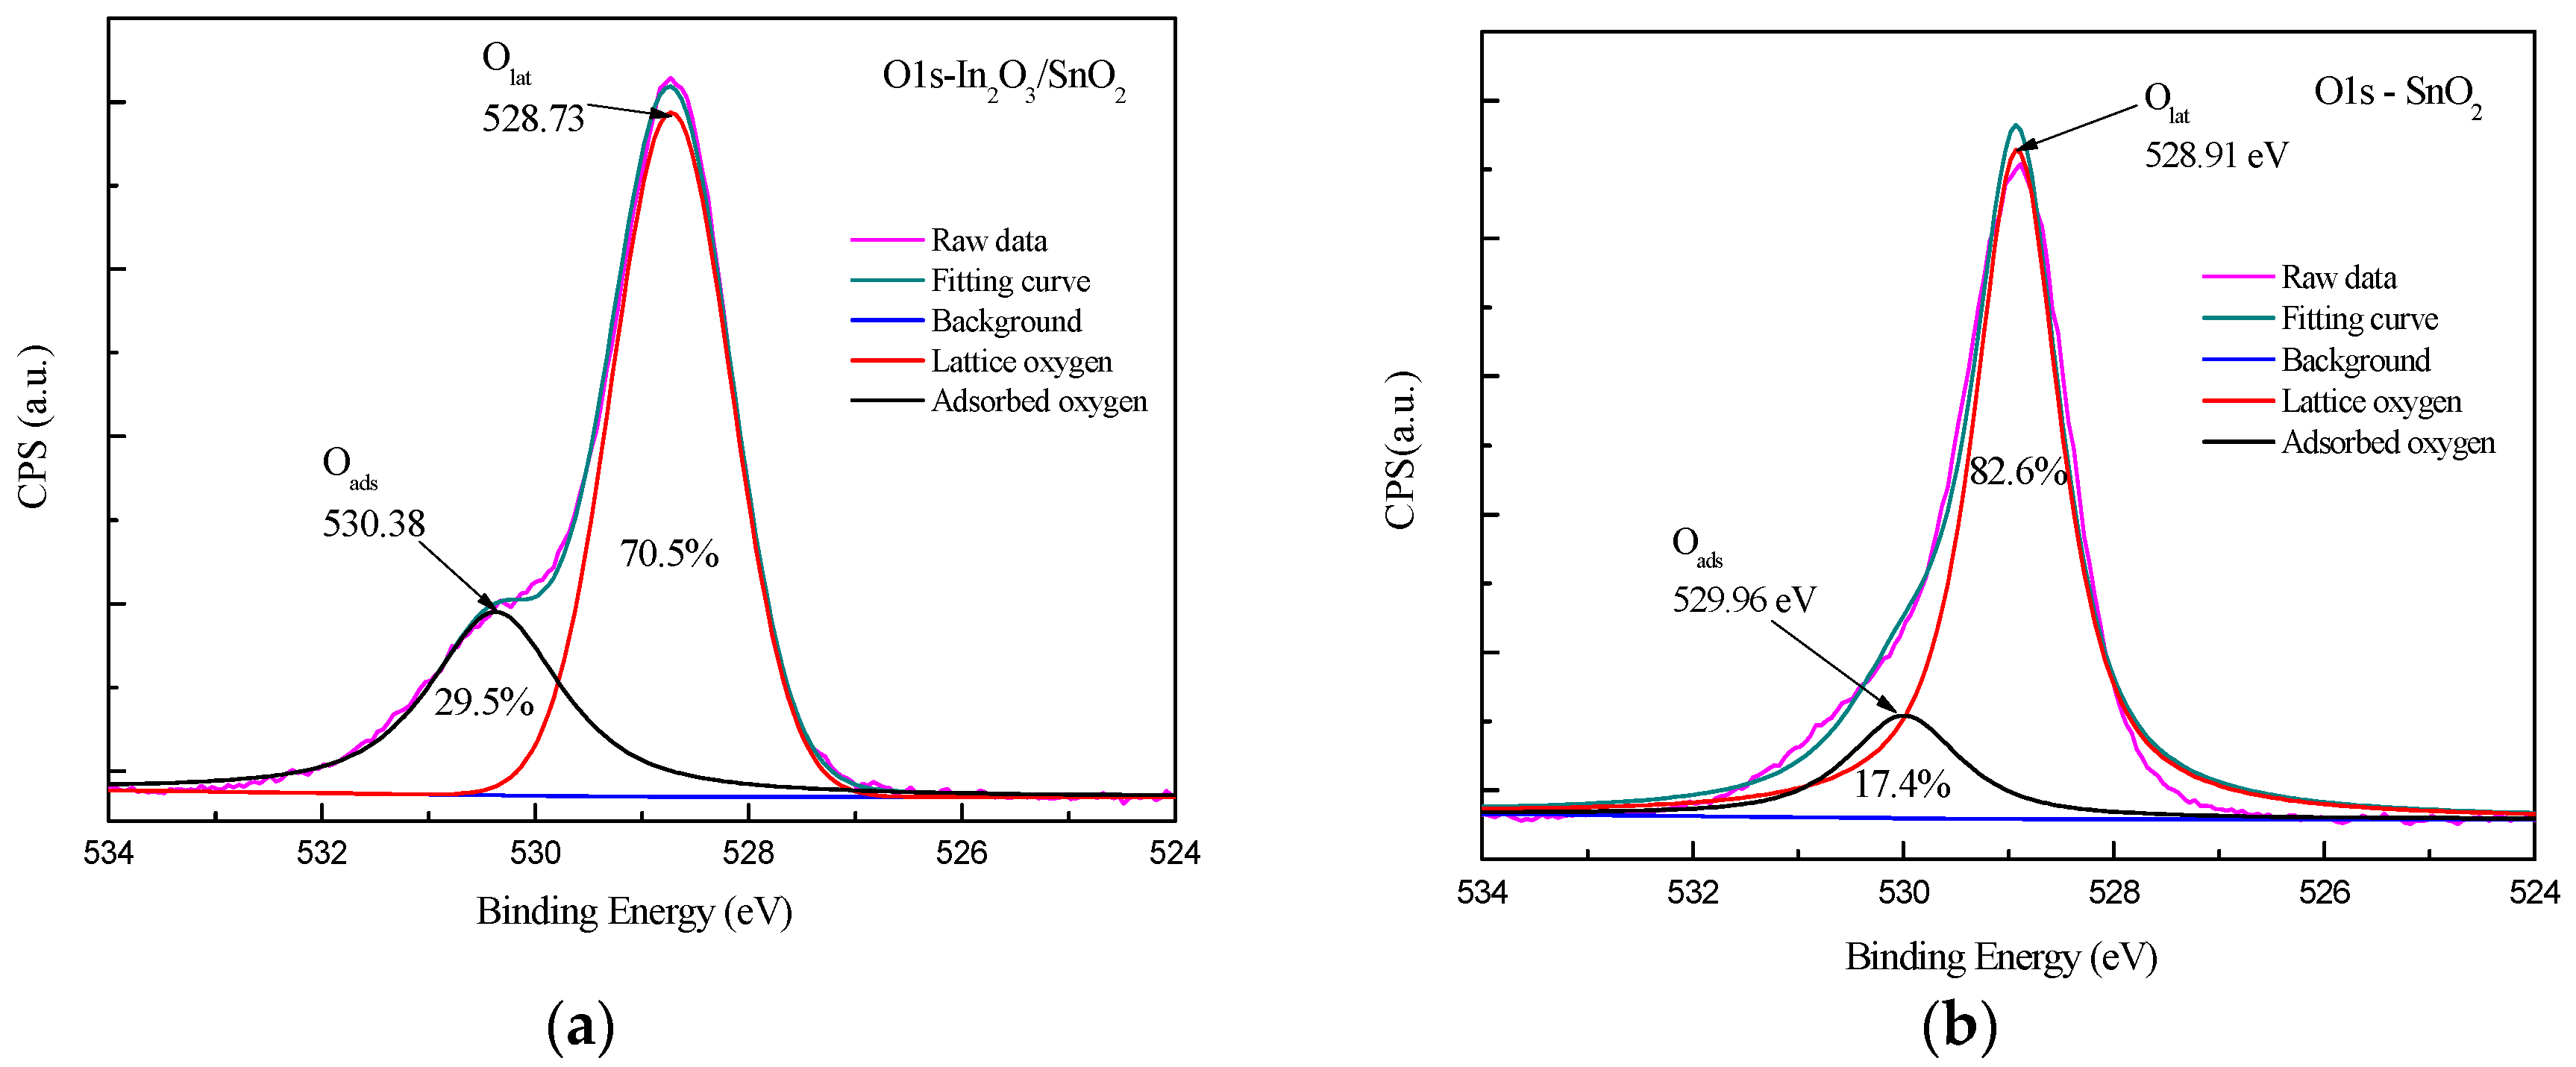

Figure 10.
Responses of the SnO2, In2O3 and In2O3/SnO2 sensors as a function of operating temperature.
Figure 10.
Responses of the SnO2, In2O3 and In2O3/SnO2 sensors as a function of operating temperature.

Figure 11.
The gas sensing properties of the In2O3/SnO2 composite hetero-nanofibers sensor. (a) The relationship of response of In2O3/SnO2 gas sensor versus concentration of formaldehyde, methanol, acetone, toluene, ammonia and ethanol vapor. (b) The transient response curves of In2O3/SnO2 sensor to formaldehyde vapor with the concentration of 0.5–50 ppm. (c) The response of SnO2, In2O3 and In2O3/SnO2 sensors versus the concentration of formaldehyde vapor.
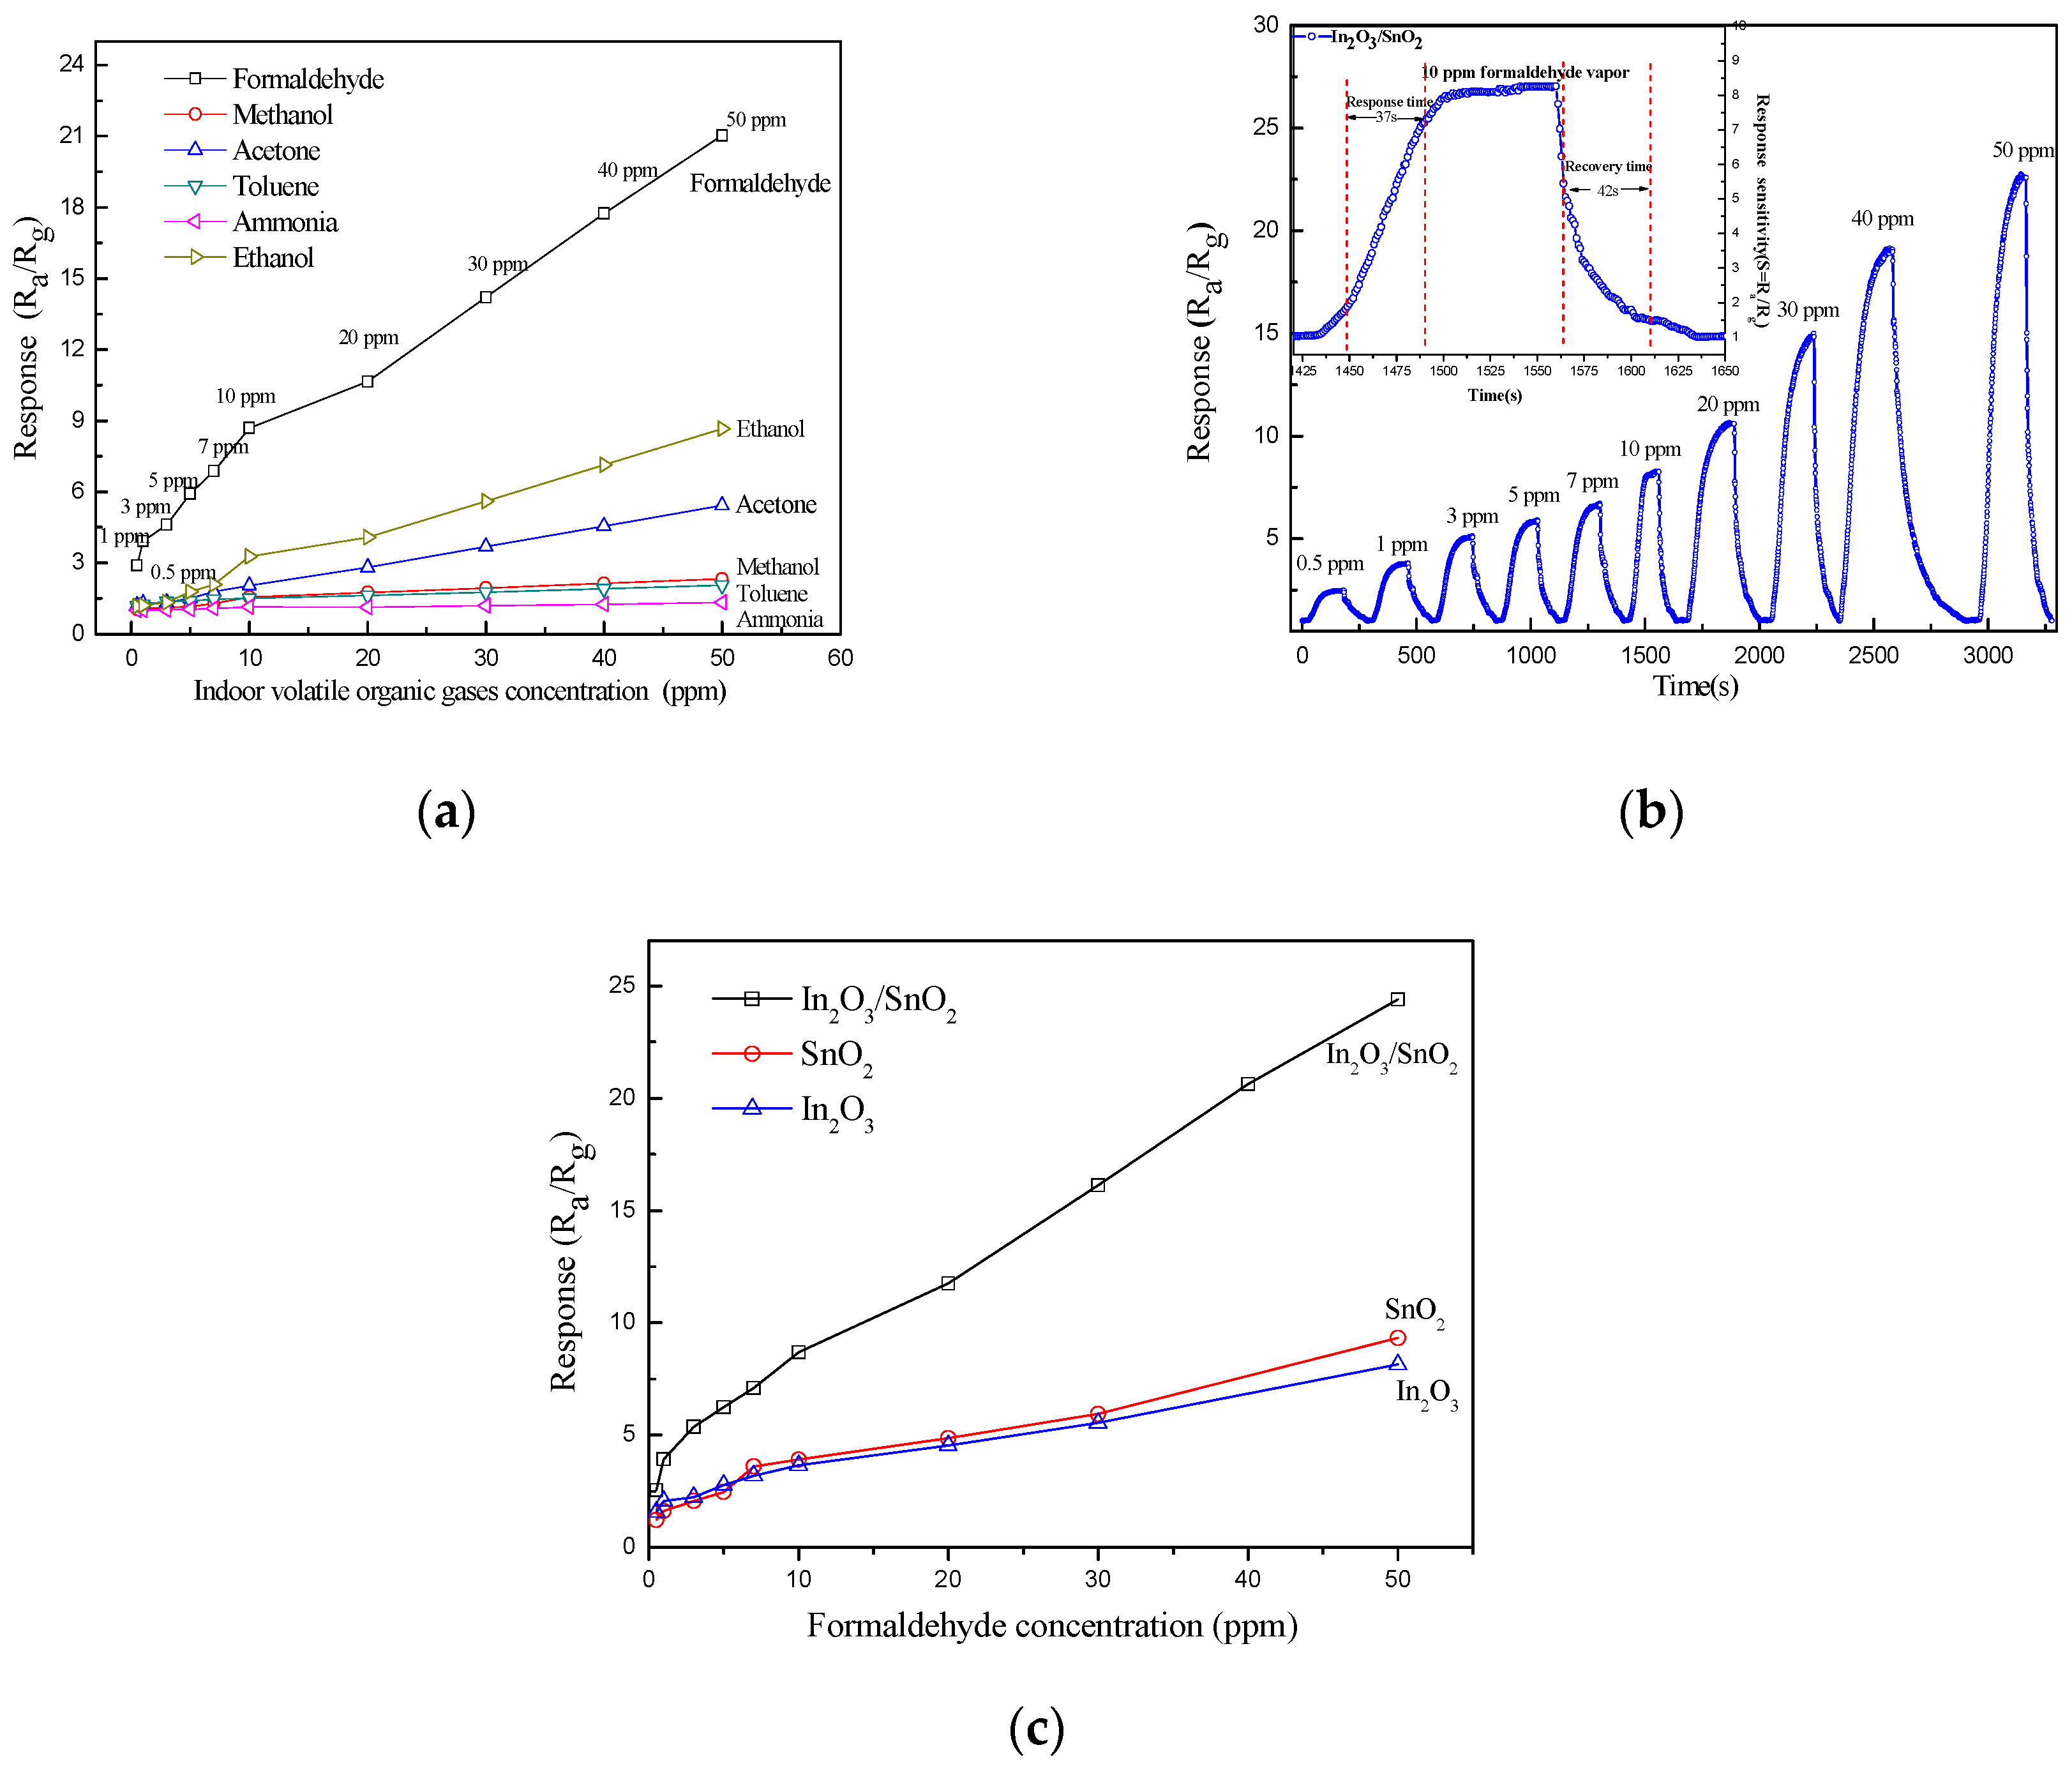
Figure 12.
Energy-band diagram of the In2O3/SnO2 composite hetero-nanofibers system. (a) Energy-band of SnO2 before oxygen adsorption. (b) Energy-band of SnO2 after oxygen adsorption. (c) Energy-band change of SnO2 in energy barrier induced by oxygen adsorption. (d) Energy band of In2O3/SnO2 composite hetero-nanofibers system before oxygen adsorption. (e) Energy band of In2O3/SnO2 composite hetero-nanofibers system after oxygen adsorption.

Figure 13.
I-V curves of (a) SnO2, (b) In2O3 and (c) In2O3/SnO2 composite hetero-nanofibers.

Table 1.
Element contents of In2O3/SnO2 composite hetero-nanofibers.
| Element | Weight % | Atomic % |
|---|---|---|
| O | 31.50 | 77.2 |
| In | 19.60 | 6.7 |
| Sn | 48.90 | 16.1 |
© 2017 by the authors. Licensee MDPI, Basel, Switzerland. This article is an open access article distributed under the terms and conditions of the Creative Commons Attribution (CC BY) license (http://creativecommons.org/licenses/by/4.0/).
Share and Cite
MDPI and ACS Style
Du, H.; Yao, P.; Sun, Y.; Wang, J.; Wang, H.; Yu, N. Electrospinning Hetero-Nanofibers In2O3/SnO2 of Homotype Heterojunction with High Gas Sensing Activity. Sensors 2017, 17, 1822. https://doi.org/10.3390/s17081822
AMA Style
Du H, Yao P, Sun Y, Wang J, Wang H, Yu N. Electrospinning Hetero-Nanofibers In2O3/SnO2 of Homotype Heterojunction with High Gas Sensing Activity. Sensors. 2017; 17(8):1822. https://doi.org/10.3390/s17081822
Chicago/Turabian StyleDu, Haiying, PengJun Yao, Yanhui Sun, Jing Wang, Huisheng Wang, and Naisen Yu. 2017. "Electrospinning Hetero-Nanofibers In2O3/SnO2 of Homotype Heterojunction with High Gas Sensing Activity" Sensors 17, no. 8: 1822. https://doi.org/10.3390/s17081822
Note that from the first issue of 2016, this journal uses article numbers instead of page numbers. See further details here.