
Analysis and Validation of Contactless Time-Gated Interrogation Technique for Quartz Resonator Sensors


1
Department of Information Engineering, University of Brescia, Via Branze 38, Brescia 25123, Italy
2
INO-CNR (National Research Council), Via Branze 45, Brescia 25123, Italy
*
Author to whom correspondence should be addressed.
Sensors 2017, 17(6), 1264; https://doi.org/10.3390/s17061264
Submission received: 7 April 2017
/
Revised: 18 May 2017
/
Accepted: 25 May 2017
/
Published: 2 June 2017
(This article belongs to the Special Issue State-of-the-Art Sensors Technologies in Italy 2016)
Abstract
:A technique for contactless electromagnetic interrogation of AT-cut quartz piezoelectric resonator sensors is proposed based on a primary coil electromagnetically air-coupled to a secondary coil connected to the electrodes of the resonator. The interrogation technique periodically switches between interleaved excitation and detection phases. During the excitation phase, the resonator is set into vibration by a driving voltage applied to the primary coil, whereas in the detection phase, the excitation signal is turned off and the transient decaying response of the resonator is sensed without contact by measuring the voltage induced back across the primary coil. This approach ensures that the readout frequency of the sensor signal is to a first order approximation independent of the interrogation distance between the primary and secondary coils. A detailed theoretical analysis of the interrogation principle based on a lumped-element equivalent circuit is presented. The analysis has been experimentally validated on a 4.432 MHz AT-cut quartz crystal resonator, demonstrating the accurate readout of the series resonant frequency and quality factor over an interrogation distance of up to 2 cm. As an application, the technique has been applied to the measurement of liquid microdroplets deposited on a 4.8 MHz AT-cut quartz crystal. More generally, the proposed technique can be exploited for the measurement of any physical or chemical quantities affecting the resonant response of quartz resonator sensors.
1. Introduction
AT-cut quartz crystal resonators (QCRs) are thickness-shear-mode (TSM) acoustic-wave resonators in which a thin quartz disk, obtained from a quartz rod sliced at an angle of 35.25° with respect to its optical axis, is sandwiched between two metal electrodes [1]. As a result of the piezoelectric nature of quartz, the application of an alternating electric field across the quartz disk produces a shear strain proportional to the electric potential. The QCR shows a set of resonant frequencies determined by the shear acoustic wave velocity and the crystal thickness.
These resonant frequencies are sensitive to a wide range of measurands, e.g., the mass deposited upon the crystal surface [2,3]. Based on this effect, quartz crystal microbalances (QCMs) are the QCRs commonly employed as mass sensors in gas phase, in vacuum, and in contact with liquids in many bio-analytic applications [4,5,6,7,8,9]. There are basically three different operation modes for QCR sensors. The first is based on an oscillator circuit in which the QCR is the element determining the frequency of oscillation. This method typically allows the measurement of the frequency variation due to different quantities, such as mass loading in QCMs, stress, or temperature, just to name a few. Oscillator circuits capable to provide output signals related to sensor frequency and energy dissipation for both the fundamental and the third harmonic have been reported [10]. The second operation mode involves impedance analysis allowing both the sensor frequency and energy dissipation data to be collected; also extending the analysis to multiple harmonics. Impedance analysis can be somewhat slow, and it can require expensive instrumentation, even if dedicated stand-alone interface circuits for the analysis of multiple-harmonic responses have been proposed [11,12,13]. The third operation mode is the Quartz Crystal Microbalance with Dissipation monitoring (QCM-D) [14] and it is based on the recording of the free decay of the QCM oscillations allowing simultaneous measurements of the sensor frequency, dissipation factor D and oscillation amplitude.
In all the above three cases, cabled links are required between the sensor unit and the readout electronic circuit or system. On the other hand, the possibility of contactless interrogation sensors can be attractive in applications where cabled solutions are not allowed, such as in closed volumes or packages. For instance, QCMs coated with suitable functionalizing polymers and operating as contactless gravimetric resonant sensors could be placed inside food packages for quality or spoilage monitoring. Alternatively, they could be adopted for the realization of smart sensing labels for sealed packages or drug conservation. Applications in liquid environments to monitor biological samples can be also viable. In contactless operation, the energy required to power the sensor unit needs to be made available on board. Battery-powered sensor units have been the most adopted solution, but they present the significant drawback of requiring periodical battery recharge or replacement. As an alternative, energy harvesting techniques can be adopted [15,16]. For applications involving hostile environments that may be incompatible with active electronics, an attractive solution is adopting passive sensors with energy supplied by an external interrogation unit. This is commonly done in the broad field of radio frequency identification (RFId) systems [17], as well as in remote sensing applications involving surface acoustic wave (SAW) sensors [18,19].
Because in the resonant measurement principle information is carried by the frequency of the readout signal, resonant sensing can be considered a robust approach in contactless operation to minimize the detrimental effect caused by the interrogation distance, which influences the readout signal amplitude. From this perspective, QCRs can be used as passive resonator sensors for the measurement of quantities affecting resonant frequency and/or quality factor. Techniques for contactless interrogation of quartz resonators have been previously studied, though they typically use special-electrode sensors or bare crystals [20,21]. Specifically, in [22] a technique based on measuring the admittance of a QCR sensor through an electromagnetic coupling between a primary coil and a secondary coil connected to the sensor was proposed. The reported analysis and results show that the variations of the readout QCR frequency depend on the mutual inductance between the coils and on their distance. This is a fundamental limitation in practical applications where keeping the distance fixed might be problematic or impossible.
The contactless electromagnetic principle proposed in this paper advantageously employs QCR crystals with ordinary electrodes. In addition, it grants a first order independence from the interrogation distance, since the mutual inductance between the coils acts only as a scaling factor on the signal amplitude.
In particular, the developed interrogation principle exploits the electromagnetic air coupling between two coils to perform a gated excitation of the resonator, followed by the sensing of the free transient response. The technique has been successfully employed with different piezoelectric sensors [23] and, with the aid of a static magnetic field, also with non-piezoelectric sensors, like silicon micro-electro-mechanical system (MEMS) resonators [24,25,26]. The technique also has a comparatively fast readout capability in the order of several readings per second, depending on the gating frequency, allowing the monitoring of rapid changes in the sensor parameters. To this purpose, dedicated post-readout techniques, based on autocorrelation analysis suitable for the implementation into embedded systems, have been developed for measuring the significant parameters of QCR sensors [27]. This contactless interrogation technique can simultaneously measure both the resonant frequency and quality factor (Q = 1/D) of the sensor, making it somewhat related to the QCM-D technique, but with the advantage of contactless operation.
This paper is dedicated to a theoretical analysis, based on the derivation of a lumped-element equivalent electromechanical circuit, and detailed investigation of the operating principle of the contactless interrogation technique. In particular, closed-form expressions for the frequency of the readout signal are presented for the first time, and the dependence on the equivalent model parameters are derived, supporting the analysis by numerical investigations. The theoretical predictions, in particular the independence of the readout signal frequency from the distance, are validated through experimental results on a developed system connected to AT-cut QCR sensors. In addition, the successful application of the proposed technique to measure the frequency shift due to microdroplets of water-sugar solution deposited on a quartz crystal resonator is reported.
2. Operating Principle
Figure 1 illustrates the operating principle and block diagram of the proposed interrogation system for QCR sensors. The interrogation principle exploits the separation in time between driven excitation and free decay detection phases, somewhat similarly to what was previously proposed for silicon micromechanical resonators [24]. In the present case, however, the principle does not require magnets.
The developed interrogation system employs a primary coil with inductance L1 electromagnetically air-coupled to a secondary coil with inductance L2, connected to the electrodes of the QCR sensor. During the excitation phase a gating signal vg sets the switch SW to the position E, connecting for a time interval TE the primary coil L1 to the sinusoidal excitation signal vexc, which results in a gated sinusoidal signal at frequency fexc. By exploiting the electromagnetic air coupling between the two coils, the excitation signal is transmitted to the QCR which is excited into vibrations. The QCR is an electro-mechanical system which vibrates in thickness-shear mode and the TSM fundamental resonant frequency of its mechanical behavior will be indicated as fr = ωr/2π. It can be noticed that, since the operating principle relies on the detection of the QCR free decaying response, ensuring that the excitation frequency fexc is exactly equal to fr is not strictly required, which is advantageous since fr might not be exactly known in advance. Nevertheless, when fexc approaches fr, the effectiveness of the excitation is increased and the amplitude of the detected signal rises.
In the detection phase, the gating signal vg sets the switch SW to the position D for a time interval TD, disconnecting the excitation from the primary coil and, thus, also from the quartz resonator. It also connects the primary coil to the readout circuit. In this condition, the QCR undergoes decaying oscillations at frequency fdr, i.e., the mechanical damped resonant frequency. The initial amplitude of the oscillations is inversely related to the difference between fexc and fr. Due to the piezoelectric properties of quartz, the mechanical vibrations of the resonator generate a current in the coil L2 and consequently an induced readout voltage v1 can be sensed back across L1.
The induced voltage v1 is further amplified by means of a high-impedance amplifier of gain G and then, by means of a zero-crossing detector, converted into an output square waveform with frequency fo = fdr, which can be measured by a frequency counter.
2.1. Theoretical Analysis and Equivalent Model
Piezoelectric electroacoustic devices, such as AT-cut quartz resonators, can be studied by adopting the Mason distributed-parameter electromechanical circuit [3,28]. Around each resonant frequency corresponding to a given vibration mode, the Mason model can be simplified into the Butterworth-van Dyke (BVD) equivalent lumped-element circuit. The BVD circuit is composed of a motional, i.e., mechanical, branch and an electrical branch formed by the parallel capacitance C0. The motional branch comprises the series of inductance Lm, capacitance Cm, and resistance Rm, which respectively represent the equivalent mass, compliance, and energy losses of the quartz crystal at the considered mode. In the following, the fundamental thickness-shear mode will be considered. With respect to the BVD circuit, the previously introduced mechanical resonant frequency fr corresponds to the series resonant frequency of the motional branch, i.e., the frequency at which the reactance of the mechanical branch impedance vanishes, which can be expressed as fr = 1/[2π(LmCm)1/2].
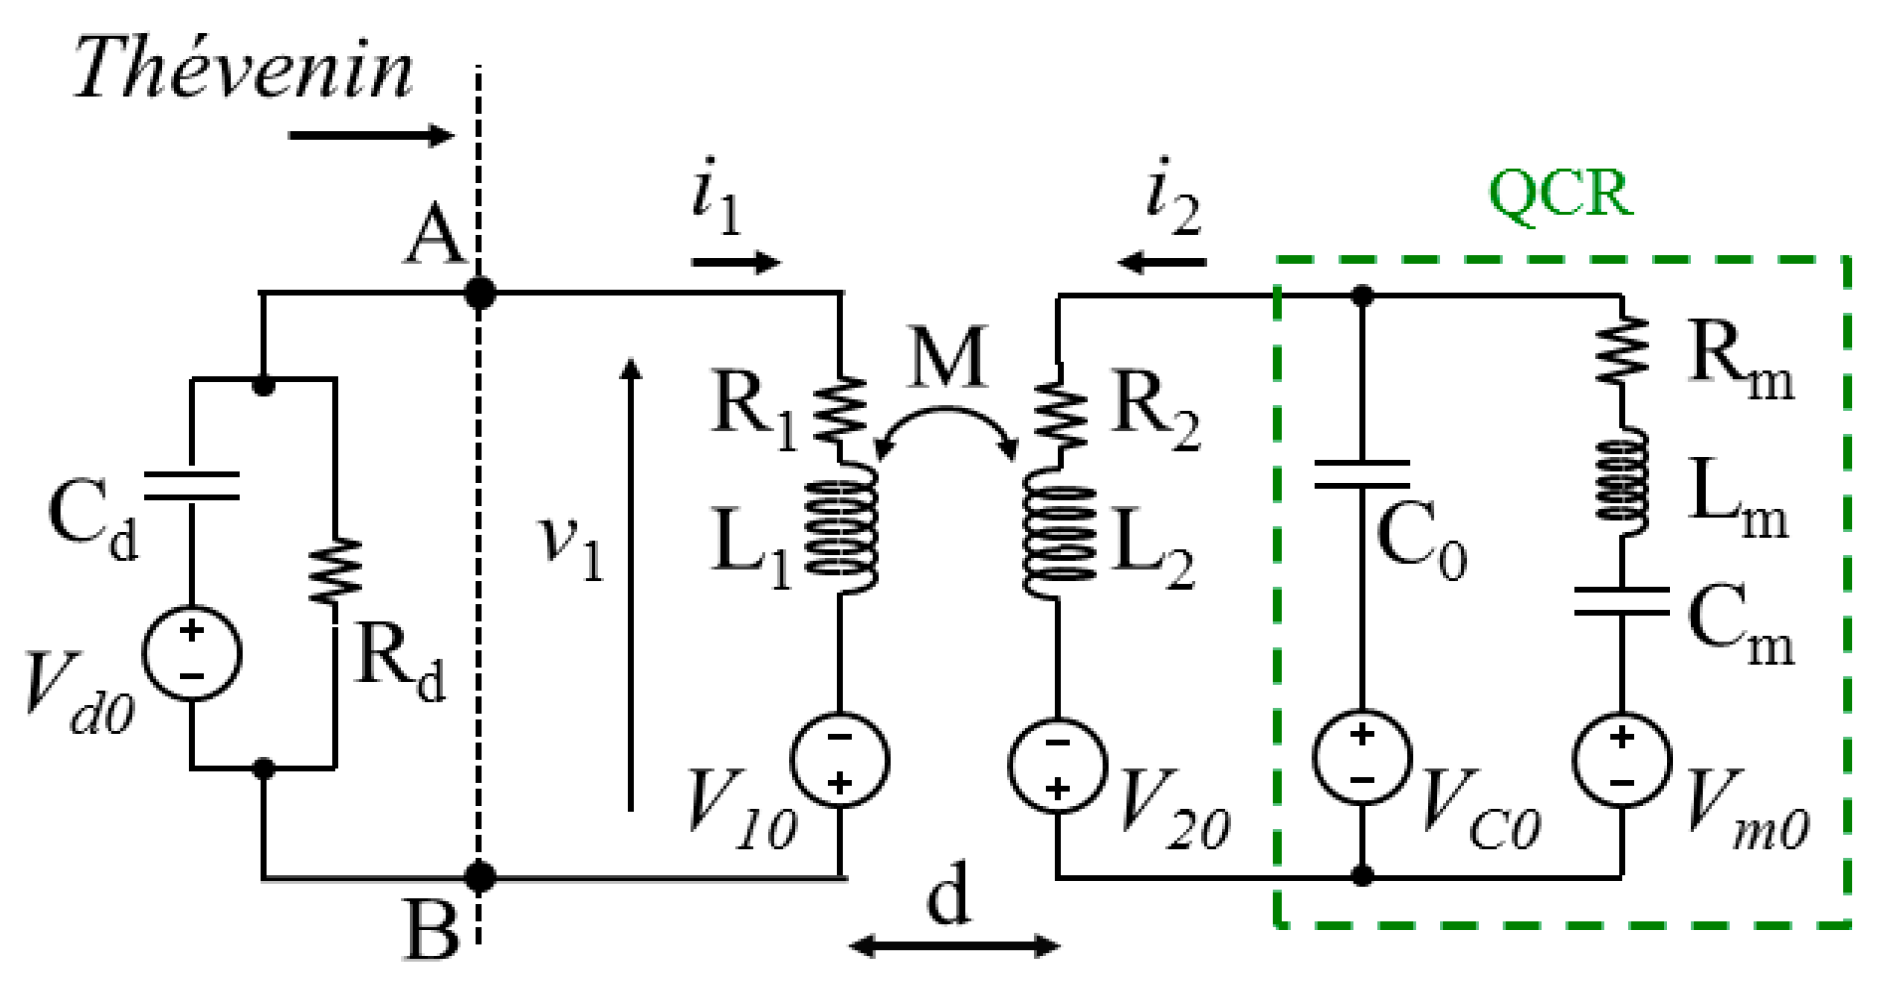
Accordingly, during the detection phase, the interrogation system can be modelled as illustrated in Figure 2. The two coils separated by a distance d are modelled by means of their mutual inductance M function of d, their equivalent series resistances R1, R2, and inductances L1, L2, i.e., the impedances of the primary and secondary coils are Z1 = R1 + sL1 and Z2 = R2 + sL2, respectively, where s is the complex frequency in the Laplace domain. The impedance Zd = Rd/(1 + sRdCd) represents the generic equivalent input impedance of the electronic detection circuit.
The voltage sources Vd0 = qCd(sCd)−1, V10 = L1iL1, V20 = L2iL2, VC0 = qC0(sC0)−1 and Vm0 = qCm(sCm)−1 − LmiLm represent the initial conditions of the electric capacitance Cd of the detection circuit input stage, of the primary and secondary coils L1 and L2, of the QCR electric capacitance C0 and of the QCR motional branch, respectively. The terms qCd, qC0, and qCm are the initial charges on the capacitances Cd, C0, and Cm, respectively, and the terms iL1, iL2, and iLm are the initial currents in the inductances L1, L2, and Lm, respectively, all of them taken at time n(TD + TE) + TE, where n is an integer, i.e., at the beginning of the detection phase.
In order to derive an expression for the voltage V1 induced between nodes A and B in Figure 2, the Thévenin equivalent voltage source VTh and impedance ZTh of the right-hand part of the circuit can be expressed as:
where Zm = Rm + sLm + (sCm)−1 is the impedance of the QCR motional branch, Z0 = (sC0)−1 is the impedance of the capacitance C0, and I2 has the following expression:
Hence the voltage V1 at the detection circuit input during the detection phase can be expressed by:
In the limiting case of |Zd| → ∞, i.e., for high input impedance of the detection circuit, the readout voltage V1 becomes equal to VTh and, hence, from Equation (1a), obtaining V1 reduces to the determination of the current I2.
Inserting the corresponding expression of each term in Equation (2) , I2 as a function of s can be put in the rational form I2(s) = N(s)/D(s) where N(s) and D(s) are given by:
From Equation (4a,b) it is possible in principle to derive a time expression for i2(t) and hence for v1(t) by making a partial fraction expansion of I2(s) and then taking the inverse Laplace transform of each term.
It must be remarked that, for the purposes of the present work, the main interest and specific goal is to determine the complex frequencies at which the electrical network composed of R2-L2-C0-Rm-Lm-Cm responds due to non-zero initial conditions on its reactive elements. On the other hand, determining the closed form expression of the time response v1(t) is unnecessary besides which it is very involved. These complex frequencies can be determined resolving D(s) = 0. The expression of D(s) is a fourth-order polynomial which can be factored in the product of two second-order polynomials as D(s) = D0(s2 + 2αms + ωm2)(s2 + 2αes + ωe2) where D0 is a normalization constant. As a consequence, it is expected that in the time domain i2(t) can be determined as the sum of two damped sinusoidal signals at the damped angular frequencies ωdm = (ωm2 − αm2)1/2 and ωde = (ωe2 − αe2)1/2 with natural angular frequencies ωm, ωe and exponential decay times τm = 1/αm, τe = 1/αe, respectively. In addition, it can be observed that if αm << ωm and αe << ωe, i.e., in the case of light damping, then ωdm ≈ ωm and ωde ≈ ωe.
Solving the equation D(s) = 0, even if possible, is in general sufficiently involved to suggest adopting an approximate approach based on defined conditions. In particular, it will be demonstrated in the following that under specific assumptions, ωdm corresponds to the damped angular frequency of the series resonant subcircuit of the mechanical branch Rm-Cm-Lm, while ωde corresponds to the damped angular frequency of the electrical resonant subcircuit composed of R2-L2-C0. In the more general case, this is not true because the two subcircuits are indeed coupled.
As a first step, the circuit of Figure 2 can be analyzed considering R2 = 0 and Rm = 0, which is equivalent to an undamped system. With this assumption, Equation (4b) reduces to:
In this circumstance Du(s) does not contain terms of odd degree and the equation Du(s) = 0 can be regarded as a quadratic equation in the variable p = s2, i.e., p2 + bp + c = 0, and directly solved. By inspection of Equation (5), it is clearly b > 0, c > 0 and also for the discriminant Δ it holds that Δ= b2 − 4c > 0. Thus, for the solutions of the quadratic equation, two real negative roots p1 and p2 are expected, and hence the corresponding values of s are: s1+,1− = ±p11/2 = ±jωmu and s2+,2− = ±p21/2 = ±jωeu. Recalling that ωr = 2πfr = (LmCm)−1/2 and defining ωe0 = (L2C0)−1/2 and δω = (LmC0)−1/2, the values of ωmu and ωeu, corresponding to the two natural angular frequencies of the circuit, can be derived as:
It can be observed that ωr and ωe0 represent the resonant angular frequencies of the series Lm-Cm mechanical subcircuit and the parallel L2-C0 electrical subcircuit, respectively. Then Equation (6a,b) show that, by interconnecting the two subcircuits, a cross coupling is introduced, and each natural frequency of the network in general depends on the resonant frequencies of both subcircuits.
Under the hypothesis that ωrL2 « 1/(ωrC0), meaning that at the frequency ωr the impedance magnitude of L2 is smaller than that of C0, the exact expressions in Equation (6a,b) can be approximated by a Taylor series arrested to the first order, leading to:
From Equation (7a,b) it can be observed that both ωmu and ωeu depend on L2 and Lm and if L2 « Lm the natural frequencies of the network tend to the resonant frequencies of the two subcircuits.
The effect of damping introduced by Rm and R2 will be taken into account by numerical analysis in the following subsection. It is expected that the damped angular frequencies ωdm and ωde will depend in the general case on all the parameters of the circuit. However, it will be shown that, for light damping and for the range of variation of the parameters considered in the present work, ωdm and ωde are well approximated by their undamped counterparts given by Equation (7a,b).
2.2. Numerical Analysis
In the following the solutions of D(s) = 0, where D(s) is the expression in Equation (4b), will be computed numerically considering the typical values reported in Section 3 for both the parameters of the QCR and the electrical parameters. For the cases under examination, the solutions will be two pairs of complex conjugated numbers which, adopting the notation previously introduced, can be expressed as se = −αe + jωde and sm = −αm + jωdm. Simulations as a function of selected parameters of the equivalent circuit have been carried out in Matlab to validate the electrical equivalent model derived in Section 2.1.
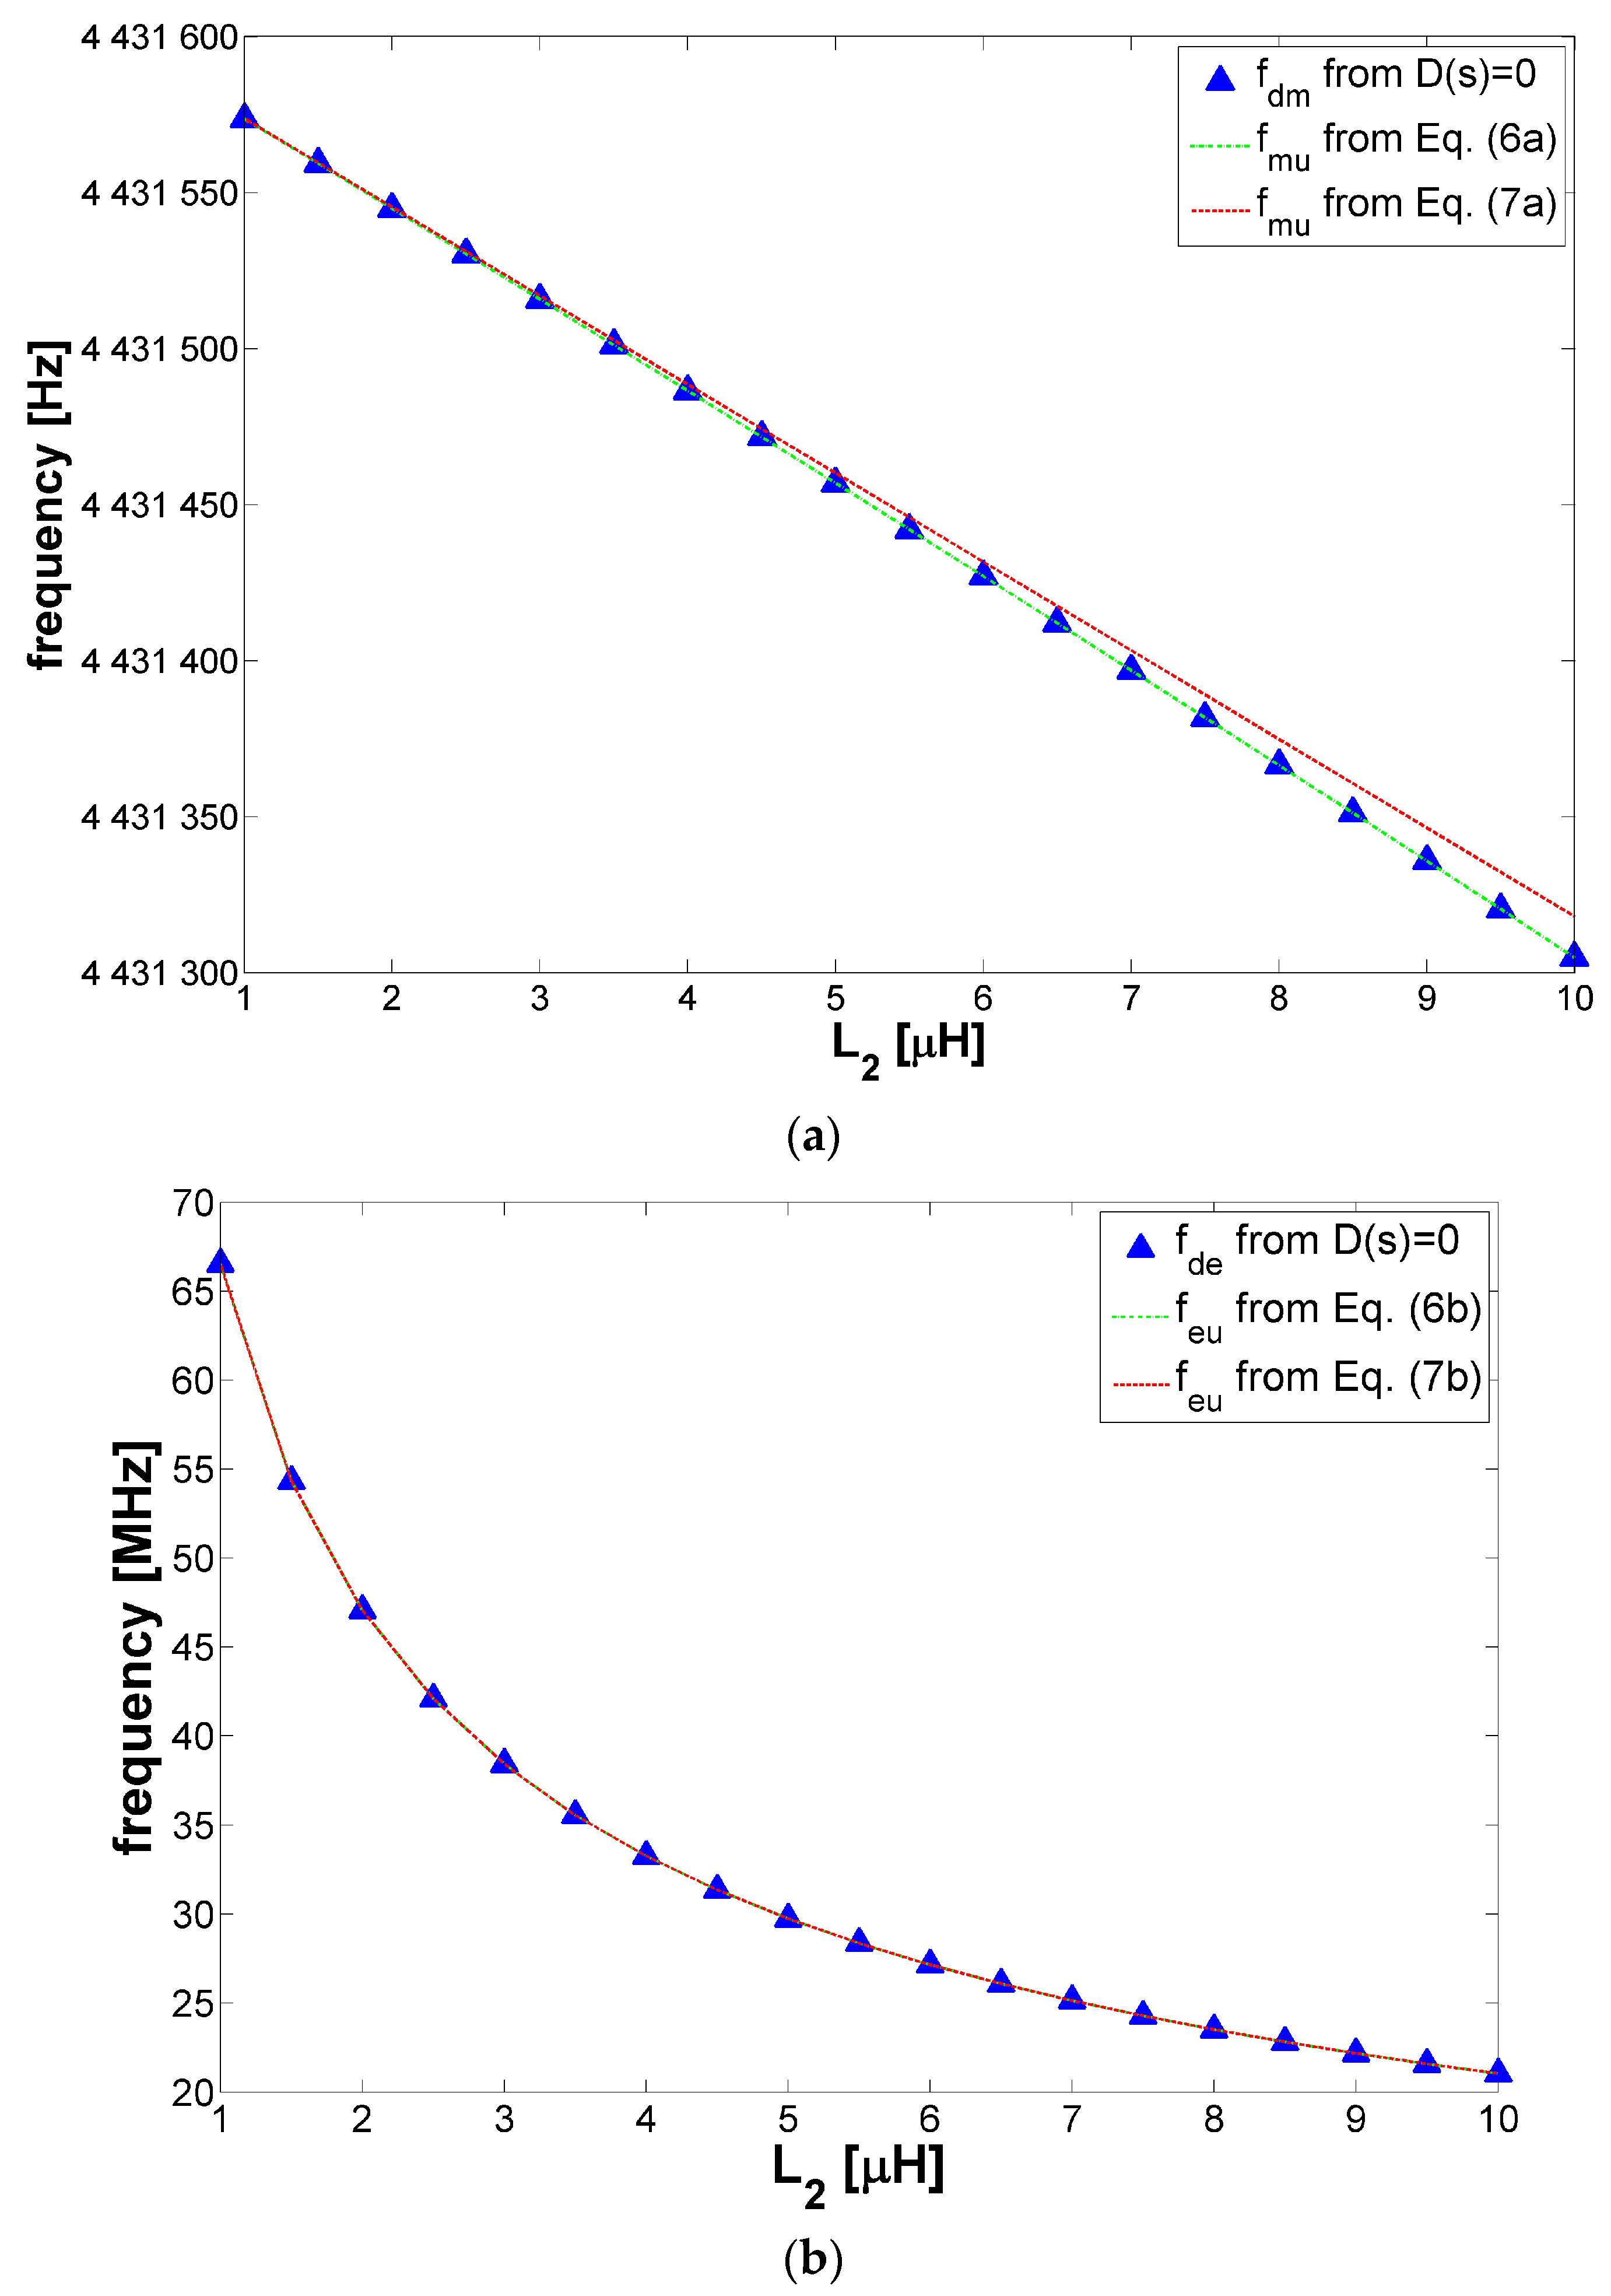
Figure 3a shows the comparison between the values of the damped mechanical frequency fdm = ωdm/2π computed from Equation (4b) and the values of fmu = ωmu/2π given by Equations (6a) and (7a). It can be observed that the numerical solution and the result of Equation (6a) are coincident while the results of Equation (7a) is within 3 ppm with respect to the numerical solution for L2 = 10 µH. It can be concluded that for the considered conditions, both the influence of the damping due to Rm and R2 and the presence of L2 do not affect the mechanical resonant frequency of the resonator and then fdm ≈ fmu ≈ fr.
Similarly, Figure 3b demonstrates that the electrical frequency fde = ωde/2π computed from Equation (4b) and the expressions of feu = ωeu/2π from Equations (6b) and (7b) are also in remarkable agreement over the same range of variation of L2. Also in this case, it can be concluded that fde ≈ feu.
Subsequently, for the same range of variation of L2, the attenuation constants αm and αe have been computed and the results are shown in Figure 4.
It can be seen that αe is four orders of magnitude larger than αm, hence the contribution to v1 due to the electrical part falls off more rapidly than its mechanical counterpart and it is expected to quickly become negligible.
2.3. Additional Remarks
As reported in Section 2.1, the waveform of the current i2(t) is the sum of two damped sinusoidal signals at frequency fdm and fde with attenuation constants αm and αe, respectively. In the numerical analysis reported in Section 2.2, it has been shown that αe » αm. Thus, the damped sinusoidal signal at frequency fde decays to zero much faster than the damped sinusoidal signal at frequency fdm, and, hence, the former can be neglected in the final expression of the waveform i2(t) which results:
In Equation (8) the amplitude and phase coefficients I20 and θ2 are functions of both the initial conditions and the electrical and mechanical parameters of the system. The mechanical response of the QCR is read through the voltage v1, which in the time domain can be derived by taking the inverse Laplace transform of Equation (3) or, equivalently, multiplying M by the time derivative of Equation (8):
where the last additional term represents the contribution of the initial conditions on L1 and θm = θ2 – π − arctan(2πfdm/αm). From Equation (9) it can be seen that v1 is proportional to the natural frequency fm and, notably, that the mutual inductance M acts only as a scaling factor for the amplitude of v1, without affecting the sensor response parameters fdm and τm. This is advantageous with respect to other contactless techniques like the one reported in [22] in which the resonant frequency of the QCR sensor is monitored by measuring the reflected admittance of the sensor through the primary and secondary coils. The significant limitation in this case is that the shape of the reflected admittance function versus frequency, and in turn the estimated QCR resonant frequency, depends on the mutual inductance between the coils and, as such, on their distance. Keeping the distance between the coils fixed is unpractical/unfeasible in most real applications. On the contrary, the gated technique here proposed which decouples excitation and detection is robust against the interrogation distance.
If the limiting case of Z2 → 0 is considered for a high quality factor resonator, i.e., the QCR is short-circuited during the detection phase and the mechanical damping is low, the voltage v1 is an exponentially lightly damped sinusoidal signal at exactly the frequency fr, i.e., the system detects the QCR oscillating at its series resonance.
3. Experimental Validation
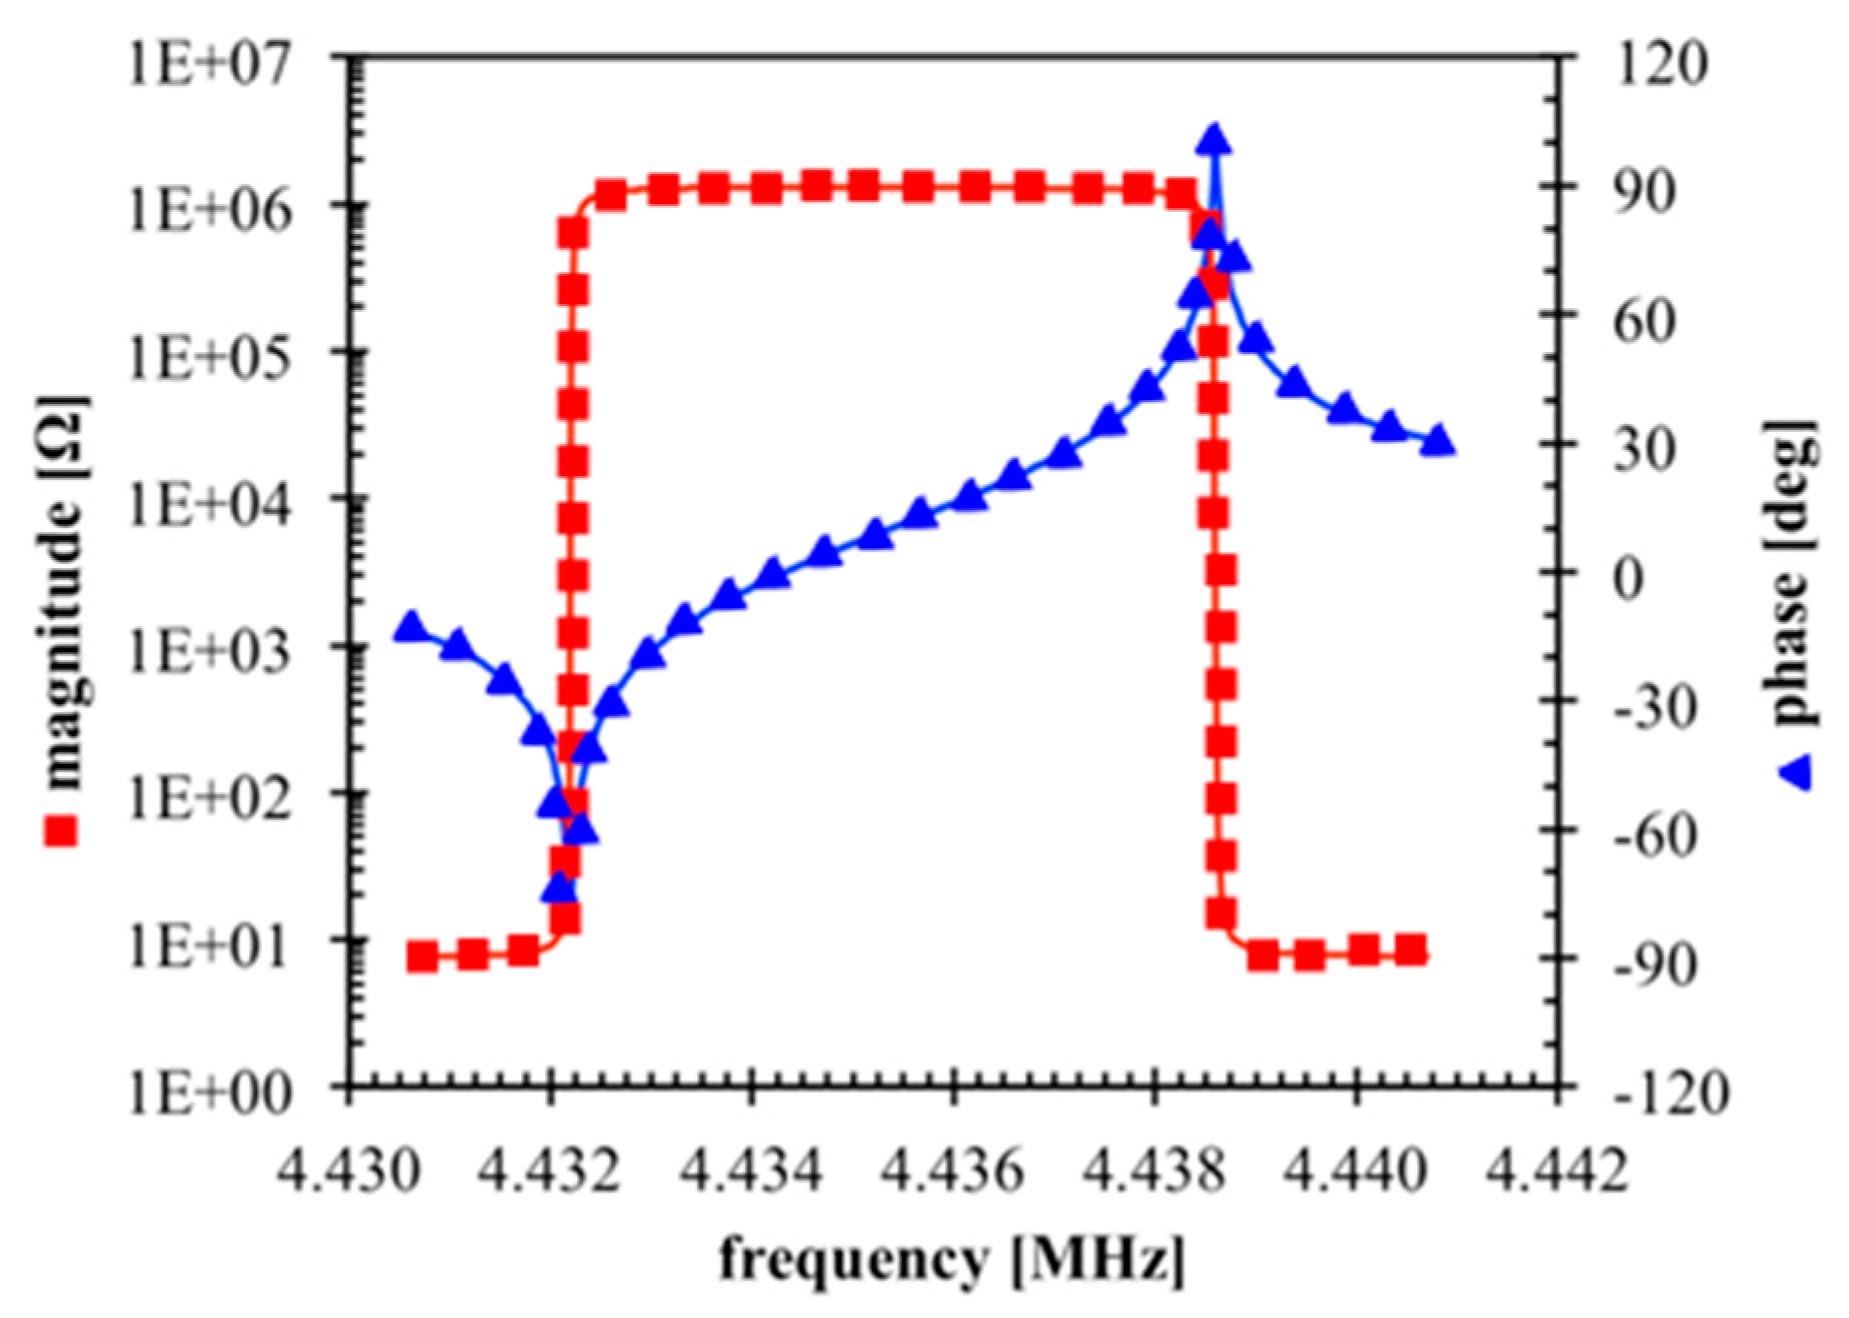
The reference quartz resonator used to verify the derived theory and equivalent model of the contactless interrogation system is a 4.432MHz AT-cut 8-mm diameter crystal with 5-mm diameter gold electrodes. The impedance magnitude and phase diagrams of the sensor, measured with a HP4194A impedance analyzer, are shown in Figure 5. The extracted parameters of the BVD circuit are: C0 = 5.72 pF, Rm = 10.09 Ω, Lm = 77.98 mH, and Cm = 16.54 fF.
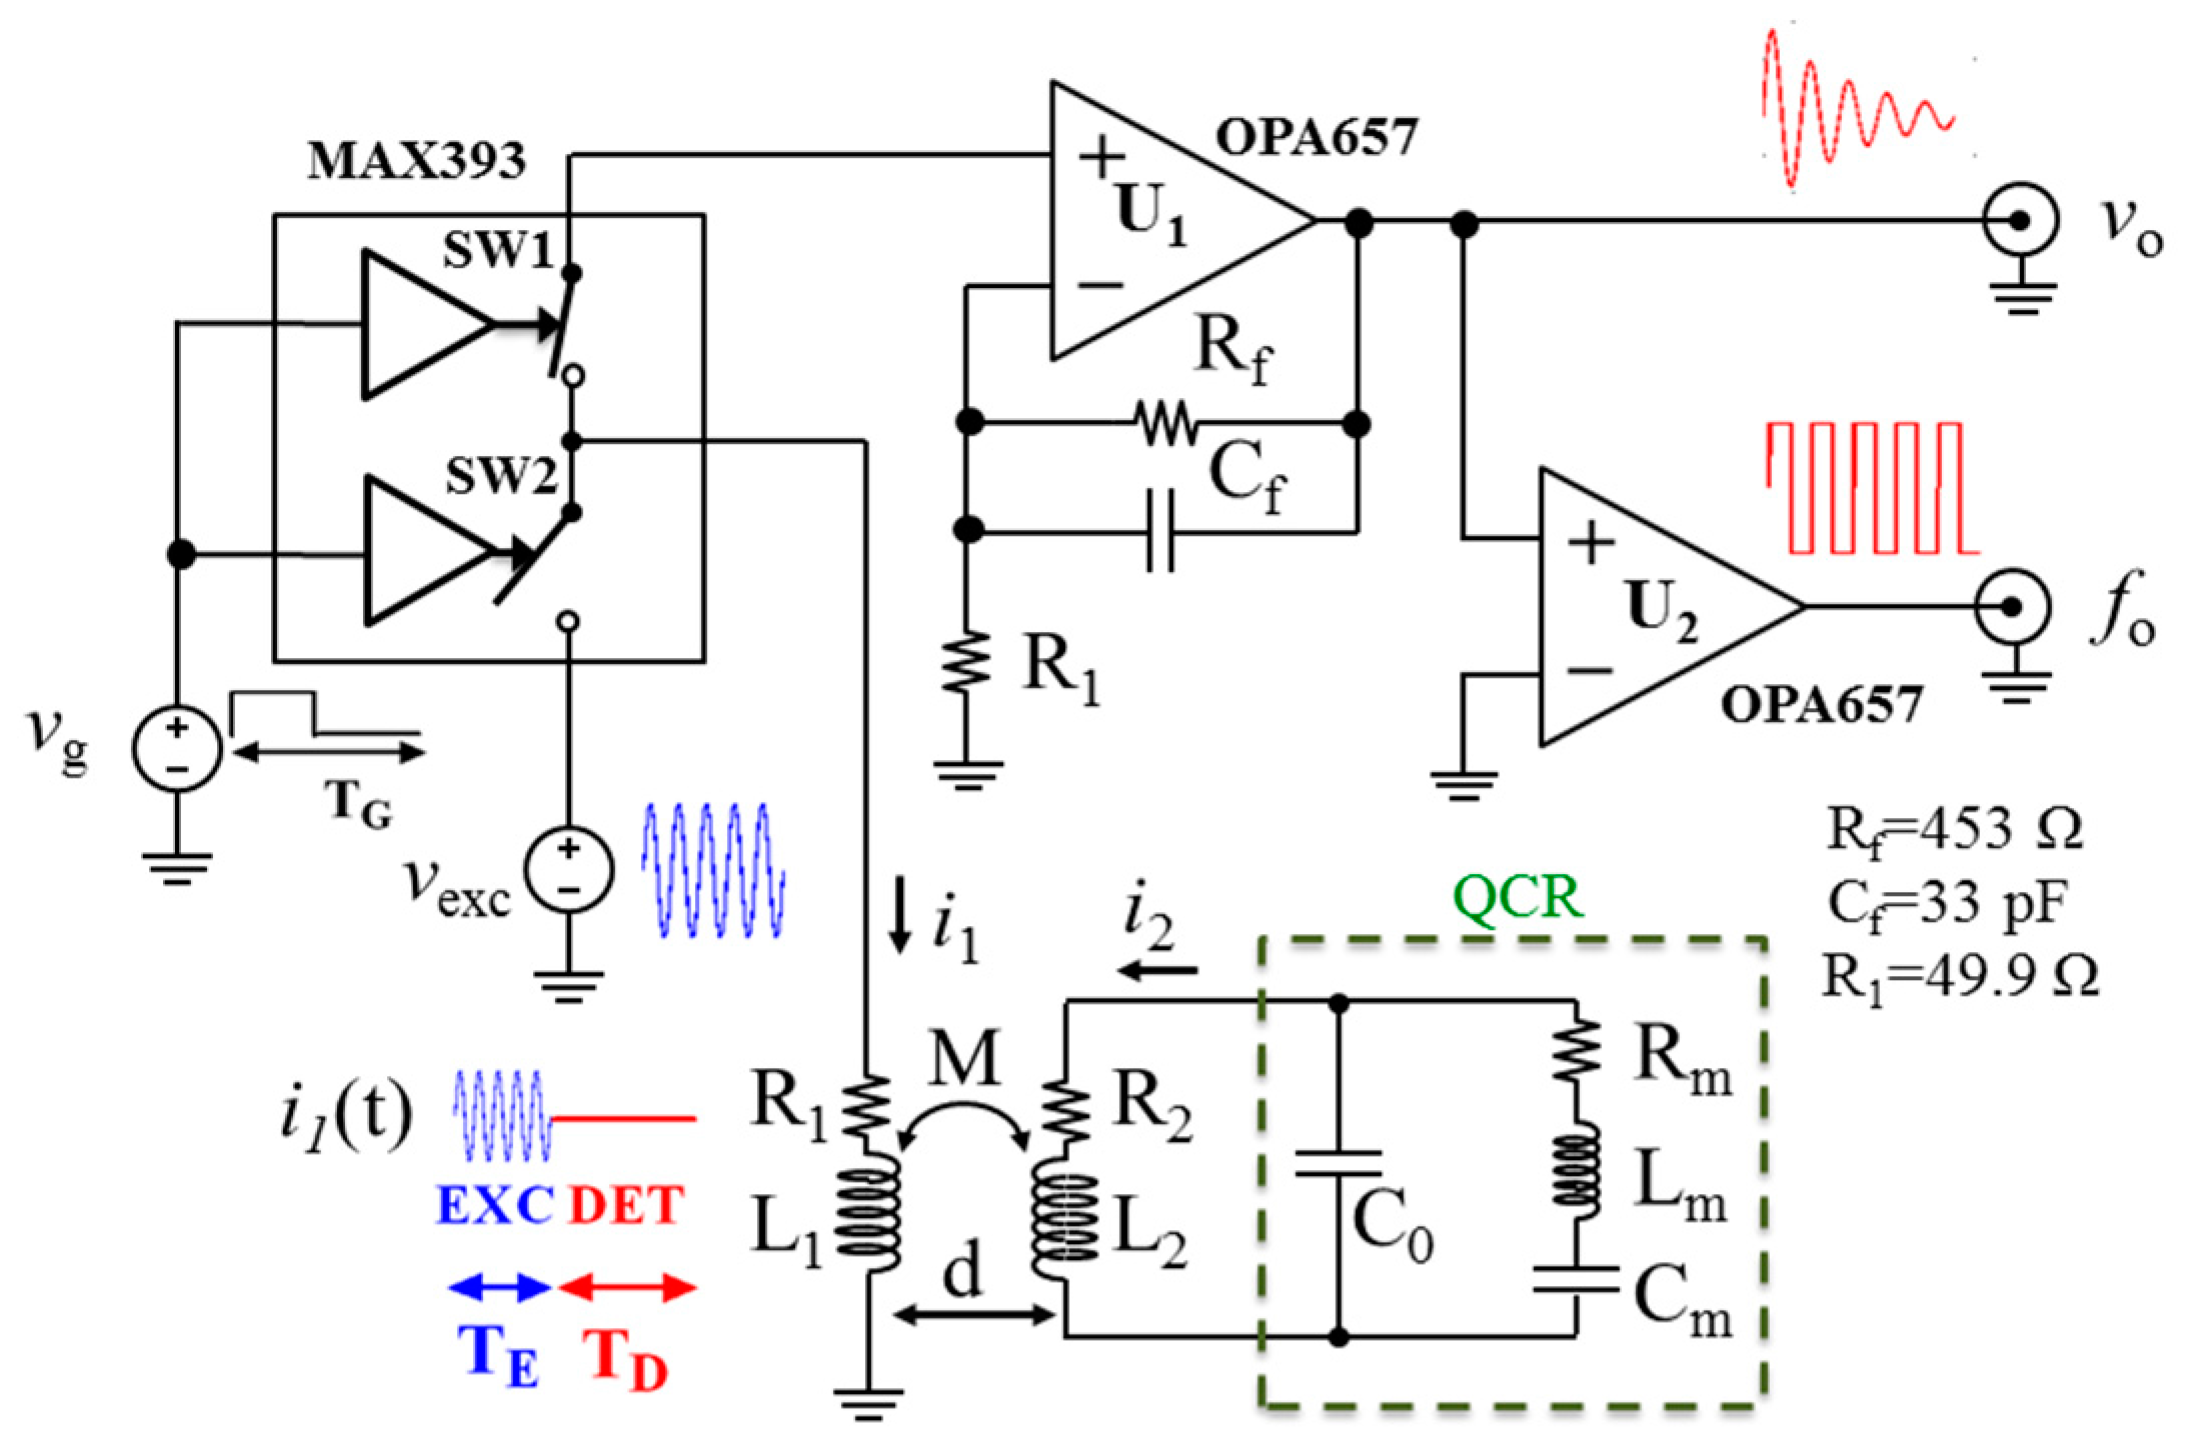
Figure 6 shows the schematic diagram of the circuit realized to implement the contactless interrogation technique. The alternation between the excitation and detection phases is achieved by means of two pairs of normally-open (NO) and normally-closed (NC) electronic analog switches (SWs) (MAX393) driven by the gating signal vg(t). When the NC SW1 is open and the NO SW2 is closed, the coil L1 is connected to the excitation voltage vexc(t). Contrarily, when the NC SW1 is closed and the NO SW2 is open, the coil L1 is connected to the non-inverting amplifier with gain, corresponding to G in Figure 1, of 10 based on a wideband operational amplifier (OPA657) to obtain the output voltage vo(t). The output signal is subsequently squared by an additional operational amplifier used as a zero-crossing detector and its output is fed to a frequency counter to measure fo.
The QCR was driven with an excitation signal vexc of frequency fexc = 4.43 MHz and amplitude 5 V, whereas the gating signal vg had a frequency of 175 Hz and duty cycle of 20%.
Planar spiral coils milled from copper-clad Flame Retardant (FR4) substrates of dimensions 3 cm × 3 cm were used for L1 and L2 during the tests. The coils were measured by means of a HP4194A impedance analyzer at 4.43 MHz. The primary and secondary coils had equivalent series inductance and resistance L1 = 8.45 µH and R1 = 5.07 Ω, and L2 = 8.53 µH and R2 = 5.22 Ω, respectively.
Optimal operation was achieved when the planes of coils were parallel and were aligned along their central out-of-plane axes of symmetry. In these conditions, the flux linkage between the coils and hence the mutual inductance are maximized. These operating conditions were always adopted in all the experimental results reported in the following. However, misalignments of a few millimeters and relative tilt of few degrees of the coils were found not to affect the interrogation process to a significant extent.
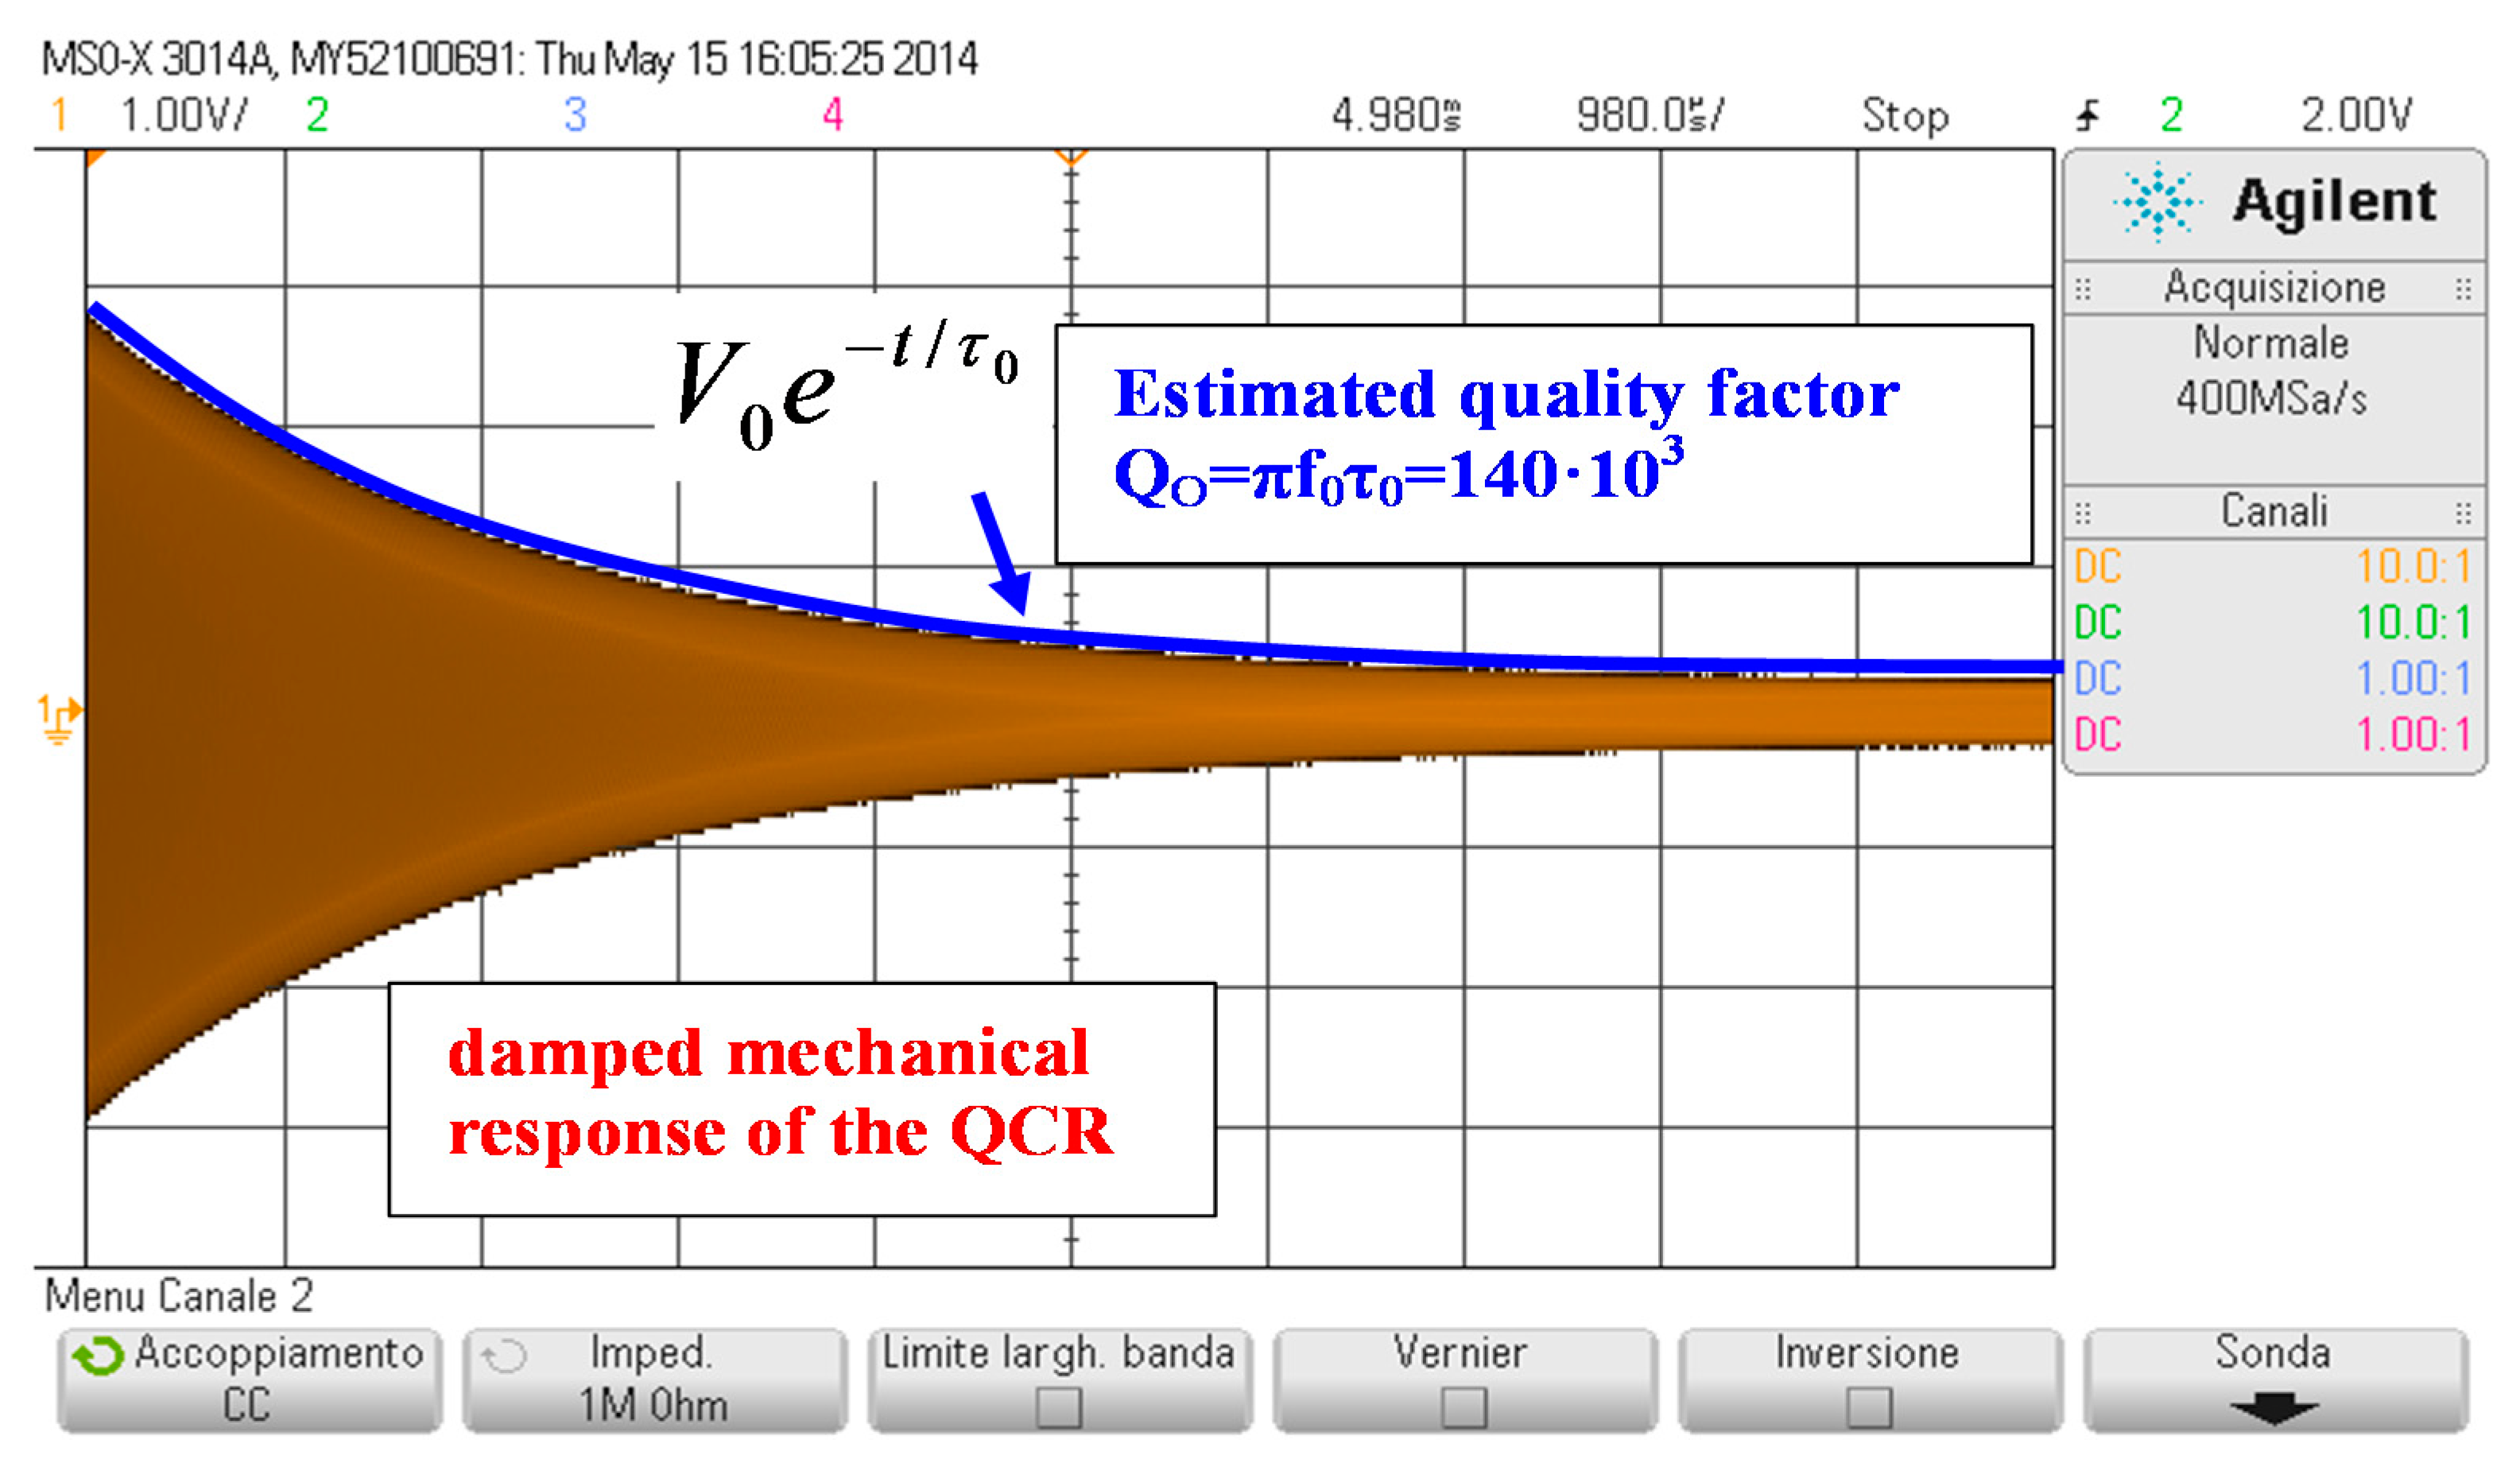
Figure 7 shows a typical measured readout voltage vo taken during the detection phase with the interrogation distance set to d = 5 mm. The interrogation system responds with an exponentially damped sinusoidal signal, as predicted by Equation (8). The readout frequency fo was measured with a Fluke PM6681 frequency counter gated by the signal vg and 30 repeated measurements in the same conditions showed a standard deviation of less than 1 Hz. The damped mechanical resonant frequency was measured to be fdm = fo = 4 431 871 Hz, while analyzing the decaying exponential envelope Voexp(−t/τo) of the readout voltage vo estimated the quality factor at Qo = πfoτo = 140 × 103. By substituting into Equation (7a) the values of the BVD parameters of the reference QCR, a frequency fdm = 4 433 607 Hz was derived. Similarly, from the values of simulations of Figure 4, a quality factor Qm = 142 × 103 was estimated. Both values are in good agreement with the measured values, thus confirming the validity of the developed equivalent model.
In order to validate the proposed equivalent model, the behavior of the system has been tested for different values of the interrogation distance d and inductance of the primary and secondary coils L1 and L2.
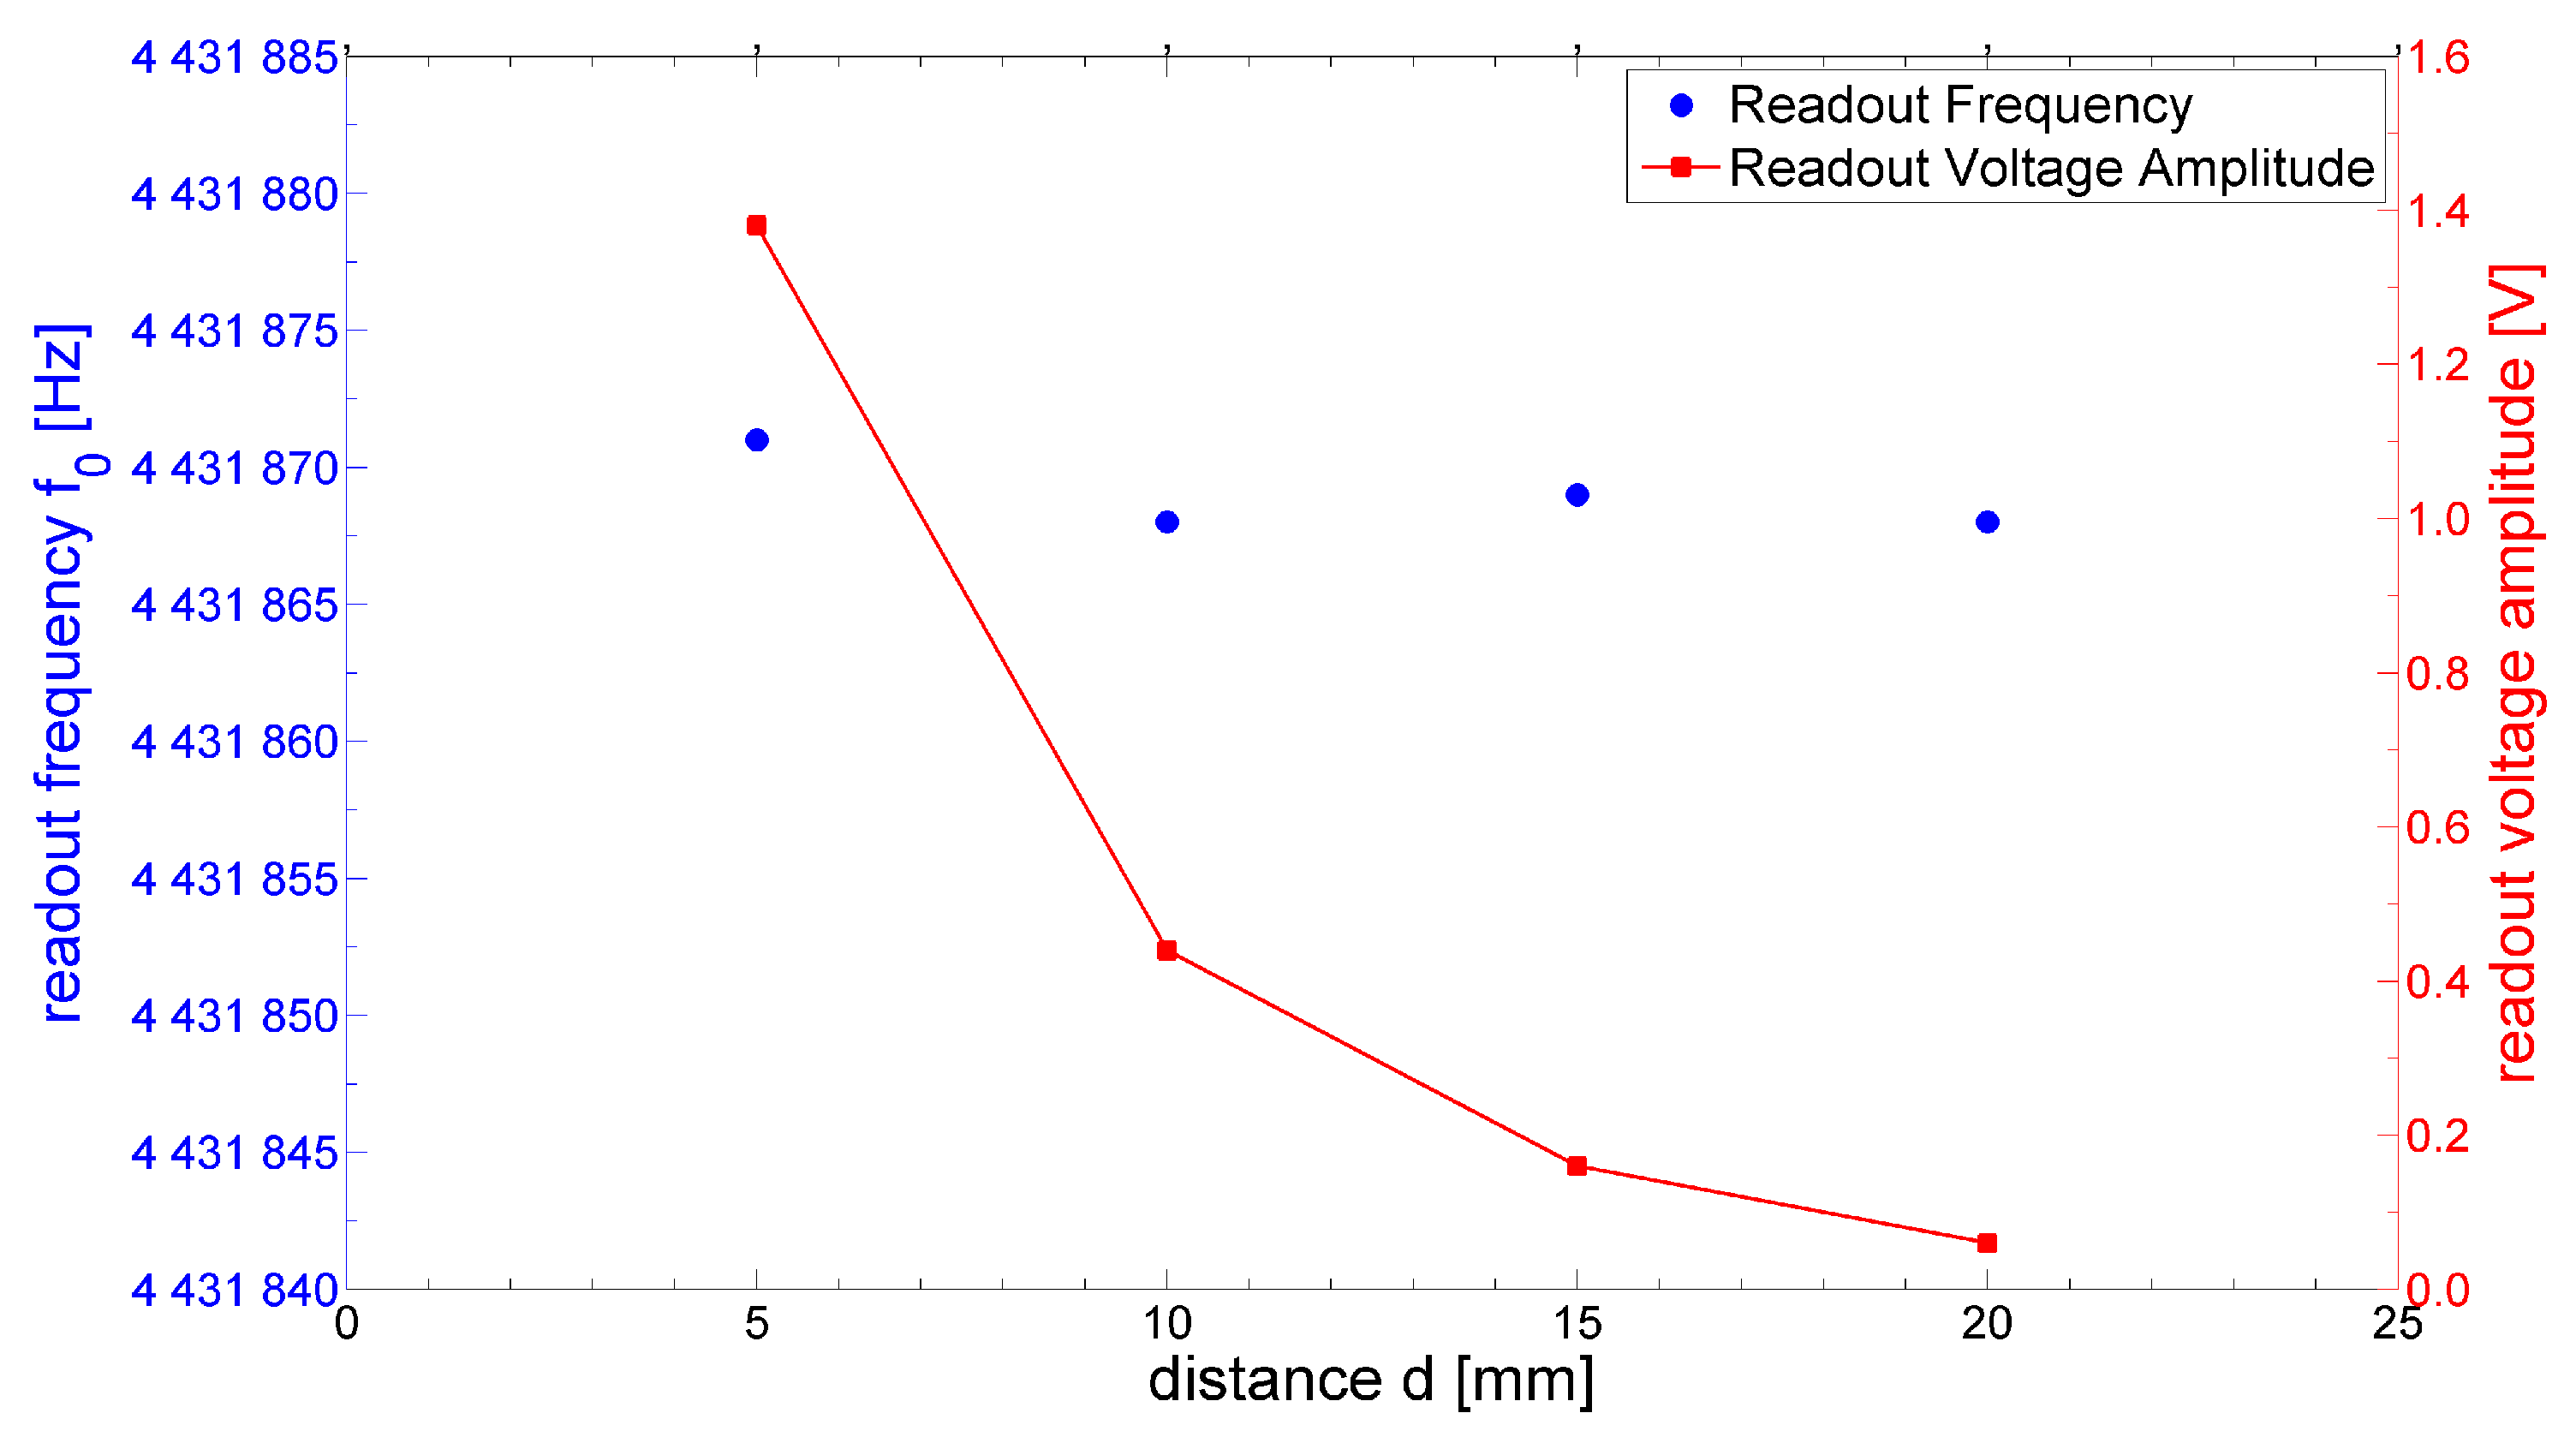
Figure 8 shows the measured readout frequency fo for different values of the interrogation distance d. It can be seen that the variations of fo as the interrogation distance changes do not exceed 3 Hz. On the contrary, the amplitude of the readout voltage taken at a prescribed time t0 = 100 µs elapsed after the end of gated excitation decreases as the interrogation distance increases. This behavior confirms the prediction of the theoretical model and Equation (9), according to which the distance d changes the mutual inductance M, which in turns acts as a scaling factor on the amplitude of the readout voltage without, however, affecting the measured readout frequency.
Figure 9 shows the measured readout frequency fo for different values of the inductance L2 of the secondary coil while keeping L1 = 8.45 µH. The interrogation distance d is set to 5 mm. According to the model and to Equation (7a), the measured frequency is linearly dependent on L2 and, as L2 approaches zero, the readout frequency fo approaches the QCR sensor series resonant frequency fr = fm. The frequency offset between the measured and expected frequencies may well be caused by residual inaccuracies in the system parameter values used in the model.
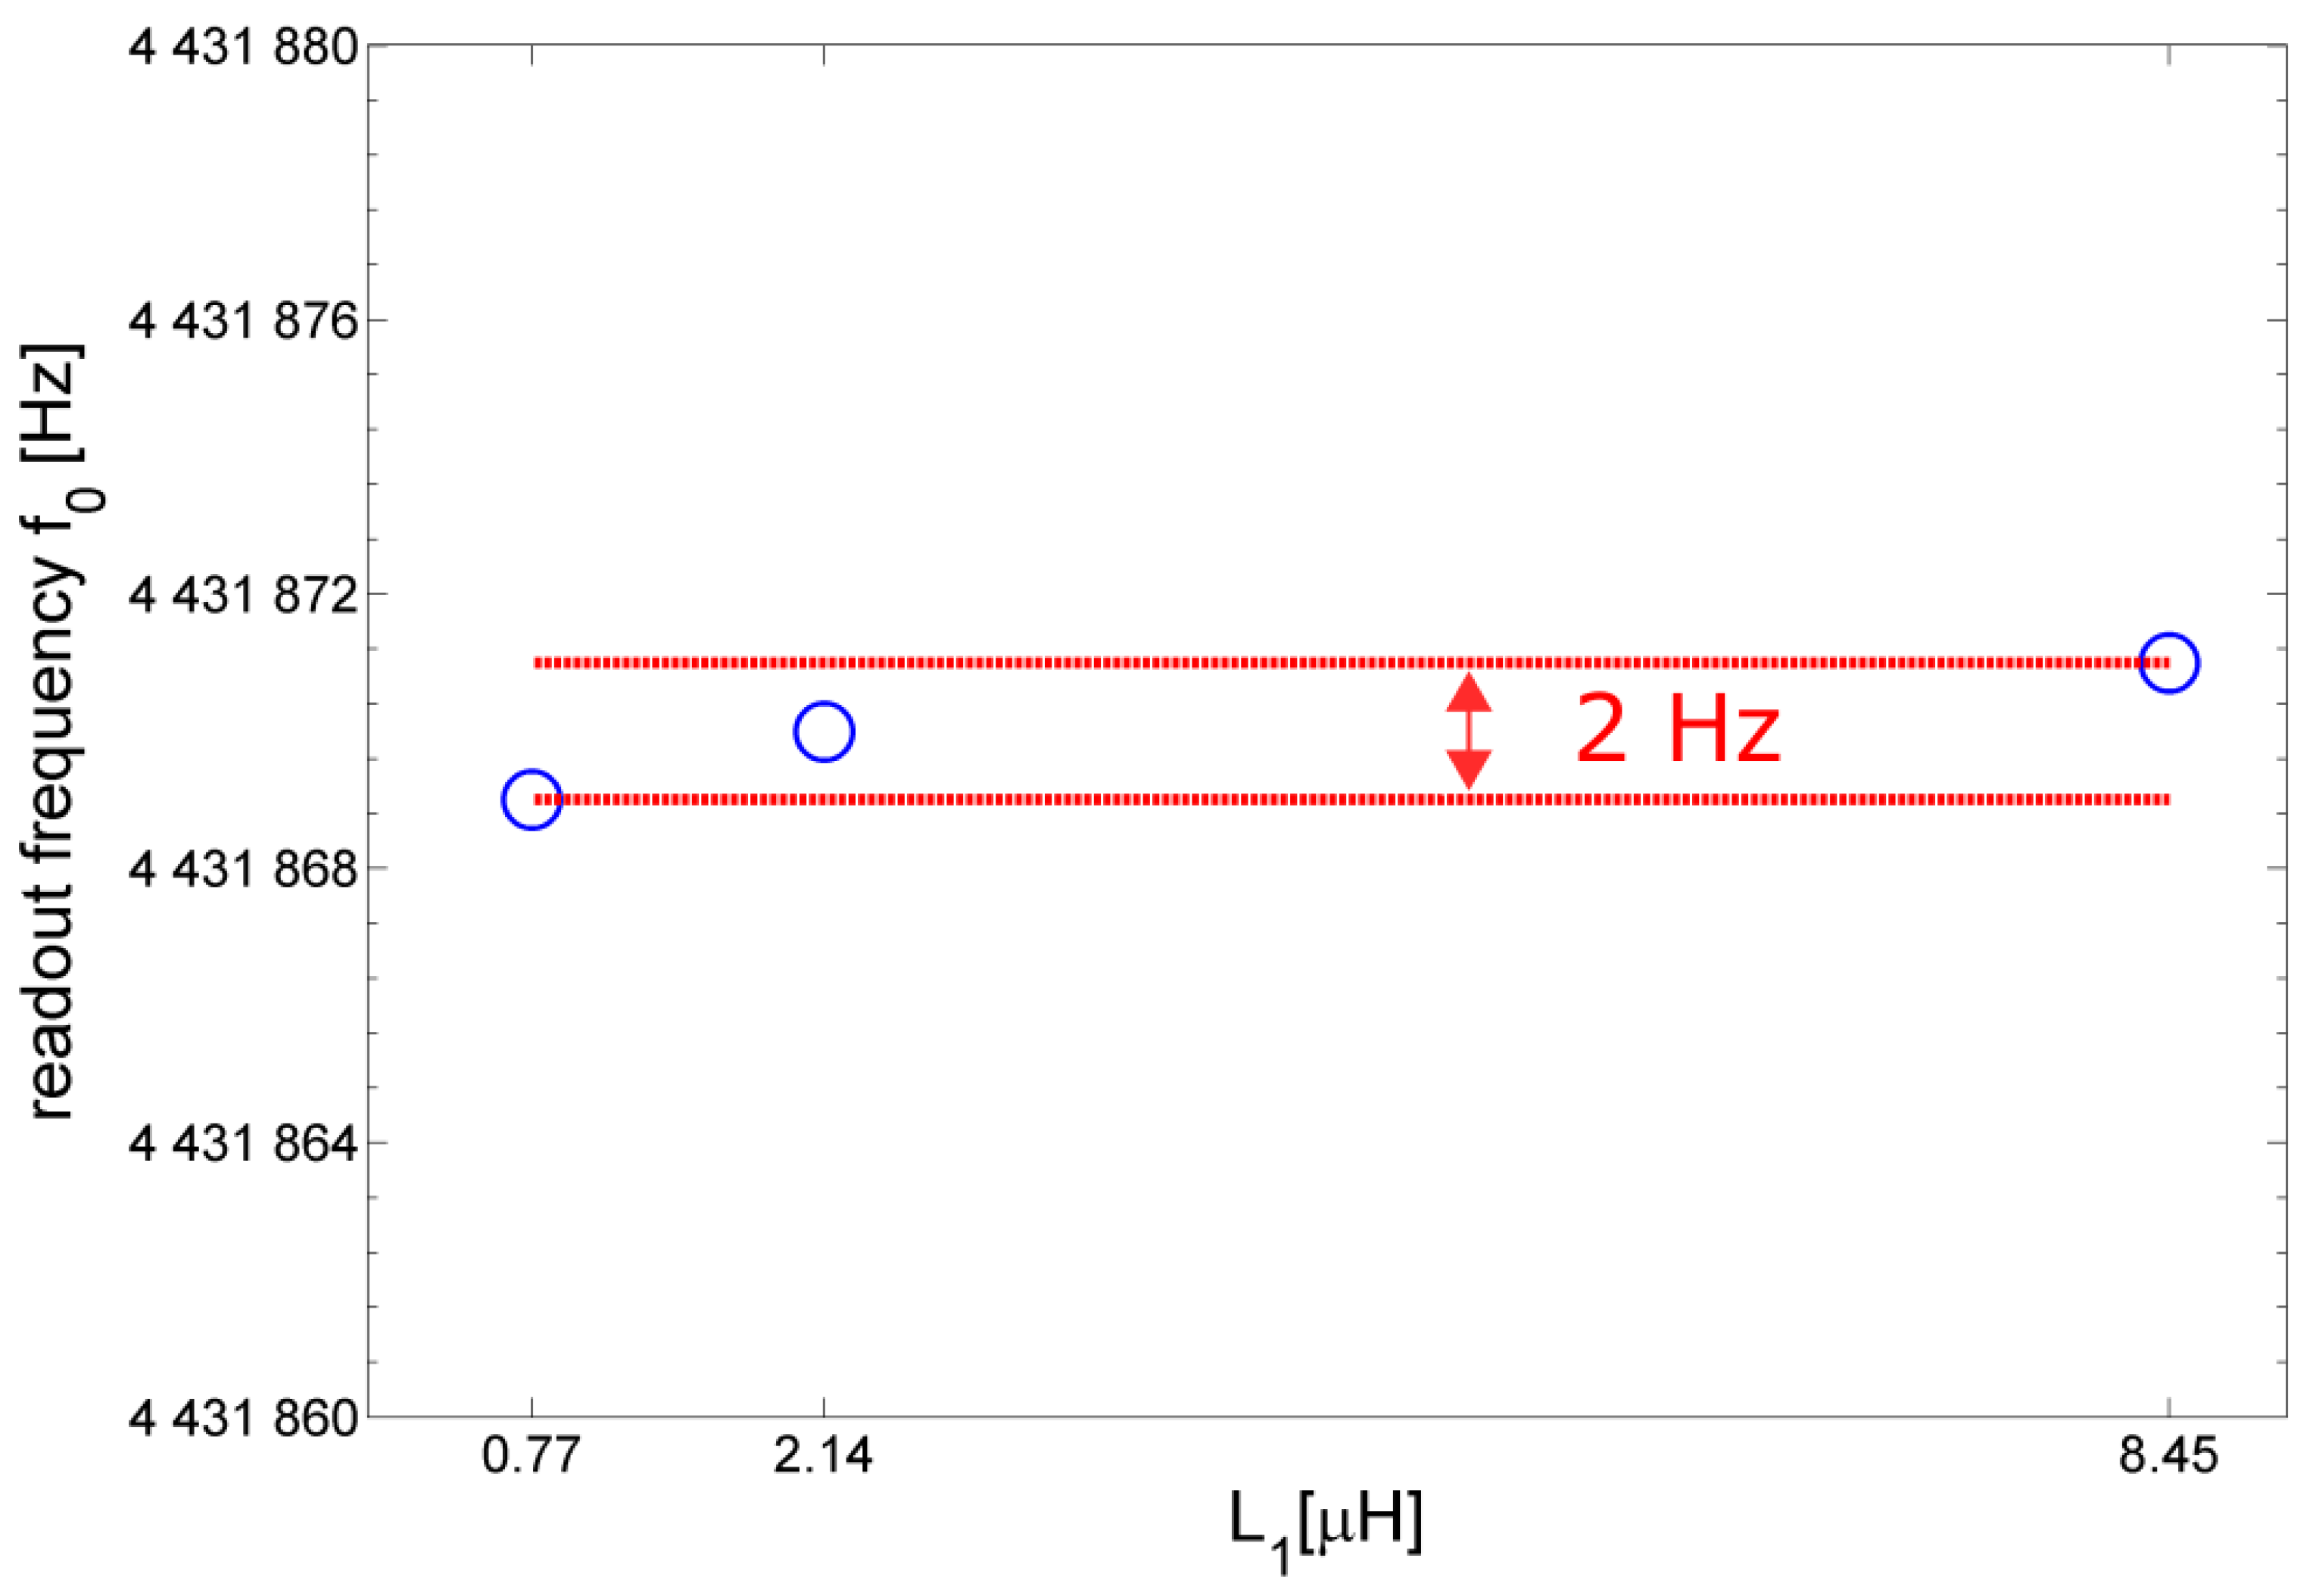
Figure 10 reports the measured readout frequency fo for different values of the inductance L1 of the primary coil. It can be noticed that, as expected, the influence of L1 on fo is negligible. However, decreasing the value of L1 worsens the signal-to-noise ratio (SNR), thus, lowering the repeatability of the readout frequency measurements. Therefore, it is desirable to choose a primary coil with a sufficiently high inductance L1 in order to grant an adequate SNR and repeatability in the contactless measurement operation.
4. Liquid Solution Microdroplet Measurements
The interrogation principle has been validated by detecting the frequency variations due to the deposition of microdroplets of liquid solution of sugar in water on a 4.8 MHz AT-cut quartz crystal.
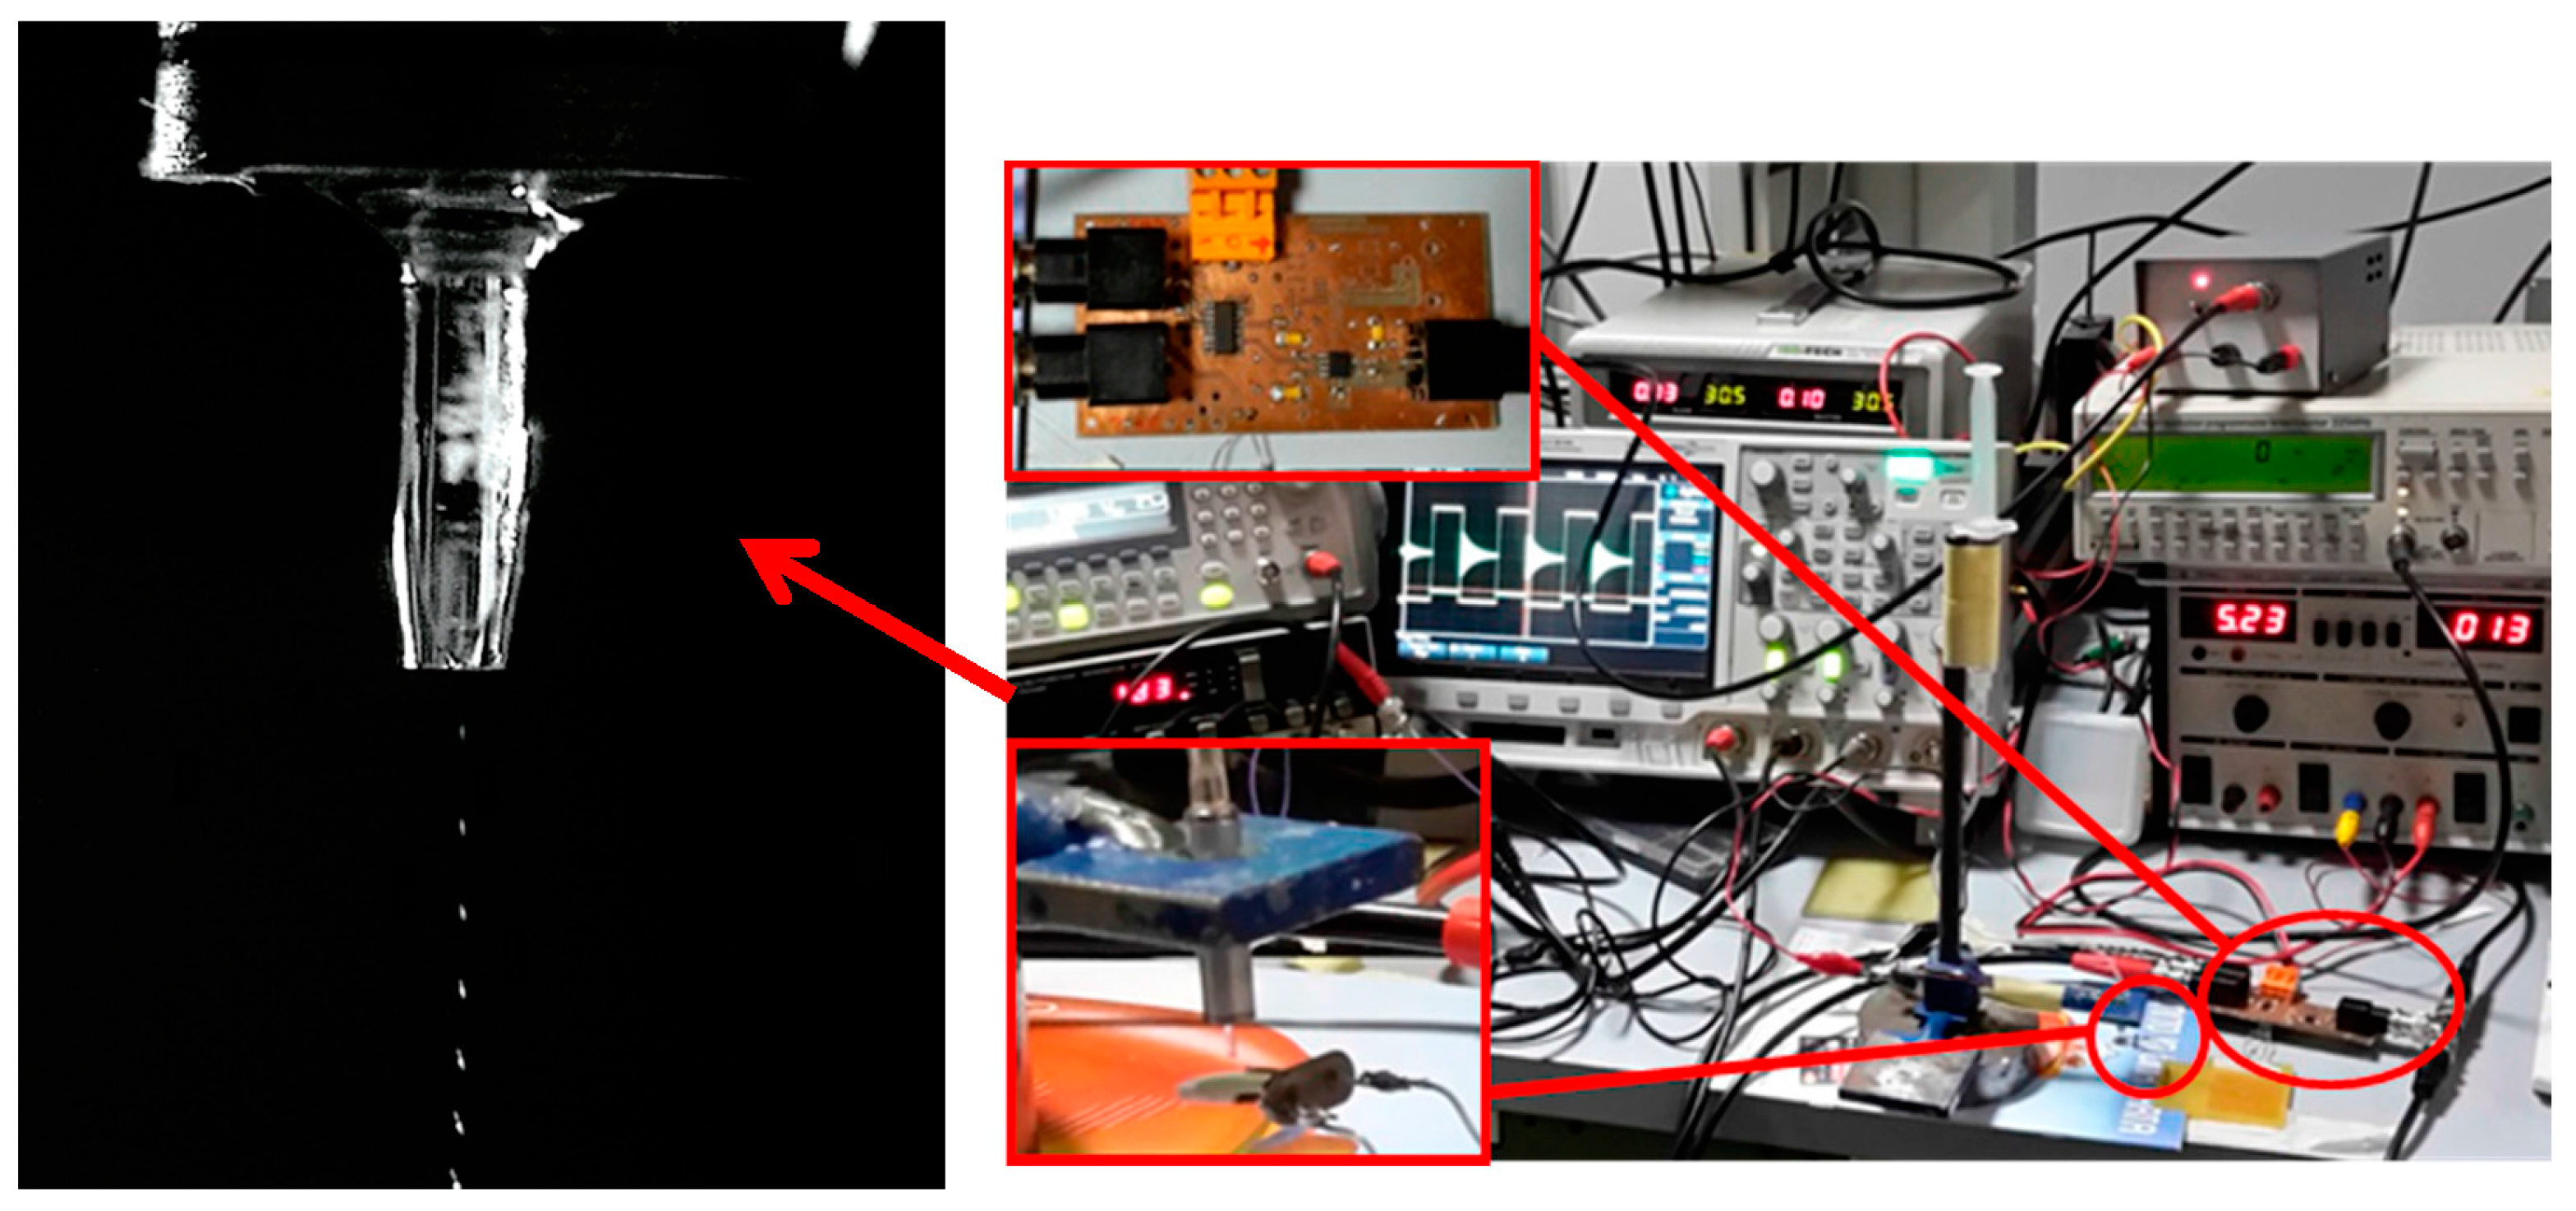
A piezoelectric microdispenser (Microfab MJ-AB) with a 50 µm diameter orifice was adopted to deposit microdroplets on the sensor surface. For each deposition run Dn, the driving signal of the microdispenser was composed of N = 500 pulses at a driving frequency of 80 Hz, in order to obtain N microdroplets. The estimated volume of a single microdroplet was vdrop = 36 pl [10,11], obtaining a total volume of Vdep = Nvdrop = 18 nl per deposition run. A test solution of sugar in water at a concentration of c = 0.25 wt % was prepared for the measurements. Assuming that the density of the solution was about 1 g·cm−3, it results that the mass of sugar for each deposition was about mdep = 45 ng. Figure 11 shows a picture of the experimental setup with a detailed view of the microdispenser ejecting a sequence of microdroplets. In the experimental activity, all the measurements were taken with the coils aligned and set at an interrogation distance d of about 5 mm.
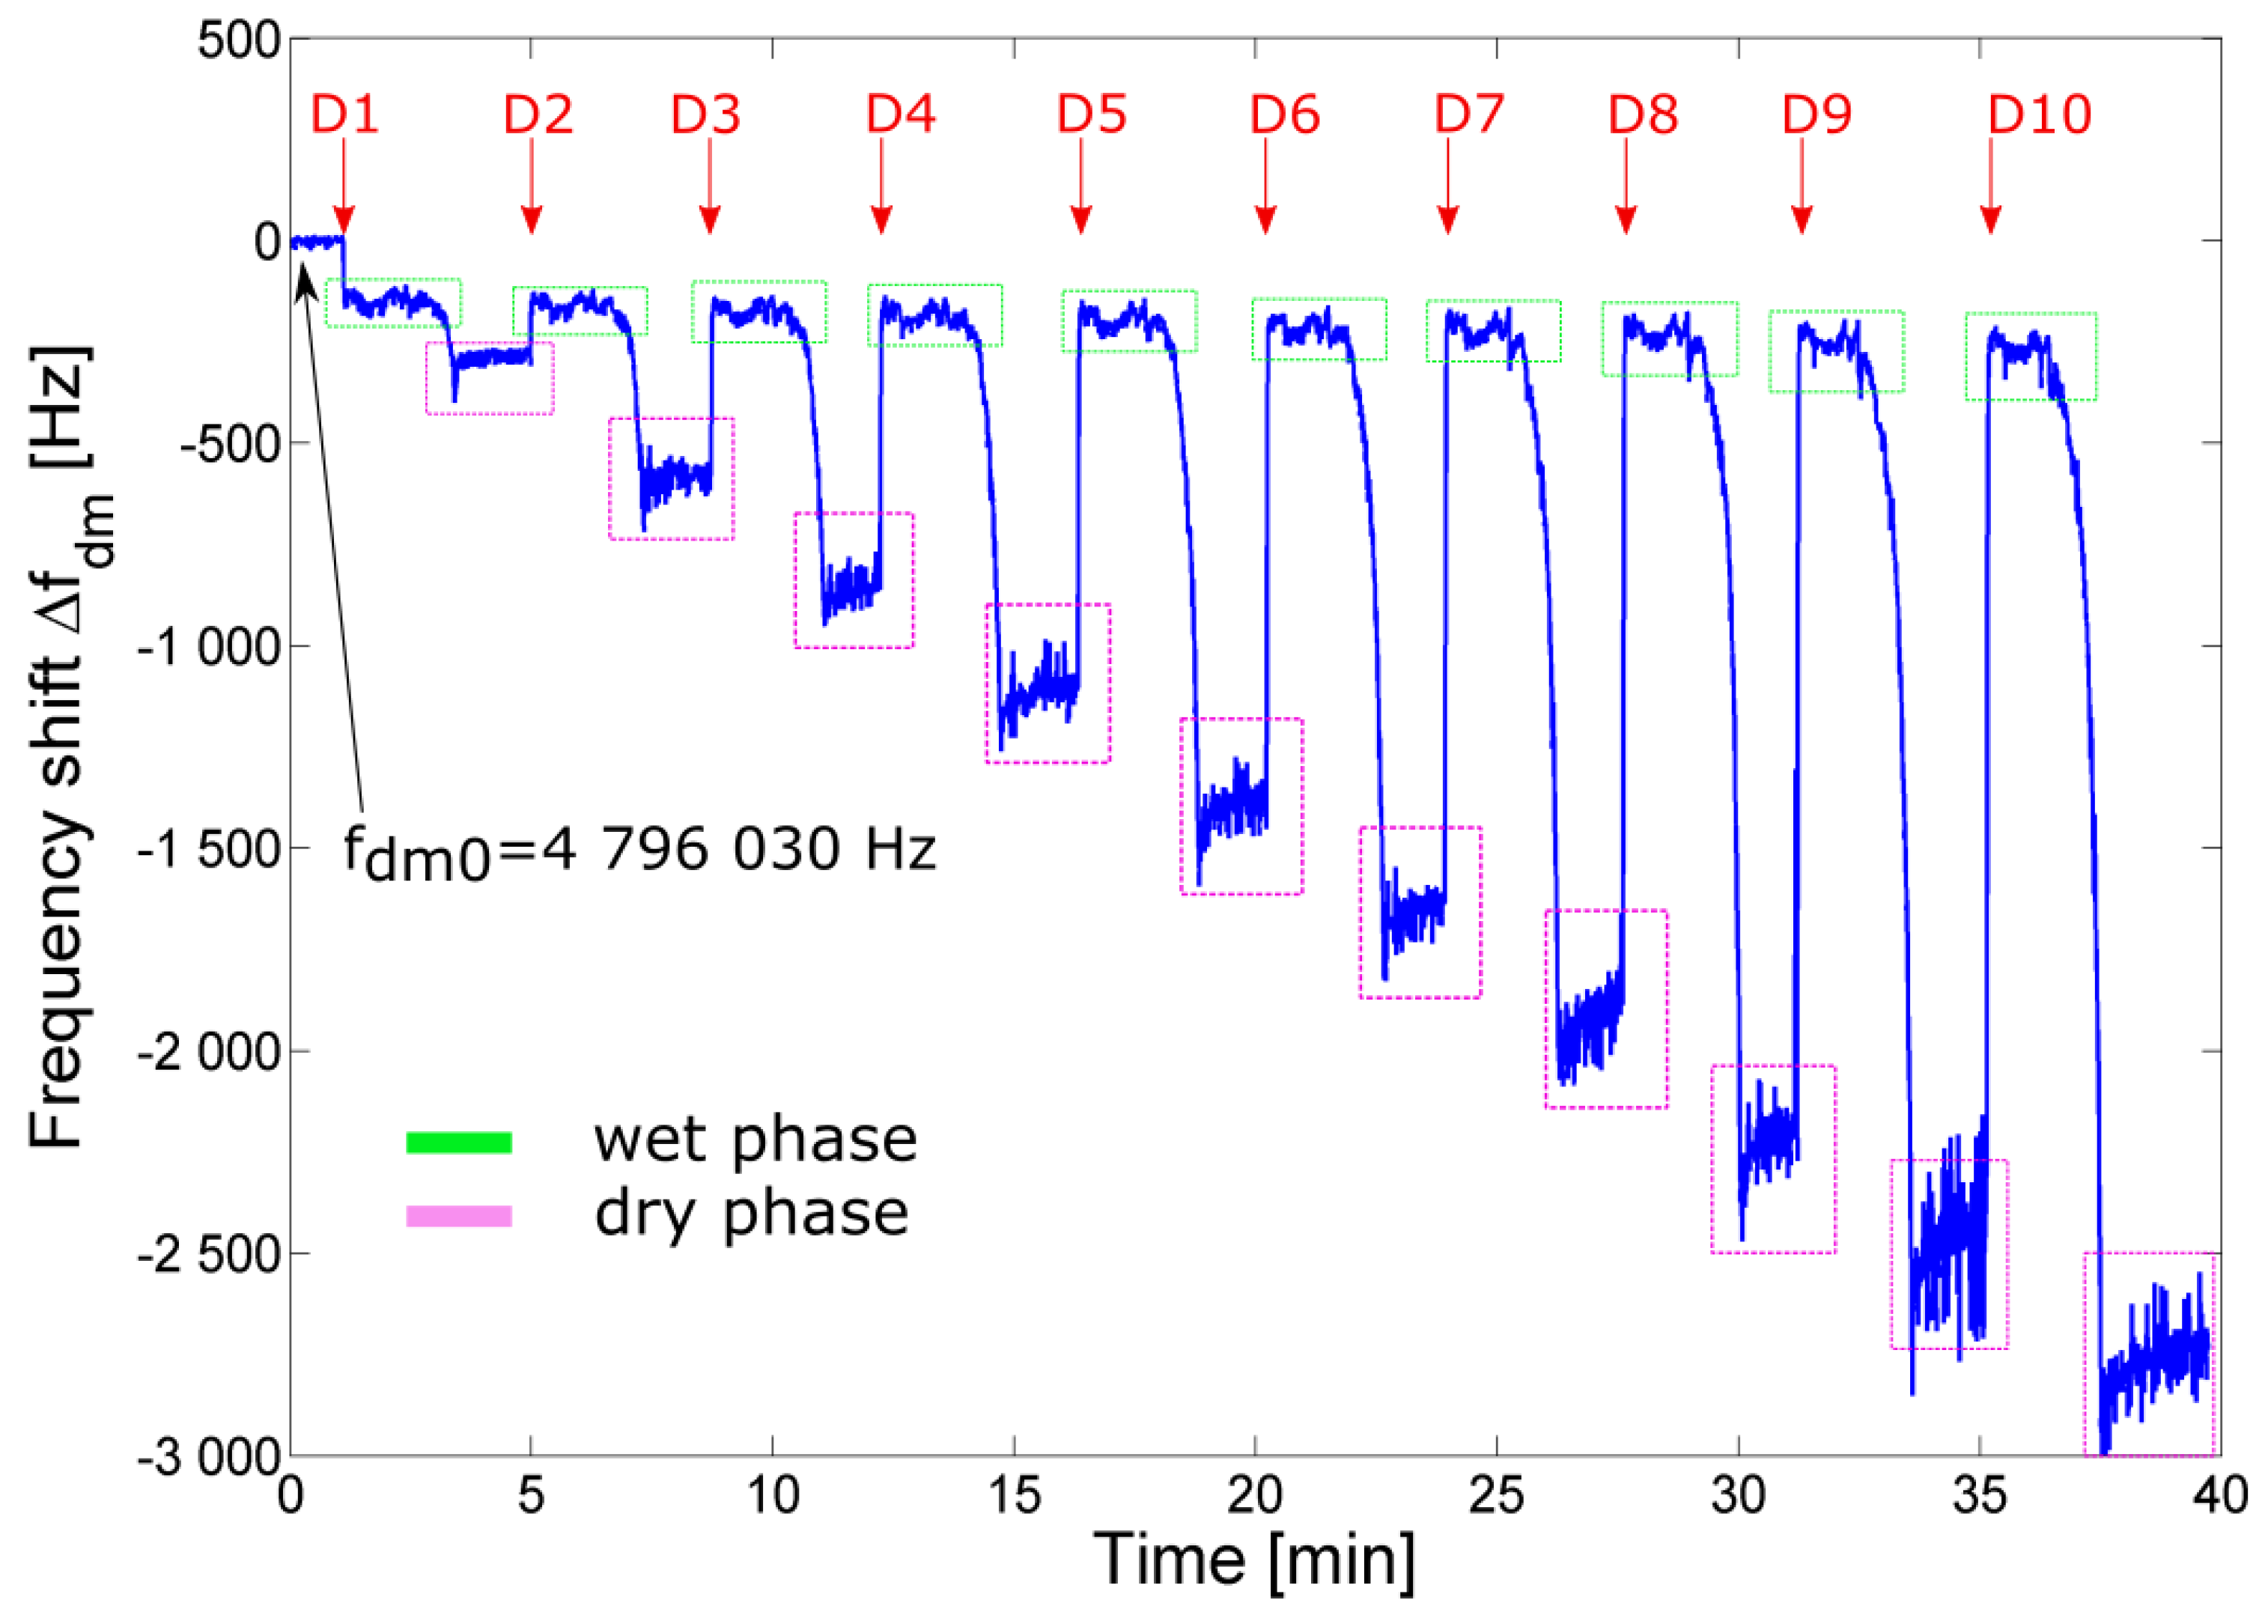
Figure 12 shows the output frequency shift Δfdm as a function of time during 10 deposition runs of the test solution. Each deposition was triggered about every 4 min. The unloaded damped frequency fdm0 of the quartz was 4 798 030 Hz. After each deposition run Dn, the QCR sensor response was divided in two different phases termed in the following discussion as the wet phase and the dry phase. The wet phase corresponds to the situation where a fixed amount of volume Vdep of solution has been deposited and an initial steady-state frequency shift Δfwet(n) is measured before the evaporation process. The dry phase starts at the end of the evaporation process of water and the steady-state frequency shift |Δfdry(n)| is then measured. More specifically, it can be observed that at the moment of the first deposition D1 (at about t = 1 min) an initial frequency downshift is present. This is ascribed to the acoustic load given by both the liquid-solution density and viscosity. After the deposition, during the drying process, a second frequency downshift is observed (at about t = 3.5 min) which is ascribed to the transition of the acoustic load from wet to dry phases. The steady state (magenta boxes) given by the mass of the residual thin film of sugar, is then used to estimate Δfdry. In the dry phase it can be reasonably assumed that a sugar film of mass mfilm = n·mdep is formed on the surface of the QCR sensor. Starting from D2, an initial frequency upshift is present, suggesting that each fixed-volume added deposition dissolves the existing sugar film on the sensor (except for the first deposition D1) and essentially increases the sugar concentration in the deposited liquid solution. Each new deposition Dn increments the concentration of sugar solution cs to cs = n × c and causes a variation of the acoustic properties of the deposited liquid solution that is detected. After the deposition, where an initial steady-state (green boxes) is observed, the drying process starts and a frequency downshift is observed due to the transition from wet to dry phases. As a consequence, considering the (n + 1) deposition run, a frequency upshift is observed, such that |Δfdry(n)| > |Δfwet(n + 1)|. This behavior can be explained observing that in the wet phase Δfwet(n) is related to the concentration cs of the solution, while in the dry phase Δfdry(n) is related to the mass ms of sugar.
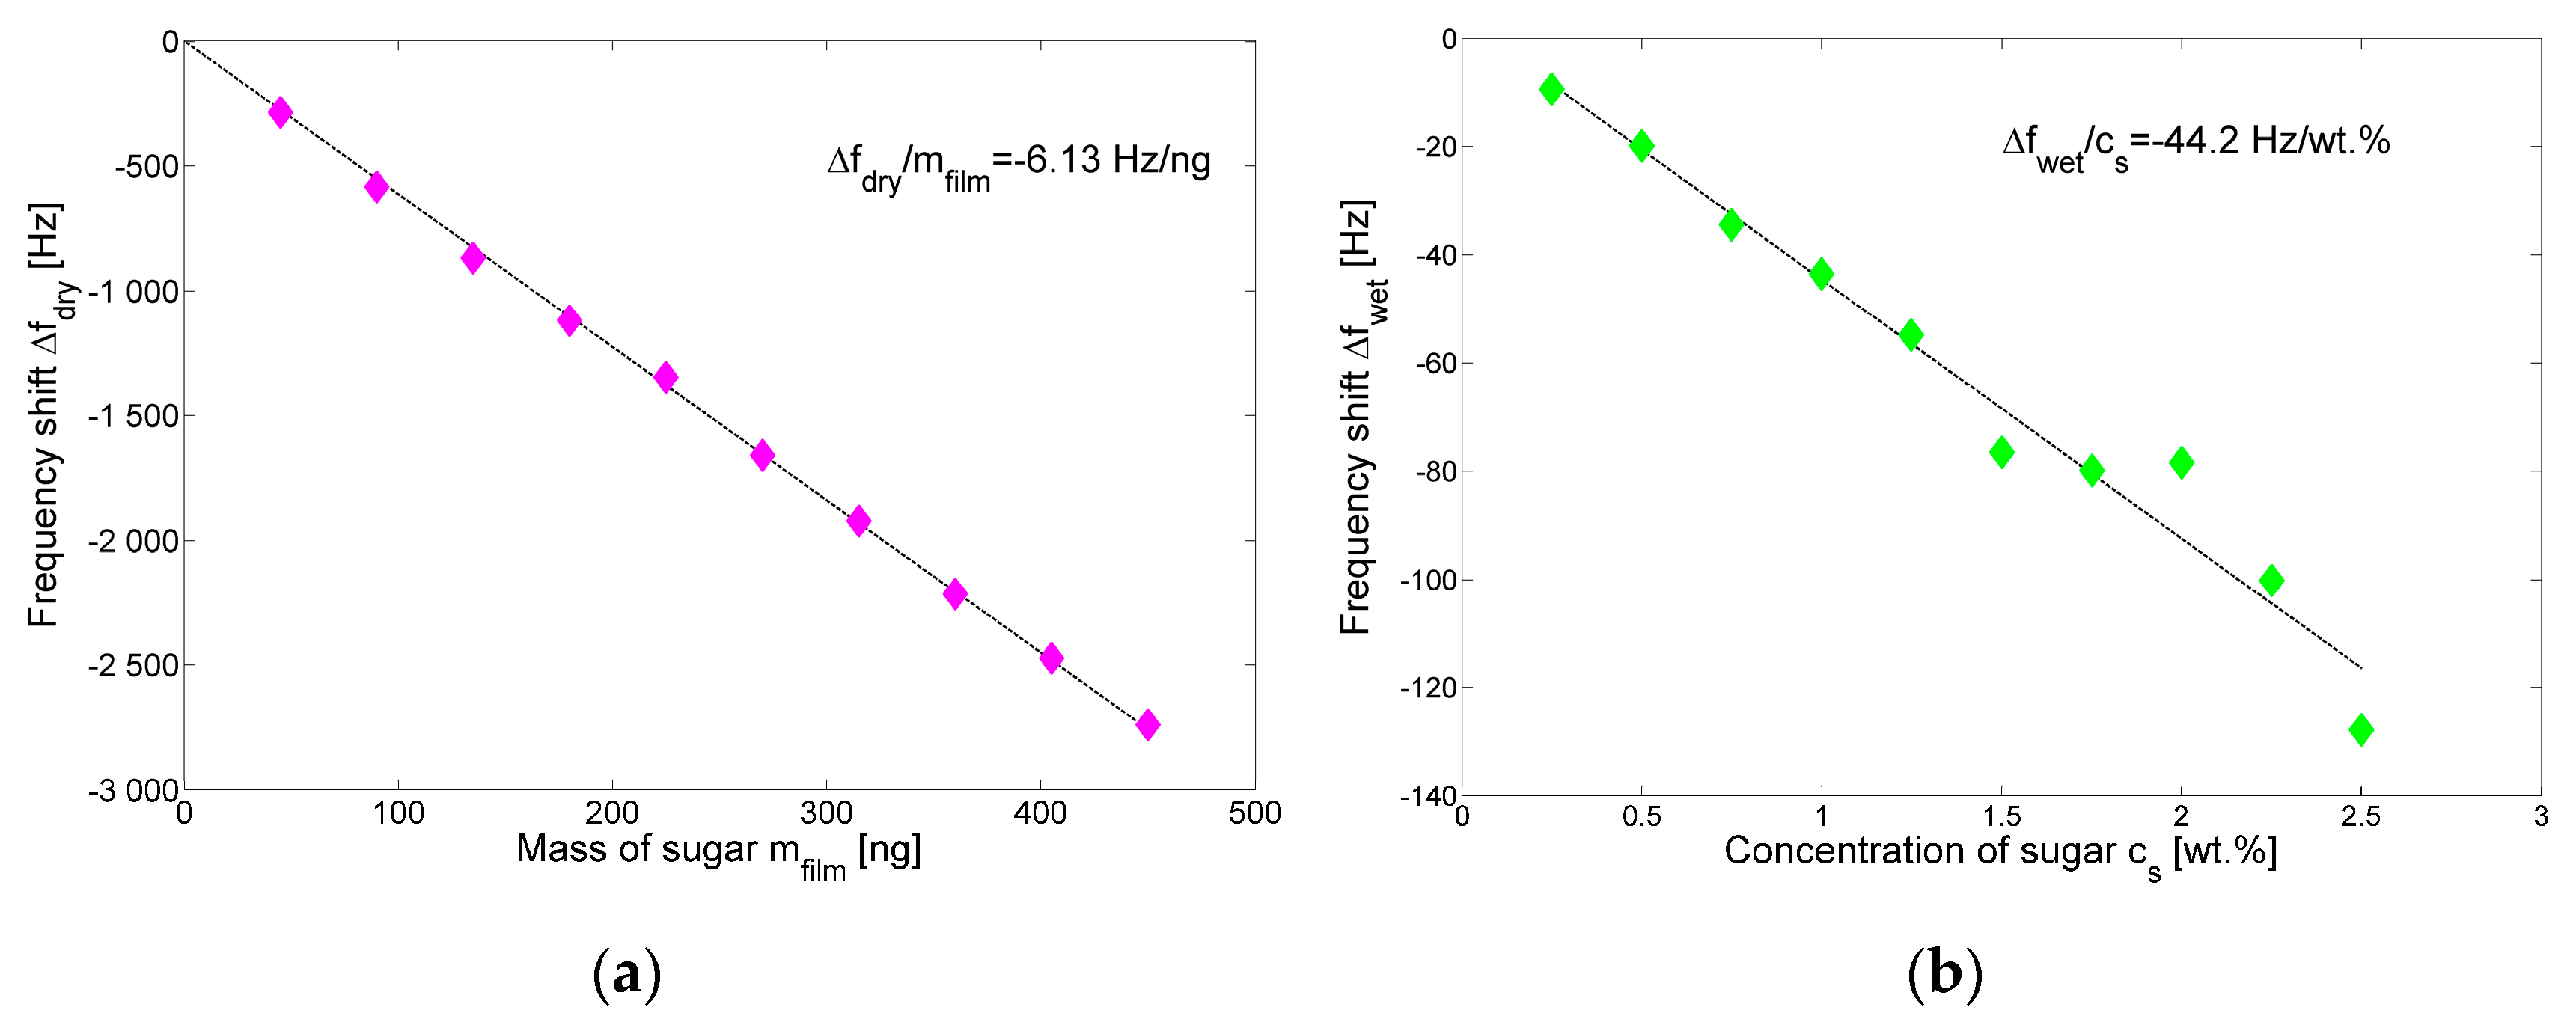
Figure 13a shows the steady-state frequency shift Δfdry derived from Figure 12 as a function of the deposited sugar mass mfilm, where the linear behavior obtained validates the operation of the QCR sensor in a gravimetric regime in the explored range with a sensitivity of about −6.13 Hz/ng. Figure 13b shows the steady-state frequency shift Δfwet derived from Figure 12 as a function of the sugar concentration cs, where a linear trend was obtained in the considered concentration range with a sensitivity of about −44.2 Hz/wt %.
In principle, the quality factor Q could be measured in the reported experiments, though they were not performed in this case with the adopted setup. A new contactless system which includes a tailored circuit performing heterodyne demodulation (frequency down-mixing) during the detection phase and autocorrelation analysis is reported in [27]. The new system allows frequency and quality factor measurements with an update rate of up to five measurements per second.
5. Conclusions
The present paper has addressed the theoretical study of a contactless interrogation system for quartz crystal resonator sensors which exploits the electromagnetic air coupling between two coils to perform a gated excitation of the resonator, followed by the sensing of the free transient response. The developed analytical model and related lumped-element equivalent circuit have shown that the proposed technique offers independence from the interrogation distance, which is advantageous with respect to other techniques requiring a fixed or known distance between the sensor and the interrogation unit. The predicted behavior has been investigated and validated experimentally. In addition, the technique has been applied to the measurement of deposition of microdroplets of a sugar-water solution. The proposed technique successfully measured relevant parameters of solutions in terms of solute and solvent. By adopting suitable elaboration techniques, such as correlation algorithms [27,29], improvements of the signal-to-noise ratio can be achieved. Future developments include the possibility of applying the technique to measurements on biological samples in closed volumes with proximate interrogation from outside.
Acknowledgments
The contribution of Mehedi Masud in the experimental activity is greatly acknowledged.
Author Contributions
Vittorio Ferrari conceived the proposed technique, contributed in the theory and modeling, and in revising the paper. Marco Ferrari contributed in the experimental activity, the analysis of experimental data, and in revising the paper. Marco Baù contributed in the theory and modeling and in writing the paper.
Conflicts of Interest
The authors declare no conflict of interest.
References
- Vig, J.R. Introduction to Quartz Frequency Standards. Available online: https://ieee-uffc.org/frequency-control/learning-resources/introduction-to-quartz-frequency-standards-by-john-r-vig/ (accessed on 29 May 2017).
- Benes, E.; Gröschl, M.; Burger, W.; Schmid, M. Sensors based on piezoelectric resonators. Sens. Actuators A Phys. 1995, 48, 1–21. [Google Scholar] [CrossRef]
- Ballantine, D.S., Jr.; White, R.M.; Martin, S.J.; Ricco, A.J.; Zellers, E.T.; Frye, G.C.; Wohltjen, H.; Levy, M.; Stern, R. Acoustic wave sensors and responses. In Acoustic Wave Sensors: Theory, Design, and Physico-Chemical Applications; Academic Press: Cambridge, MA, USA, 1997; pp. 36–149. [Google Scholar]
- Ferrari, V.; Lucklum, R. Overview of acoustic-wave microsensors. In Piezoelectric Transducers and Applications, 2nd ed.; Arnau, A., Ed.; Springer: Berlin/Heidelberg, Germany, 2008; pp. 39–62. [Google Scholar]
- Mecea, V.M.; Carlsson, J.O.; Bucur, R.V. Extensions of the quartz-crystal-microbalance technique. Sens. Actuators A Phys. 1996, 53, 371–378. [Google Scholar] [CrossRef]
- Ferreira, G.N.M.; da-Silva, A.C.; Tomé, B. Acoustic wave biosensors: Physical models and biological applications of quartz crystal microbalance. Trends Biotechnol. 2009, 27, 689–697. [Google Scholar] [CrossRef] [PubMed]
- Janshoff, A.; Galla, H.J.; Steinem, C. Piezoelectric mass-sensing devices as biosensors—An alternative to optical biosensors? Angew. Chem. Int. Ed. 2000, 39, 4004–4032. [Google Scholar] [CrossRef]
- Janshoff, A.; Steinem, C. Quartz Crystal Microbalance for Bioanalytical Applications. Sens. Update 2001, 9, 313–354. [Google Scholar] [CrossRef]
- Buttry, D.A.; Ward, M.D. Measurement of interfacial processes at electrode surfaces with the electrochemical quartz crystal microbalance. Chem. Rev. 1992, 92, 1355–1379. [Google Scholar] [CrossRef]
- Ferrari, M.; Ferrari, V. An oscillator circuit for dual-harmonic tracking of frequency and resistance in quartz resonator sensors. Meas. Sci. Technol. 2009, 20, 124005–124016. [Google Scholar] [CrossRef]
- Ferrari, M.; Ferrari, V.; Marioli, D. Interface Circuit for Multiple-Harmonic Analysis on Quartz Resonator Sensors to Investigate on Liquid Solution Microdroplets. Sens. Actuators B Chem. 2009, 146, 489–494. [Google Scholar] [CrossRef]
- Sell, J.K.A.; Niedermayer, O.; Jakoby, B. Reactance-locked loop for driving resonant sensors. In Proceedings of the 2012 IEEE International Instrumentation and Measurement Technology Conference, Graz, Austria, 13–16 May 2012; pp. 1113–1116. [Google Scholar]
- Lucklum, R.; Doerner, S.; Schneider, T.; Schlatt-Masuth, B.; Jacobs, T.; Hauptmann, P. Real Time Kinetic Analysis with Quartz Crystal Resonator Sensors. In Proceedings of the 2006 IEEE International Frequency Control Symposium and Exposition, Miami, FL, USA, 4–7 June 2006; pp. 528–534. [Google Scholar]
- Rodahl, M.; Hook, F.; Krozer, A.; Brzezinski, P.; Kasemo, B. Quartz crystal microbalance setup for frequency and Q-factor measurements in gaseous and liquid environments. Rev. Sci. Instrum. 1995, 66, 3924–3930. [Google Scholar] [CrossRef]
- Ferrari, M.; Ferrari, V.; Guizzetti, M.; Marioli, D. An autonomous battery-less sensor module powered by piezoelectric energy harvesting with RF transmission of multiple measurement signals. Smart Mater. Struct. 2009, 18, 085023. [Google Scholar] [CrossRef]
- Dalola, S.; Ferrari, M.; Ferrari, V.; Guizzetti, M.; Marioli, D.; Taroni, A. Characterization of thermoelectric modules for powering autonomous sensors. IEEE Trans. Instrum. Meas. 2009, 58, 99–107. [Google Scholar] [CrossRef]
- Abad, E.; Zampolli, S.; Marco, S.; Scorzoni, A.; Mazzolai, B.; Juarros, A.; Gómez, D.; Elmi, I.; Cardinali, G.C.; Gómez, J.M. Flexible tag microlab development: Gas sensors integration in RFID flexible tags for food logistic. Sens. Actuators B Chem. 2007, 127, 2–7. [Google Scholar] [CrossRef]
- Pohl, A. A review of wireless SAW sensors. IEEE Trans. Ultrason. Ferroelectr. 2000, 47, 317–332. [Google Scholar] [CrossRef] [PubMed]
- Pohl, A.; Ostermayer, G.; Seifert, F. Wireless sensing using oscillator circuits locked to remote high-Q SAW resonators. IEEE Trans. Ultrason. Ferroelectr. 1998, 45, 1161–1168. [Google Scholar] [CrossRef] [PubMed]
- Ogi, H.; Motoshisa, K.; Matsumoto, T.; Hatanaka, K.; Hirao, M. Isolated electrodeless high-frequency quartz crystal microbalance for immunosensors. Anal. Chem. 2006, 78, 6903–6909. [Google Scholar] [CrossRef] [PubMed]
- Volpe, L.S.; Ferrari, M.; Ferrari, V.; Arnau-Vives, A.; Perrot, H. Contactless confined readout of quartz crystal resonator sensors. In Proceedings of the 2005 IEEE Sensor, Irvine, CA, USA, 30 October–3 November 2005; pp. 457–460. [Google Scholar]
- Wu, W.; Greve, D.W.; Oppenheimer, I.J. Inductively coupled sensing using a quartz crystal microbalance. In Proceedings of the 2008 IEEE Ultrasonics Symposium, Beijing, China, 2–5 November 2008; pp. 1018–1021. [Google Scholar]
- Ferrari, M.; Baù, M.; Tonoli, E.; Ferrari, V. Piezoelectric resonant sensors with contactless interrogation for mass-sensitive and acoustic-load detection. Sens. Actuators A Phys. 2013, 202, 100–105. [Google Scholar] [CrossRef]
- Baù, M.; Tonoli, E.; Ferrari, V.; Marioli, D. Contactless electromagnetic switched interrogation of micromechanical cantilever resonators. Sens. Actuators A Phys. 2011, 172, 195–203. [Google Scholar] [CrossRef]
- Tonoli, E.; Baù, M.; Ferrari, V. Contactless Time-Gated Technique for Electromagnetic Interrogation of Micromechanical Resonator Sensors. Sens. Lett. 2013, 11, 294–298. [Google Scholar] [CrossRef]
- Jiang, H.; Chang, Z.; Pertijs, M.A.P. A 30 ppm < 80 nJ Ring-Down-Based Readout Circuit for Resonant Sensors. IEEE J. Solid State Circuits 2016, 51, 187–195. [Google Scholar]
- Ferrari, M.; Baù, M.; Pagnoni, M.; Ferrari, V. Compact DDS-Based System for Contactless Interrogation of Resonant Sensors Based on Time-Gated Technique. In Proceedings of the 2014 IEEE Sensors Conference, Valencia, Spain, 2–5 November 2014; pp. 907–910. [Google Scholar]
- Royer, D.; Dieulesaint, E. Piezoelectric transducers for bulk waves. In Elastic Waves in Solids; Springer: Berlin/Heidelberg, Germany, 2000; pp. 6–30. [Google Scholar]
- Ferrari, M.; Baù, M.; Masud, M.; Ferrari, V. A Time-Gated Contactless Interrogation System for Frequency and Quality Factor Tracking in QCR to Investigate on Liquid Solution Microdroplets. Procedia Eng. 2016, 168, 704–707. [Google Scholar] [CrossRef]
Figure 1.
Simplified diagram of the contactless gated interrogation system.
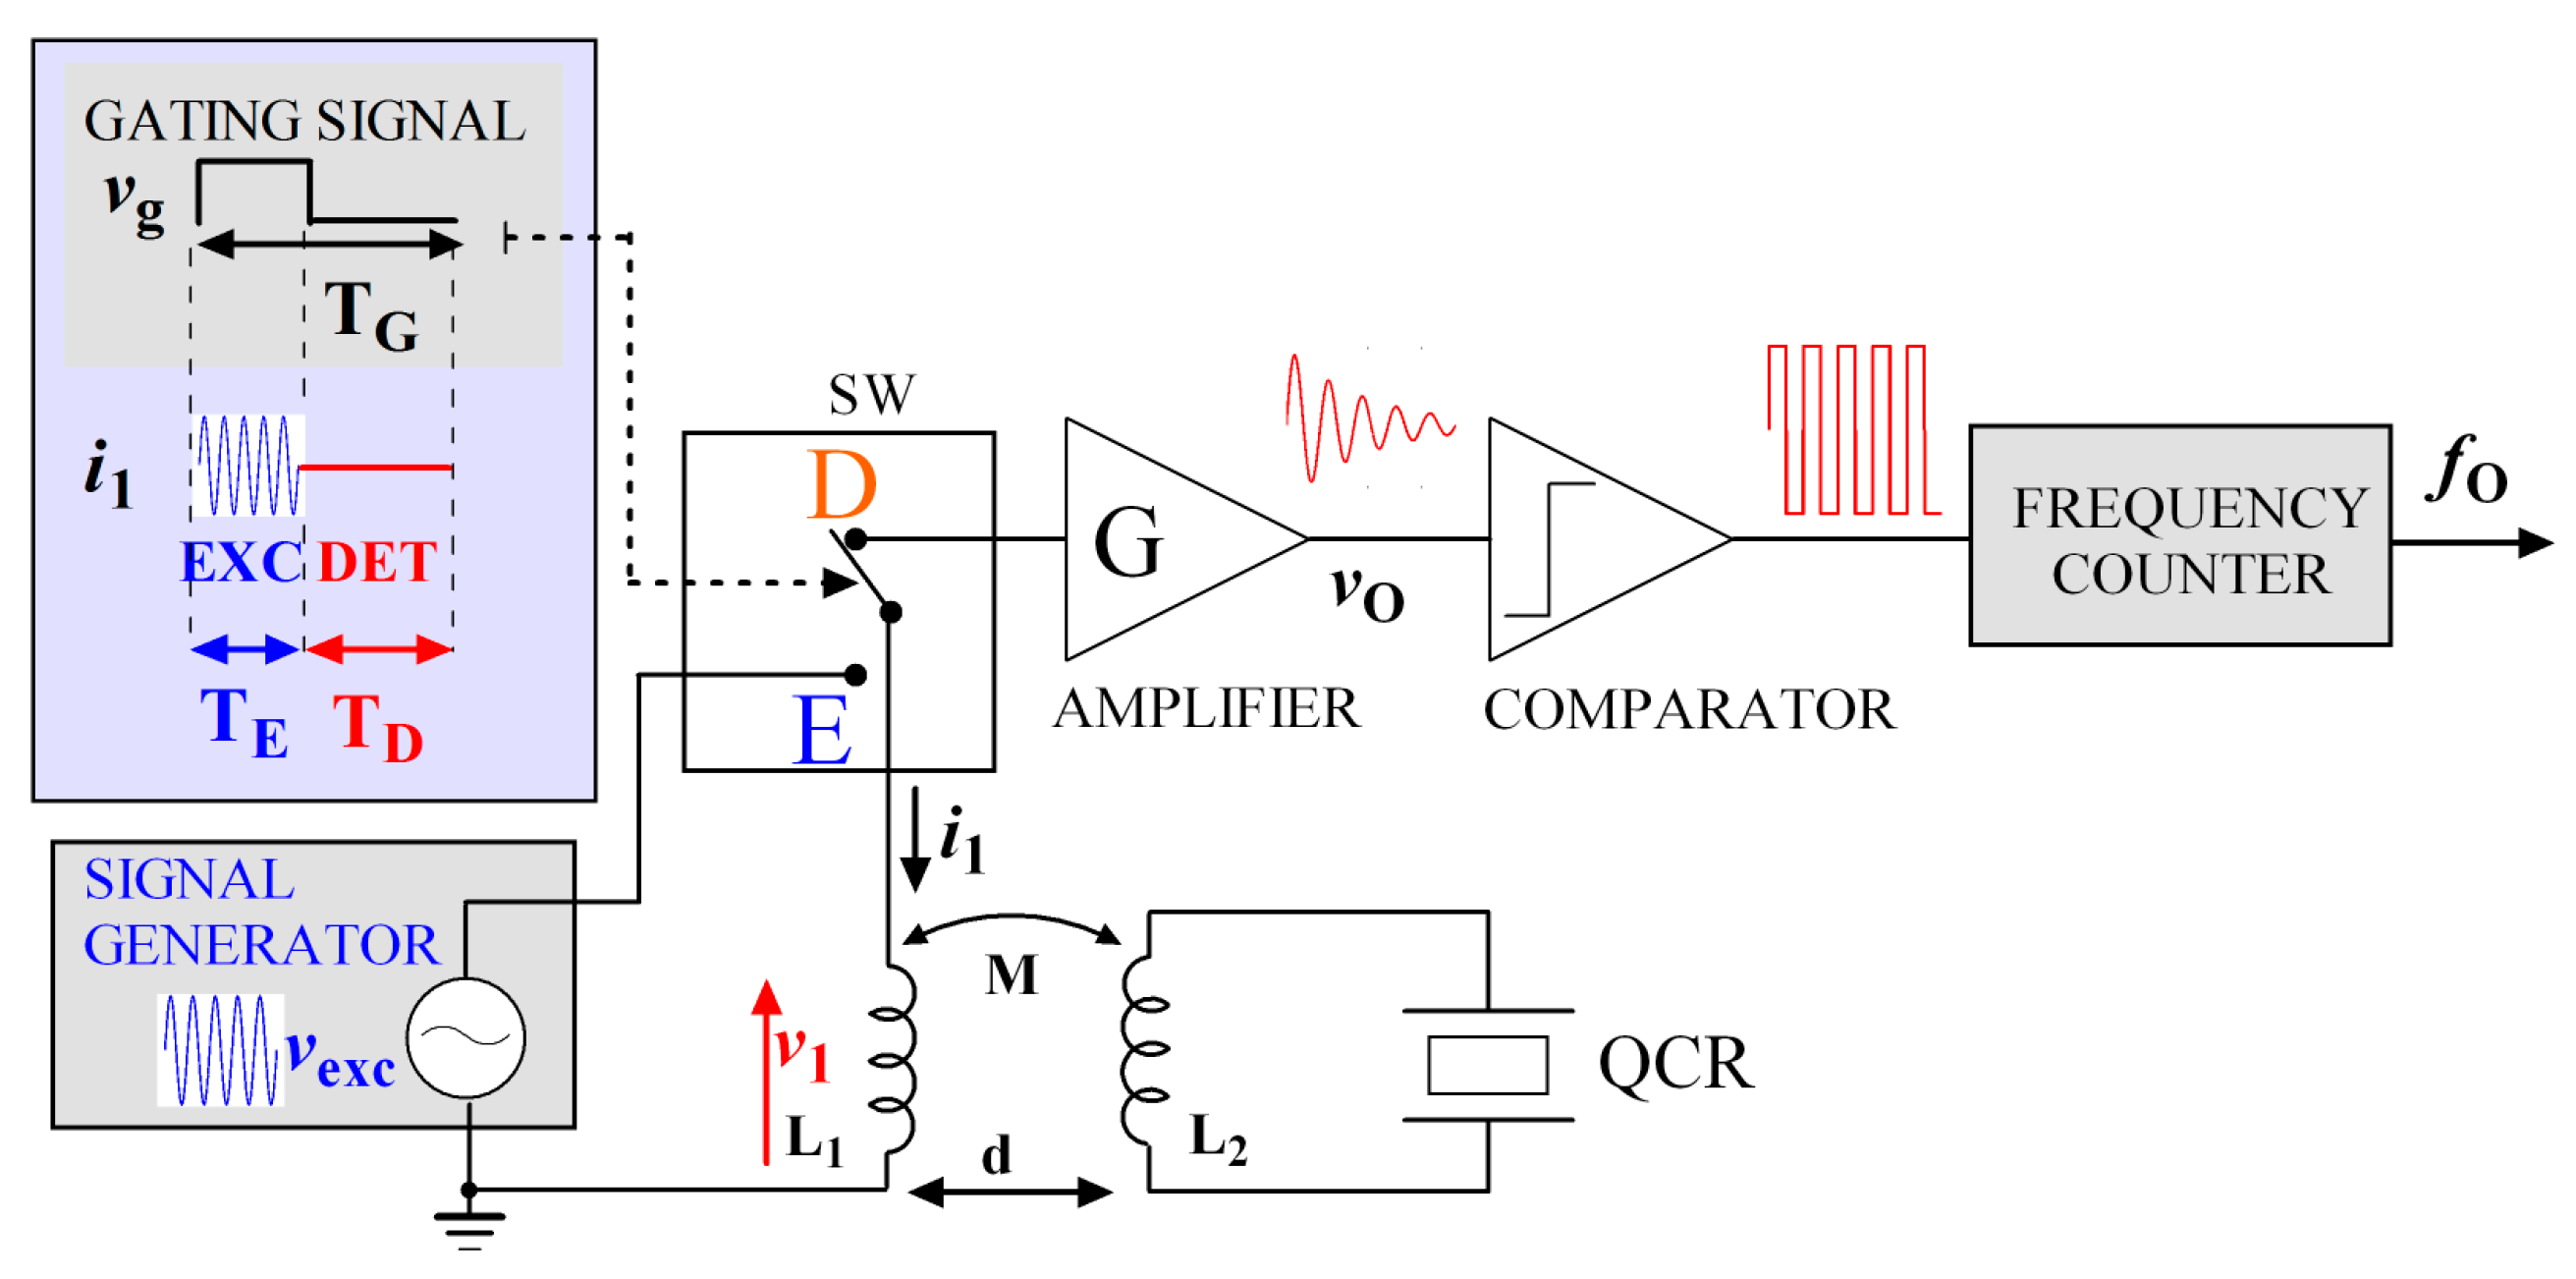
Figure 2.
Lumped-element Butterworth-van Dyke (BVD) model of the quartz crystal resonator (QCR) sensor into the equivalent circuit of the interrogation system during the detection phase.
Figure 2.
Lumped-element Butterworth-van Dyke (BVD) model of the quartz crystal resonator (QCR) sensor into the equivalent circuit of the interrogation system during the detection phase.

Figure 3.
(a) Comparison of fdm computed from Equation (4b) and the expressions of fmu from Equations (6a) and (7a); (b) Comparison of fde computed from Equation (4b) and the expressions of feu from Equations (6b) and (7b).
Figure 3.
(a) Comparison of fdm computed from Equation (4b) and the expressions of fmu from Equations (6a) and (7a); (b) Comparison of fde computed from Equation (4b) and the expressions of feu from Equations (6b) and (7b).

Figure 4.
Attenuation constants αm and αe versus L2 computed from the numerical solution of D(s) = 0 as per Equation (4b).
Figure 4.
Attenuation constants αm and αe versus L2 computed from the numerical solution of D(s) = 0 as per Equation (4b).
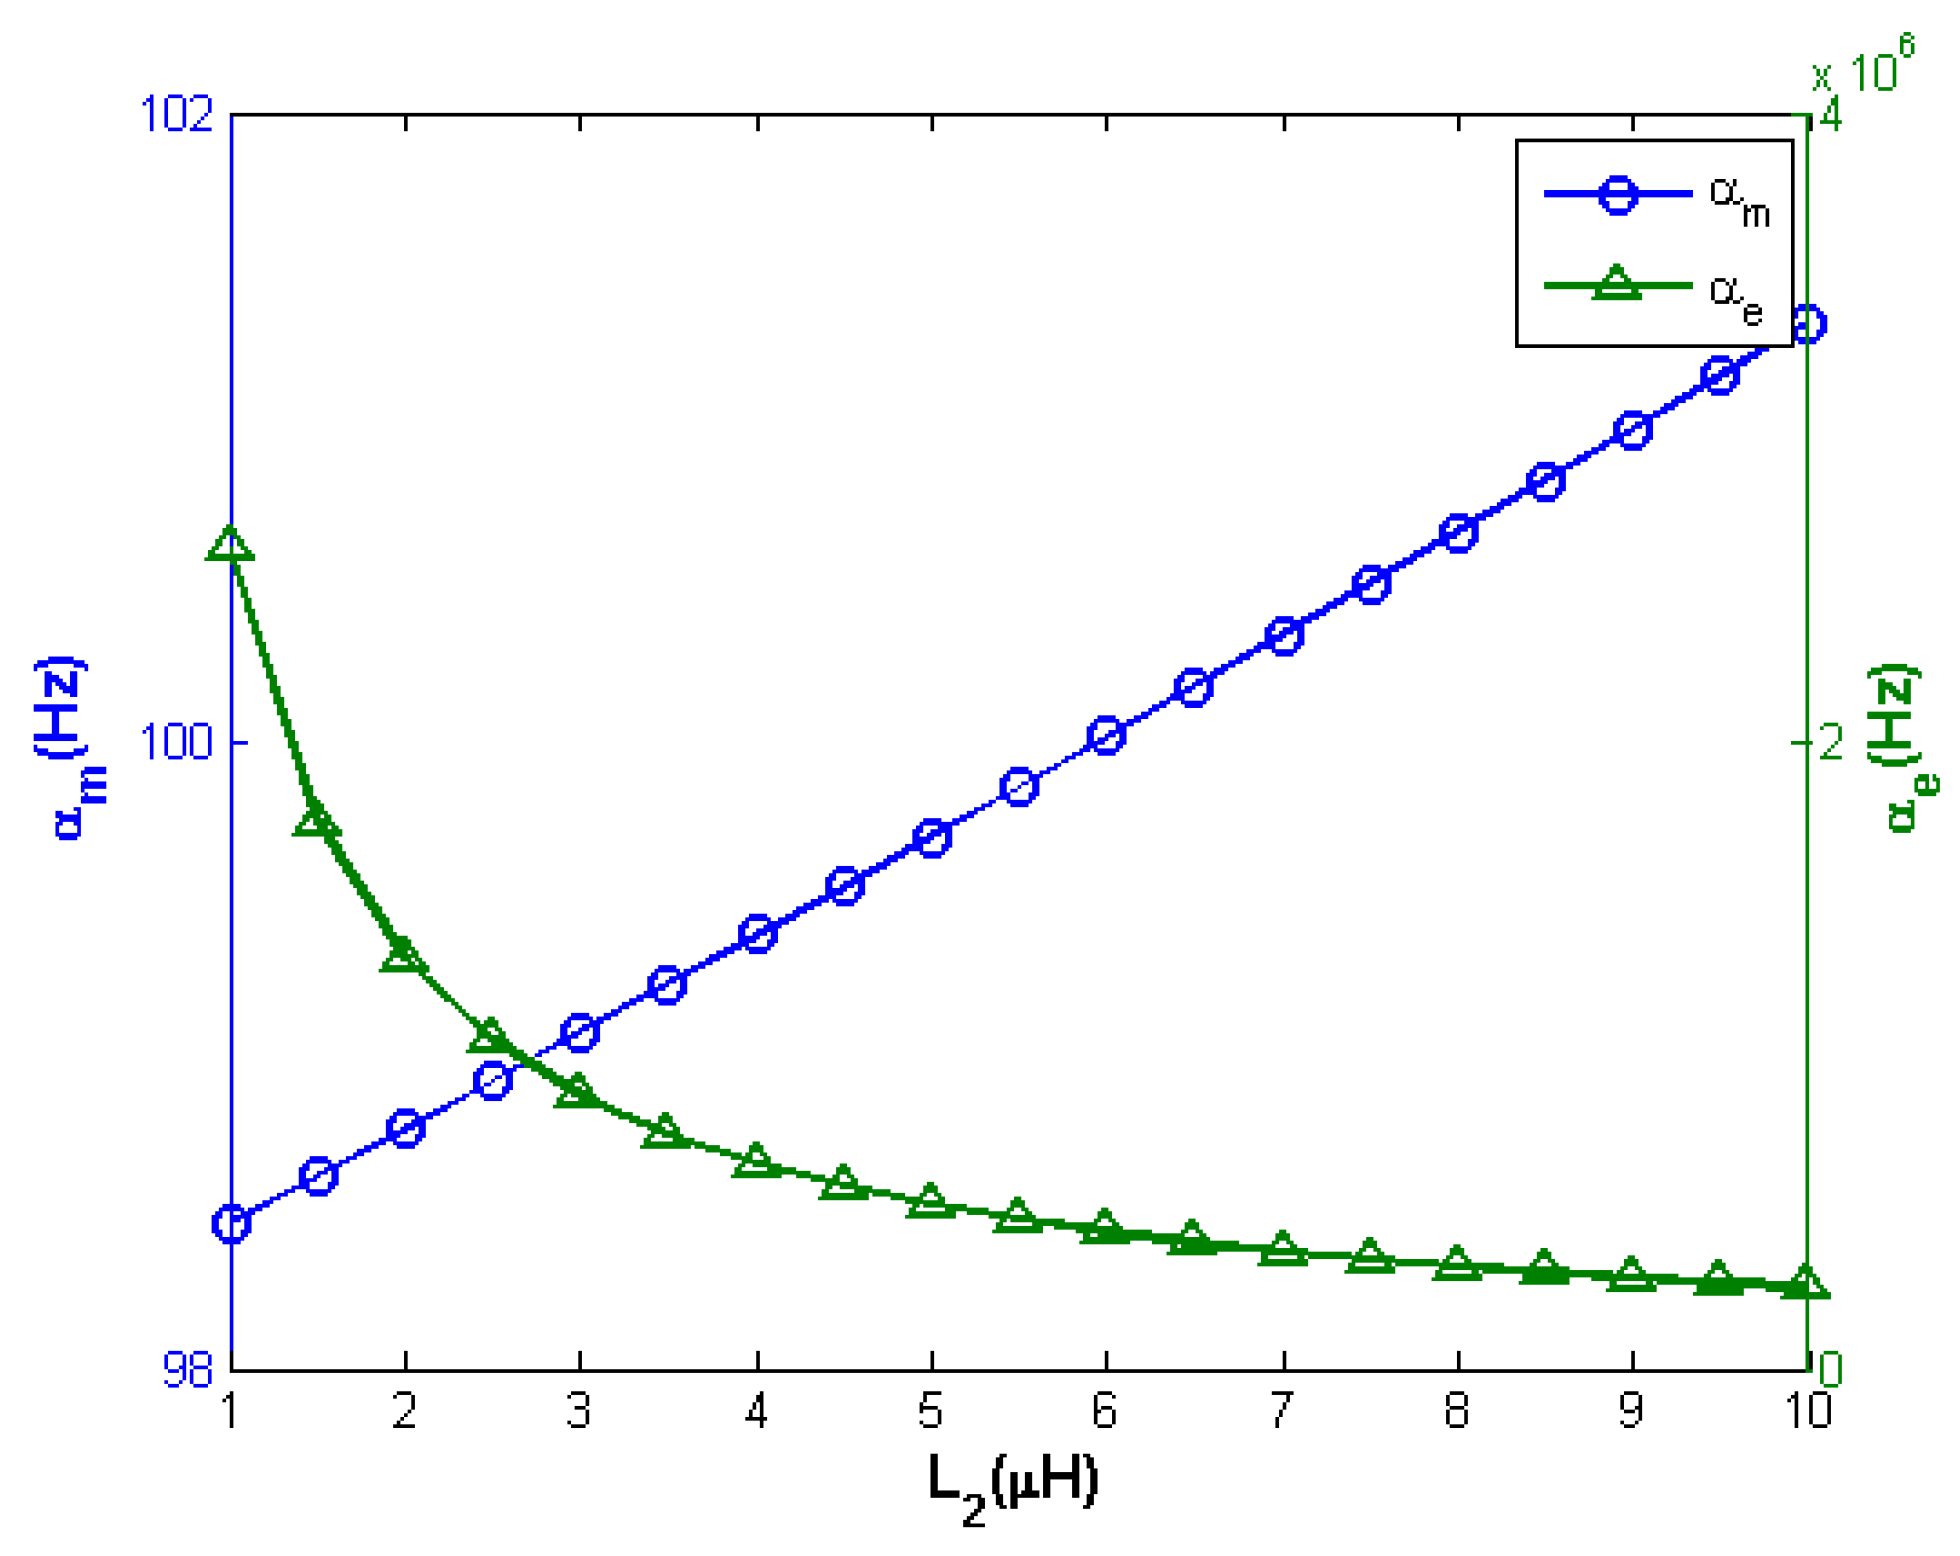
Figure 5.
Measured impedance diagrams of the reference QCR.

Figure 6.
Schematic of the circuit for the time-gated interrogation of the QCR sensors.

Figure 7.
Measured readout voltage vo versus time during the detection phase. From the exponential decaying envelope of the readout voltage, the quality factor of the electrically loaded quartz resonator sensor can be estimated.
Figure 7.
Measured readout voltage vo versus time during the detection phase. From the exponential decaying envelope of the readout voltage, the quality factor of the electrically loaded quartz resonator sensor can be estimated.

Figure 8.
Measured readout frequency fo and voltage amplitude for different values of the interrogation distance d.
Figure 8.
Measured readout frequency fo and voltage amplitude for different values of the interrogation distance d.

Figure 9.
Measured readout frequency fo and predicted frequency for different values of the inductance L2 of the secondary coil.
Figure 9.
Measured readout frequency fo and predicted frequency for different values of the inductance L2 of the secondary coil.
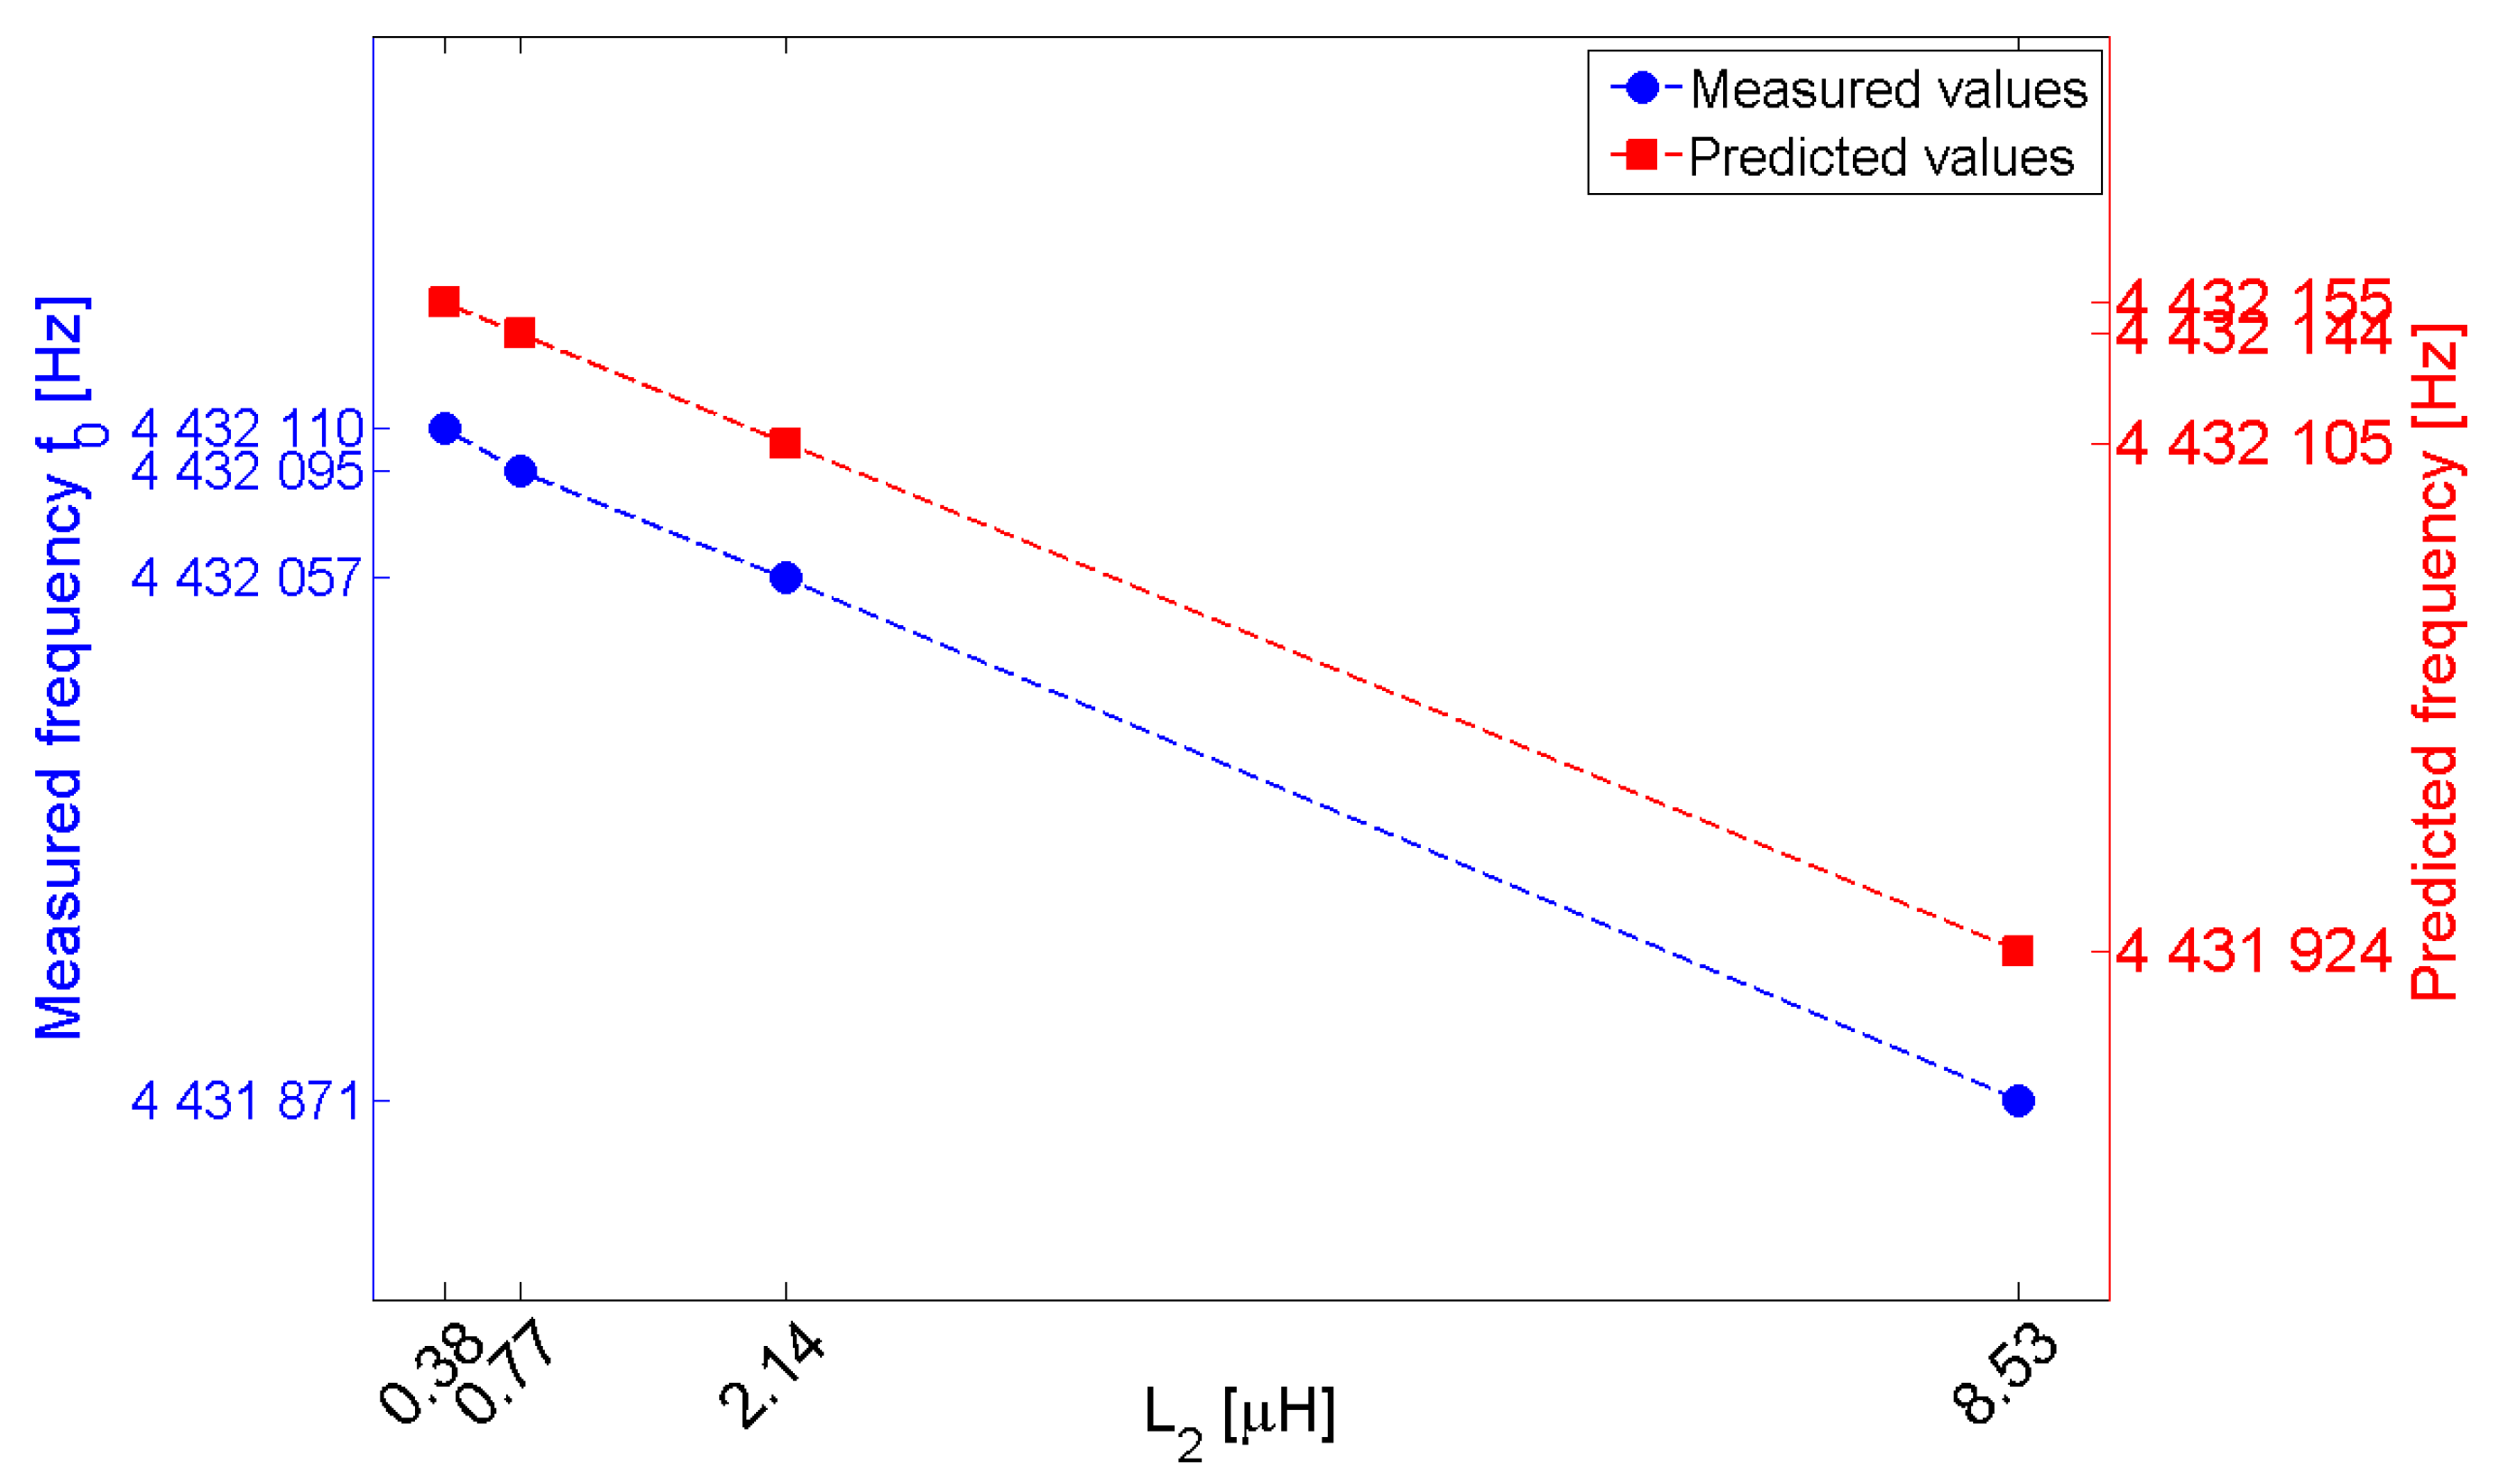
Figure 10.
Measured readout frequency fo for different values of the inductance L1 of the primary coil.
Figure 10.
Measured readout frequency fo for different values of the inductance L1 of the primary coil.

Figure 11.
Experimental setup for the liquid solution microdroplet measurements. On the left a detailed view of the microdispenser.
Figure 11.
Experimental setup for the liquid solution microdroplet measurements. On the left a detailed view of the microdispenser.

Figure 12.
Frequency shift Δfdm of the output signal vo relative to a sequence of consecutive 500-droplet depositions Dn of solution of sugar in water (c = 0.25 wt %).
Figure 12.
Frequency shift Δfdm of the output signal vo relative to a sequence of consecutive 500-droplet depositions Dn of solution of sugar in water (c = 0.25 wt %).

Figure 13.
(a) Steady-state frequency shift Δfdry as a function of the mass of sugar mfilm deposited (dry phase); (b) Steady-state frequency shift Δfwet as a function of sugar concentration cs (wet phase).
Figure 13.
(a) Steady-state frequency shift Δfdry as a function of the mass of sugar mfilm deposited (dry phase); (b) Steady-state frequency shift Δfwet as a function of sugar concentration cs (wet phase).

© 2017 by the authors. Licensee MDPI, Basel, Switzerland. This article is an open access article distributed under the terms and conditions of the Creative Commons Attribution (CC BY) license (http://creativecommons.org/licenses/by/4.0/).
Share and Cite
MDPI and ACS Style
Baù, M.; Ferrari, M.; Ferrari, V. Analysis and Validation of Contactless Time-Gated Interrogation Technique for Quartz Resonator Sensors. Sensors 2017, 17, 1264. https://doi.org/10.3390/s17061264
AMA Style
Baù M, Ferrari M, Ferrari V. Analysis and Validation of Contactless Time-Gated Interrogation Technique for Quartz Resonator Sensors. Sensors. 2017; 17(6):1264. https://doi.org/10.3390/s17061264
Chicago/Turabian StyleBaù, Marco, Marco Ferrari, and Vittorio Ferrari. 2017. "Analysis and Validation of Contactless Time-Gated Interrogation Technique for Quartz Resonator Sensors" Sensors 17, no. 6: 1264. https://doi.org/10.3390/s17061264
Note that from the first issue of 2016, this journal uses article numbers instead of page numbers. See further details here.