
Identification of Chinese Herbal Medicines with Electronic Nose Technology: Applications and Challenges

1
School of Information Engineering, Guangdong University of Technology, Guangzhou 510006, China
2
College of Medical Information Engineering, Guangdong Pharmaceutical University, Guangzhou 510006, China
3
School of Engineering, Computer and Mathematical Sciences, Auckland University of Technology, Private Bag 92006, Auckland 1142, New Zealand
4
College of Traditional Chinese Medicine, Guangdong Pharmaceutical University, Guangzhou 510006, China
*
Author to whom correspondence should be addressed.
Sensors 2017, 17(5), 1073; https://doi.org/10.3390/s17051073
Submission received: 30 March 2017
/
Revised: 3 May 2017
/
Accepted: 3 May 2017
/
Published: 9 May 2017
(This article belongs to the Special Issue Materials and Applications for Sensors and Transducers)
Abstract
:This paper provides a review of the most recent works in machine olfaction as applied to the identification of Chinese Herbal Medicines (CHMs). Due to the wide variety of CHMs, the complexity of growing sources and the diverse specifications of herb components, the quality control of CHMs is a challenging issue. Much research has demonstrated that an electronic nose (E-nose) as an advanced machine olfaction system, can overcome this challenge through identification of the complex odors of CHMs. E-nose technology, with better usability, high sensitivity, real-time detection and non-destructive features has shown better performance in comparison with other analytical techniques such as gas chromatography-mass spectrometry (GC-MS). Although there has been immense development of E-nose techniques in other applications, there are limited reports on the application of E-noses for the quality control of CHMs. The aim of current study is to review practical implementation and advantages of E-noses for robust and effective odor identification of CHMs. It covers the use of E-nose technology to study the effects of growing regions, identification methods, production procedures and storage time on CHMs. Moreover, the challenges and applications of E-nose for CHM identification are investigated. Based on the advancement in E-nose technology, odor may become a new quantitative index for quality control of CHMs and drug discovery. It was also found that more research could be done in the area of odor standardization and odor reproduction for remote sensing.
1. Introduction
As the basis of traditional Chinese medicine, Chinese Herbal Medicines (CHMs) have been used for the treatment and prevention of human diseases for thousands of years in China. A unique systematic approach towards the use of CHMs has been developed through long-term practice and CHMs have shown excellent medical effectiveness with minimal side effects [1,2]. Furthermore, the important role of CHMs in the prevention and treatment of many epidemic, chronic and infectious diseases has been widely demonstrated and recognized by the international community [1]. The latest statistics reveal that the number of kinds of CHMs is more than 12,800 [3]. In 2014, there were 3813 Chinese medicine production enterprises, with revenue of up to 730,200 million Yuan and distribution in 183 countries and regions [4,5]. However, due to the wide variety, complex sources and diverse specifications of the herb components of CHMs, occurrences of fake and poor quality products have emerged in the CHMs market. This has seriously restricted the use of CHMs and the related international market [6]. Therefore, the study of effective methods for quality control of CHMs has become an urgent issue.
Odor is one of the most important properties of CHMs. Many CHMs such as Citrus reticulata Blanco (Chenpi) or Alpinia officinarum Hance (Gaoliangjiang) have different strong odors coming from their respective volatile components, and moreover, the same kind of CHM can release distinct odors due to different quality, growing region or storage time [4,7]. Many researchers have investigated methods for assessing quality of CHMs based on odor of their volatile components [6,8]. Zhang [9] reported that smell is an important evaluation index in traditional quality evaluation of CHMs. The smell of CHMs is directly related to their chemical composition, which is the interface between the external characteristics and intrinsic quality of CHMs. For example, raw Amomum villosum Lour. (Sharen) has a strong aromatic smell, indicating its good quality and excellent effect in its associated medical treatment. A change of smell indicates that the quality of Amomum villosum Lour. is also changed [6,10].
The identification of CHMs has traditionally been based on methods such as physico-chemical analysis, gas chromatography-mass spectrometry (GC-MS) technology, spectroscopic techniques and microscopic methods. These methods are complicated, time-consuming and costly, and generally they cannot satisfy the increasing requirements for the real-time detection and identification. Furthermore, the human olfactory system, as a smell assessment instrument, is subjective, with low accuracy and limited functionality [11]. Consequently, there is a considerable need for an instrument that can mimic the human nose to identify different kinds of CHMs, and make the identification more objective and accurate. The electronic nose (E-nose) is an instrument mimicking the sense of smell for detecting and identifying complex odors by using an array of embedded gas sensors [12,13,14]. When the sensor array is influenced by an odor stimulus, it generates a smell print, which is the response of the sensor array and represents an electronic fingerprint characteristic of each sample [13]. These smell prints form a recognition pattern for qualitative analysis using an appropriate multivariate tool. The E-nose with real-time information processing characteristics greatly facilitates fast monitoring of volatile components of diverse molecular structure [15,16,17,18].
2. Design of the Study
Recent journal papers mainly published since 2011 were selected for this review. We chose some keywords like E-nose, electronic nose, olfaction technology, identification of Chinese Herbal Medicines and odor detection to search for the related journal papers in the Google Scholar, China National Knowledge Internet (CNKI), IEEE Xplore, ScienceDirect and SpringerLink databases. We thus found about 19,400 papers. We then limited the number of papers to 126 based on the following criteria: Duplicate articles were eliminated and some additional records were excluded after reviewing the individual titles and abstracts. Next, we reviewed the included studies and evaluated the full-text articles (journal articles and conference proceedings) for eligibility. We excluded those articles that were not considered original research, such as letters to the editor and comments. Because this review paper is focused on the application of E-noses for identification of CHMs, we excluded studies that solely employed physico-chemical characteristics or microscopic observation for the identification of CHMs.
3. Electronic Nose (E-Nose)
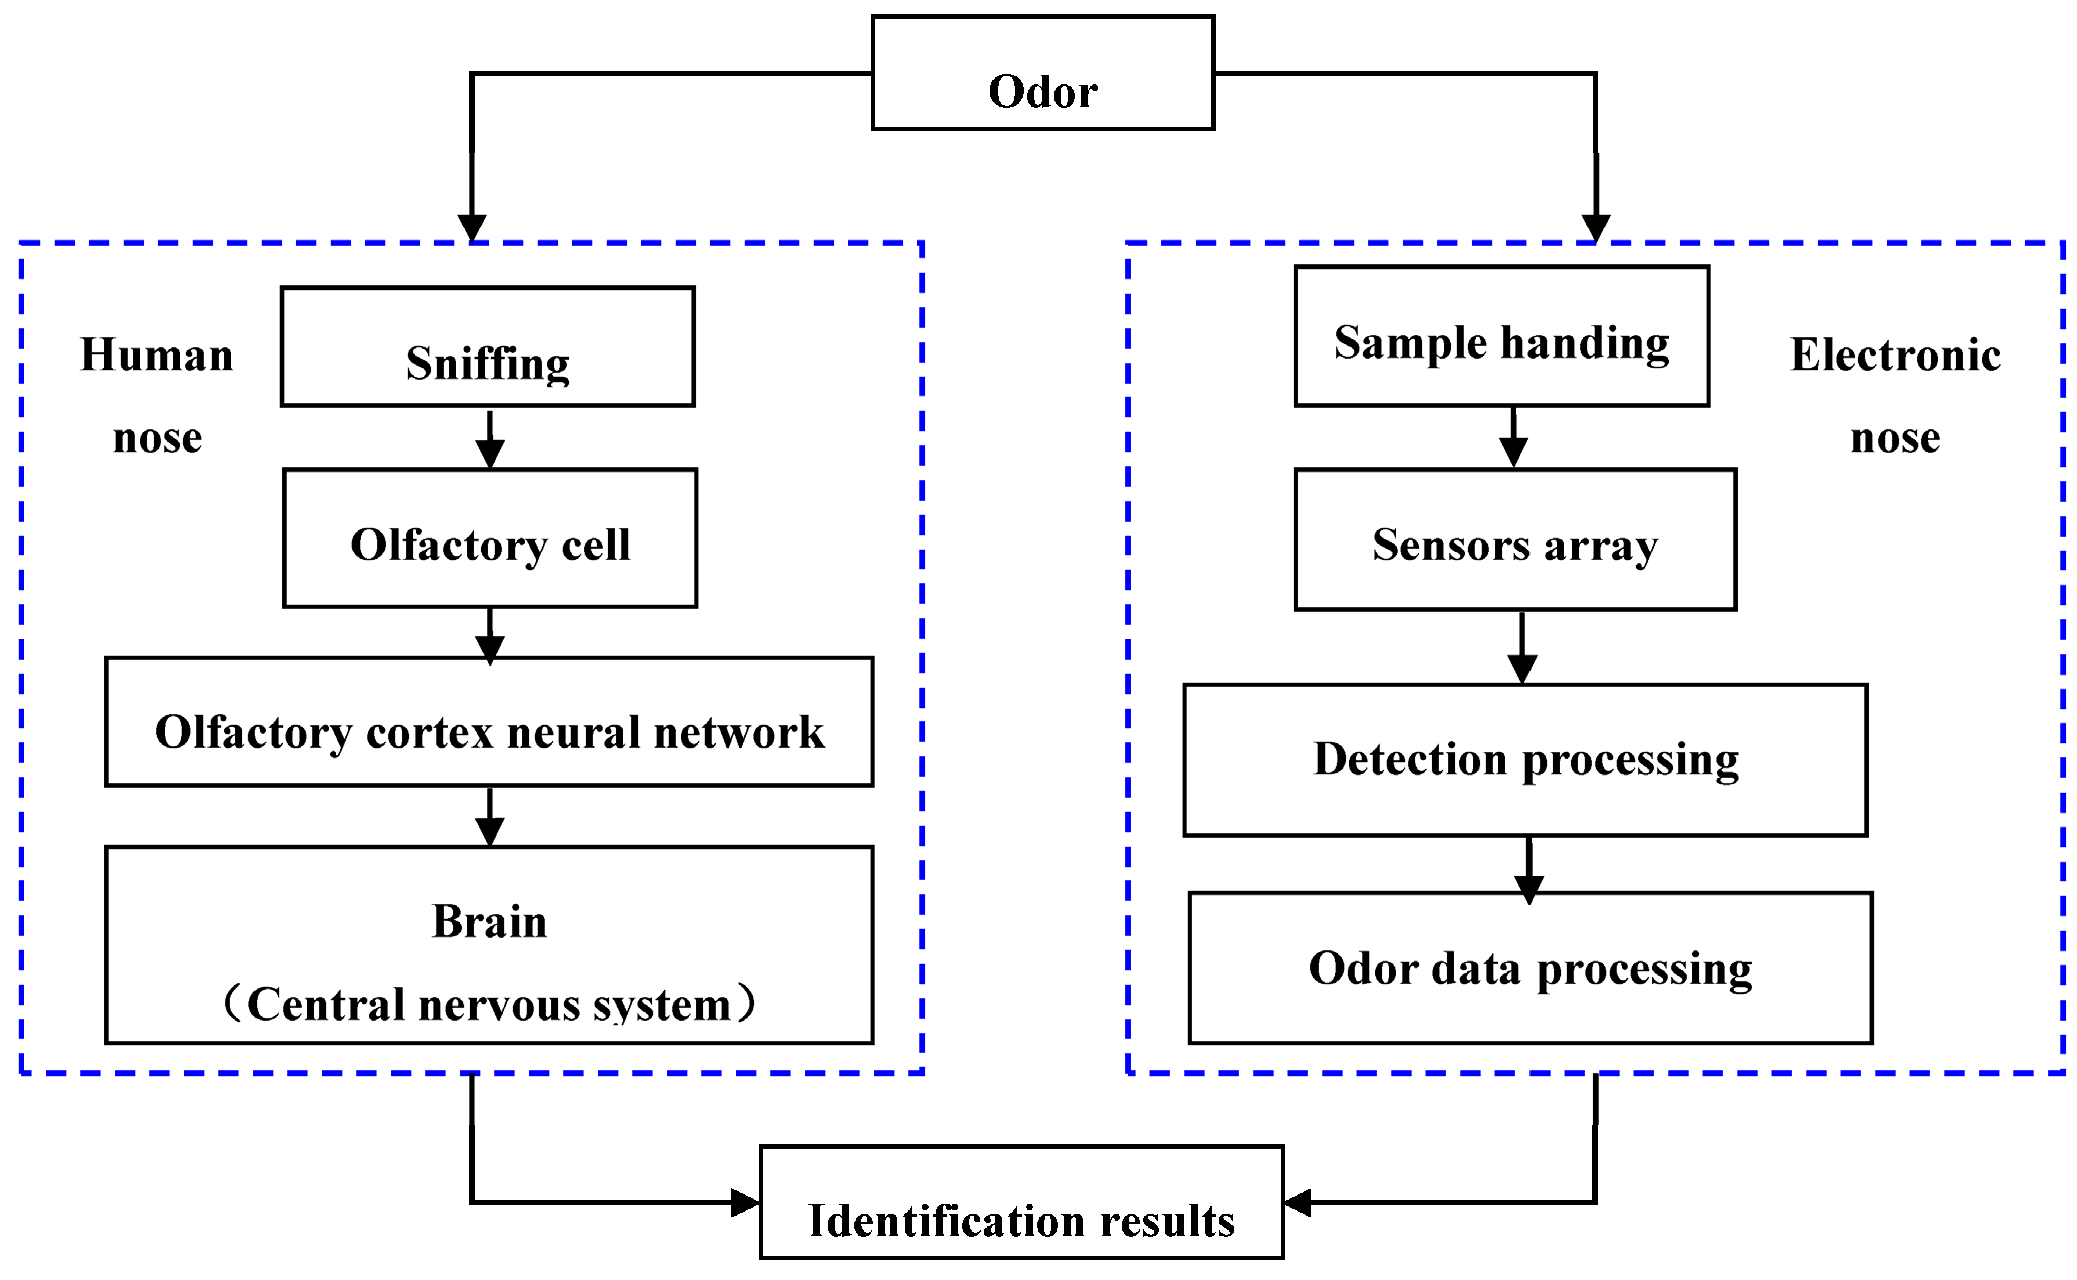
The E-nose, as a machine olfaction system, can mimic the human nose and perform complex pattern recognition like the human olfactory system. It is composed of three parts: (1) a sample handling system; (2) a detection system that is made up of an array of gas sensors with partial specificity; and (3) an odor data processing system [16,19]. A comparison of the E-nose and the human nose with respect to their main functional blocks is shown in Figure 1. The E-nose instrument can detect the presence of VOCs of diverse molecular structures with high accuracy and reliability regardless if it smells more or less. Furthermore, the E-nose may accomplish qualitative and quantitative analysis of odor samples [20,21]. Compared to traditional odor analysis methods, such as GC-MS and Fourier transform infrared (FT-IR) spectrometry, E-nose is an easy built system that possesses simple sample pretreatment, non-destructive features, relatively fast assessment detection, a wide odor operating range, and generally high sensitivity and selectivity to the tested odorants. Therefore, E-noses have been widely used in medicine and health care [22,23,24,25], agriculture and food products [18,20,26,27,28,29,30,31,32,33,34,35], public security [36] and environmental monitoring [16,17]. Since 1993, the number of publications in the area of electronic olfaction has reached a record of more than 12,000 articles [13]. However, reports or publications on the application of E-nose systems in quality control of CHMs have been limited [1,7]. Table 1 provides a list of E-nose models for commercial and non-commercial applications [13].
3.1. Sample Handling System
Sample handling to transfer volatile aromatic molecules from the source to the E-nose sensor array is a critical step that affects the data analysis performance of an E-nose [37]. Before sample detection, some parameters, such as sample temperature, equilibration time, vial size and sample quantity should to be optimized [13]. In addition, due to the poor repeatability of the manual headspace injection of an E-nose system, an automatic headspace sampler is usually applied. Thus the smell of volatile components is transferred to the sensor array by a constant flow of an inert gas. In order to ensure the smell of volatile components of the sample present in the headspace flow into the sensor array at a steady speed, some common sampling methods such as static headspace (SHS), purge and trap (P&T) and dynamic headspace (DHS), solid-phase micro-extraction (SPME), stir bar sorptive extraction (SBSE) and inside-needle dynamic extraction (INDEX) are used [38,39].
3.2. Detection System—Gas Sensor Array
The main part of the E-nose detection system is the gas sensor array, which is composed of a number of sensors with a broad spectrum of response characteristics and large cross sensitivity to different gases. These gas sensors can convert gas concentrations into electrical signals, which are essential components of an E-nose to accomplish the qualitative or quantitative analysis of the monitored samples. The key design criteria are to select a suitable gas sensor array to improve the performance of the E-nose system in monitoring the selected samples [37]. As shown in Table 2 [16,27], there are several commonly used gas sensors. Among them, MOS and CP are considered as the most popular sensors due to their low cost, fast response, high sensitivity and ability to detect a large number of gases [13,40,41].
Currently, researchers have shown more interest in studying novel gas sensors composed of new materials, such as olfactory receptors of animals, organic field-effect transistors, molecularly imprinted polymers and nanomaterials [40,48,49,50]. For example, in a bioelectronic nose, the sensitive materials are usually made of animal olfactory receptor, cell or tissue. Volatile chemicals are detected and identified using optical, electrochemical and acoustic wave detection devices due to their advanced rapid response time, high sensitivity and good selectivity features. Liu [51] designed a bionic E-nose using chemical receptor protein Ac-ASP3 of bee as the sensitive material to detect and identify different concentrations of ligand molecules (isoamyl acetate). The results show that the bionic E-nose can accomplish quantitative analysis of volatile compounds [52,53]. However, bioelectronic noses have some disadvantages such as short lifetime, poor repeatability and difficult mass production process [42,43].
During the past decade, field-effect transistors (FETs) have been successfully used in modern electronics, computers and hand-held devices. Organic field-effect transistor (OFET)-based gas sensors have also attracted great interest due to their high selectivity, repeatable response and low-cost production [54]. Ayadi [46] proposed a novel technique to investigate gas sensitivity of materials for implementation in FET-based gas sensors. It was found that the surface charge induced by gas species adsorption, allows the estimation of maximum surface charge variation, which corresponds to the saturation of all possible adsorption sites. In particular, high-performance FET-based sensor integration with nanomaterials has demonstrated great prospects in sensing applications [54,55].
3.3. Data Processing System
3.3.1. Odor Signal Pretreatment
The initial odor response of a gas sensor array often contains interference or noise. In order to reduce the complexity of the data processing, it is necessary to carry out signal denoising, filtering, data compression and normalization [56,57,58]. After the odor response has been smoothed, drift compensated, and outliers eliminated, the machine olfactory system then uses multivariate statistical signal processing methods to establish a characteristic odor pattern and form a characteristic odor map.
According to the characteristics of the output signal of the gas sensor array, different signal processing methods are adopted to improve the accuracy and linearity of the E-nose measurement. The purpose of the pretreatment is to extract relevant information and prepare the signal for the subsequent multivariate pattern recognition. Commonly used signal preprocessing techniques include baseline processing, data compression (feature selection or extraction) and normalization [11,59,60,61]. Some methods for baseline correction are listed in Table 3 and methods for data transformation are listed in Table 4.
Odor signal pretreatment has a great influence on the performance of an E-nose, as it not only reduces noise, complexity and recognition errors, but also improves the E-nose identification performance. At the same time, odor signal pretreatment also provides a standard odor data set for subsequent pattern recognition in the E-nose.
3.3.2. Feature Extraction
When the multivariate odor information is obtained by the sensor array, the odor data used as electronic fingerprints of the volatile components of CHMs, may contain irrelevant or redundant features [62]. Feature extraction techniques are intended to cope with the redundancy problem by selecting a subset of features that can facilitate data interpretation while reducing data storage requirements and improving prediction performance [63,64,65,66,67].
The commonly used feature extraction methods like independent component analysis (ICA), principal component analysis (PCA), linear discriminant analysis (LDA) and manifold learning (ML) are regarded as the most fundamental and powerful tools [68,69,70,71]. During the feature extraction (or selection), a smaller size of feature data preserving most of information in the raw data is extracted. The selected feature subset is considered as the “optimal” subset of features [72,73,74]. In this phase, the basic principle is to maximize the odor information contained in the new feature vector [75]. The feature extraction step, also called data dimensionality reduction, is essential to the performance of the subsequent classification stage.
3.3.3. Pattern Recognition
After the feature extraction step and formation of an “optimal” subset of features, the second stage of data analysis system is pattern recognition. During this stage, a classifier can be designed to assign an unknown feature vector to one class from a previously trained set of feature vector labels. The classification results are visualized in the form of graphics, text, or tables. Moreover, the classification model is to be evaluated with additional data or validation dataset to estimate its accuracy [76,77,78].
Pattern recognition is a key part in the development of E-nose systems capable detecting, identifying or quantifying different volatile components. In the field of identification of CHMs, the selection of an appropriate pattern recognition method is crucial for the classification accuracy of an E-nose. The commonly used pattern recognition methods are usually divided into statistical pattern recognition and intelligent recognition modes [79,80,81]. These pattern recognition methods are summarized in Table 5 [82,83,84,85,86,87]. Among them, K-nearest Neighbor (KNN), Support Vector Machine (SVM) and Artificial Neural Network (ANN) are the most widely used.
4. E-Nose Applications in Identification of CHMs
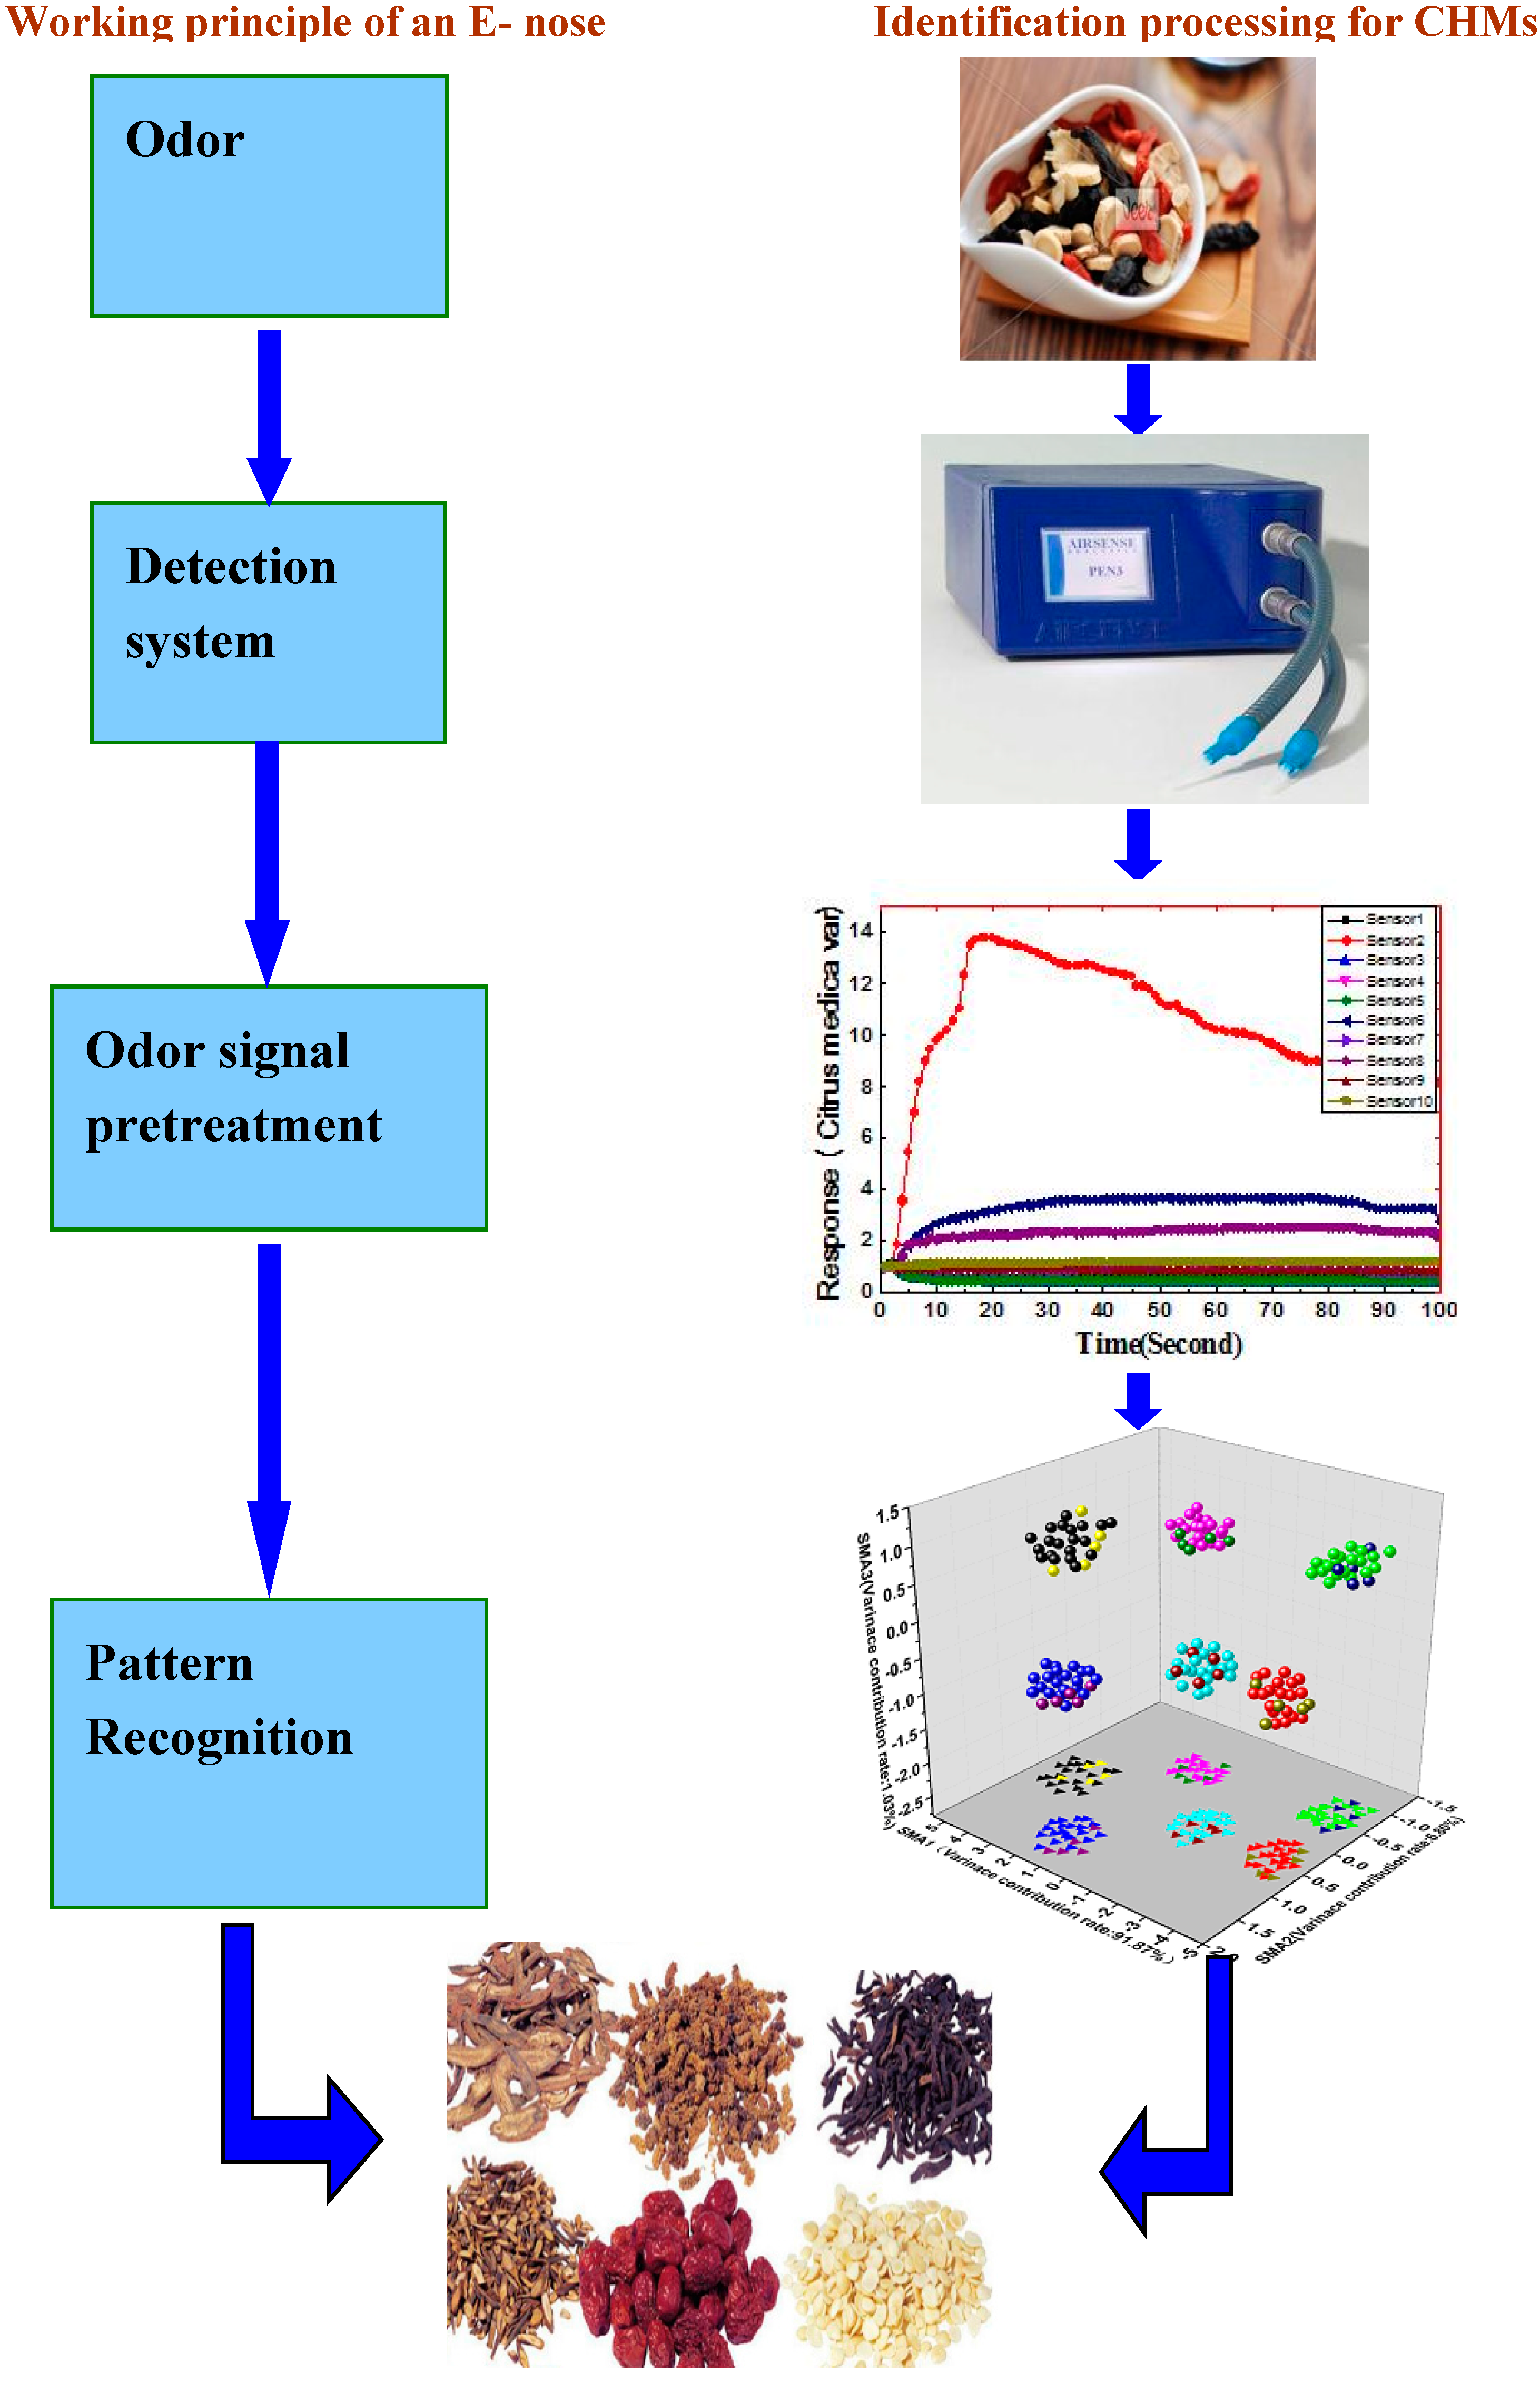
Recently, with the continuous development of sensor technology and the improvement of pattern recognition methods, E-nose system technology is developing rapidly, and its application fields are expanding, ranging from environmental monitoring to medical applications. However, in the field of quality control of CHMs, there are limited publications on the application of E-nose technology. Since 2010, the number of publications on identification of CHMs based on E-noses is about 50 articles [88,89]. This demonstrates that the applications in identification of CHMs based on E-noses have begun to raise attention among researchers. Figure 2 shows the working principle of an E-nose and the process of identification of CHMs. The major findings related to the application of E-nose systems for identification of CHMs are presented in Table 6. In this section we provide a short description of E-nose system applications in the field of identification of CHMs focusing on four aspects: species identification, processed products identification, regional identification and storage time identification.
4.1. Species Identification of CHMs
In the CHMs market, it is very difficult for ordinary people to distinguish between CHMs which are similar in appearance. Therefore, herb species identification is an important part of the quality control in the traditional Chinese medicine market. Odor is a very important evaluation index of CHMs. Only experienced pharmacists can identify many commonly used CHMs with special fragrant smells, according to their odor characteristics. E-nose systems can simulate the human and animal olfactory function, and "smell" the whole odor of the CHMs, and then establish scent fingerprints by extracting information about the volatile components of CHMs [90]. Thus, the purpose of identification of different Chinese medicinal materials and verification of the authenticity of the CHMs is achieved [91,92].
Since many Apiaceae plants with antimicrobial activities have similar characteristics, it is difficult to distinguish them from each other. Lin [93] studied Apiaceae plants using an E-nose system composed of a MOS array and identified different kinds of Apiaceae plants using multivariate statistical analyses. The results showed that the response values were positively related to the different kinds of Apiaceae plants. According to the smell differences among samples, ten different kinds of Apiaceae plants could be classified correctly and the identification rate of ten-fold cross validation was 94.71%. Another study was performed using a portable PEN3 E-nose (Airsense Analytics, Schwerin, Germany) with PCA and LDA analysis methods to discriminate seven kinds of CHMs, Illicium verum Hook. (Bajiaohuixiang), Amomi Fructus Rotundus (Doukou), Ligusticum chuanxiong hort. (Chuanxiong), Eugenia caryophyllata Thunb. (Dingxiang), Schizonepeta tenuifolia Briq. (Jingjie), Cinnamomum cassia Presl (Rougui), Amomum villosum Lour. (Sharen). In the PCA model, the cumulative variance contribution rate of the first two principal components was up to 99.338% and the first principal component variance contribution rate was 95.886%, while the the variance contribution rate of the second principal component was 3.452%; In the LDA model, the cumulative variance contribution rate of the first two principal components was 93.487% and the first principal variance contribution rate was 78.761%, while the variance contribution rate of the second principal axis was about 14.726%. At the same time, the predictive ability of the two models is evaluated by cross validation. The experimental results showed that the correct recognition rates were 96% and 98%, respectively [94]. Moreover, Amomum villosum Lour., Pogostemon cablin (Blanco) Benth. (Guanghuoxiang), Leonurus japonicus Houtt. (Yimucao), Houttuynia cordata Thunb. (Yuxingcao), Mentha haplocalyx Briq. (Bohe) and Bupleurum chinense DC. (Chaihu), the six kinds of typical CHMs in South of the Five Ridges were investigated using an E-nose system. According to the comparative study of odor fingerprints constructed based on the smell of the six CHMs, the number of common peaks and their values showed great differences. For example, the odor fingerprint of Mentha haplocalyx Briq. had 15 common peaks and the average value of these 15 common peaks was the largest, while the odor fingerprint of Bupleurum chinense DC. had only 11 common peaks and the average value of the 11 common peaks was the smallest. The research results showed that the E-nose system could “smell” the difference between the six kinds of samples and identify them [95].
4.2. Identification of Processed CHM Products
Raw CHMs and processed CHMs have different effects because of the changes of some components in the herbs during processing. Some processed CHMs, such as processed Corydalis yanhusuo W. T. Wang ex Z. Y. Su ex C. Y. Wu (Yanhusuo) and processed Cyperus rotundus Linn. (Xiangfu), have better effect for treating disease than the corresponding raw products. During processing, those ingredients having strong irritant properties and no discernable effect on the disease treatment can be removed, which makes the CHMs convenient to take for patients. Smell has thus also become an important factor to judge the quality of CHMs and distinguish between raw products and processed ones [96]. Shen [97] adopted an E-nose system to identify samples of natural Atractylodes macrocephala Koidz. (Baizhu) and processed Atractylodes macrocephala Koidz. PCA analysis was used to analyze the data, and the results showed that there was a significant difference in smell between the natural samples and the processed ones. Based on the analysis of odor fingerprints, the relative standard deviation (RSD) of the relative peak area of the common peaks were less than 1.2%, and the relative retention time of each peak was less than 1.1%, which showed that the method had good repeatability. In addition, the results were also confirmed by chemical composition analysis (using silicagel column chromatography). Xu [98] structured an E-nose system and differentiated four different samples of processed Coptis chinensis Franch. (Huanglian) based on the objective odor information combined with a statistical analysis method. The analyzed results showed that there were significant differences in odor characteristics among four different processed Coptis chinensis Franch. products. Furthermore, PCA analysis can more clearly distinguish the raw Coptis chinensis Franch. and different processed ones than the other three methods. At the same time, the initial discriminant rate and cross validation rate in PCA analysis were 100% and 94.4%, respectively. In this study, the different odor characteristics of raw Coptis chinensis Franch and processed Coptis chinensis Franch were identified by the E-nose system, combined with statistical analysis methods.
Huang [99] studied the raw and processed products of Areca catechu L. (Binglang), collected based on the color information by means of a color difference meter and odor information with the help of an E-nose system. He found that the characteristic color parameters and characteristic odor parameters, which were analyzed by employing PCA, LDA and ANN methods, were changed with the degree of stir frying of Areca catechu L,. This provides a new approach for the study of discrimination of processed CHM products.
4.3. Regional Identification of CHMs
Ecological and geographical factors, such as latitude, altitude, topography and geomorphology, affect the light, temperature, soil and precipitation and play a crucial role in the commercial growth of CHMs [100]. The same kind of CHM from different production areas may contain different volatile components, which affects the therapeutic effect of the CHM [101]. Fritillaria cirrhosa D. Don (Chuanbeimu) produced in Sichuan Province in China can moisten the lungs to stop coughs and is suitable for the treatment of cough Runfei and lung heat asthenia cough, whereas Fritillaria thunbergii Miq. (Zhebeimu) produced in Zhejiang Province in China has the effect of eliminating phlegm and Qingfei. It is suitable for the treatment of heat phlegm cough in patients [102]. Therefore, it is essential to identify CHMs according to their growing region. Using an E-nose system for such identification can be better and faster approach.
Li [103] studied the content and smell of Chinese Panax ginseng C.A. Mey. (Chinese Hongshen) and Korean Panax ginseng C.A. Mey. (Korean Renshen) by using an E-nose. He successfully identified these herbal medicines and confirmed the advantages of the E-nose system in such applications. In the three analysis methods used, the ten-fold cross validation rates were 96.12% for PCA, 97.56% for DFA and 92.39% for SIMCA. Chen [104] constructed an E-nose system to carry out the analysis of different Ligusticum chuanxiong hort. (Chuanxiong) samples coming from Aoping and Xudu in Sichuan. The results revealed that the volatile components of different grades of Ligusticum chuanxiong hort. from the same origin had similar properties, while the volatile ingredients of Ligusticum chuanxiong hort. From different growing areas had significant differences. The experimental results showed that the correct identification rate was 92.1% based on an E-nose system. Han’s research [105] showed that the combination of E-nose detection technology and chemical methods could be very sensitive for detecting the smell of white Chrysanthemummorifolium RaTnat. (Hangbaiju) from different regions. The cross validation rates were 94.38% for PCA and 91.46% for DFA. Zheng [106] studied a great number of batches of Mentha haplocalyx Briq. samples coming from Guangdong Province and Guangxi Province in China. He built odor fingerprints based on an E-nose system by using PCA and PLS models to analyze the odor information. The odor fingerprint of Mentha haplocalyx Briq. samples from Guangdong Province had 18 common peaks with an average value of 12.67, while Mentha haplocalyx Briq. from Guangxi Province had only 14 common peaks with an average value of 11.81. This proved that it was feasible to use scent fingerprint to distinguish between Mentha haplocalyx Briq. from different production areas. Zou [107] detected the odor of different kinds of Amomum villosum Lour. produced in different regions and also established their odor fingerprints based on an E-nose system. Among five selected analysis models, the performance of NBN was the best with an initial discriminant rate and cross validation rate of 98% and 95.2%, respectively. It confirmed that the MOS sensor array of an E-nose was able to identify different varieties of Amomum villosum Lour and also had the potential to analyze the chemical composition of Amomum villosum Lour. Lin’s [108] investigation of the odor response of Oxybaphus himalaicus Edgew. (XimalayaZimoli) showed that the odor of Oxybaphus himalaicus Edgew. from different areas was not the same. In this research, Discriminant Factorial Analysis (DFA), Hierarchical Cluster Analysis (HCA) and ANN methods were employed. The performance of ANN model was the best, and the initial discriminant rate and cross validation rate were 100% and 96.8%, respectively.
Wang [109] studied three kinds of CHMs—Saposhnikovia divaricata (Turcz.) Schischk. (Fangfeng), Bupleurum chinense DC. (Chaihu) and Angelica sinensis (Oliv.) Diels. (Danggui)—based on an E-nose system. The Saposhnikovia divaricata (Turcz.) Schischk. samples came from the Yunnan, Gansu and Henan provinces in China. The Bupleurum chinense DC. samples were from the Altai area, Mishima and Hailar, and the Angelica sinensis (Oliv.) Diels. samples came from Gansu Province and Yunnan Province. Three analysis models, PCA, SIMCA and DFA, were constructed and different feature extraction methods were also studied. The results revealed that the three kinds of CHMs could be effectively distinguished according to the odor characteristics of samples from different regions based on the three analysis models. A feature extraction method, based on the combination of the extreme value of the sensor response and the ratio between them, was the best of these models. In addition, the SIMCA model demonstrated more advantages than the other two in identification of the three CHMs. In SIMCA model, in identification of Angelica sinensis (Oliv.) Diels., the initial discriminant rate and ten-fold cross-validation rate were 96.6% and 95.2%, respectively. In the identification of Bupleurum Chinense DC., the initial discriminant rate and ten-fold cross-validation rate were 94.8% and 93.9%. In the identification of Saposhnikovia divaricata (Turcz.) Schischk., the initial discriminant rate and ten-fold cross-validation rate were 91.8% and 88.3%.
4.4. Storage Time Identification of CHMs
Almost all CHMs have certain seasonal and regional characteristics. After harvesting, CHMs may be dried and stored for some time. The storage time may have a significant impact on the odor of CHMs. During the storage, the volatile components in many CHMs will gradually evaporate and the odor will change a lot. These changes affect the quality of the CHMs and may reduce the effectiveness of treatment [110,111]. For example, Rheum officinale Baill. (Dahuang) can lose 20~30% of the active ingredient if stored for more than a year, and if Rheum officinale Baill. is stored for more than five years, all of the active ingredient will be lost [112,113]. However, in the case of other CHMs, such as Citrus reticulata Blanco (Chenpi) and Asini Corii Colla (Ejiao), in order to achieve the better treatment effect, the herbs need to be stored for more than five years [113].
Therefore, in order to accurately identify the quality of CHMs, it is necessary to identify the storage time of CHMs according to the odor information using an E-nose system [113,114]. Wu [115] employed an E-nose system to identify different harvest periods of Amomum villosum Lour.s and distinguish their storage time (1 year and 2 years) based on the characteristic odor. Some analysis methods, PCA, LDA and PCA + LDA were employed to analyze the data. In PCA + LDA analysis model, PCA was used to select the odor feature subset and LDA was used for analyze and identification. The fitting correlation coefficients (R2) and root mean square error (RMSE) were calculated and treated as the criteria to evaluate the performance of these three models. The final results indicated that the identification performance of PCA + LDA (R2 = 0.9472, RMSE = 0.7618) was better than PCA (R2 = 0.9262, RMSE=0.8238) and LDA (R2 = 0.9086, RMSE = 0.8952). Zou [116] detected the odor of Panax quinquefolium L. (Xiyangshen) after different storage times (one year and three years) and established a discrimination model based on an E-nose. The performance of the proposed model was evaluated by ten-fold cross validation and external test sets while the sensor array was optimized by stepwise discriminant analysis. The identification rate of 89.76% with ten-fold cross validation demonstrated that the E-nose system could successfully identify Panax quinquefolium L. samples with different storage times. In Table 6, a summary of reviewed articles related to the application of E-nose systems for identification and classification of CHMs is presented.
5. Discussion: Challenges and Future Perspectives
5.1. Challenges
5.1.1. Qualitative Analysis of VOCs in CHMs
In this paper, we have outlined major contributions of E-nose technologies as applied to the identification of CHMs by reviewing the most related and recent published articles (Table 6). As a result of this literature review, we have found that each paper focuses on a particular aspect of E-nose as applied to the identification of CHMs. Most of the publications present limited feasibility studies with poor validation, especially in terms of reproducibility and predictability [117,118]. Moreover, most of the reported results are based on limited experiments without proposing a specific identification process in the field of CHMs. While, the applications of E-nose technology in food, environmental monitoring, security and clinical diagnostics has been growing fast, on the other hand, in the field of CHMs, the applications of E-nose system have been limited and therefore, there is room for more research. Moreover, it was found that the composition of each kind of CHMs is very complex and often contains a variety of odors with different strengths. An E-nose system only obtains the overall odor of the sample and provides only a qualitative analysis of the volatile components in CHMs. Therefore, it is necessary to study the functionality of E-nose systems in order to achieve better chemical compositional analyses of volatile chemicals.
5.1.2. Development of New Sensor Materials
The repeatability and stability of the sensor array in E-nose systems are easily influenced by environmental factors (such as humidity, temperature and vibration), which lead to the instability of the measurement data. In addition, the number of gas sensors in an E-nose system is limited and each gas sensor is usually sensitive to one kind of odor, so it is crucial to identify more sensitive, selective and stable sensing materials to construct the sensor arrays. Different devices such as SAW, molecularly imprinted polymer sensors [44], nano-bioelectronics [42], optical sensors [119], mobilized natural receptor sensors [120] and electrochemical biosensors [43,121] have shown suitable characteristics due to their compact structures, high sensitivity and fast response time [44,119]. In addition, ion mobility spectrum (IMS) [120,122] and organic printable electronic materials [45,48,123] with advantages of high sensitivity, simple apparatus, small volume and low cost, have shown great potential in standard E-nose technology, so the second challenge for E-nose technology is to investigate new materials and make it more portable and more sensitive with faster response times when exposed to different volatile species.
5.1.3. Investigation of Appropriate Pattern Recognition Methods
The pattern recognition methods adopted in an E-nose system for the identification of CHMs, lack standard procedures, and provide unsatisfactory recognition accuracy. In Europe, there was an attempt to standardize the pattern recognition system [47]. Although differences in odor can be measured by an E-nose system, there is not full agreement on adopting a specific parent recognition method as applied to a particular sensory application. Moreover, much research needs to be done to achieve better interpretation and analysis of the results of identification of CHMs by an intuitive way. Therefore, another research challenge in this field is to investigate more appropriate pattern recognition methods in relation to the E-nose technology.
5.2. Future Perspectives
5.2.1. Development of New Drugs
In addition to the identification and prediction of the kinds and quality of CHMs, the E-nose technology can also be useful in the development of new drugs and drug discovery [1,124,125,126]. A certain class of odor representing a group of chemicals may also relate to a certain class of drug. For example, some traditional Chinese medicines have “Ginseng flavor” or “Pungent flavor”, which represent tonic or dampness medicines. Therefore, during the development of new drugs, there is a chance to discover new medical value according to the detected odor and classification results using novel E-nose systems [126,127].
5.2.2. Odor Standardization for CHMs
Up to now, odor still lacks a standardized format, and it is difficult to transfer and communicate odor to other users, especially when they are in remote places [47]. This has limited the development of a standardization approach for E-nose systems as applied to quality control of CHMs. In order to study a standard method for odor identification, scientists have tried to digitally describe odor by using smell codes. They have attempted to verbally describe odors based on perception and assess odor qualities by perception-based ratings. More systematic experimental trials were conducted, such as chemical structure-based and perception-based methods that have been used to classify and quantify odors [127,128]. Multiple component metrics of odor structure were used for beef flavor description [129]. However, all of these approaches are still in preliminary stages and to the best of our knowledge, there is no device that objectively expresses odor-related information. Therefore, it is necessary to develop novel experimental platforms with higher sensitivity and processing speed for odor standardization.
A novel and portable E-nose system with advanced features such as low cost, high sensitivity and fast response time can be employed for coding odor information and identifying primary odor molecules of CHMs. This multiplexed E-nose system, as an emerging tool for odor standardization, can generate combinatorial patterns of odors in order to serve as a universal code for odors that can be standardized for coding many odors [42,126,127]. The realization of odor standardization offers great potential for CHMs in many applications. It is expected to accelerate odor identification and quality control standardization for CHMs by providing codified odors.
5.2.3. Odor Remote Reproduction and Remote Diagnosis in Medicine
In the future, with the realization of odor standardization, the subjective information of smell can be converted into objective information and even can be transferred to other remote places via the Internet. Like vision and hearing which have being encoded or decoded by related devices, smell obtained from odorant detection can be recognized and encoded into a standard format by the sensory system. Then, these standardized odor information can be analyzed by a data processing system, and transmitted to the remote olfactory display system. Decoding the odor information can be utilized in the reproduction of the odor based on an odor–receptor interaction database. Therefore, users in remote area would be able to smell the same odor as doctors for diagnosing those remote patients.
6. Conclusions
The E-nose technology can be employed to digitalize the odor information of CHMs and make it objective for qualitative analysis. Although, E-noses have been widely used in many applications there is limited literature on the application of E-nose systems in the field of CHMs. This might be due to the fact that the composition of each kind of CHMs is very complex and often contains a variety of odors with different strengths. However, there has been some progress in recent years in this area but there are more opportunities for further research and development to answer some fundamental research questions such as: (1) How to realize the qualitative analysis of volatile components and quality control in CHMs? (2) How to exploit new high-sensitivity sensor materials? (3) How to design highly accurate pattern recognition methods? (4) How to accomplish odor standardization? These challenges will be accompanied with the development of E-nose technology. We have found that through continuous improvement and development of E-nose technology, odor may become a new quantitative index for CHM quality control, which will advance further study of CHMs and the development of new drugs. At the same time, odor standardization and odor remote reproduction based on novel E-nose systems, will promote the objective and standardized development of Traditional Chinese Medicine.
Acknowledgments
The authors acknowledge the financial support of the General Program of The National Natural Science Fund (Grant No. 61571140), Guangdong provincial Project (Grant No. 2016A020226018), Guangdong provincial Project (Grant No. 15ZK0130), Guangdong Provincial Administration of traditional Chinese Medicine Project (Grant No. 20161152).
Author Contributions
Huaying Zhou was in charge of the preparation and revising of this manuscript; Dehan Luo was responsible for the project management and revising this manuscript; Hamid GholamHosseini provided valuable advice about the revised manuscript and proofreading of the final submission; Zhong Li was in charge of data collection and discussion of the results; Jiafeng He was involved in discussions and data analysis.
Conflicts of Interest
The authors declare no conflict of interest.
References
- Huang, M.A. Current situation and development trend of traditional Chinese Medicine. Lishizhen Med. Mater. Med. Res. 2016, 8, 1956–1960. [Google Scholar]
- Fleischer, T.; Su, Y.C.; Lin, S.J. How do government regulations influence the ability to practice Chinese herbal medicine in western countries. J. Ethnopharmacol. 2017, 196, 104–109. [Google Scholar] [CrossRef] [PubMed]
- How Many Kinds of Chineses Herbal Medicines? Available online: http://zhidao.baidu.com/question/529093904.html (accessed on 8 October 2016).
- Sun, Y.P.; Zhang, T.J.; Cao, H.; Xu, J.; Gong, S.X.; Chen, C.Q. Expression of pungent-taste herbs and their applications in clinical compatibility. Chin. Tradit. Herb. Drugs 2015, 46, 785–790. [Google Scholar]
- Liu, H.Z. Research on the development of Chinese medicine in Africa and its communication strategy. Sci. Technol. Vis. 2016, 4, 146. [Google Scholar]
- Yang, S.; Wu, N.; Yuan, X.; Liu, Y.; Zhong, R.; Wu, C. Current situation and thinking on “odor and taste” identification of traditional chinese medicine. World Sci. Technol. Mod. Tradit. Chin. Med. 2014, 9, 1876–1879. [Google Scholar]
- Zou, H.Q. Methodological Study on the Quality Evaluation of Traditional Chinese Medicine Based on Bionic System; Beijing University of Chinese Medicine: Beijing, China, 2013. [Google Scholar]
- Xu, S.J.; Yang, L.; Xie, P.S. Present situation and Prospect of research on odor identification of traditional Chinese Medicine. Tradit. Chin. Drug Res. Pharmacol. 2011, 22, 228–230. [Google Scholar]
- Zhang, B.; Li, Y.; Zhang, Y.; Li, Z.; Bi, T.; He, Y. Initial transcription process-based identification method of bioactive components in traditional chinese medicine formula. Evid.-Based Complement. Altern. Med. 2016, 2016, 1–7. [Google Scholar] [CrossRef] [PubMed]
- Zhang, L.X.; Zhou, X.Y.; Zhou, S.Y. Identification of Panacis Quinquefolii Radix, Ginseng Radix and its counterfeit and inferior products. J. Mod. Med. Health 2013, 29, 1651–1652. [Google Scholar]
- Loutfi, A.; Coradeschi, S.; Mani, G.K.; Shankar, P.; Rayappan, J.B. Electronic noses for food quality: A review. J. Food Eng. 2015, 144, 103–111. [Google Scholar] [CrossRef]
- Peris, M.; Escuder-Gilabert, L. Electronic noses and tongues to assess food authenticity and adulteration. Trends Food Sci. Technol. 2016, 58, 40–54. [Google Scholar] [CrossRef]
- Gutiérrez, J.; Horrillo, M.C. Advances in artificial olfaction: Sensors and applications. Talanta 2014, 124, 95–105. [Google Scholar] [CrossRef] [PubMed]
- Jiang, S.; Wang, J.; Wang, Y. A novel framework for analyzing MOS E-nose data based on voting theory: Application to evaluate the internal quality of Chinese pecans. Sens. Actuators B Chem. 2017, 242, 511–521. [Google Scholar] [CrossRef]
- Chen, Q.; Hu, W.; Su, J. Nondestructively sensing of total viable count (TVC) in chicken using an artificial olfaction system based colorimetric sensor array. J. Food Eng. 2015, 168, 259–266. [Google Scholar] [CrossRef]
- Deshmukh, S.; Bandyopadhyay, R.; Bhattacharyya, N. Application of electronic nose for industrial odors and gaseous emissions measurement and monitoring—An overview. Talanta 2015, 144, 329–340. [Google Scholar] [CrossRef] [PubMed]
- Gebicki, J. Application of electrochemical sensors and sensor matrixes for measurement of odorous chemical compounds. TrAC Trends Anal. Chem. 2016, 77, 1–13. [Google Scholar] [CrossRef]
- Sanaeifar, A.; Mohtasebi, S.S.; Ghasemi-Varnamkhasti, M. Application of MOS based electronic nose for the prediction of banana quality properties. Measurement 2016, 82, 105–114. [Google Scholar] [CrossRef]
- Xu, L.; Yu, X.; Liu, L. A novel method for qualitative analysis of edible oil oxidation using an electronic nose. Food Chem. 2016, 202, 229–235. [Google Scholar] [CrossRef] [PubMed]
- Li, D.; Lei, T.; Zhang, S. A novel headspace integrated E-nose and its application in discrimination of Chinese medical herbs. Sens. Actuators B Chem. 2015, 221, 556–563. [Google Scholar] [CrossRef]
- Qiu, S.; Gao, L.; Wang, J. Classification and regression of ELM, LVQ and SVM for E-nose data of strawberry juice. J. Food Eng. 2015, 144, 77–85. [Google Scholar] [CrossRef]
- Adiguzel, Y.; Kulah, H. Breath sensors for lung cancer diagnosis. Biosens. Bioelectron. 2015, 65, 121–138. [Google Scholar] [CrossRef] [PubMed]
- Pomerantz, A.; Blachman-Braun, R.; Galnares-Olalde, J.A. The possibility of inventing new technologies in the detection of cancer by applying elements of the canine olfactory apparatus. Med. Hypotheses 2015, 85, 160–172. [Google Scholar] [CrossRef] [PubMed]
- Westenbrink, E.; Arasaradnam, R.P.; O’Connell, N. Development and application of a new electronic nose instrument for the detection of colorectal cancer. Biosens. Bioelectron. 2015, 67, 733–738. [Google Scholar] [CrossRef] [PubMed]
- Dragonieri, S.; Annema, J.T.; Schot, R. An electronic nose in the discrimination of patients with non-small cell lung cancer and COPD. Lung Cancer 2009, 64, 166–170. [Google Scholar] [CrossRef] [PubMed]
- Ghasemi-Varnamkhasti, M.; Aghbashlo, M. Electronic nose and electronic mucosa as innovative instruments for real-time monitoring of food dryers. Trends Food Sci. Technol. 2014, 38, 158–166. [Google Scholar] [CrossRef]
- Gliszczyńska-Świgło, A.; Chmielewski, J. Electronic nose as a tool for monitoring the authenticity of food. A review. Food Anal. Method 2016, 10, 1800–1816. [Google Scholar] [CrossRef]
- Wilson, A.D.; Baietto, M. Applications and advances in electronic-nose technologies. Sensors 2009, 9, 5099. [Google Scholar] [CrossRef] [PubMed]
- Baietto, M.; Wilson, A.D. Electronic-nose applications for fruit identification, ripeness and quality grading. Sensors 2015, 15, 899–931. [Google Scholar] [CrossRef] [PubMed]
- Giungato, P.; Laiola, E.; Nicolardi, V. Evaluation of industrial roasting degree of coffee beans by using an electronic nose and a stepwise backward selection of predictors. Food Anal. Method 2017, 1–10. [Google Scholar] [CrossRef]
- Xu, K.; Wang, J.; Wei, Z. An Optimization of the MOS electronic nose sensor array for the detection of Chinese pecan quality. J. Food Eng. 2017, 203, 25–31. [Google Scholar] [CrossRef]
- Qin, O.; Zhao, J.; Chen, Q. Instrumental intelligent test of food sensory quality as mimic of human panel test combining multiple cross-perception sensors and data fusion. Anal. Chim. Acta 2014, 841, 68–76. [Google Scholar]
- Yener, S.; Sánchezlópez, J.A.; Granitto, P.M. Rapid and direct volatile compound profiling of black and green teas (Camellia sinensis) from different countries with PTR-ToF-MS. Talanta 2016, 152, 45–53. [Google Scholar] [CrossRef] [PubMed]
- Qiu, S.; Wang, J.; Gao, L. Qualification and quantisation of processed strawberry juice based on electronic nose and tongue. LWT Food Sci. Technol. 2015, 60, 115–123. [Google Scholar] [CrossRef]
- Xiaolong, S.; Hui, L.; Nan, W.; Qiang, Z. Comparison of different classification methods for analyzing electronic nose data to characterize sesame oils and blends. Sensors 2015, 15, 26726–26742. [Google Scholar]
- Ambeth, K.V.D. Human security from death defying gases using an intelligent sensor system. Sens. Biosens. Res. 2016, 7, 107–114. [Google Scholar]
- Qiu, S.; Wang, J. The prediction of food additives in the fruit juice based on electronic nose with chemometrics. Food Chem. 2017, 230, 208–214. [Google Scholar] [CrossRef] [PubMed]
- Berna, A.Z.; Trowell, S.; Clifford, D.; Cynkar, W.; Cozzolino, D. Geographical origin of Sauvignon Blanc wines predicted by mass spectrometry and metal oxide based electronic nose. Anal. Chim. Acta 2009, 648, 146–152. [Google Scholar] [CrossRef] [PubMed]
- Melucci, D.; Bendini, A.; Tesini, F.; Barbieri, S.; Zappi, A.; Vichi, S. Rapid direct analysis to discriminate geographic origin of extra virgin olive oils by flash gas chromatography electronic nose and chemometrics. Food Chem. 2016, 204, 263–273. [Google Scholar] [CrossRef] [PubMed]
- Gancarz, M.; Wawrzyniak, J.; Gawrysiak-Witulska, M. Application of electronic nose with MOS sensors to prediction of rapeseed quality. Measurement 2017, 103, 227–234. [Google Scholar] [CrossRef]
- Tian, F.; Liang, Z.; Zhang, L. A novel pattern mismatch based interference elimination technique in E-nose. Sens. Actuators B Chem. 2016, 234, 703–712. [Google Scholar] [CrossRef]
- Son, M.; Lee, J.Y.; Ko, H.J. Bioelectronic nose: An emerging tool for odor standardization. Trends Biotechnol. 2017, 35, 301–307. [Google Scholar] [CrossRef] [PubMed]
- Adzhri, R.; Arshad, M.K.M.; Gopinath, S.C.B. High-performance integrated field-effect transistor-based sensors. Anal. Chim. Acta 2016, 917, 1–18. [Google Scholar] [CrossRef] [PubMed]
- Cui, Z.; Qiu, S.; Zhou, C. Printed electronics: materials, technologies and applications. In Printed Electronics; Higher Education Press: Beijing, China, 2016; pp. 54–105. [Google Scholar]
- Subramanian, V.; Chang, J.; Liao, F. Printed organic chemical sensors and sensor systems. In Applications of Organic and Printed Electronics; Springer: New York, NY, USA, 2013; pp. 157–177. [Google Scholar]
- Ayadi, Y.; Rahhal, L.; Vilquin, B. Novel concept of gas sensitivity characterization of materials suited for implementation in FET-based gas sensors. Nanoscale Res. Lett. 2016, 11, 481–488. [Google Scholar] [CrossRef] [PubMed]
- Theunis, J.; Stevens, M.; Botteldooren, D. Sensing the environment. In Participatory Sensing, Opinions and Collective Awareness; Springer International Publishing: Basel, Switzerland, 2017; pp. 21–46. [Google Scholar]
- Lin, C.G.; Hu, J.; Song, Y.F. Polyoxometalate-functionalized nanocarbon materials for energy conversion, energy storage, and sensor systems. Adv. Inorg. Chem. 2017, 8, 776–789. [Google Scholar]
- Zhen, Q.; Qi, D.; Liang, H.U.; Huang, L.Q.; Jimmy, H.; Ping, W. Recent advances in bioinspired olfaction/gustation sensors and their applications. Chin. J. Biomed. Eng. 2014, 33, 609–619. [Google Scholar]
- Kim, T.H.; Sang, H.L.; Lee, J. Single-Carbon-Atomic-Resolution Detection of odorant molecules using a human olfactory receptor-based bioelectronic nose. Adv. Mater. 2009, 21, 91–94. [Google Scholar] [CrossRef]
- Liu, Q.; Wang, H.; Li, H.; Zhang, J.; Zhuang, S.; Zhang, F. Impedance sensing and molecular modeling of an olfactory biosensor based on chemosensory proteins of honeybee. Biosens. Bioelectron. 2013, 40, 174–179. [Google Scholar] [CrossRef] [PubMed]
- Tai, H.P. Bioelectronic Nose. News Inf. Chem. Eng. 2014, 32, 536. [Google Scholar]
- Jin, H.J.; Sang, H.L.; Kim, T.H. Nanovesicle-based bioelectronic nose platform mimicking human olfactory signal transduction. Biosens. Bioelectron. 2012, 35, 335–341. [Google Scholar] [CrossRef] [PubMed]
- Lv, A.; Pan, Y.; Chi, L. Gas Sensors Based on Polymer Field-Effect Transistors. Sensors 2017, 17, 213. [Google Scholar] [CrossRef] [PubMed]
- Lu, J.; Liu, D.; Zhou, J. Porous Organic Field-Effect Transistors for Enhanced Chemical Sensing Performances. Adv. Funct. Mater. 2017. [Google Scholar] [CrossRef]
- Peris, M.; Escuder-Gilabert, L. A 21st century technique for food control: electronic noses. Anal. Chim. Acta 2009, 638, 1–15. [Google Scholar] [CrossRef] [PubMed]
- Pérez, A.A.; Del, N.S.M.; Crisolino Pozas, Á.P. Headspace-programmed temperature vaporizer-mass spectrometry and pattern recognition techniques for the analysis of volatiles in saliva samples. Talanta 2016, 160, 21–27. [Google Scholar] [CrossRef] [PubMed]
- Ryman, S.K.; Bruce, N.D.B.; Freund, M.S. Temporal responses of chemically diverse sensor arrays for machine olfaction using artificial intelligence. Sens. Actuators B Chem. 2016, 231, 666–674. [Google Scholar] [CrossRef]
- Burlachenko, J.; Kruglenko, I.; Snopok, B.; Persaud, K. Sample handling for electronic nose technology: State of the art and future trends. TrAC Trends Anal. Chem. 2016, 82, 222–236. [Google Scholar] [CrossRef]
- Chiu, S.W.; Tang, K.T. Towards a chemiresistive sensor-integrated electronic nose: A review. Sensors 2013, 13, 14214–14247. [Google Scholar] [CrossRef] [PubMed]
- Macías, M.M.; Agudo, J.E.; García, M.A.; García Orellana, C.J.; González Velasco, H.M.; Gallardo, C.R. A compact and low cost electronic nose for aroma detection. Sensors 2013, 13, 5528–5541. [Google Scholar] [CrossRef] [PubMed]
- Reisert, J.; Restrepo, D. Molecular tuning of odorant receptors and its implication for odor signal processing. Chem. Sens. 2009, 34, 535–545. [Google Scholar] [CrossRef] [PubMed]
- Lian, C.; Ruan, S.; Denœux, T. An evidential classifier based on feature selection and two-step classification strategy. Pattern Recognit. 2015, 48, 2318–2327. [Google Scholar]
- Akbar, M.A.; Ali, A.A.S.; Amira, A. An empirical study for PCA- and LDA-based feature reduction for gas identification. IEEE Sens. J. 2016, 16, 5734–5746. [Google Scholar] [CrossRef]
- Faleh, R.; Othman, M.; Gomri, S. A transient signal extraction method of WO3, gas sensors array to identify polluant gases. IEEE Sens. J. 2016, 16, 3123–3130. [Google Scholar]
- Yan, J.; Duan, S.; Huang, T. Hybrid feature matrix construction and feature selection optimization-based multi-objective QPSO for electronic nose in wound infection detection. Sens. Rev. 2016, 36, 23–33. [Google Scholar] [CrossRef]
- Min, H.K.; Hou, Y.; Park, S. A computationally efficient scheme for feature extraction with kernel discriminant analysis. Pattern Recognit. 2016, 50, 45–55. [Google Scholar] [CrossRef]
- Yan, J.; Guo, X.; Duan, S.; Jia, P.; Wang, L.; Peng, C. Electronic nose feature extraction methods: A review. Sensors 2015, 15, 27804–27831. [Google Scholar] [CrossRef] [PubMed]
- Bouraoui, A.; Jamoussi, S.; Benayed, Y. A multi-objective genetic algorithm for simultaneous model and feature selection for support vector machines. Artif. Intell. Rev. 2017, 1–21. [Google Scholar] [CrossRef]
- Wan, C.; Freitas, A.A. An empirical evaluation of hierarchical feature selection methods for classification in bioinformatics datasets with gene ontology-based features. Artif. Intell. Rev. 2017, 22–40. [Google Scholar] [CrossRef]
- Fujioka, K.; Tomizawa, Y.; Shimizu, N.; Ikeda, K.; Manome, Y. Improving the performance of an electronic nose by wine aroma training to distinguish between drip coffee and canned coffee. Sensors 2015, 15, 1354–1364. [Google Scholar] [CrossRef] [PubMed]
- Lee, J.; Kim, D.W. SCLS: Multi-label feature selection based on scalable criterion for large label set. Pattern Recognit. 2017, 66, 342–352. [Google Scholar] [CrossRef]
- Puggini, L.; Mcloone, S. Forward selection component analysis: Algorithms and applications. IEEE Trans. Pattern Anal. Mach. Intell. 2017. [Google Scholar] [CrossRef] [PubMed]
- Li, F.; Miao, D.; Pedrycz, W. Granular multi-label feature selection based on mutual information. Pattern Recognit. 2017, 67, 410–423. [Google Scholar] [CrossRef]
- Berkhout, D.J.; Benninga, M.A.; van Stein, R.M.; Brinkman, P.; Niemarkt, H.J.; Boer, N.K. Effects of sampling conditions and environmental factors on fecal volatile organic compound analysis by an electronic nose device. Sensors 2016, 16, 1967. [Google Scholar] [CrossRef] [PubMed]
- Cho, Y. S.; Jung, S. C.; Oh, S. Diagnosis of bovine tuberculosis using a metal oxide-based electronic nose. Lett. Appl. Microbiol. 2015, 60, 513–516. [Google Scholar] [CrossRef] [PubMed]
- Xu, S.; Lü, E.; Lu, H.; Zhou, Z.; Yu, W.; Jing, Y. Quality detection of litchi stored in different environments using an electronic nose. Sensors 2016, 16, 852. [Google Scholar] [CrossRef] [PubMed]
- Guz, Ł.; Łagód, G.; Jaromin-Gleń, K.; Suchorab, Z.; Sobczuk, H.; Bieganowski, A. Application of gas sensor arrays in assessment of wastewater purification effects. Sensors 2015, 15, 1–21. [Google Scholar]
- Lippolis, V.; Ferrara, M.; Cervellieri, S. Rapid prediction of ochratoxin A-producing strains of Penicillium on dry-cured meat by MOS-based electronic nose. Int. J. Food Microbiol. 2015, 218, 71–77. [Google Scholar] [CrossRef] [PubMed]
- Mei, C.; Yang, M.; Shu, D. Monitoring wheat straw fermentation process using electronic nose with pattern recognition methods. Anal. Methods UK 2015, 7, 6006–6011. [Google Scholar] [CrossRef]
- Ciptohadijoyo, R.S.; Litananda, W.S.; Rivai, M.; Purnomo, M.H. Electronic nose based on partition column integrated with gas sensor for fruit identification and classification. Comput. Electron. Agric. 2016, 121, 429–435. [Google Scholar]
- Fu, J.; Li, G.; Qin, Y.; Freeman, W.J. A pattern recognition method for electronic noses based on an olfactory neural network. Sens. Actuators B Chem. 2007, 125, 489–497. [Google Scholar] [CrossRef]
- Feng, B.; Chen, B.; Liu, H. Radar HRRP target recognition with deep networks. Pattern Recognit. 2017, 61, 379–393. [Google Scholar] [CrossRef]
- Yin, B.C.; Wang, W.T.; Wang, L.C. Review of deep learning. J. B. Univ. Technol. 2015, 41, 48–59. [Google Scholar]
- Choi, J.K.; Hwang, I.S.; Kim, S.J. Design of selective gas sensors using electrospun Pd-doped SnO2, hollow nanofibers. Sens. Actuators B Chem. 2010, 150, 191–199. [Google Scholar] [CrossRef]
- Zou, H.Q.; Li, S.; Huang, Y.H. Rapid identification of asteraceae plants with improved RBF-ANN classification models based on MOS sensor E-nose. Evid.-Based Complement. Altern. Med. 2014, 2014, 425341. [Google Scholar] [CrossRef] [PubMed]
- Chilo, J.; Pelegri-Sebastia, J.; Cupane, M.; Sogorb, T. E-nose application to food industry production. IEEE Instrum. Meas. Mag. 2016, 19, 27–33. [Google Scholar] [CrossRef]
- Luo, D.H.; Chen, H.Q. A novel approach for classification of Chinese herbal medicines using diffusion maps. Int. J. Pattern Recognit. 2015, 1, 104–112. [Google Scholar] [CrossRef]
- Röck, F.; Nicolae Barsan, A.; Weimar, U. Electronic nose: Current status and future trends. Chem. Rev. 2016, 108, 705–725. [Google Scholar] [CrossRef] [PubMed]
- Tian, C.; Liu, C.; Wu, H.; Yang, Y.; Wang, X.; Zhang, Y. Detection method and pattern recognition of ginseng and american ginseng pieces by electronic nose. China J. Chin. Mater. Med. 2012, 37, 1165–1168. [Google Scholar]
- Liu, H.X.; Luo, D.H.; Ji, S.G. Identification and classification of Chinese medicinal materials based on electronic nose. Jilin J. Tradit. Chin. Med. 2011, 31, 580–583. [Google Scholar]
- Wu, L.L.; Zheng, D.; Zheng, B.Z. Study of Zanthoxylum bungeanum Maxim. Varieties discriminating method by electronic nose technology. Chin. J. Sens. Actuators 2013, 11, 1473–1477. [Google Scholar]
- Lin, H.; Yan, Y.; Zhao, T.; Peng, L.; Zou, H.; Li, J. Rapid discrimination of apiaceae plants by electronic nose coupled with multivariate statistical analyses. J. Pharm. Biomed. Anal. 2013, 84, 1–4. [Google Scholar] [CrossRef] [PubMed]
- Liu, H.X.; Sheng-Guo, J.I.; Zhuang, J.J.; Wei-Dong, L.I. To differentiate varieties of Chinese herbal medicine based on bionic olfaction. J. Guangdong Pharm. Univ. 2009, 25, 356–358. [Google Scholar]
- Luo, D.; Fan, D.; Yu, H.; Li, Z. A new processing technique for the identification of Chinese herbal medicine. In Proceedings of the 2013 5th International Conference on Computational and Information Sciences (ICCIS), Shiyan, China, 21–23 June 2013; pp. 474–477. [Google Scholar]
- Zou, H.; Han, Y.; Xing, S.; Lin, Q.; Wei, Z.; Xiong, Y. Electronic nose and its application in chinese materia medica. World Sci. Technol. 2012, 14, 2120–2125. [Google Scholar] [CrossRef]
- Shen, G. Study on the chemical constituents of volatile oil of atractylodes macrocephala koidz. produced in Zhejiang province. Anhui Agric. Sci. Bull. 2008, 14, 128–133. [Google Scholar]
- Xu, M.; Yang, S.L.; Zhang, C.; Wan, J.; Wu, N.; Li, X.Y. Discrimination of Coptis chinensis Franch. and its processed products by odor objectify. China J. Chin. Mater. Med. 2015, 40, 89–93. [Google Scholar]
- Huang, X.S.; Li, W.M.; Zhang, X.L.; Jia, J.; Zhang, H.H.; Wu, C.J. Discriminating processed Areca catechu L. degree of stir-frying and quantizing empirical index based on color difference meter and electronic nose fingerprint analyzer. China J. Chin. Mater. Med. 2009, 34, 1786–1791. [Google Scholar]
- Kong, F.Y.; Shao, L.; Hu, H.H. Application of electronic nose method in the identification of Siegesbeckia orientalis L. from different producing areas. J. China Pharm. 2014, 19, 1793–1795. [Google Scholar]
- Zhong, L.; Wang, Y.W.; Liu, Y.J. Research on identification of Leonurus japonicus Houtt. from Sichuan by electronic nose. World Sci. Technol. Mod. Tradit. Chin. Med. 2014, 6, 1384–1390. [Google Scholar]
- Wu, N.; Yang, S.L.; Yan, D. Advances in consideration and application of identification methods for powered Chinese material medica. China Tradit. Herb. Drugs 2015, 46, 1413–1419. [Google Scholar]
- Li, S.; Li, X.R.; Wang, G.L.; Nie, L.X.; Yang, Y.J.; Wu, H.Z. Rapid discrimination of Chinese Panax ginseng C.A. Mey. and Korean Panax ginseng C.A. Mey. an electronic nose coupled with chemometrics. J. Pharm. Biomed. Anal. 2012, 70, 605–608. [Google Scholar] [CrossRef] [PubMed]
- Chen, L.; Liu, Y.P.; Chen, H.P.; Peng, C.; Jia, H.F. Electronic nose used in evaluating Ligusticum chuanxiong hort. produced in different regions and of different levels. Pharm. Clin. Chin. Mater. Med. 2013, 4, 7–10. [Google Scholar]
- Han, B.X.; Zhao, Y.Y.; Zhu, Z.X.; Chen, N.F. Identification of the origin of “dabaiju” by electronic nose. Res. Pract. Chin. Med. 2012, 1, 16–18. [Google Scholar]
- Zheng, J.B.; Yang, L.; Chen, J.B.; Wang, Y.M. Study on odor source localization method based on bionic olfaction. Appl. Mech. Mater. 2013, 4, 391–395. [Google Scholar] [CrossRef]
- Zou, H.Q.; Liu, Y.; Tao, O.; Lin, H.; Su, Y.Z.; Lin, X.L. Optimization method of mos sensor array for identification of traditional Chinese medicine based on electronic nose. China J. Chin. Mater. Med. 2013, 38, 161–166. [Google Scholar]
- Lin, H.; Zhao, T.; Zou, H.Q.; Peng, L.; Jia-Hui, L.I.; Ren, Z.Y. Study on identification to different origin of cultivated and wild Oxybaphus Himalaicus Edgew. by electronic nose. Chin. J. Tradit. Chin. Med. Pharm. 2014, 29, 1834–1837. [Google Scholar]
- Wang, W.T. Study on Identification of Chinese Medicine by Electronic Nose; Beijing University of Chinese Medicine: Beijing, China, 2009. [Google Scholar]
- Chen, W.G.; Sheng, J. Infection of the content of total flavonoids in Chrysanthemum morifolium Ramat. from different storage time and storage condition. Lishizhen Med. Mater. Med. Res. 2006, 17, 1483–1484. [Google Scholar]
- Zhang, W.Y.; Zhu, C.H.; Zhou, H.J. Changes in aromatic components in raw Pu-erh tea during storage. Food Sci. 2010, 31, 153–155. [Google Scholar]
- Hao, Y.Q. Influencing factors of the quality of TCM medicine storage. Clin. J. Chin. Med. 2013, 11, 114–115. [Google Scholar]
- Zhang, C.L.; Li, K.; Fu, L.N. Current status of the relationship between the storage and the active components of traditional Chinese medicine. Guangzhou Chem. Ind. 2015, 20, 18–19. [Google Scholar]
- Jiang, S.; Wang, J. Internal quality detection of Chinese pecans (carya cathayensis) during storage using electronic nose responses combined with physicochemical methods. Postharvest Biol. Technol. 2016, 118, 17–25. [Google Scholar] [CrossRef]
- Wu, S.Y.; Luo, D.H.; Deng, B.R. Study of identification for Chinese medicinal herbs in different producing areas and harvest time. J. Sens. Technol. 2011, 24, 10–13. [Google Scholar]
- Zou, H.Q.; Liu, Y.; Yan, Y.H. Research of E-nose technology and application. J. Sens. Technol. 2011, 17, 6–11. [Google Scholar]
- Eric, B.; Christine, L.; Mark, N. Economic Botany Collections: A source of material evidence for exploring historical changes in Chinese medicinal materials. J. Ethnopharmacol. 2017, 200, 209–227. [Google Scholar]
- Jon, C.; Isobel, B.; Flavia, V. Exploring the use of cost-effective membrane materials for Microbial Fuel Cell based sensors. Electrochim. Acta 2017, 231, 319–326. [Google Scholar]
- Zhao, Z.; Tian, F.; Liao, H. A Novel Spectrum Analysis Technique for Odor Sensing in Optical Electronic Nose. Sens. Actuators B Chem. 2015, 222, 769–779. [Google Scholar] [CrossRef]
- Roine, A.; Saviauk, T.; Kumpulainen, P. Rapid and Accurate Detection of Urinary Pathogens by Mobile IMS-Based Electronic Nose: A Proof-of-Principle Study. PLoS ONE 2014, 9, 114279. [Google Scholar] [CrossRef] [PubMed]
- Grieshaber, D.; MacKenzie, R.; Voros, J.; Reimhult, E. Electrochemical biosensors-sensor principles and architectures. Sensors 2008, 8, 1400–1458. [Google Scholar] [CrossRef] [PubMed]
- Samotaev, N.; Golovin, A.; Vasilyev, V. IMS Development at NRNU MEPhI. In Sensors and Microsystems; Springer International Publishing: Basel, Switzerland, 2014; pp. 447–451. [Google Scholar]
- Gamota, D.R.; Brazis, P.; Kalyanasundaram, K. Printed organic and molecular electronics. Mater. Today 2004, 7, 53. [Google Scholar]
- Olofsson, J.K.; Gottfried, J.A. The muted sense: Neuro-cognitive limitations of olfactory language. Trends Cogn. Sci. 2015, 19, 314–321. [Google Scholar] [CrossRef] [PubMed]
- Gottfried, J.A.; Dolan, R.J. The nose smells what the eye sees: Crossmodal visual facilitation of human olfactory perception. Neuron 2003, 39, 375–386. [Google Scholar] [CrossRef]
- Wu, H.K.; Ko, Y.S.; Lin, Y.S. The correlation between pulse diagnosis and constitution identification in traditional Chinese medicine. Complement. Ther. Med. 2017, 30, 107–112. [Google Scholar] [CrossRef] [PubMed]
- Leung, E.L.; Clementi, E.; Wong, W.S. Advanced technologies charting a new path for Traditional Chinese Medicine drug discovery. Pharmacol. Res. 2017, 117, 65–66. [Google Scholar] [CrossRef] [PubMed]
- Zeng, H.H.; Fang, Z.H.; Pharmacy, D.O. Cause investigation of drug-induced diseases and its relationship with traditional Chinese medicine. Chin. J. Tradit. Chin. Med. Pharm. 2017, 1, 328–331. [Google Scholar]
- Liu, T.; Huang, M.; Zou, Q. Analysis of Volatile Compounds in Dictyophora indusiata-Fortified Beef Flavor by GC-MS and GC-O. Food Sci. 2016, 37, 92–98. [Google Scholar]
Figure 1.
Comparison of human olfactory system and electronic nose.

Figure 2.
The working principle of an E-nose and the identification processing for CHMs.


Table 1.
E-nose models for commercial and non-commercial applications with different sensors such as Metal Oxide Sensor (MOS) and Conducting Polymer (CP).
Table 1.
E-nose models for commercial and non-commercial applications with different sensors such as Metal Oxide Sensor (MOS) and Conducting Polymer (CP).
| State | Model | Number of Sensors | Sensor Material | Manufacturer | Country |
|---|---|---|---|---|---|
| Commercial | i-Pen, i-Pen3, PEN3 | 6, 10 | MOS | Airsense Analytics | Germany |
| Artinose | 38 | MOS | Sysca AG | Germany | |
| Air quality module | 2 | MOS | Applied Sensor | Sweden | |
| Aromascan A32S | 32 | CP | Osmetech Plc | USA | |
| Bloodhound ST 214 | 14 | CP | Scensive Technologies | UK | |
| Cyranose 320 | 32 | CP | Sensigent | USA | |
| FOX 3000, 4000 | 12, 18 | MOS | Alpha MOS | France | |
| LibraNose | 8 | Quartz Crystal Microbalance (QCM) | Technobiochip | Italy | |
| iNose, T-nose | 14, 10 | MOS | Isenso | China | |
| Non-commercial | Bioelectronic noses | -- | Olfactory receptors | Ref [42] | -- |
| Molecularly imprinted polymers noses | -- | Molecularly imprinted polymers | Ref [43,44,45] | -- | |
| Optical sensors | -- | Optical material | Ref [42,46,47] | -- | |
| Nano-bioelectronics | -- | Nanomaterials, animal receptors | Ref [48,49] | -- |
Table 2.
Comparison of characteristics of sensors utilized in design of E-noses (sensor matrixes).
| Sensor Type | Working Principle | Advantages | Disadvantages |
|---|---|---|---|
| Electrochemical sensors (EC) | The sensor reacts with the gas and generates an electrical signal proportional to the gas concentration gas. | 1. Low power consumption 2. Good robustness 3. Room temperature operation | 1. It isn’t applicable to aromatic hydrocarbons 2. Low sensitivity 3. Large volume |
| Metal oxide sensors (MOS) | The surface gas and oxide react to generate resistance changes according to the gas concentration. | 1. Fast response, short recovery 2. High sensitivity 3. Long life, High reproducibility, convenient replacement | 1. It is easy to react with sulfur compounds and produce damage to the sensor 2. Work at high temperature, High power consumption |
| Conducting polymer sensor (CP) | The resistance of the sensor is changed by the chemical reaction between the surface gas and the polymer, which forms the electrical signal. | 1. High sensitivity 2. Fast response, short recovery 3. Easy synthesis 4. Room temperature operation 5. Not easy to corrosion by sulfur compounds or weak acids | 1. Sensitive to environmental humidity 2.complex manufacturing process 3. Sensor life is short, generally 9~18 months |
| Surface acoustic wave sensors (SAW) | The surface gas flows through the sensors consisting of piezoelectric material and adsorbing material, which generates surface wave. | 1. Fast response 2. Low cost 3. Miniaturization | 1. High power consumption, high signal to noise ratio 2.Complex manufacturing process 3. Interface circuit complexity |
| Optical sensors (OS) | Measure the modulation of light properties or characteristics, such as changes in light absorbance, color, wave-length (colorimetric), upon exposure to gas analytics. | 1. Low energy consumption 2. High signal-to-noise ratio 3. High sensitivity | 1. Poor adaptability to environment 2. Low accuracy when long distance measurement |
| Biomimetic sensors (BS) | Sensors are composed of a fixed cell, an enzyme or other bioactive substances. | 1. Good performance 2. High sensitivity 3. Suitable for on-site analysis 4. Suitable for more complex applications | 1. Poor repeatability 2. Poor stability 3. Difficult to mass production |
Table 3.
Methods of data preprocessing for baseline correction.
| Methods | Formula |
|---|---|
| Difference | |
| Relative | |
| Fraction | |
| Sensor auto scaling | |
| Array Auto Scaling |
Notes: n is the dimension of the sensor array; p is the number of test samples; expresses the output of the jth sensor in the initial state, that is, the baseline value of the sensor; expresses the output value of the jth sensor of the ith test sample at the time of t. Xij(t) (i = 1~p, j = 1~n) expresses the value of baseline correction.
Table 4.
Methods of data preprocessing for data transformation.
| Methods | Formula |
|---|---|
| Logarithmic | |
| First derivatives | |
| Second derivatives |
Notes: n is the dimension of the sensor array; p is the number of test samples; expresses the output of the jth sensor in the initial state, that is, the baseline value of the sensor; expresses the output value of the jth sensor of the ith test sample at the time of t. Xij(t) (i = 1~p, j = 1~n) expresses the value of baseline correction.
Table 5.
Common pattern recognition methods for E-nose systems.
| Model | Common Method | Basic Principle | Application Area |
|---|---|---|---|
| Statistical recognition model | Principal component analysis (PCA) | A mathematical statistical analysis method. A set of related variables are converted to another set of linear unrelated variables by orthogonal transformation, and the linear unrelated variables are called principal components. | Medical information classification, population statistics, mathematical analysis. |
| Linear discriminant analysis (LDA) | The high dimensional sample data is projected into a low dimensional vector space, which is conducive to the best classification. So in the new subspace, there is a greater distance between the class and a smaller distance in class. | Face recognition, identification of CHMs. | |
| Support vector machine (SVM) | It is based on statistical learning theory including two basic principles, VC (Vapnik-Chervonenkis) dimension theory and structural risk minimization principle. It shows many unique advantages in solving small samples, nonlinear and high dimensional pattern recognition. | Biological information processing, text classification and handwriting recognition. | |
| K-nearest neighbor (KNN) | It is to determine the classification of the samples according to the nearest one or a few samples. The algorithm is simple and easy to implement, and especially is suitable for multiple classification problems. | Forecast estimate, biological, medical, economic and other fields. | |
| Intelligent recognition model | Artificial neural network (ANN) | By imitating the behavior characteristics of human or animal neural network, a mathematical model is established which is to carry out the distributed information processing. | Pattern recognition, intelligent robot, automatic control, prediction and estimation, biology, medicine, economy, etc. |
| Deep learning (DL) | The feature of the original space is transformed into the feature of the new space, and the hierarchical feature representation is obtained by the multilayer feature transform. | Speech recognition, synthesis and Machine Translation; image classification and recognition, etc. | |
| Fuzzy inference (FIS) | Based on the fuzzy set theory, the method is to simulate the human brain to process the non-accurate or nonlinear data information. | Household electrical appliances, expert system, intelligent control, etc. | |
| Genetic algorithm (GA) | The method is to simulate the process of natural evolution and to search for the optimal solution, which consists of selection operation, exchange operation and mutation operation. | Function optimization; production scheduling problem, automatic control, image recognition, etc. |
Table 6.
Main applications of E-nose systems for CHMs identification and classification.
| Selected Samples | Experimental Results | E-Nose Model | Data Processing Algorithm | Ref. |
|---|---|---|---|---|
| Pogostemon cablin (Blanco) Benth., Mentha haplocalyx Briq | The correct recognition rates were 100% (LDA model) and 98% (PCA model) | PEN3 (Airsense Analytics, Germany) | PCA, LDA | [91] Liu, H.X. |
| Six kinds of Zanthoxylum bungeanum Maxim | BP-NN analysis was the best among three selected methods, and the initial discriminant rate and cross validation rate in BP-NN analysis were 99% and 96.2% respectively. | E-nose System (made up of eight sensors constructed in Lab) | Back Propagation Neural Network (BP-NN), Probabilistic Neural Network (PNN), SVM | [92] Wu, L.L. |
| Apiaceae plants | The identification rate of ten-folds cross validation was 94.71%. | FOX3000 (Alpha MOS, France) | LDA, PCA, Hierarchical clustering analysis (HCA), ANN | [93] Lin, H. |
| Seven medicines (Illicium verum Hook. f., Amomi Fructus Rotundus, Ligusticum chuanxiong hort., Eugenia caryophyllata Thunb., Schizonepeta tenuifolia Briq., Cinnamomum cassia Presl, Amomum villosum Lour.) | The correct recognition rates were 98% (LDA model) and 96% (PCA model) respectively. | PEN3 | LDA, PCA | [94] Liu, H.X. |
| Amomum villosum Lour., Pogostemon cablin Benth., Leonurus japonicus Houtt., Houttuynia cordata Thunb., Mentha haplocalyx Briq. and Bupleurum chinense DC. | The odor fingerprint of Mentha haplocalyx Briq. had 15 common peaks and the largest average value, while that of Bupleurum chinense DC. had only 11 common peaks and the smallest average value. | PEN3 | LDA, PCA, LDA + PCA | [95] Luo, D. |
| Raw Atractylodes macrocephala Koidz. and processed Atractylodes macrocephala Koidz | The RSD of the relative peak area of the common peaks were less than 1.2%, and the relative retention time of each peak was less than 1.1%. | FOX 3000 | PCA | [97] Shen, G. |
| Four different samples of processed Coptis chinensis Franch. | PCA analysis was the best one in the selected four methods, and the initial discriminant rate and cross validation rate in PCA analysis were 100% and 94.4% respectively. | FOX 4000 (Alpha MOS, France) | PCA, LDA, Statistical Quality Control analysis (SQC), Soft Independent Modeling analysis (SIMCA) | [98] Xu, M. |
| Raw Areca catechu L. and processed Areca catechu L. | ANN analysis showed the best performance among three selected methods, and the initial discriminant rate and cross validation rate in ANN model were 100% and 97% respectively. | FOX 4000 | PCA, LDA, ANN | [99] Huang, X.S. |
| Siegesbeckia orientalis L. from different producing areas | The ten-folds cross validation rate was 93.19%. | FOX 3000 | PCA | [100] Kong, F.Y. |
| Leonurus japonicus Houtt. from Sichuan | PCA showed better performance than DFA. | FOX 4000 | PCA, DFA | [101] Zhong, L. |
| Fritillaria cirrhosa D. Don and Fritillaria thunbergii Miq | The initial discriminant rate and cross validation rate were 98% and 95% respectively. | FOX 4000 | PCA | [102] Wu, N. |
| Chinese Panax ginseng C.A. Mey. and Korean Panax ginseng C.A. Mey | The ten-folds cross validation rates of the three models were 96.12%, 97.56%, 92.39% respectively. | FOX 3000 | PCA, Discriminant factorial analysis (DFA), SIMCA (soft independent model of class analogy) | [103] Li, S. |
| Ligusticum chuanxiong hort. samples from different regions | The correct identification rate was 92.1% based an E-nose system. | FOX 4000 | PCA, LDA | [104] Chen, L. |
| Chrysanthemummorifolium RaTnat. in different habitats | The cross validation rates were 94.38% for PCA and 91.46% for DFA. | FOX 4000 | PCA, DFA | [105] Han, B.X. |
| Identification of Mentha haplocalyx Briq. from different regions; The odor fingerprint of Mentha haplocalyx Briq | Samples from Guangdong province had 18 common peaks with the average value of 12.67, while Mentha haplocalyx Briq. from Guangxi province had only 14 common peaks and the average value of 11.81. | PEN3 | PCA, PLS | [106] Zheng, J.B. |
| Amomum villosum Lour. from different regions | The performance of NBN model was the best and the initial discriminant rate and cross validation rate were 98% and 95.2% respectively. | FOX 3000 | PCA, Fisher-LDA, Naive Bayes Net (NBN), Radial Basis Function (RBF), Random Forests (RF) | [107] Zou, H.Q. |
| Oxybaphus himalaicus Edgew. from different regions | The performance of ANN model was the best and the initial discriminant rate and cross validation rate were 100% and 96.8% respectively. | FOX 3000 | DFA, HCA, ANN | [108] Lin, H. |
| Saposhnikovia divaricata (Turcz.) Schischk., Bupleurum Chinense DC. and Angelica sinensis (Oliv.) Diels. | SIMCA had more advantages in identification of Angelica sinensis (Oliv.) Diels than the other two models. The IDR and 10-FCVR were 96.6% and 95.2%; in identification of Bupleurum Chinense DC., IDR and 10-FCVR were 94.8% and 93.9%; in identification of Saposhnikovia divaricata (Turcz.) Schischk., IDR and 10-FCVR were 91.8% and 88.3%. | FOX 3000 | PCA, SIMCA, DFA | [109] Wang, W.T. |
| Amomum villosum Lour. in different storage times | The identification performance of PCA + LDA (R2 = 0.9472, RMSE = 0.7618) was better than PCA (R2 = 0.9262, RMSE = 0.8238) and LDA (R2 = 0.9086, RMSE = 0.8952). | PEN3 | PCA, LDA, PCA + LDA | [115] Wu, S.Y. |
| Panax quinquefolium L. in different storage times | The identification rate 89.76% of ten-folds cross validation showed that the E-nose system could also identify Panax quinquefolium L. samples with different storage time. | FOX 3000 | ANN | [116] Zou, H.Q. |
© 2017 by the authors. Licensee MDPI, Basel, Switzerland. This article is an open access article distributed under the terms and conditions of the Creative Commons Attribution (CC BY) license (http://creativecommons.org/licenses/by/4.0/).
Share and Cite
MDPI and ACS Style
Zhou, H.; Luo, D.; GholamHosseini, H.; Li, Z.; He, J. Identification of Chinese Herbal Medicines with Electronic Nose Technology: Applications and Challenges. Sensors 2017, 17, 1073. https://doi.org/10.3390/s17051073
AMA Style
Zhou H, Luo D, GholamHosseini H, Li Z, He J. Identification of Chinese Herbal Medicines with Electronic Nose Technology: Applications and Challenges. Sensors. 2017; 17(5):1073. https://doi.org/10.3390/s17051073
Chicago/Turabian StyleZhou, Huaying, Dehan Luo, Hamid GholamHosseini, Zhong Li, and Jiafeng He. 2017. "Identification of Chinese Herbal Medicines with Electronic Nose Technology: Applications and Challenges" Sensors 17, no. 5: 1073. https://doi.org/10.3390/s17051073
Note that from the first issue of 2016, this journal uses article numbers instead of page numbers. See further details here.